Article

Effect of Pyrolysis Temperature on Copper Aqueous Removal Capability of Biochar Derived from the Kelp Macrocystis pyrifera

by
Matías Araya
1,2,3,4,
Jorge Rivas
1,2,3,4,
Graciela Sepúlveda
1,2,
Camila Espinoza-González
1,2,
Sebastián Lira
5,
Andrés Meynard
1,2,3,4,
Elodie Blanco
6,7,
Nestor Escalona
6,7,
Rosanna Ginocchio
3,8,
Elizabeth Garrido-Ramírez
1,5,* and
Loretto Contreras-Porcia
1,2,3,4,*
1
Departamento de Ecología y Biodiversidad, Facultad de Ciencias de la Vida, Universidad Andres Bello, Santiago 8370251, Chile
2
Centro de Investigación Marina Quintay (CIMARQ), Facultad de Ciencias de la Vida, Universidad Andres Bello, Quintay 2531015, Chile
3
Center of Applied Ecology and Sustainability (CAPES), Santiago 8331150, Chile
4
Instituto Milenio en Socio-Ecología Costera (SECOS), Santiago 8370251, Chile
5
Centro de Investigación para la Sustentabilidad (CIS), Facultad de Ciencias de la Vida, Universidad Andres Bello, Santiago 8370255, Chile
6
Departamento de Ingeniería Química y Bioprocesos, Escuela de Ingeniería, P. Universidad Católica de Chile, Santiago 7820436, Chile
7
ANID–Millennium Science Initiative Program-Millennium Nuclei on Catalytic Process towards Sustainable Chemistry (CSC), Santiago 7820436, Chile
8
Facultad de Agronomía e Ingeniería Forestal, P. Universidad Católica de Chile, Santiago 7820436, Chile
*
Authors to whom correspondence should be addressed.
Appl. Sci. 2021, 11(19), 9223; https://doi.org/10.3390/app11199223
Submission received: 27 July 2021 / Revised: 28 September 2021 / Accepted: 29 September 2021 / Published: 3 October 2021
(This article belongs to the Special Issue Biochar: Preparation and Surface Adsorption Applications)

Abstract

:
Seaweed biochar is an efficient alternative bioadsorbent for Cu2+ removal due to its low cost and heavy metal removal capacity. Using the slow pyrolysis process, we produced biochars from Macrocystis pyrifera at 300 (BC300), 450 (BC450), and 600 °C (BC600). The physicochemical and structural properties of the biochar samples improved with increasing pyrolysis temperature from 300 to 450 °C, whereas no significant differences were observed with further increases in temperature to 600 °C. The yield ranged between 49% and 62% and had a high ash content (57.5–71.1%). BC450 and BC600 presented the highest surface areas and higher porosities. The FTIR spectra indicated that an increase of temperature decreased the acidic functional groups due to depolymerization and the dehydration processes, increasing the aromatic structures and the presence of calcium carbonate. The fittings of the kinetic models were different for the BCs: for the BC450 and BC600 samples, the Cu2+ adsorption was well-represented by a pseudo-first-order model; for BC300, a better fit was obtained with the pseudo-second-order model. The rate-limiting step of Cu2+ adsorption on BCs was represented by both models, liquid film diffusion and intraparticle diffusion, with surface diffusion being more important in BC300 and BC600, and intraparticle diffusion in BC450, in agreement with the pore size of the biochar samples. The adsorption isotherms of all BCs showed Langmuir behavior, representative of a chemisorption process, which was corroborated by the energy adsorption values determined by the D–R model. The maximum monolayer Cu2+ adsorption capacities were 93.55 and 58.0 mg g−1 for BC600 and BC450, respectively, whereas BC450 presented the highest affinity. Other mechanisms involved in controlling heavy metal removal from aqueous suspensions using these seaweed biochars remain to be explored. We conclude that BC450 and BC600 from M. pyrifera are the most efficient adsorbents for Cu2+ aqueous removal and are thus an appropriate alternative for bioremediation.

Graphical Abstract

1. Introduction

Anthropogenic inputs of heavy metals into the environment pose a serious threat to humanity and ecosystems worldwide due to their toxicity, persistence, and bioaccumulation [1,2]. Heavy metals, which are some of the most serious pollutants, derive from both industrial sources and domestic discharge, affecting environmental quality and human health [3]. As humans feed at the highest trophic level, and as heavy metals are biomagnified along the food web, humans are more likely to suffer serious health complications [3]. The main sources of heavy metal pollution in water and soils are industrial wastes, agricultural pesticides and fertilizers, and domestic wastewater [2,3,4,5].
Among the heavy metals, copper is a relevant environmental pollutant released from diverse anthropogenic sources, such as industrial and mining activities, combustion processes, the production and use of phosphate-based fertilizers, and domestic wastewater discharge. There are also some important natural copper sources, such as plant decomposition, volcanic activity, and wildfires, which increase the copper concentration in different abiotic matrices [3]. Copper uptake in humans primarily occurs from the ingestion of polluted food and water, mostly in the form of Cu2+. It is mainly absorbed by the small intestine and, to a lesser extent, by the stomach, where it may cause gastrointestinal diseases [5]. An excess of copper is toxic due to its displacing other metallic cofactors [5].
Different technologies have been developed to control and remove excess amounts of heavy metals from wastewater, such as chemical precipitation, electro-coagulation, solvent extraction, bioremediation, recovery by evaporation, membrane filtration, and adsorption by activated carbon or biomaterials [3]. Among these, adsorption methods are widely used as they offer many advantages due to the wide variety of adsorbent materials available [6].
In recent years, considerable attention has been paid to the use of biochar as an adsorbent for heavy metal removal, as it is less expensive, more efficient, and more environmentally friendly than alternative materials [7]. Biochar is a solid material composed of a carbon matrix with a highly porous structure, which, depending on the production conditions, could result in an extensive surface area, acting as a surface sorbent [8]. In addition to its low cost, biochar has other productive advantages, such as high availability and mechanical stability, and so could play an important role in the environmental control and removal of pollutants [8,9].
Biochar is produced by pyrolysis, a process consisting of the thermal decomposition of organic biomass under limited oxygen conditions at temperatures ranging from 350 to 900 °C [7,10]. The relevant operation parameters of pyrolysis are the temperature and residence time, as it is these which directly influence the physical and chemical properties of the final product [7,8]. The properties of biochar also depend on the nature of the raw materials used [11,12]. For example, seaweed biomass is considered a promising raw material for biochar production due to its wide distribution, rapid growth, and high efficiency for carbon dioxide (CO2) fixation [13]. The cultivation of algae allows atmospheric carbon dioxide to be sequestered, reducing greenhouse effects [14]. However, characterizations of the physical and chemical properties of seaweed biochar remain scarce even though these are crucial for determining its potential application as a bioadsorbent in aqueous solutions.
The scarce available information indicates that the physicochemical properties of seaweed biochar include high concentrations of various trace elements, such as phosphorus (P), potassium (K), magnesium (Mg), and calcium (Ca), as well as the presence of key functional groups (e.g., carboxyl, hydroxyl, and phenolic groups) [15,16]. These characteristics could make seaweed biochar a potential alternative for Cu2+ adsorption in waste or drinking waters. Studies have identified seaweed biochar that has higher-efficiency heavy metal removal compared with those derived from terrestrial biomass, e.g., [9,15]. Specifically, Poo et al. [17] determined that the adsorption capacity of Cu2+ from biochar generated from seaweed (Saccharina japonica and Sargassum fusiforme) was 11 times higher compared to a pinewood sawdust biochar. In this scenario, seaweed biochar may be a more viable alternative as a bioadsorbent for Cu2+ removal from aqueous systems [9,18].
Macrocystis pyrifera is a brown alga (a kelp species) which can grow to considerable size in a wide range of environmental conditions [19]. The fronds may reach a maximum growth rate of 50 cm day−1, which provides a considerable advantage in terms of yield [19]. This species has a higher capacity to accumulate heavy metals compared with the other brown seaweed species studied [20]. Considering the above characteristics, we postulated that M. pyrifera presents several advantages to produce biochar and its application as a bioadsorbent. Therefore, our aims in this study were to (i) produce biochar from M. pyrifera at different pyrolysis temperatures and to compare their physicochemical and structural properties, and (ii) determine their Cu2+ adsorption capability in aqueous systems using kinetic studies and adsorption isotherms.

2. Materials and Methods

2.1. Chemicals and Reagents

All chemicals used were of analytical grade. As a source of metal, copper (II) nitrate trihydrate, purchased from Merck (Darmstadt, Germany) was used. The stock solution of Cu2+ was produced by dissolving 3.8 g of Cu(NO3)2·3H2O in 1000 mL of deionized water (18.2 MΩ cm resistivity), obtained from a MilliQ water system (Simplicity® Millipore UV, France). Solutions of varying concentrations were produced by diluting the stock solution.

2.2. Sample Collection and Pyrolysis Conditions

M. pyrifera biomass was obtained from two Management and Exploitation areas for Benthic Resources (MEABRs) located in the Valparaíso Region, central Chile (32°38′ S 71°26 W; 32°42′ S 71°29 W). The collected biomass was washed with tap water and then air-dried, according to [10]. The dried biomass was manually ground, passed through a 20 mm sieve, and pyrolyzed in batches of 1.5 kg.
The pyrolysis was conducted in a reactor at the Waste and Bioenergy Management Center (Universidad de la Frontera, Chile) at a heating rate of 3 °C min−1, from room temperature to the selected final temperatures of either 300 (BC300), 450 (BC450), or 600 °C (BC600). A residence time of 1 h under a constant N2 flow of 4 L min−1 was used for cooling to room temperature. The obtained biochars were ground to pass through a <2 mm sieve, dried at 40 °C for 12 h, and stored at room temperature for further assays.

2.3. Physicochemical Characterization of Biochar

The textural properties of the biochar samples obtained at different pyrolysis temperatures were determined from N2 adsorption–desorption isotherms at 77 K with a 3Flex Micromeritic Equipment (see Figures S1–S3 in the Supplementary Material). Prior to analysis, the sample were degassed for 4 h at 573 K using a SmartVacPrep device (Micromeritics). The Brunauer–Emmett–Teller (BET) method [21] was used to calculate the specific surface area (SBET), whereas the pore size distribution was determined by the desorption branch using the Barrett–Joyner–Halenda (BJH) method [22]. The total pore volume was determined from the adsorbed quantity at a p/p0 of 0.99. To study the surface morphology, a sputter-coated gold film was used to increase the signal and resolution of the biochar samples. The surface morphology was examined by scanning electron microscopy (SEM) using a Tabletop Microscope TM3000 (Hitachi, Japan).
The carbon (C), hydrogen (H), and nitrogen (N) contents of the biochar samples were analyzed before and after the metal adsorption assays using an elemental analyzer (EURO EA 3000 CHNS-O, Eurovector, Italy). With the H and C contents, the H:C molar ratio was calculated. The ash and organic matter contents were obtained following the ASTM D1762-84 and TMECC 05.07-A methods, respectively. Fourier transform infrared spectroscopy (FTIR) was used to characterize the surface functional groups of the raw seaweed biomass and the seaweed biochars. The FTIR measurement was performed by an infrared spectrophotometer (ALPHA FT-IR-ATR model, Bruker, USA), recording the spectral range of 400–4000 cm−1.
The cation exchange capacity (CEC) was determined by saturation of the samples with a cation solution (Ca2+, Mg2+, Na+, and K+) according to the modified AOAC method [23]. We mixed 5 g of biochar with 50 mL of 1 mol L−1 CH3COONH4 at pH = 7. The solution was stirred for 30 min at 180 rpm and 25 °C in a reciprocal shaker. Then, 1 mL of the filtered suspension was mixed with 9 mL of Lanthanum (La) 10 g L−1 (as a suppressing agent). The final sample was measured by FAAS for Ca2+ and Mg2+, and by atomic emission for Na+ and K+ with an AA-7000 spectrophotometer (Shimadzu, Japan). The electric conductivity (EC) (Orion Star A212) and pH (pH/ORP meter, Hanna Instruments) of the BCs were measured in 1:20 dilute suspensions of biochar sample/DI water, with an equilibrium time of 1.5 h, according to the Standardized Product Definition and Product Testing Guidelines for Biochar that is Used in Soil (IBI-STD-2.1, 2015; http://www.biochar-international.org/characterizationstandard, accessed on February 2021). Finally, the point of zero charge (pHpzc), at which the number of negative sites is equivalent to the number of positive sites (total external and internal charge of the particles is zero), was obtained according to the process described in [24].

2.4. Adsorption Studies of Cu2+

Three experimental replicates were used to assess the sorption kinetics of Cu2+ on biochar samples produced at different temperatures (BC300, BC450, and BC600), using a series of 50 mL centrifuge tubes (batch mode) prepared with a suspension of 1 g L−1 biochar and 125 mg L−1 Cu2+ solution. The resulting suspension was stirred during the complete duration of the experiment at room temperature (23 ± 2 °C), and 10 mL was sampled (filtered at 0.45 µm) after 0.5, 1, 2, 4, 6, 12, and 24 h (0–1440 min) of suspension preparation. We obtained the Cu2+ adsorption isotherms for the different biochar samples, from initial concentrations of Cu between 0 to 100 mg L−1 and a biochar concentration of 1 g L−1. The suspension of the mixture was stirred for 24 h at room temperature (22–25 °C) until sorption equilibrium was reached, and then filtered at 0.45 µm. These conditions were determined based on the results obtained in the kinetic experiments. The Cu2+ content was analyzed by flame atomic absorption spectroscopy (FAAS) at 324.7 nm using an AA-7000 spectrophotometer (Shimadzu, Japan) after filtering (0.45 µm) and diluting the samples in 5% HNO3.

2.5. Statistical Analyses

For the parameters analyzed regarding the physicochemical characteristics of the biochar, ANOVA analyses were conducted to determine the significant differences using Tukey’s a posteriori test. All statistical analyses were performed using R statistical software (version 1.1.463–2009–2018 RStudio, Inc., Boston, MA, USA.) [25].

3. Results and Discussion

3.1. Effect of Pyrolysis Temperature on Biochar Yield and Physicochemical Characteristics

3.1.1. Yield and Ash Content of the Biochar Samples

The biochar yield obtained decreased from 62.1% to 48.8% with increasing pyrolysis temperature (Table 1). This tendency is consistent with that observed in other studies; however, the weight loss at each pyrolysis temperature differs according to the source material [15,17,26]. During production, two decomposition events occur: the first step is carbohydrate decomposition (180–270 °C) and is followed by protein degradation (320–450 °C) [27].
In this temperature range, an exothermic carbonization process occurs by the decomposition of inorganic matter into metallic carbonates, generating considerable weight loss [28]. From 450 °C upward, the process of the volatilization of organic and inorganic matter continues, but at a slower rate [27,28,29]; this explains the similarity in the yield of BC450 and BC600.
In general, biochar production from seaweeds is greater than that from lignocellulosic materials [12,17,27], and this provides an economic advantage. The biochar generated from M. pyrifera showed a higher yield compared to other algal biochars [12,15,27], which could be related to its high content of ash (57.5–71.1%) (Table 1) and the difference in the pyrolysis operating conditions (i.e., the rate of pyrolysis temperature increase). Although a high ash content is characteristic of brown algae [30], the content generated in this study was even higher due to the absence of an intensive washing pretreatment or deashing post-treatment given the prioritization of productivity for commercial purposes.

3.1.2. pH, pHPZC, EC, and CEC of the Biochar Samples

The pH, pHPZC, and EC of the studied biochar samples increased with the pyrolysis temperature, as shown in Table 1. This agrees with reports that correlated the ash content with the pH and EC values [7,16]. For EC, values between 25.7 and 28.1 dS m−1 were registered (Table 1), which are, as expected, considerably higher than for other types of biochar [12].
All studied biochar samples had a basic pH (9.8–11.8) (Table 1). This agrees with previous reports showing that the pH of biochar derived from seaweeds varied from 7.6 to 13.7 [26]. The pH increased with the pyrolysis temperature and the content of typical alkaline salts of seaweeds [31]; in the same context, pHPZC also increased with the pyrolysis temperature (Figure S4). In addition, above 300 °C, alkaline salts began to separate from the organic matrix and were converted into hydroxides, increasing the pH [12,17,26]. Conversely, under severe pyrolysis conditions (related to high treatment temperature and residence time), the amount of carboxyl groups in BCs decreases and/or the acidic groups were deprotonated to the conjugated bases, generating a more alkaline pH [11].
Interchangeable cations, such as Ca2+, Mg2+, K+, and Na+, were found in the seaweed biochar, which may confer an enhanced adsorption capacity, thus playing a fundamental role in the adsorption mechanism of biochar on pollutants [16]. For the biochar samples in this study, BC450 had the highest CEC value (40.2 cmol kg−1), followed by BC600 (35.0 cmol kg−1) and BC300 (34.7 cmol kg−1) (Table 1). This indicates that BC450 could have a higher presence of functional groups that contain oxygen (such as carboxylic, lactonic, and phenolic groups), which could increase the adsorption capacity [12]. The presence of certain interchangeable cations (e.g., Ca2+) was corroborated with the representative peaks found in the FTIR for all BCs (see below). The types of functional group (carboxylic, lactonic, or phenolic groups) can be determined by a titration method [32], which was not considered in this work.

3.1.3. Elemental Composition of Biochar Samples

The high ash content in the algal biomass was also reflected in the elemental content of the biochar, identified primarily in the total carbon content (Table 1). In general, an increase in the pyrolysis temperature generated an increase in the carbon content and decreases in the total hydrogen and nitrogen contents [15,17]. However, in our study, we only found a negative relationship between the pyrolysis temperature and the N content of biochars, which decreased from 3.15% to 1.58% with increasing temperature (Table 1).
The degree of carbonization (H:C = 1.51) of the BC450 sample was lower than that of the other biochar samples (Table 1), likely due to a higher hydrogen content, lower carbon content, and higher presence of alkaline metal hydroxides. During the pyrolysis process, the greatest mass loss occurred between ~200 and ~350 °C (depending on the pyrolysis rate), where organic C slowly volatilized in the form of CO and CO2, thus decreasing the organic matter content and increasing the percentage of inorganic matter [12,29]. Then, this inorganic matter entered a carbonization process, where alkaline metal hydroxides and/or metal carbonates are formed [17,30]. Above ~350 °C, a slower decomposition of stable organic and inorganic matter occurs, forming metal oxides that can become part of the aromatic structure of the biochar or be volatilized [17,27,30].

3.1.4. Surface Morphology of Biochar Samples

The specific surface area usually has a direct relationship with the pyrolysis temperature and the adsorption capacity with different contaminants, but this is not always the case, e.g., [17]. An increase in the surface area with increasing pyrolysis temperature is expected; however, in some cases, high temperatures result in the collapse of the biochar structure due to the porosity generated by the volatilization of various compounds [16,33]. In the present study, the specific surface area increased from 2 to 4 m2 g−1 for BC300 and BC450, respectively; however, an increase in the pyrolysis temperature from 450 to 600 °C did not improve the surface area, which remained constant (Table 2). Similarly, the main increase in the pore volume was observed between 300 °C and 450 °C. As was previously mentioned, above 350 °C, the process of decomposition of organic and inorganic matter occurs more slowly, which could explain the minimal difference in the structural properties of BC450 and BC600.
Overall, these values are lower compared to other seaweed biochar [17], which could be explained by the high ash content obtained here, as this is indirectly correlated with the surface area [11,33]. Finally, the SEM analysis of the surface of the biochar samples (Figure 1) showed a very porous structure for the BC450 sample, with a smaller pore size (12.4 nm), compared to the larger pores registered for the BC300 and BC600 samples (18.1 and 19.9 nm, respectively) (Table 2). Considering the pore size value and the isotherm type IV with an H3 hysteresis loop, all BCs are related to slit-like mesoporous materials (Figures S1–S3) [34].

3.1.5. Identification of Functional Groups of Biochar Samples

The FTIR spectra analysis (Figure 2, Table 3) showed diverse functional groups on the surface of the M. pyrifera biochar samples, and these may be involved in Cu2+-biochar adsorption. However, considering the large amount of ash in the samples, this finding must be considered with caution, as some of the functional groups could be shared and/or masked by inorganic compounds. Some characteristic peaks of CaCO3 coincide with those obtained when analyzing other BCs from seaweeds and other raw materials with a high ash content [35].
The spectrum of the biochar samples presented, in general, three distinctive peaks at ~1440, ~870, and ~700 cm−1, similar to carbonate compounds (e.g., calcium, magnesium, and potassium carbonates, amongst others) [39,40] (Figure 2, Table 3). Several studies indicated that with an increase in temperature, some surface functional groups decreased and, therefore, were not detected in the FTIR spectrum, e.g., [41]. This was observed for the bands at 2920, 1558, and 3400 cm−1, which disappeared with increasing pyrolysis temperature (Figure 2), indicating the breakdown of bonds, such as the –CH2 of fatty acid hydrocarbon chains, the C=C bond of secondary aromatic amines, and –OH groups, respectively [16,31,41], which can be attributed to the depolymerization and dehydration process [42]. An increase in C=C aromatic stretching band intensity was expected due to the aromatization process as a consequence of the increase in pyrolysis temperature [42], which was observed in the range of 1414–1444 cm−1; however, this band could also be overlapped by carbonate compounds due to the high ash content in the biochar samples.
In the thermal conversion process, more oxygenated carbon groups (e.g., –COOH and –CHO, amongst others) were retained, and when the temperature increased, the compounds with carboxyl groups were reduced and the carboxylic groups were deprotonated, generating a more alkaline solution [11]. Therefore, at higher temperatures, a material with a surface composed mainly of oxygen and carbon could be expected, in addition to minerals or inorganic compounds [27,35].

3.2. Adsorption Isotherms of Biochar Samples

The obtained equilibrium data were fitted with two parameter linearized forms of isotherms, including Langmuir (Equation (1)), Freundlich (Equation (2)), Dubinin–Radushkevich (D-R) (Equation (3)), and Temkin (Equation (4)) [43] isotherms. The Langmuir isotherm model assumes monolayer adsorption onto a limited number of active sites, each of which can accept only one adsorbate particle. This model also assumes energetic equivalence between active sites and no interactions between the adsorbate particles [18].
The Freundlich isotherm model is based on a multilayer, reversible, and non-ideal adsorption process, and there is no limit on the number of adsorbates that can be adsorbed [18]. The Freundlich isotherm model defines the heterogeneity of the surface as well as the exponential distribution of the active sites and their energies.
The D–R isotherm model is used for expressing the mechanism of adsorption with the distribution of Gaussian energy onto the heterogeneous surface. Unlike the Langmuir and Freundlich isotherm models, this is a semi-empirical equation in which the adsorption follows the pore-filling mechanism [43].
Finally, the Temkin model considers the interaction between the adsorbent and adsorbate, and assumes that the adsorption heat, as a function of the temperature of all molecules existing in the layer, declines linearly rather than logarithmically due to the surface coverage increase [43]. The model equations are presented below:
C e q e = 1 k L q m + C e q m
log q e = log k F + 1 n log C e
ln q e = ln q m k D R ε 2
q e = R T b T   L n   a T + R T b T   L n   C e  
where Ce is the Cu2+ concentration at reaction equilibrium (mg L−1), qe is the amount (mg L−1) of Cu2+ adsorbed by the BCs at the equilibrium time, qm is the maximum adsorption capacity (mg g−1), and kL (L mg−1) is the Langmuir constant of equilibrium (calculated from the graph of Ce qe1 vs. Ce). With Langmuir’s constant, it is possible to calculate the RL equilibrium factor, which determines the type of adsorption (Equation (5)). KF is the Freundlich constant of adsorption coefficient (L g−1) and n−1 (L mg−1) is a constant that defines the intensity of the adsorption on the surface heterogeneity. kDR (mol2 J−2) is the D–R constant related to the sorption energy, which allows estimation of the sorption energy E (kJ mol−1) from Equation (6); Ɛ is the Polanyi potential, calculated from Equation (7), where R (8.314 J mol−1 K−1) is the gas constant, T (K) is the absolute temperature, and Cs (mg L−1) is the solubility of Cu2+ (from the salt Cu(HNO3)2 × 3H2O) at 23 °C. Finally, for the case of the Temkin isotherm, aT (L mg−1) is the equilibrium binding constant, and bT (J g mol−1 mg−1) is the Temkin constant related to the adsorption heat. The equations are as follows:
R L = 1 1 + k L C 0
E = 1 2 k D R
ε = R T   ln C s C e
The comparison of the analyzed isotherm models for several BCs is shown in Figure 3, and the parameters obtained are presented in Table 4. The obtained correlation coefficients suggest that the Langmuir model fits the experimental data better than the other models (R2 = 0.994–0.999) (Figure 3, Table 4), indicating a predominantly homogeneous monolayer surface coverage process of Cu2+ on the BCs, characteristic of chemical adsorption, considering the copper concentrations used [44]. Although by FTIR a heterogeneous composition of the functional groups composing the surfaces of the BCs was observed, the adsorption process on each of these different groups can be comparable and therefore assume a homogeneous behavior. The monolayer adsorption capacity (qm) was the highest for BC600 (93.55 mg g−1), followed by BC450 (58.00 mg g−1) and BC300 (49.24 mg g−1). The KL parameter indicates the affinity to the adsorption sites, and, in this sense, BC300 presented the greatest affinity, followed by BC450 and BC600 (23.50, 10.91, and 0.373 L mg−1, respectively). The equilibrium separation factor RL obtained in this work suggests a favorable adsorption process (0 < RL < 1) [43] for all BCs used for Cu2+ adsorption (Table 4).
The value of the mean free energy required for adsorptive removal (E) was obtained from the D–R isotherm model [43]. When the value of E ranges between 8 and 16 kJ mol−1, the process is by ion exchange; E > 16 kJ mol−1 is indicative of a chemical adsorption process [45]. In this context, the E value for BC600 indicated an ion exchange process, whereas for BC450 and BC300, the values were 17.83 and 19.99 kJ mol−1, respectively, suggesting a chemical adsorption process. In this context, it could be expected that an increase in temperature promotes a higher amount of retained copper assuming a prominent chemical adsorption in the process [46]. Conversely, the Temkin isotherm presented a higher correlation coefficient for Cu2+ adsorption on BC600 (R2 = 0.991), which revealed that the surface of BC600 could be heterogeneous, where not all the available bonding sites would have the same adsorption capacity [47]. The best fit of both the Langmuir and Temkin isotherm models for the Cu2+ adsorption data for BC600 could be explained by the finding that although the surface consisted of heterogeneous sites, these were similar in adsorption phenomena [46], which could also explain the increased adsorption capacity of Cu2+ [48].
Due to the variation in the operational and experimental conditions used, direct comparison with other studies of biochar application for copper adsorption should be considered with caution. However, the results obtained in the present study may be comparable in terms of Cu2+ removal capacity, not considering the mechanisms for this purpose due to their different compositions and operational conditions of production. In this sense, we could conduct a comparison with the removal capacity of the biochar from Undaria pinnatifida generated by pyrolysis at 500 °C, which registered an adsorption capacity of 125.9 mg g−1 of Cu2+ [49]; from Ascophyllum nodosum, with a capacity of 223 mg g−1 [50]; and to the steam-activated biochar from Porphyra tenera, with an adsorption capacity of 75.1 mg g−1 of Cu2+ [9]. These results could also be compared with other removal results obtained [51], where biochar was generated from bovine bone, which presented a high ash content (83.8–87.8%) and was determined to have a Cu removal capacity of 72.53–83.71 mg g−1. In these cases, the pH was maintained between 4.5 and 5.5, which is contrary to our study where the pH values were variable during the adsorption experiments (i.e., <6.5); thus, the formation of other copper species in solution (such as Cu(OH)+ or Cu(OH)2) could co-precipitate on the surface of BCs [18]. Notably, when the pH of the BCs is lower or higher than the pHPZC, the solid can have a surface with a positive or negative charge, respectively (electrostatic attraction effect) [22]. Since the pH and pHPZC obtained for the BCs in this work are similar, but are different from the pH at which the Cu2+ adsorption was measured, the cation exchange mechanism would be involved in copper removal [52].

3.3. Cu2+ Removal Performance of the Biochar Sample

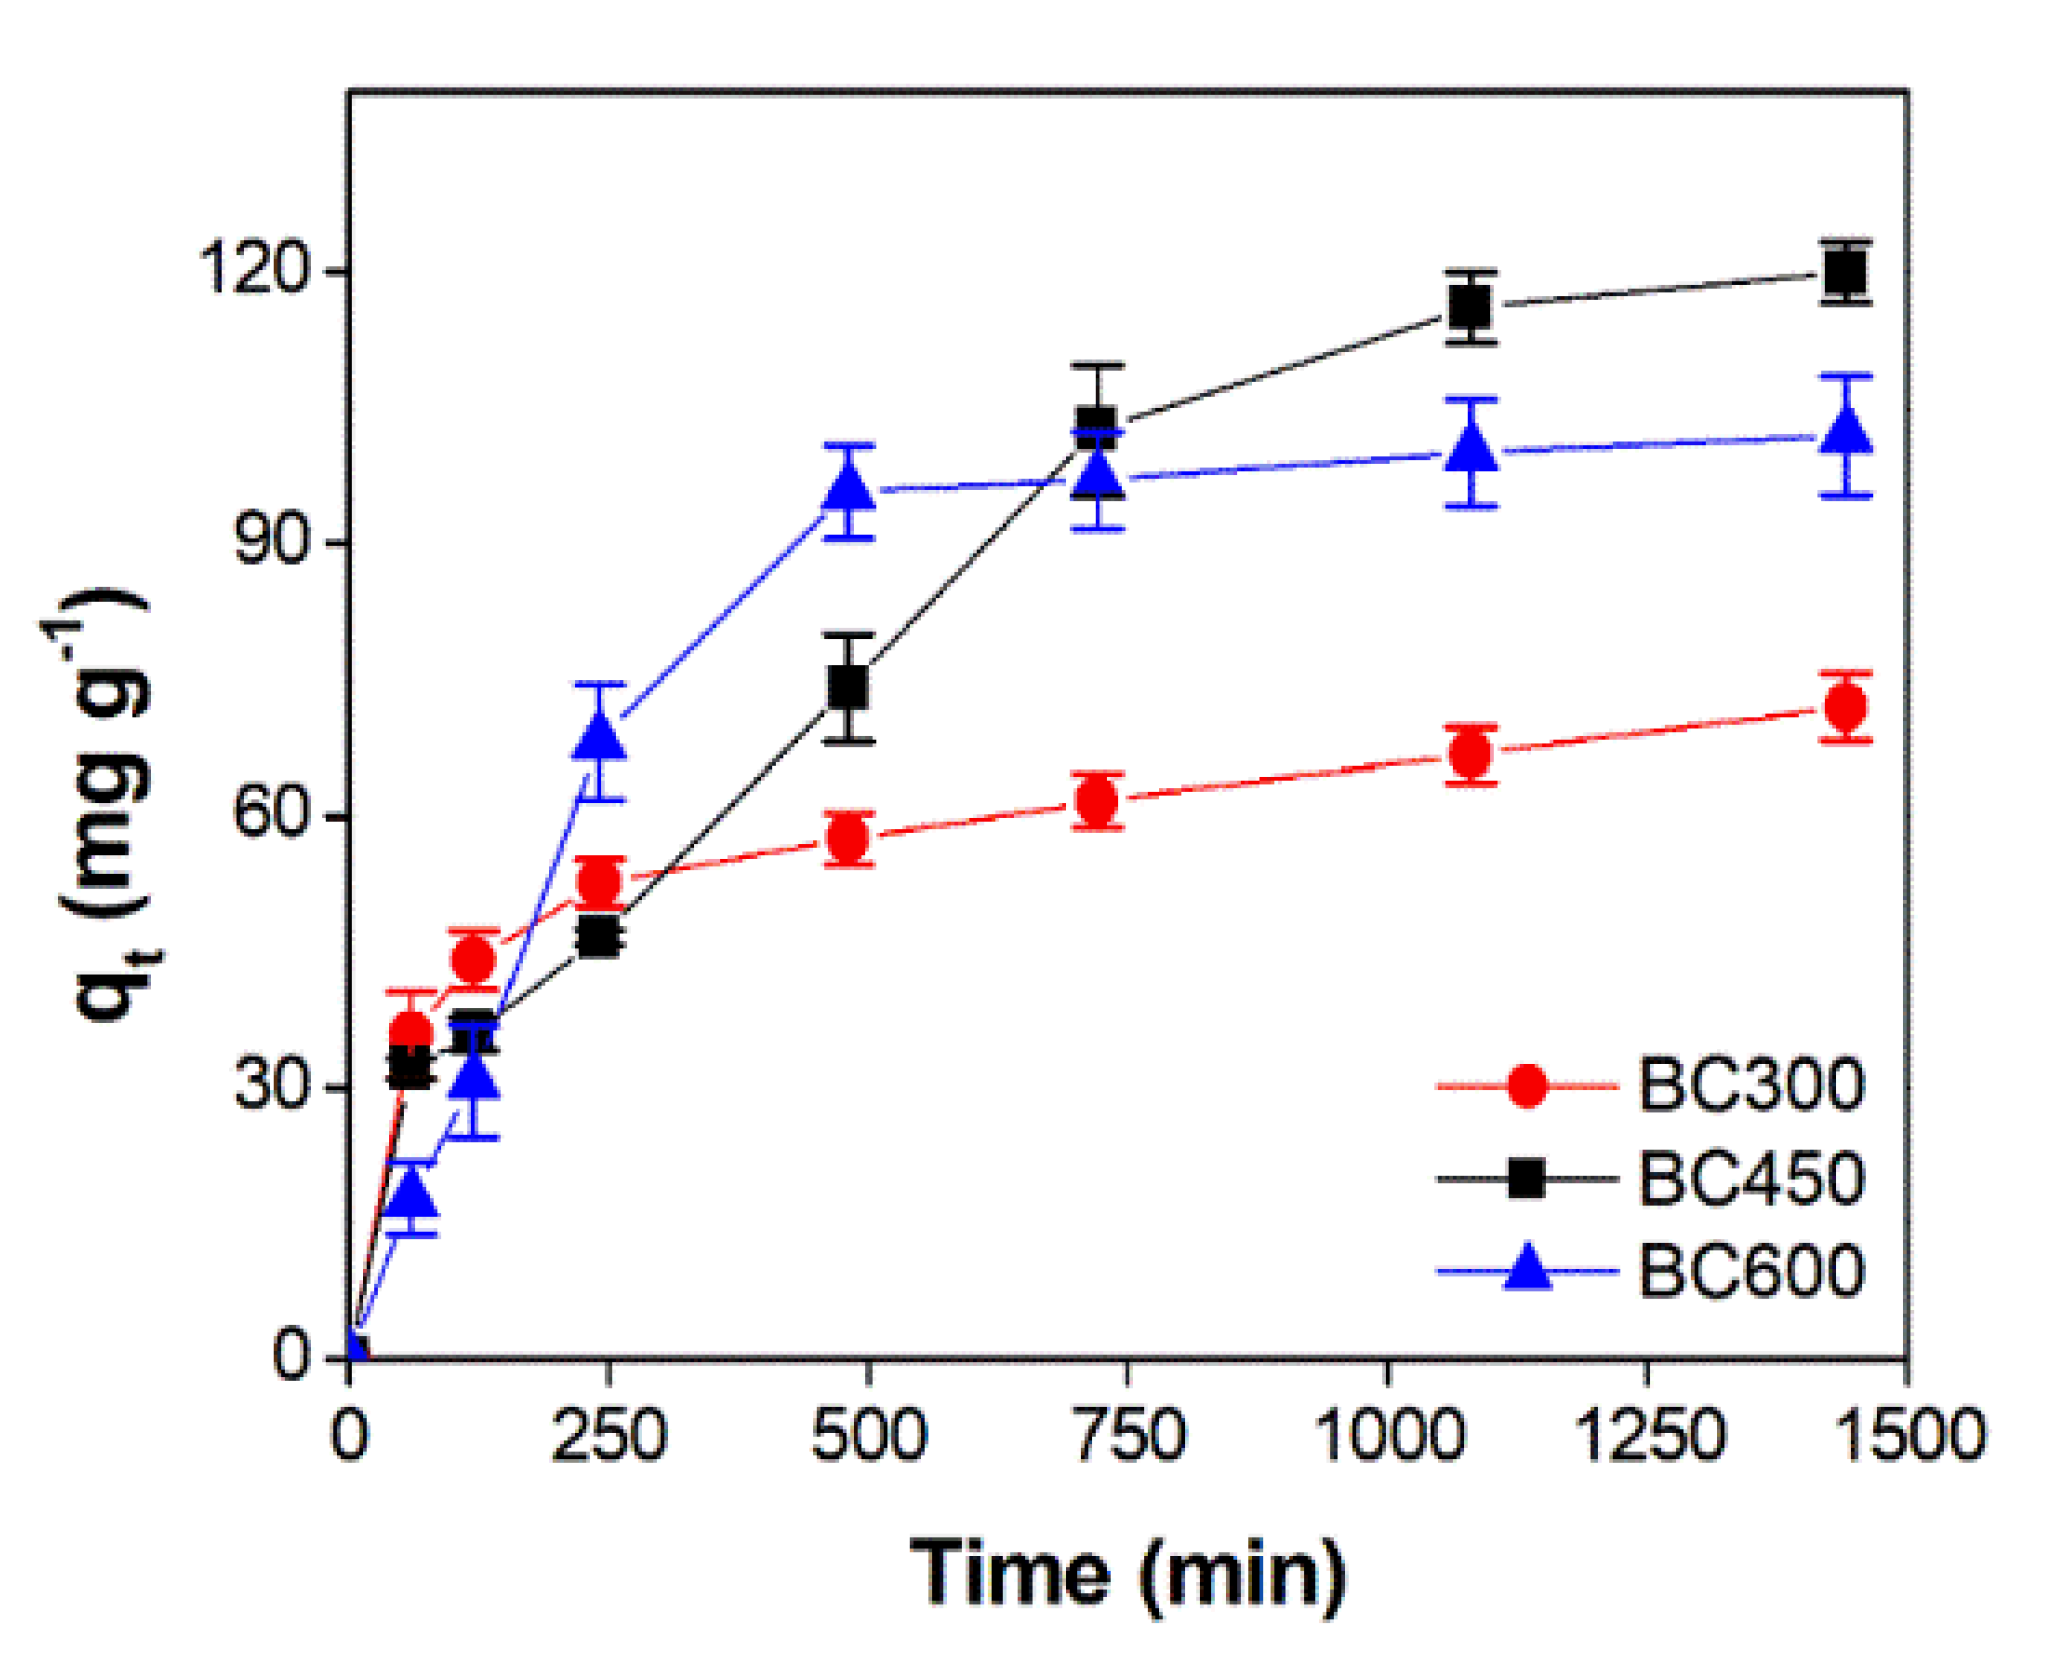
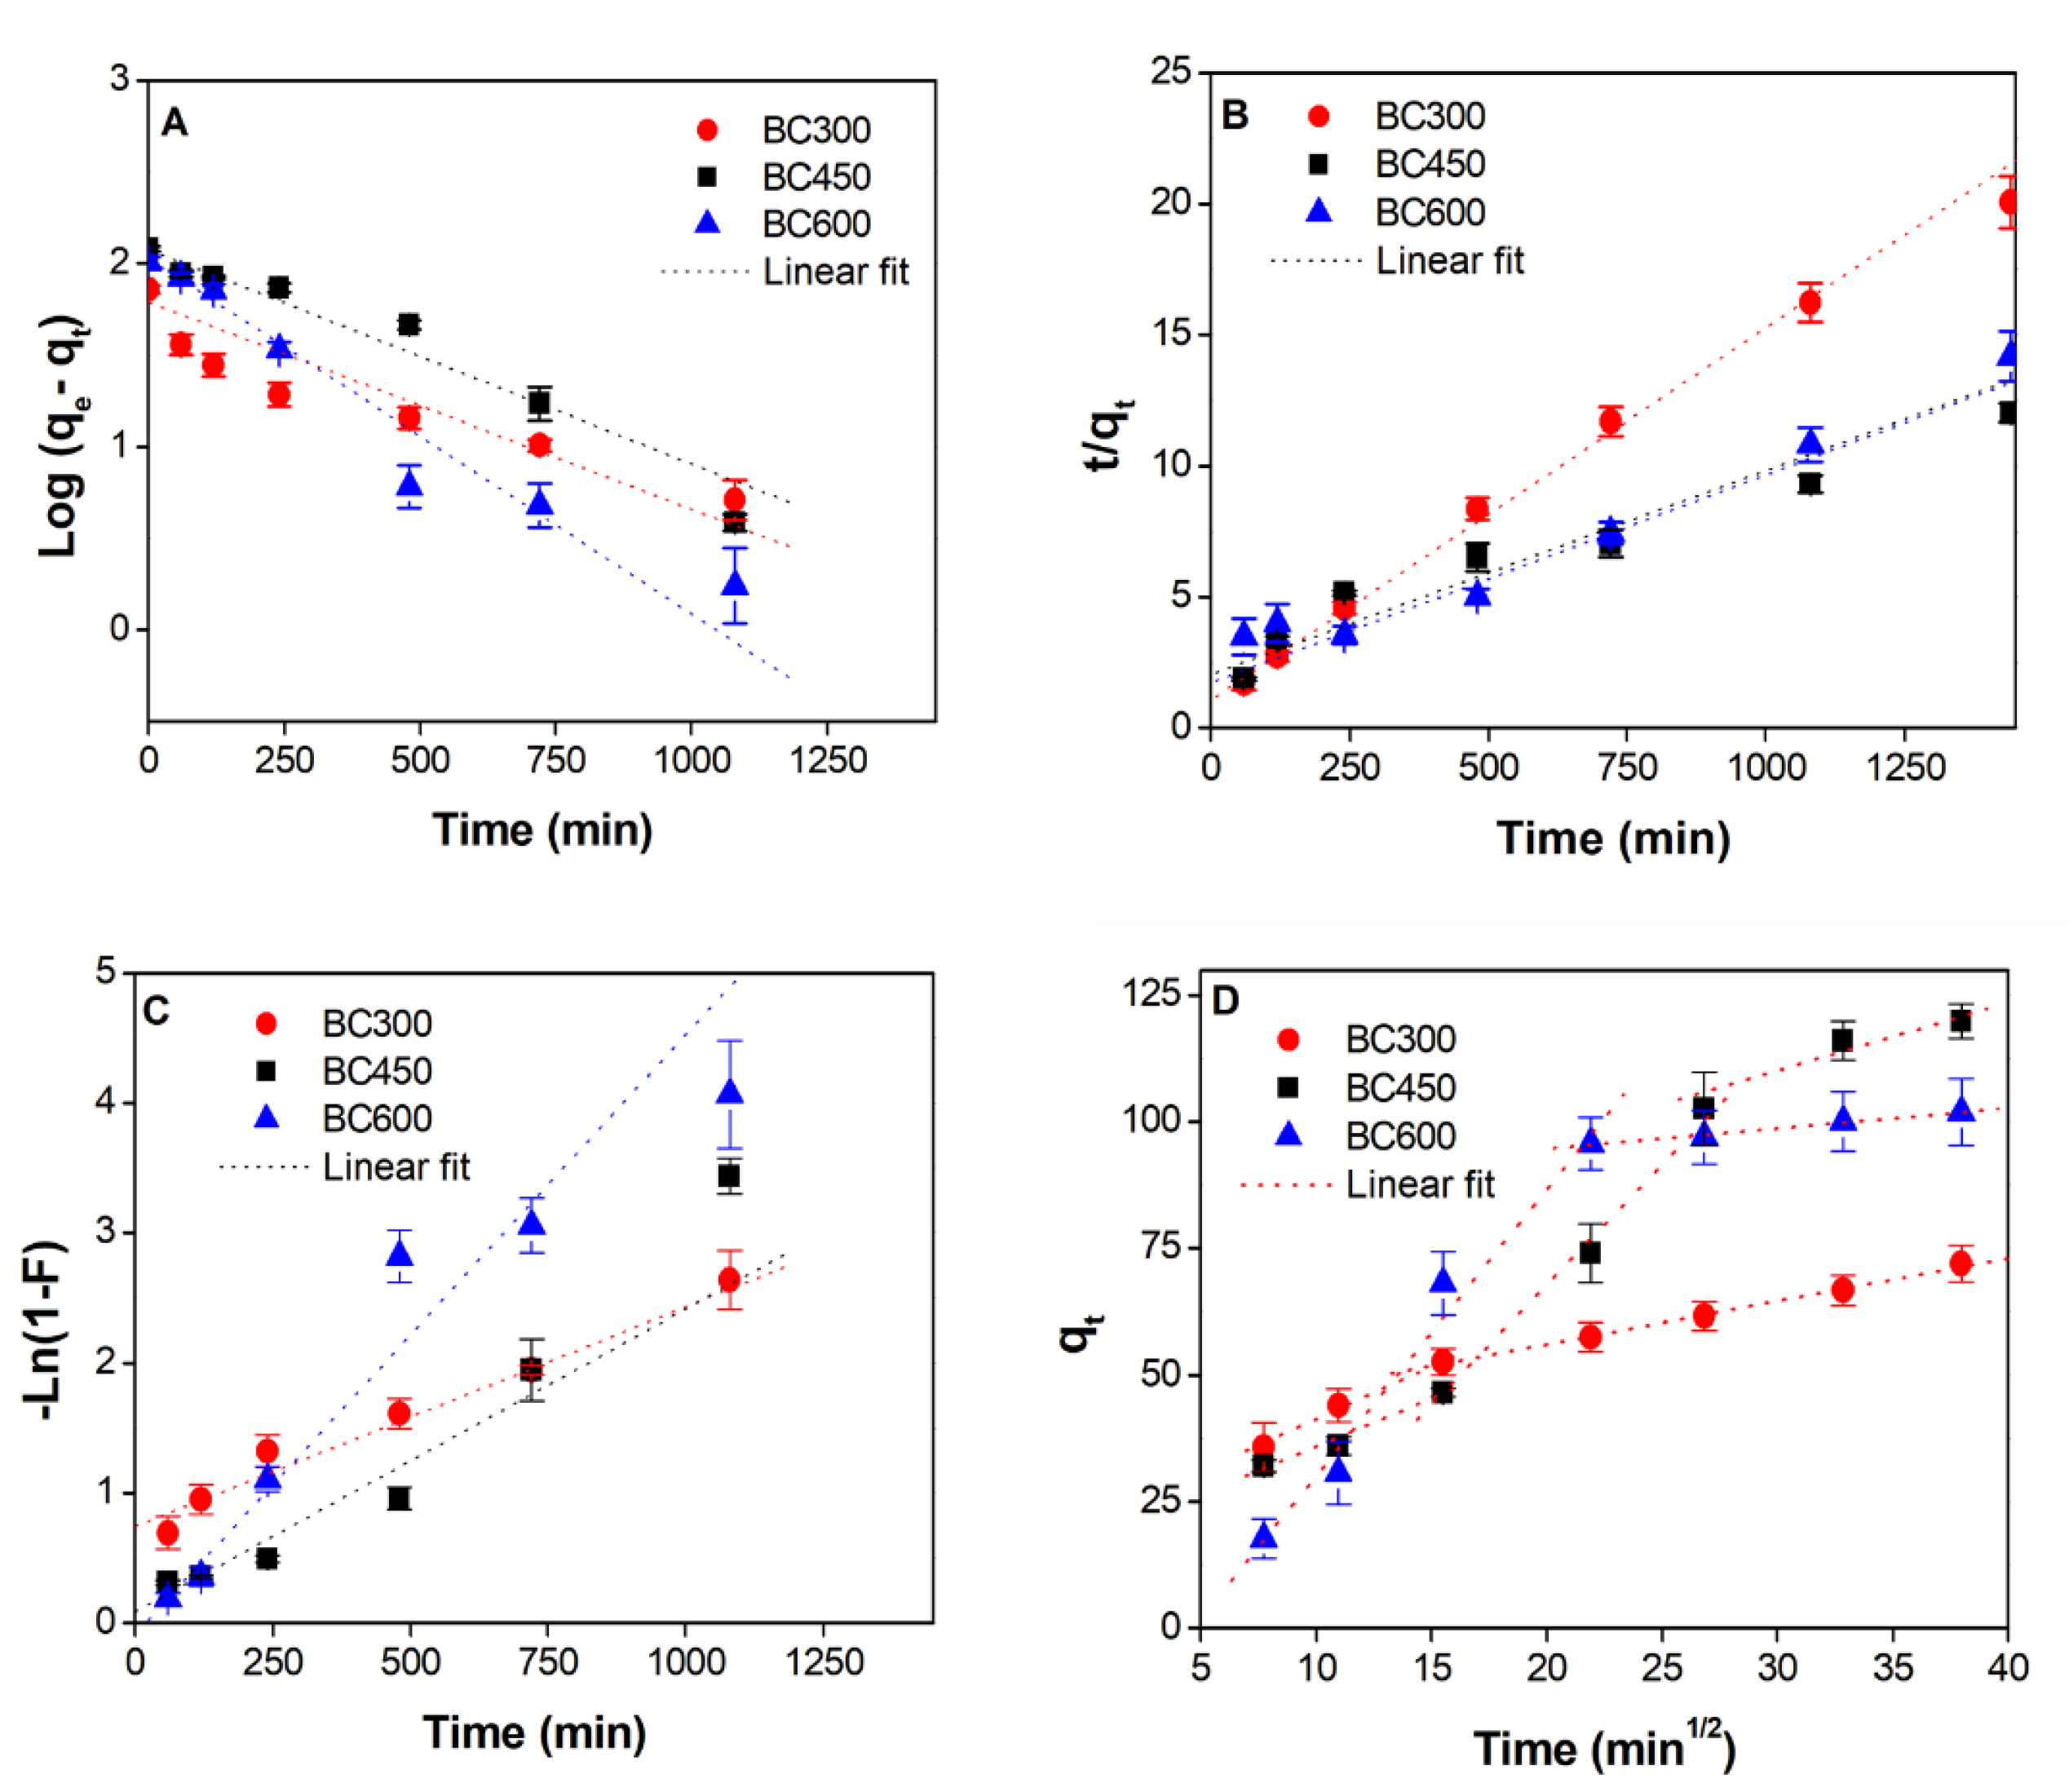
Kinetics of Cu2+ Adsorption

Figure 4 shows the adsorption kinetics of Cu2+ into the studied biochar samples. The three BCs presented saturation at different experimental times and before the final 1440 min. The order of the efficacy of Cu2+ removal at 1440 min of adsorption time was BC450 (119.9 mg g−1) > BC600 (101.9 mg g−1) > BC300 (71.91 mg g−1). This may be explained by the higher surface area and pore volume of BC450 and BC600 compared with BC300. In addition, BC450 had a higher cation exchange capacity, which would favor the adsorption compared with the other biochar samples.
To better understand the type of Cu2+ adsorption involved in the process with respect to the time and different biochar samples applied, we used a linearized form of pseudo-first-order (Equation (8)) and pseudo-second-order (Equation (9)) [53] models (Figure 5A,B and Table 5). The equations are as follows:
log q e q t = log q e k 1   t 2.303
t q t = 1 k 2 q e 2 + t q e
where qt (mg g−1) is the amount of Cu2+ adsorbed at time t, qe is the amount of Cu2+ adsorbed at equilibrium time (1440 min), k1 (min−1) is the pseudo-first-order constant, and k2 (g mg−1 min−1) is the pseudo-second-order reaction rate constant.
The results showed that the kinetics of the BC300 sample better fit the pseudo-second-order model (R2 = 0.995), whereas the experimental amount of Cu2+ adsorbed at equilibrium (qe, exp) presented a similar value with the calculated qe, which is indicative of chemical adsorption [53] (Figure 5B, Table 5). This result was corroborated when calculating the adsorption energies according to the Dubinin–Radushkevich (D–R) model and the most appropriate fit obtained for the Langmuir model (Table 4).
In contrast, we observed a linear adjustment with R2 values of 0.933 and 0.960 for the BC450 and BC600 samples, respectively, to the pseudo-first-order model (Table 5; Figure 5A). Additionally, the calculated qe is close to qe, exp (Table 5), showing that BC450 and BC600 can be represented by a pseudo-first-order kinetic model. These results may be a consequence of the structural properties of biochar samples, because BC450 and BC600 exhibited a BET surface area two times higher than that of BC300, a higher porosity, and more binding sites available for copper adsorption. In consequence, Cu2+ adsorption on BC450 and BC600 was faster than on BC300, which agrees with the pseudo-first order model which better describes the initial stage of the sorption process when rapid sorption occurs [54,55]. This is in accordance with the pseudo-first model in which the adsorption rate is proportional to the number of unoccupied sites [47,54]. On the contrary, in the case of the pseudo-second order model, the adsorption rate is proportional to the squared number of unoccupied sites [56].
Diffusion-based models were applied to assess the mechanisms of the adsorption process. The models applied were liquid film diffusion (Equation (10)) and, intra-particle diffusion (Equation (11)), as proposed by Boyd et al. (1947) [57] and Weber and Morris [53], respectively (Figure 5C,D; Table 5). The models are expressed as follows:
ln 1 F = k f d   t
q t = k i t 0.5 + C
where kfd (min−1) is the film diffusion rate constant (calculated from the graph of −ln(1 − F) vs. t), F is the fractional attainment of equilibrium (F = qt qe−1) at time t, ki (mg g−1 min 0.5) is the intra-particle diffusion rate constant (obtained graphing qt vs. t0.5), and C is a constant (mg g−1) that provides an idea regarding the thickness of the boundary layer on the adsorbent surface. Adsorption kinetics typically involve three steps [9]: (1) liquid-film transport, (2) intra-particle diffusion, and (3) adsorption on the interior sites of adsorbent to attain the equilibrium.
For the liquid film diffusion model (Figure 5C), all biochar samples presented a straight line with regression coefficients between 0.854 and 0.979, being better for BC300 and BC600, showing that film diffusion was involved in the Cu adsorption onto biochar samples. However, the lines did not pass through the origin; therefore, the liquid film diffusion was not the sole rate-limiting step that controlled the adsorption process [58].
This finding is corroborated by the intra-particle diffusion model, where different phases were observed using different adjusted linear regressions (Figure 5D, Table 5). Intra-particle diffusion is involved if the plot qt vs. t1/2 produces one straight line, and is the rate-limiting step if the line passes through the origin [55]. This was not observed, suggesting that both film diffusion and intra-particle diffusion are the rate-limiting steps.
The multi-linearity of the intra-particle diffusion model indicates that Cu2+ adsorption on biochar samples occurs by two or three phases, depending on the biochar sample. For BC300 and BC600, the first phase is generally associated with film diffusion that occurred mostly in the outer layer of the biochar samples, and the second portion of the line represents intra-particle diffusion into the pore structure of the biochar samples. The value of the constants ki1 for BC 300 and BC600 samples are greater than ki2, suggesting that the film diffusion of Cu2+ occurred quickly until reaching saturation on the biochar samples, followed by an adsorption process inside the pores at a slower rate. In addition, the intercept value C is a constant related to the thickness of the boundary layer; the C values of BC300 and BC600 were higher than that of BC450 (Table 5), suggesting that surface diffusion played an important role as the rate-limiting step for the BCs produced at 300 and 600 °C [59]. These results agree with their similar pore diameter (18.1 and 19.9 nm for BC300 and BC600, respectively) and with the high correlation obtained for both BCs in the film diffusion model. Conversely, the intra-particle diffusion model of BC450 shows three straight lines associated with surface diffusion, followed by intra-particle diffusion, and finally reaching equilibrium [59]. The lower C value of BC450 compared to the other BCs suggests that the film diffusion was less important as a rate-limiting step, in agreement with a higher resistance to intra-particle diffusion associated with a smaller pored diameter [6].

4. Conclusions

Biochars were generated from Macrocystis pyrifera for the first time through a slow pyrolysis process at three temperatures (300, 450, and 600 °C), obtaining high yields, high ash contents, and the presence of calcium carbonate in all biochar samples. The pyrolysis temperature improves the structural and physicochemical properties of biochar for copper adsorption from 300 ° to 450 °C, but insignificant differences were obtained in the range of 450–600 °C. However, at a higher pyrolysis temperature, a decrease in functional groups was observed through FTIR analysis. According to the Langmuir isotherm and mean free energy (E), the Cu2+ adsorption from aqueous suspensions occurs through a chemisorption process. The fitting of kinetic models was highly dependent on the structural properties of the biochars. The Cu2+ adsorption on BC450 and BC600 was adjusted to a pseudo-first-order model, whereas BC300 was explained by a pseudo-second-order model. Both liquid film diffusion and intra-particle diffusion were the limiting steps of Cu2+ adsorption; however, the surface diffusion in BC300 and BC600 was more important than in BC450, in agreement with their higher pore size. Further studies are required to explore other mechanisms involved in controlling heavy metal removal from aqueous solutions using these seaweed biochars. Thus, biochar from M. pyrifera generated at 450 and 600 °C has significant potential for use as a bioadsorbent for the removal of Cu2+ from wastewater or drinking water.

Supplementary Materials

The following are available online at https://www.mdpi.com/article/10.3390/app11199223/s1, Figure S1: Linear isotherm of N2 adsorption-desorption of BC300. The line with cross represents the adsorption and with circle the desorption curve of N2, Figure S2: Linear isotherm of N2 adsorption-desorption of BC450. The line with cross represents the adsorption and with circle the desorption curve of N2, Figure S3: Linear isotherm of N2 adsorption-desorption of BC600. The line with cross represents the adsorption and with circle the desorption curve of N2; Figure S4: pHpzc obtain of BCs by drift method.

Author Contributions

Project conception, L.C.-P., E.G.-R., and M.A.; experimental design, L.C.-P., M.A., and E.G.-R.; performance of experiments, M.A., C.E.-G., G.S., and J.R.; material preparation, data collection, and analysis, L.C.-P., E.G.-R., M.A., C.E.-G., G.S., E.B., N.E., and J.R.; writing—original draft preparation (and commented on afterwards), M.A., J.R., A.M., S.L., E.G.-R., R.G., and L.C.-P.; writing—review and editing, M.A., J.R., A.M., E.G.-R., R.G., and L.C.-P. All authors have read and agreed to the published version of the manuscript.

Funding

This study was funded in Chile by ANID FONDECYT 1170881, ANID PIA/BASAL FB0002, and ANID Millennium Science Initiative Program ICN 2019_015.

Institutional Review Board Statement

Not applicable.

Informed Consent Statement

Not applicable.

Data Availability Statement

Derived data supporting the findings of this study are available from the corresponding author (L. Contreras-Porcia) on request.

Acknowledgments

We thank ANID/FONDECYT 1170881, ANID PIA/BASAL FB0002, FONDEQUIP EQM 160070, and ANID Millennium Science Initiative Program ICN 2019_015 for the funding awarded for the completion of this work. We thank LEBMA (www.lebma.cl) for technical assistance, and our friends from Caleta Horcón and Caleta Maitencillo for their support during the harvest of the M. pyrifera biomass.

Conflicts of Interest

The authors declare no conflict of interest. The funders had no role in the design of the study; in the collection, analyses, or interpretation of data; in the writing of the manuscript, or in the decision to publish the results.

References

  1. Zhao, G.; Lu, Q.; Ye, S.; Yuan, H.; Ding, X.; Wang, J. Assessment of heavy metal contamination in surface sediments of the west Guangdong coastal region, China. Mar. Pollut. Bull. 2016, 108, 268–274. [Google Scholar] [CrossRef] [PubMed]
  2. Walker, C.H.; Sibly, R.M.; Hopkin, S.P.; Peakal, D.B. Pollutants and their fate in ecosystems. In Principles of Ecotoxicology, 4th ed.; CRC Press: Boca Raton, FL, USA, 2012; pp. 3–6. [Google Scholar]
  3. Vardhan, K.H.; Kumar, P.S.; Panda, R.C. A review on heavy metal pollution, toxicity and remedial measures: Current trends and future perspectives. J. Mol. Liq. 2019, 290, 111197. [Google Scholar] [CrossRef]
  4. Masindi, V.; Muedi, K. Environmental contamination by heavy metals. In Heavy Metals; Saleh, H., Aglan, E.S., Eds.; IntechOpen: London, UK, 2018; pp. 117–130. [Google Scholar]
  5. Uriu-Adams, J.; Keen, C.L. Copper, oxidative stress, and human health. Mol. Aspects. Med. 2005, 26, 268–298. [Google Scholar] [CrossRef] [PubMed]
  6. Gupta, S.S.; Bhattacharyya, K.G. Kinetics of adsorption of metal ions on inorganic materials: A review. Adv. Colloid Interface Sci. 2011, 162, 39–58. [Google Scholar] [CrossRef] [PubMed]
  7. Cha, J.S.; Park, S.H.; Jung, S.-C.; Ryu, C.; Jeon, J.-K.; Shin, M.-C.; Park, Y.-K. Production and utilization of biochar: A review. J. Ind. Eng. Chem. 2016, 40, 1–15. [Google Scholar] [CrossRef]
  8. Chen, X.; Chen, G.; Chen, L.; Chen, Y.; Lehmann, J.; McBride, M.B.; Hay, A.G. Adsorption of copper and zinc by biochars produced from pyrolysis of hardwood and corn straw in aqueous solution. Bioresour. Technol. 2011, 102, 8877–8884. [Google Scholar] [CrossRef]
  9. Park, S.H.; Cho, H.J.; Ryu, C.; Park, Y.-N. Removal of copper(II) in aqueous solution using pyrolytic biochars derived from red macroalga Porphyra tenera. J. Ind. Eng. Chem. 2016, 36, 314–319. [Google Scholar] [CrossRef]
  10. Contreras-Porcia, L.; Araya, M.; Garrido-Ramírez, E.; Bulboa, C.; Remonsellez, J.P.; Zapata, J.; Espinoza, C.; Rivas, J. Biochar production from seaweeds. In Protocols for Macroalgae Research; Charrier, B., Wichard, T., Reddy, C.R.K., Eds.; CRS Press, Taylor & Francis Group: Boca Raton, FL, USA, 2018; pp. 175–185. [Google Scholar]
  11. Ronsse, F.; van Hecke, S.; Dickinson, D.; Prins, W. Production and characterization of slow pyrolysis biochar: Influence of feedstock type and pyrolysis conditions. GCB Bioenergy 2013, 5, 104–115. [Google Scholar] [CrossRef]
  12. Tag, A.T.; Duman, G.; Ucar, S.; Yanik, J. Effects of feedstock type and pyrolysis temperature on potential applications of biochar. J. Anal. Appl. Pyrol. 2016, 120, 200–206. [Google Scholar] [CrossRef]
  13. Chen, H.; Zhou, D.; Luo, G.; Zhang, S.; Chen, J. Macroalgae for biofuels production: Progress and perspectives. Renew. Sustain. Energy Rev. 2015, 47, 427–437. [Google Scholar] [CrossRef]
  14. Gouvêa, L.P.; Assis, J.; Gurgel, C.F.D.; Serrao, E.A.; Silveira, T.C.L.; Santos, R.; Duarte, C.M.; Peres, L.M.C.; Carvalho, V.F.; Batista, M.; et al. Golden carbon of Sargassum forests revealed as an opportunity for climate change mitigation. Sci. Total Environ. 2020, 729, 138745. [Google Scholar] [CrossRef]
  15. Jung, K.-W.; Kim, K.; Jeong, T.-U.; Ahn, K.-H. Influence of pyrolysis temperature on characteristics and phosphate adsorption capability of biochar derived from waste-marine macroalgae (Undaria pinnatifida roots). Bioresour. Technol. 2016, 200, 1024–1028. [Google Scholar] [CrossRef] [PubMed]
  16. Li, H.; Dong, X.; da Silva, E.B.; de Oliveira, L.M.; Chen, Y.; Ma, L.Q. Mechanisms of metal sorption by biochar: Biochar characteristics and modifications. Chemosphere 2017, 178, 466–478. [Google Scholar] [CrossRef]
  17. Poo, K.-M.; Son, E.-B.; Chang, J.-S.; Ren, X.; Choi, Y.-J.; Chae, K.-J. Biochars derived from wasted macro-algae (Saccharina japonica and Sargassum fusiforme) and their potential for heavy metal removal in aqueous solution. J. Environ. Manage. 2018, 206, 364–372. [Google Scholar] [CrossRef]
  18. Kim, B.S.; Lee, H.W.; Park, S.H.; Baek, K.; Jeon, J.-K.; Cho, H.J.; Jung, S.-C.; Kim, S.C.; Park, Y.-K. Removal of Cu2+ by biochars derived from green macroalgae. Environ. Sci. Pollut. Res. 2016, 23, 985–994. [Google Scholar] [CrossRef]
  19. Schiel, D.R.; Foster, M.S. The Biology and Ecology of Giant Kelp Forest, 1st ed.; University of California Press: Berkeley, CA, USA, 2015; pp. 23–40. [Google Scholar]
  20. Davis, T.A.; Volesky, B.; Mucci, A. A review of the biochemistry of heavy metal biosorption by brown algae. Water Res. 2003, 37, 4311–4330. [Google Scholar] [CrossRef]
  21. Brunauer, S.; Emmett, P.H.; Teller, E. Adsorption of gases in multimolecular layers. J. Am. Chem. Soc. 1938, 60, 309–319. [Google Scholar] [CrossRef]
  22. Barret, E.P.; Joyner, L.G.; Halenda, P.P. The determination of pore volume and area distributions in porous substances. I. Computation from nitrogen isotherms. J. Am. Chem. Soc. 1951, 73, 373–380. [Google Scholar] [CrossRef]
  23. AOAC. Official Methods of Analysis of AOAC International, 16th ed.; Method 973.04; AOAC International: Rockville, MD, USA, 1995; Volume 1. [Google Scholar]
  24. Houshang, F.; Fatemeh, H.; Rahmatollah, R.; Ali, R. Surfactant-free hydrothermal synthesis of mesoporous niobia samples and their photoinduced decomposition of terephthalic acid (TPA). J. Clust. Sci. 2014, 25, 651–666. [Google Scholar] [CrossRef]
  25. R Core Team. R: A Language and Environment for Statistical Computing. R Foundation for Statistical Computing. 2018. Available online: https://www.r-project.org (accessed on 15 September 2020).
  26. Yu, K.L.; Lau, B.F.; Show, P.L.; Ong, H.C.; Ling, T.C.; Chen, W.-H.; Ng, E.P.; Chang, J.-S. Recent developments on algal biochar production and characterization. Bioresour. Technol. 2017, 246, 2–11. [Google Scholar] [CrossRef]
  27. Ross, A.B.; Jones, J.M.; Kubacki, M.L.; Bridgeman, T. Classification of macroalgae as fuel and its thermochemical behaviour. Bioresour. Technol. 2008, 99, 6494–6504. [Google Scholar] [CrossRef]
  28. Zhao, H.; Yan, H.; Dong, S.; Zhang, Y.; Sun, B.; Zhang, C.; Ai, Y.; Chen, B.; Liu, Q.; Sui, T.; et al. Thermogravimetry study of the pyrolytic characteristics and kinetics of macro-algae Macrocystis pyrifera residue. J. Therm. Anal. Calorim. 2013, 111, 1685–1690. [Google Scholar] [CrossRef]
  29. Li, D.; Chen, L.; Yi, X.; Zhang, X.; Ye, N. Pyrolytic characteristics and kinetics of two brown algae and sodium alginate. Bioresour. Technol. 2010, 101, 7131–7136. [Google Scholar] [CrossRef] [PubMed]
  30. Ross, A.B.; Anastasakis, K.; Kubacki, M.; Jones, J.M. Investigation of the pyrolysis behavior of brown algae before and after pre-treatment using PY-GC/MS and TGA. J. Anal. Appl. Pyrol. 2009, 85, 3–10. [Google Scholar] [CrossRef]
  31. Yuan, J.-H.; Xu, R.-K.; Zhang, H. The forms of alkalis in the biochar produced from crop residues at different temperatures. Bioresour. Technol. 2011, 102, 3488–3497. [Google Scholar] [CrossRef] [PubMed]
  32. Wei, L.; Huang, Y.; Li, Y.; Huang, L.; Mar, N.N.; Huang, Q.; Liu, Z. Biochar characteristics produced from rice husks and their sorption properties for the acetanilide herbicide metolachlor. Environ. Sci. Pollut. Res. 2017, 24, 4552–4561. [Google Scholar] [CrossRef] [PubMed]
  33. Song, W.; Guo, M. Quality variations of poultry litter biochar generated at different pyrolysis temperatures. J. Anal. Appl. Pyrol. 2012, 94, 138–145. [Google Scholar] [CrossRef]
  34. Mays, T.J. A New Classification of Pore Sizes. In Studies in Surface Science and Catalysis; Llewellyn, P.L., Rodriguez-Reinoso, F., Rouqerol, J., Seaton, N., Eds.; Elsevier B.V.: Bath, UK, 2007; pp. 57–62. [Google Scholar]
  35. Cao, X.; Harris, W. Properties of dairy-manure biochar pertinent to its potential use in remediation. Bioresour. Technol. 2010, 101, 5222–5228. [Google Scholar] [CrossRef] [PubMed]
  36. Cantrell, K.B.; Hunt, P.G.; Uchimiya, M.; Novak, J.M.; Ro, K.S. Impact of pyrolysis temperature and manure source on physicochemical characteristics of biochar. Bioresour. Technol. 2012, 107, 419–428. [Google Scholar] [CrossRef]
  37. Murdock, J.N.; Wetzel, D.L. FT-IR Microspestrocopy enhances biological and ecological analysis of algae. Appl. Spesctrosc. Rev. 2009, 44, 335–361. [Google Scholar] [CrossRef]
  38. Plaza, J.; Viera, M.; Donati, E.; Guibal, E. Biosorption of mercury by Macrocystis pyrifera and Undaria pinnatifida: Influence of zinc, cadmium and nickel. J. Environ. Sci. 2011, 23, 1778–1786. [Google Scholar] [CrossRef]
  39. Miller, F.A.; Wilkins, C.H. Infrared spectra and characteristics frequencies of inorganic ions. Anal. Chem. 1952, 24, 1253–1294. [Google Scholar] [CrossRef]
  40. Pongkua, W.; Dolphen, R.; Thiravetyan, P. Effect of functional groups of biochar and their ash content on gaseous methyl tert-butyl ether removal. Colloids Surf. A. 2018, 558, 531–537. [Google Scholar] [CrossRef]
  41. Uchimiya, M.; Ohno, T.; He, Z. Pyrolysis temperature-dependent release of dissolved organic carbon from plant, manure, and biorefinery wastes. J. Anal. Appl. Pyrol. 2013, 104, 84–94. [Google Scholar] [CrossRef]
  42. Das, S.K.; Ghosh, G.K.; Avasthe, R.K.; Sinha, K. Compositional heterogeneity of different biochar: Effect of pyrolysis temperature and feedstocks. J. Environ. Manage. 2021, 278, 111501. [Google Scholar] [CrossRef]
  43. Al-Ghouti, M.A.; Da’ana, D.A. Guidelines for the use and interpretation of adsorption isotherm models: A review. J. Hazard. Mater. 2020, 393, 122383. [Google Scholar] [CrossRef] [PubMed]
  44. Moreira, V.R.; Lebron, Y.A.R.; Freire, S.J.; Santos, L.V.S.; Palladino, F.; Jacob, R.S. Biosorption of copper ions from solution using Chlorella pyrenoidosa: Optimization, equilibrium, and kinetics studies. Microchem. J. 2019, 145, 119–129. [Google Scholar] [CrossRef]
  45. Koyuncu, H.; Kul, A.R. Biosorption study for removal of methylene blue dye from aqueous solution using a novel activated carbon obtained from nonliving lichen (Pseudevernia furfuracea (L.) Zopf.). Surf. Interfaces. 2020, 19, 100527. [Google Scholar] [CrossRef]
  46. Mondal, S.; Majumder, S.K. Honeycomb-like porous activated carbon for efficient copper (II) adsorption synthesized from natural source: Kinetic study and equilibrium isotherm analysis. J. Environ. Chem. Eng. 2019, 7, 103236. [Google Scholar] [CrossRef]
  47. Daneshvar, E.; Kousha, M.; Jokar, M.; Koutahzadeh, N.; Guibal, E. Acidic dye biosorption onto marine brown macroalgae: Isotherm, kinetic and thermodynamic studies. Chem. Eng. J. 2012, 204–206, 225–234. [Google Scholar] [CrossRef]
  48. Rodríguez-Vila, A.; Selwyn-Smith, H.; Enunwa, L.; Smail, I.; Covelo, E.F.; Sizmur, T. Predicting Cu and Zn sorption capacity of biochar from feedstock C/N ratio and pyrolysis temperature. Environ. Sci. Pollut. R. 2018, 25, 7730–7739. [Google Scholar] [CrossRef] [Green Version]
  49. Cho, H.J.; Baek, K.; Jeon, J.-K.; Park, S.H.; Suh, D.J.; Park, Y.-K. Removal characteristics of copper by marine macro-algae-derived chars. Chem. Eng. J. 2013, 217, 205–211. [Google Scholar] [CrossRef]
  50. Katiyar, R.; Patel, A.K.; Nguyen, T.-B.; Singhania, R.R.; Chen, C.-W.; Dong, C.-D. Adsorption of copper (II) in aqueous solution using biochars derived from Ascophyllum nodosum seaweed. Bioresour. Technol. 2021, 328, 124829. [Google Scholar] [CrossRef]
  51. Wang, M.; Liu, Y.; Yao, Y.; Han, L.; Liu, X. Comparative evaluation of bone chars derived from bovine parts: Physicochemical properties and copper sorption behavior. Sci. Total. Environ. 2020, 700, 134470. [Google Scholar] [CrossRef]
  52. Nath, H.; Saikia, A.; Goutam, P.J.; Saikia, B.K.; Saiki, N. Removal of methylene blue from water using okra (Abelmoschus esculentus L.) mucilage modified biochar. Bioresour. Technol. Rep. 2021, 14, 100689. [Google Scholar] [CrossRef]
  53. Qiu, H.; Lv, L.; Pan, B.-C.; Zhang, Q.-J.; Zhang, W.-M.; Zhang, Q.-X. Critical review in adsorption kinetic models. J. Zhejiang Univ. Sci. A 2009, 10, 716–724. [Google Scholar] [CrossRef]
  54. Nishikawa, E.; da Silva, M.G.C.; Vieira, M.G.A. Cadmium biosorption by alginate extraction waste and process overview in Life Cycle Assessment context. J. Clean. Prod. 2018, 178, 166–175. [Google Scholar] [CrossRef]
  55. Suteu, D.; Zaharia, C.; Badeanu, M. Kinetic modeling of dye sorption from aqueous solutions onto apple seed powder. Cellul. Chem. Technol. 2016, 50, 1085–1091. [Google Scholar]
  56. Plazinski, W. Binding of heavy metals by algal biosorbents. Theoretical models of kinetics, equilibria and thermodynamics. Adv. Colloid Interface Sci. 2013, 197–198, 58–67. [Google Scholar] [CrossRef]
  57. Boyd, G.E.; Adamson, A.W.; Myers, L.S., Jr. The exchange adsorption of ions from aqueous solutions by organic zeolites II. Kinetics. J. Am. Chem. Soc. 1947, 69, 2836–2848. [Google Scholar] [CrossRef]
  58. Plaza Cazón, J.; Bernardelli, C.; Viera, M.; Donati, E.; Guibal, E. Zinc and cadmium biosorption by untreated and calcium-treated Macrocystis pyrifera in a batch system. Bioresour. Technol. 2012, 116, 195–203. [Google Scholar] [CrossRef] [PubMed]
  59. Arancibia-Miranda, N.; Baltazar, S.E.; García, A.; Muñoz-Lira, D.; Sepúlveda, P.; Rubio, M.A.; Altbir, D. Nanoscale zero valent supported by Zeolite and Montmorillonite: Template effect of the removal of lead ion from an aqueous solution. J. Hazard. Mater. 2016, 301, 371–380. [Google Scholar] [CrossRef] [PubMed]
Figure 1. Micrographs obtained by scanning electron microscopy (SEM) of different biochar samples from Macrocystis pyrifera with a total magnification of 30,000×.
Applsci 11 09223 g001
Figure 2. Fourier transform infrared (FTIR) spectrum of dry biomass of biochar samples from Macrocystis pyrifera (Mpyr) generated at 300 (BC300), 450 (BC450), and 600 °C (BC600) of the final pyrolysis temperature.
Applsci 11 09223 g002
Figure 3. Linear regression of measured adsorption isotherms using (A) Langmuir, (B) Freundlich, (C) Dubinin–Radushkevich, and (D) Temkin linearized models for the studied biochar samples (BC300, BC450, and BC600).
Applsci 11 09223 g003
Figure 4. Cu2+ removal kinetics of biochar samples under study (BC300, BC450, and BC600).
Applsci 11 09223 g004
Figure 5. Fitted experimental data with the (A) pseudo-first-order model, (B) pseudo-second-order model, (C) liquid layer diffusion model, and (D) intra-particle diffusion for the biochar samples under study (BC300, BC450, and BC600).
Applsci 11 09223 g005
Table 1. Yield and physicochemical characteristics of biochar samples from Macrocystis pyrifera produced at different pyrolysis temperatures (300, 450, and 600 °C). a–c Different letters indicate significant differences among biochar samples with p < 0.001 obtained by ANOVA with a posteriori Tukey test, n = 9–12. * EC, electric conductivity; CEC, cation exchange capacity; OM, organic matter.
Parameter *UnitBC300BC450BC600
Yield%62.10 a53.30 b48.80 b
Ash%57.50 a69.90 b71.10 b
pH 9.80 a11.00 b11.80 b
pHpzc 9.13 a10.70 b11.30 c
ECdS m−125.70 a27.40 b28.10 b
CECcmol kg−134.70 a40.20 b35.00 a
C%28.20 a23.90 a25.50 a
H%1.95 a3.01 b0.87 c
N%3.15 a2.00 b1.58 c
H:C 0.82 a1.51 b0.41 c
OM%40.00 a29.50 b28.00 b
Table 2. Structural characterization of biochar samples from Macrocystis pyrifera produced at different pyrolysis temperatures (300, 450, and 600 °C).
UnitBC300BC450BC600
BET surface aream2 g−12.04.04.0
Pore volumecm3 g−10.0092110.0128710.018898
Pore diameternm18.112.419.9
Table 3. Reflectance Fourier transform infrared (FTIR) spectrum signal assignments for study biochar samples BC300, BC450, and BC600.
Wave NumberSignal AssignmentReference
3400–OH stretching (water, hydrogen bonded hydroxyl); N–H[36]
2920–2880Aliphatic –CH2; asymmetric C–H stretching band; Aliphatic –CH2; symmetric C–H stretching band; CH3[36,37]
1617N–H bending[38]
1558C=C of secondary aromatics amines[37]
1521Amide N–H bending[37]
1444–1414–CH2; –CO32−; aromatic C=C stretching; in-plane bending of carbonyl (-COH); Symmetry C=O stretch[16,31,37,39]
1234C–O alcohol or carboxylic acid stretching[38]
1103–1093C–O or C–O–C bonds stretching or bending[40]
1034Symmetric stretching C–O bonds[37]
873–853–CO32−; Si–H2 or metallic oxides[39,40]
711–CO32−[39]
620–616FeSO4[39]
Table 4. Adsorption isotherm parameters of the Langmuir, Freundlich, Dubinin–Radushkevich, and Temkin models determined for the biochar samples from Macrocystis pyrifera under study.
Linear ParametersBC300BC450BC600
Langmuir
qm (mg g−1)49.2458.0093.55
kL (L mg−1)23.5010.910.372
RL0.00039780.00033770.0002094
R20.9940.9990.998
Freundlich
kF (mg g−1)24.7824.8923.20
n−1 (mg L−1)0.23640.19330.4417
R20.9630.9190.952
Dubinin–Radushkevich C
qm (mg g−1)139.22222.20637.08
K (×10−9 mol2/kJ2)1.251.572.41
E (kJ mol−1)19.9917.8314.4
R20.9670.9380.970
Tempkin
bT (J g mol−1 mg−1)575.0333.0124.2
aT (L mg−1)479.092.993.705
R20.8500.9340.991
Table 5. Kinetic parameters calculated from the pseudo-first- and pseudo-second-order models, in addition to the intra-particle diffusion and liquid film diffusion linear models.
Linear ParametersBC300BC450BC600
qe, expa (mg g−1)71.91119.9101.9
Pseudo-first-order
qe (mg g−1)61.24118.7106.67
k1 (min−1)0.002600.002690.00447
R20.9170.9330.960
Pseudo-second-order
qe (mg g−1)70.37128.2125.9
k2 (g mg−1 min−1)0.000190.0000300.000037
R20.9950.8440.958
Liquid-film diffusion
kfd (min−1)0.001690.002330.00461
R20.9790.8540.979
Intra-particle diffusion
ki1 (mg g−1 min1/2)2.0811.9065.646
C1 (mg g−1)20.56016.78326.285
R20.9920.9900.988
ki2 (mg g−1 min1/2)0.8444.72340.400
C2 (mg g−1)39.231526.63986.671
R20.9970.9950.987
ki3 (mg g−1 min1/2)-1.342-
C3 69.843
R2-0.880-
a Obtained values of qe from the sampling and measurement of Cu2+ in the suspension at 1440 min in the kinetics experiments.
Publisher’s Note: MDPI stays neutral with regard to jurisdictional claims in published maps and institutional affiliations.

