Abstract
Tolerance cost and machining time play crucial roles while performing tolerance allocation in complex assemblies. The aim of the proposed work is to minimize the above-said manufacturing objectives for allocating optimum tolerance to the components of complex assemblies, by considering the proper process and machine selections from the given alternatives. A novel methodology that provides a two-step solution is developed for this work. First, a heuristic approach is applied to determine the best machine for each process, and then a combined whale optimization algorithm with a univariate search method is used to allocate optimum tolerances with the best process selection for each sub-stage/operation. The efficiency of the proposed novel methodology is validated by solving two typical tolerance allocation problems of complex assemblies: a wheel mounting assembly and a knuckle joint assembly. Compared with previous approaches, the proposed methodology showed a considerable reduction in tolerance cost and machining time in relatively less computation time.
1. Introduction
All aspects of manufacturing such as machine investment cost, manufacturing cost, the functionality of the product, quality of manufacturing, and the reliability of the product directly connect with tolerance allocation. Hence, most of the researchers are still focusing on this research topic to improve manufacturing efficiency. It involves the allocation of critical dimensions of an assembly, known from the product’s functional requirements. As per the literature, more equations are available based on the combinations of the component’s tolerance values; however, few equations provide better results. Tolerance allocation requires discovering the best possible combination of the component’s tolerances by considering the manufacturing objective(s) and the associated constraints. The researchers proposed different tolerance allocation strategies in different periods. The summary of those strategies is explained here. Further, the detailed comparison of the strategies is given in the Supplementary File as Table S1.
Meta-Heuristic Method (MHM): In this method, the tolerance accumulation model, namely the root sum square (RSS) method [1,2,3,4,5,6], was used to calculate the assembly tolerance value by summing the randomly picked discrete tolerance values. Initially, the discrete tolerance values were identified by splitting the process tolerance limits. Most of the researchers had applied the MHM such as simulated annealing algorithm [7] and genetic algorithm [8,9,10,11,12,13,14,15,16,17] for this purpose.
Heuristic Method (HM): The application of this method is seldom found in literature, since the usage of thumb rules, previous experiences, and standards [18,19] in solving the tolerance allocation problems. Nevertheless, the alternative methods, namely the branch and bound algorithm [20] and design of experiments [21], were used to identify the effective tolerance allocation models. Further, a new method was developed by integrating HM with Tabu search for optimal tolerance allocation and subsequent manufacturing cost reduction [22]. Armillotta (2020) [23] minimized the manufacturing cost of the mechanical assemblies by properly allocating the tolerances and choosing the right dimensional properties. Korbi et al. (2021) [24] proposed a computer-aided design model for analyzing the tolerance in manufacturing the mechanical assemblies.
Discrete Cost Function (DCF) and Continuous Cost Function (CCF) Models: The researchers have used different cost function models [25,26,27,28,29,30] in the various periods to evaluate the manufacturing cost. These models were classified as DCF and CCF based on their nature. However, the researchers mainly used the CCF model, since it yields closed-form solutions to the tolerance allocation problems. On the other hand, the DCF models [4,26,31] were not preferred due to the model fitting errors during the manual formulation. Further, several studies have been carried out by considering the objective function as the sum of quality loss (as per Taguchi quality loss concept) and manufacturing cost [1,8,32,33,34,35,36,37,38,39,40,41].
Simple, Complex, and Non-Linear Assembly: The researchers used different tolerance allocation methods to obtain a solution concerning product type. For instance, the LMM was only used for simple products [1,8,42,43], which have only two mating components. Several works have been reported on finding the optimum allocated tolerance values for the components of complex assembly [44,45,46,47,48,49,50,51]. A limited number of authors have concentrated on non-linear assembly products that consist of more than two components [20,26,38].
Alternative Process Selection (APS): In practice, it is possible to produce components using more than one alternative process. It is necessary to select the proper process for the correct component to reduce the manufacturing cost. Some authors have considered alternative process selection (i.e., every combination of the process has a feasible tolerance range, and for a given process combination, the cost of machining is the function of the tolerance value) for optimum tolerance allocation of both simple and complex assemblies [4,10,13,15]. Kumar et al. (2009) [52] dealt with the distribution of tolerance on the component dimension of a complex assembly with alternative process selection. Authors have attempted to reduce the manufacturing cost of a product using the Lagrange multiplier method for complex assemblies with the bottom curve follower method.
Alternative Machine Selection (AMS): It is possible to reduce the manufacturing cost of a product by choosing the suitable machine for the correct process. Several researchers have considered machine selection as one of the criteria for minimizing manufacturing costs in recent years. However, very few authors [9,17,34] have discussed alternative machine selection for optimum tolerance allocation, and even fewer studies [34] on minimizing both cost and machining time with process and machine selection for optimum allocation of tolerance have been reported in the literature.
From this literature review, it appears that no significant effort has been made to consider machine time as an objective in optimum tolerance allocation, even though machine time is a crucial manufacturing parameter. Therefore, in the present study, both tolerance cost and machining time are optimized. Realizing the complexity of the problem, a combined heuristic and univariate search method is introduced to select the best machine for each process and the optimum tolerance for each component using alternative process and machine selection, with available machine time as a constraint.
2. Problem Definition
The biggest challenge facing today’s manufacturing companies is to reduce production costs while maintaining better quality and higher productivity. Tolerance allocation plays a vital role in achieving those goals. The production of a component involves selecting processes as well as selecting machines. These decisions directly influence the allocated tolerance values of components. The optimum allocated tolerance values govern the manufacturing costs and machining time of the product. Therefore, an operation may be possible with multiple alternatives, and as such, is treated as a non-polynomial hard problem.
3. Mathematical Formulation
The proposed work aims to simultaneously minimize tolerance cost and machining time, represented in Equation (1). Tolerance cost (TCi) and machining time (MTik) are calculated using Equations (2) and (3). Equations (4) and (5), respectively, determine the critical dimension of the sub-assembly (Y) and its tolerance (tY). Machine engagement time (met) is estimated using Equation (6). The constraints considered in this work are expressed by Equations (7)–(9). The allocated tolerance (ti) should be within the process limits, represented by Equation (7). The calculated sub-assembly tolerance within the given sub-assembly tolerance; this constraint is given by Equation (8). The total individual machine engagement time to manufacture the product should be less than the given available machine time (amt) represented in Equation (9). In addition, it is assumed that the following data are known well in advance before manufacturing the product:
- Number of sub-assemblies and their dimensional chain details;
- Allowable tolerance for each sub-assembly (aty);
- Number of parts in the assembly (nc);
- Number of sub-stages required to make the parts (no);
- Number of possible processes for each sub-stage of the components (np);
- Number of possible machines for each process (nm);
- Number of hours available for each machine (amt);
- Possible process—machine combination details (opno);
- Mathematical model to compute tolerance cost and machining time;
- Constants to compute tolerance cost (A and B) and machining time (X1 and Y1);
- Process tolerance limits (tmin and tmax).
| Z | Objective function |
| TCijk | Tolerance cost of ith sub-stage using jth process on kth machine |
| MTijk | Machining time of ith sub-stage using jth process on kth machine |
| tijk | Allocated tolerance of ith sub-stage in jth process and kth machine |
| Aj, Bj | Tolerance cost function constants for jth process |
| X1j, Y1j | Tolerance machining time function constants for jth process |
| ηjk | Efficiency factor using jth process on kth machine |
| dl | Dimension of lth component |
| Y | Critical dimension of sub-assembly |
| ty | Calculated tolerance of critical dimension |
| tay | Specified tolerance of critical dimension |
| i | Sub-stage number index |
| j | Process number index |
| k | Machine number index |
| l | Component number index |
| metk | kth machine engagement time |
| amtk | Available time of kth machine |
4. Methodology
The proposed method consists of two stages: (i) selection of the best machine for each process by applying a heuristic approach; (ii) selection of the best process and optimum allocated tolerance for each component using combined whale optimization algorithm and univariate search method. In the first stage, the process tolerance is divided into nd number of discrete values using Equation (10) and the allocated tolerance (tejk) is calculated using Equation (11). The tolerance cost (TCejk) and machining time (MTejk) for tejk are calculated using Equations (2) and (3), respectively. Nagarajan et al. (2018) explained that the distance method is used to combine the two different objective functions into a single one. For each discrete value, points are plotted on a graph where the x-axis and y-axis represent tolerance cost (TCejk) and machining time (MTejk), respectively. Assuming point (x1, y1) as the origin and point (x2, y2) as discrete tolerance cost and machining time, and substituting (x1, y1) as (0,0) and (x2, y2) as (TCejk, MTejk) in Equation (12), then the distance equation becomes Equation (13). The detailed steps of the heuristic and univariate search methods are shown in Figure 1 and Figure 2. The pseudocode for the combined whale optimization algorithm and a univariate search method is presented in Section 5.
where e is the index for discrete point of tolerance and takes from 1,2,3… nd.
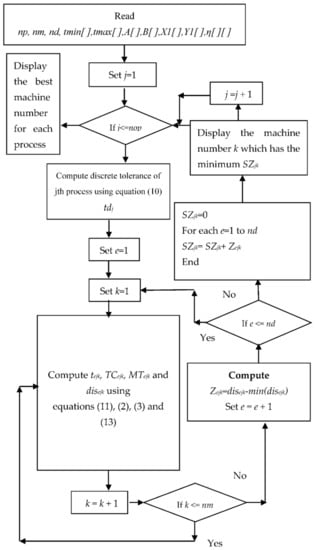
Figure 1.
Heuristic approach to determine the best machine for each process.
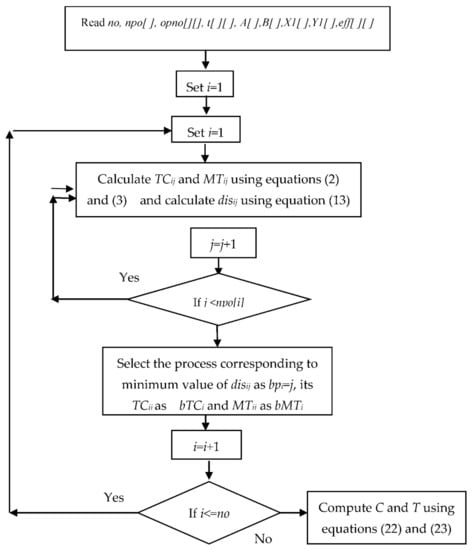
Figure 2.
Flow chart of univariate search method.
5. Numerical Illustration
The proposed method is initially implemented in the existing problem (wheel mounting assembly) discussed by Geetha et al. (2013) [34] to show the method’s effectiveness in case study 1. Later, it is implemented in knuckle joint assembly in case study 2.
Case study 1: Wheel Mounting Assembly (WMA)
The components of the wheel mounting assembly are given in the Supplemental File as Figure S1. The operations required to manufacture the components of the assembly are illustrated in Figure S1, starting from O1 to O8. The feasibility of performing the operations through the processes from P1 to P5 is given in Table S2. The infeasibility of performing the operation using the specific process is marked as ‘0′. The same way, the feasibility of using machines for the specific processes is also given in Table S2. Further, the cost and time function constants are represented in Table S3. The first stage of the proposed work, the procedure to determine the best machine for each process, is discussed below.
Figure 3 represents the graphical representation of possible alternative processes and machines to carry out all the sub-stage operations to complete the manufacturing of the product. In the first stage, the best machine is selected for each process by implementing the heuristic approach.
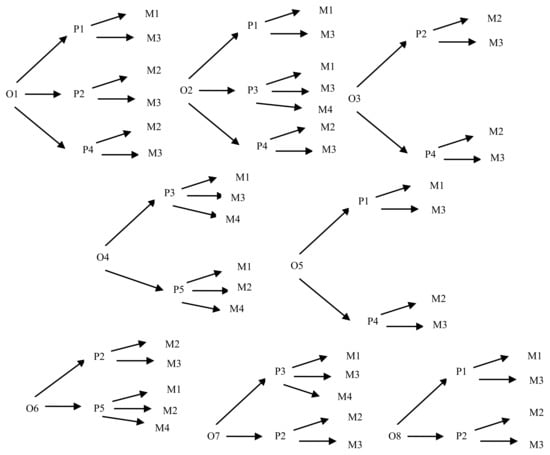
Figure 3.
Possible processes and machines for each operation/sub-stage to manufacture WMA.
Using Equations (2), (3), (10), (11), and (13), discrete tolerance (tdj), tolerance (tejk), tolerance cost (TCejk), machining time (MTejk), and distance values (disejk) are calculated for each machine and are shown in Table 1. Figure 4 is constructed for a discrete tolerance value of 0.01 mm (tejk = 0.01 mm), assuming TCejk on the x-axis and MTejk on the y axis. The distance between the origin and the discrete point of the machine represents the critical factor that decides on selecting the best machine. The value of less distance is more likely to be the best machine for the process.

Table 1.
Best machine for process number 1.
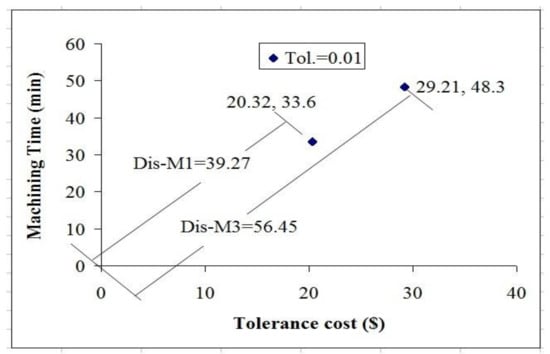
Figure 4.
Selection of the best machine based on discrete tolerance.
TCe11—tolerance cost of eth discrete tolerance using process number 1 on machine number 1; MTe13—machining time of eth discrete tolerance using process number 1 on machine number 3.
As shown in Figure 4, it is clear that dis-M1 is less than dis-M3; therefore, machine 1 is considered the best machine for process 1 for achieving a discrete tolerance value of 0.01 mm. The sum of the difference between minimum discrete distance (min(disijk)) and discrete distance (disijk) to that particular machine is calculated to select the best machine suitable for all discrete tolerances of the process tolerance. As shown in Table 1, it can be concluded that machine number 1 is the best machine for process number 1, shown graphically in Figure S2 (Supplementary File). Similarly, the best machine for the other processes is calculated and shown in Figure S2. It is clearly understood that machine numbers 2, 1, 3, and 4 are the best machines for process numbers 2, 3, 4, and 5, respectively.
After implementing the heuristic approach, alternative machines are removed for each process; instead, the best machine is selected, which is shown in Figure 5.
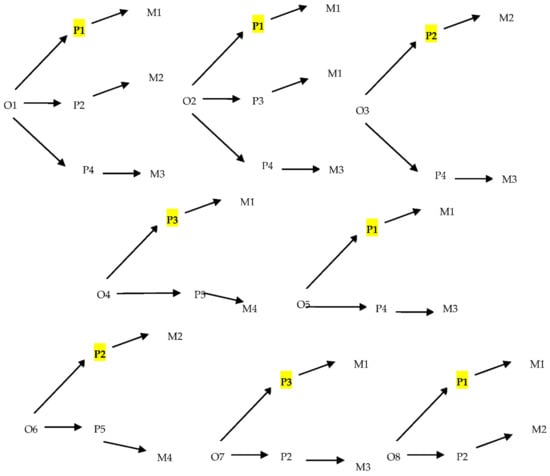
Figure 5.
Best machine for process of each operation/sub-stage after implementation of the first stage.
In the second stage, since the same allocated tolerances reported in Geetha et al. (2013) have been used for demonstration purposes, only univariate search method is implemented to get the best process, minimum tolerance cost, and minimum machining time for each sub-stage/operation of WMA. The univariate search method proposed in this work provides the best results in relatively less computation time than the existing method. The search space of the existing method proposed in Geetha et al. (2013) contains 403,200 combinations, whereas, in the proposed method, there are only 11 possible combinations in the search space. Equations (14) and (15) compute the possible combinations in the existing and proposed methods, respectively. Table 2 represents the 11 possible combinations obtained using the univariate search approach, and the first combination is shown as yellow shaded text in Figure 5.

Table 2.
Result of univariate search method for the existing problem.
Using Equations (2) and (3), the tolerance cost and machining time are calculated for each operation with alternative processes and its corresponding best machine is shown in Figure 5. In all 11 combinations of alternative processes, the same tolerance mentioned in case 1 and case 2 by Geetha et al. (2013) is assumed for each operation. The alternative process and its corresponding machine-allocated tolerance of each sub-stage/operation and its tolerance cost and machining time are presented in Table 2 and Table 3. The best result is shown as shaded text in both Table 2 and Table 3.

Table 3.
Details of individual sub-stages of the existing problem presented in Table 11 Geetha et al. (2013) case 2.
Figure 6 and Figure 7 show a comparison of the tolerance cost and machining time for the existing problem presented in Geetha et al. (2013) and the proposed method; it can be seen that the proposed method works well, considering tolerance cost, machining time, and both as objective functions.
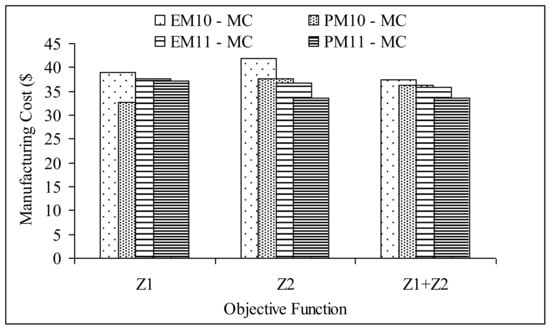
Figure 6.
Comparison of tolerance cost of the proposed method with the existing problem presented in Geetha et al. (2013) MC: tolerance cost; EM10 & EM11: existing method, as per data presented in Tables 10 and 11 of Geetha et al.; PM10 & PM11: proposed method, as per data presented in Tables 10 and 11 of Geetha et al. (2013).
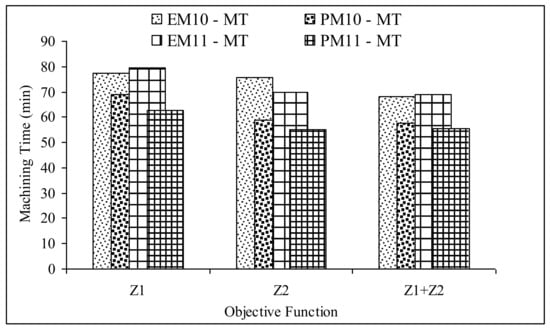
Figure 7.
Comparison of machining time of the proposed method with the existing problem presented in Geetha et al. (2013).
Table 4 represents the % of savings in both tolerance cost and machining time as compared to the existing method and the proposed method.

Table 4.
% Savings in tolerance cost and machining time.
Case Study 2: Knuckle Joint Assembly
In practice, the availability of machine time will restrict the selection of the machine for performing a process, which will influence the tolerance cost and machining time. Therefore, in this work, the available machine time is considered as a constraint in selecting the machine. The methodology is demonstrated using a knuckle joint assembly (Figure 8), consisting of six components performed in ten sub-stages. Two critical dimensions are considered for the proper functioning of the product. It is assumed that nine processes are performed using ten machines. Equations (16) and (17) are used to determine the critical dimension, and the tolerances of the critical dimensions are estimated using Equations (18)–(21). Table 5 shows the dimensions, sub-stages, tolerance symbols, and tolerance stake-up of the knuckle joint assembly.
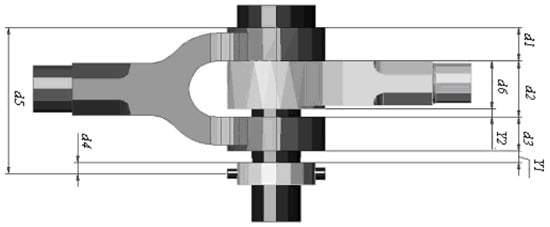
Figure 8.
Knuckle joint assembly (KJA).

Table 5.
Dimension and tolerance symbol of knuckle joint assembly.
Table 6 shows the cost and time function constants of each process of the knuckle joint assembly. The possible operation–process and process–machine feasibility matrix and the available time of the individual machines are presented in Table 7 and Table 8, respectively.

Table 6.
Cost and time function constants of each process of knuckle joint assembly.

Table 7.
Possible operation—process and process—machine feasibility matrix of knuckle joint assembly.

Table 8.
Available machine time of each machine in the knuckle joint assembly.
As per stage 1, the best machine for each process is determined using the heuristic method and is presented in Table 9 and Figure S3 (in Supplementary File).

Table 9.
Best machine for each process of the knuckle joint assembly.
In the second stage, the whale optimization algorithm is implemented with a univariate search method. The optimum allocated tolerance for each sub-stage/operation, tolerance cost, machining time, and best process is obtained by assuming 100 whales, 100 iterations as stopping criteria with 20 runs. The parameters involved in the algorithm are given in Table 10. Further, the pseudocode of this algorithm is given in the Supplementary File.

Table 10.
Terms involved in whale optimization algorithm.
The convergence plot for tolerance cost and machining time for stopping criteria considered as 100 iterations are shown in Figure 9. The Pareto optimal solution for a sample run is shown in Figure 10. The tolerance cost and machining time for 31 runs are presented in Table 11. Out of these 31 runs, the best value is calculated using EDAS and CODAS multi-criteria decision-making techniques implemented by Adali & Tuş (2019) [53] The appraisal score (APS) and the assessment score (AS) obtained by implementing EDAS and CODAS method are presented in Table 11. Run number (R.No.) 11 has the highest APS value in EDAS, and run number 7 has the highest AS value in CODAS (Highlighted in Table 11). The optimum allocated tolerances of each sub-stage are presented for both methods and are listed in Table 12, along with the tolerance cost and machining time for the required sub-assembly tolerances of 0.55 mm and 0.22 mm. The optimum total tolerance cost and total machining time are presented in Table 13 for the given sub-assembly tolerance values with the constraint of available machine time.
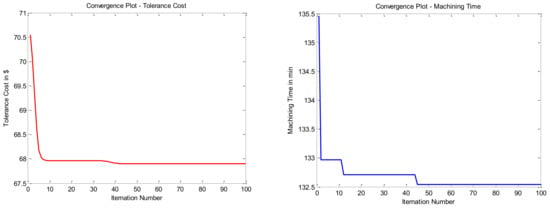
Figure 9.
Convergence plot for tolerance cost and machining time.
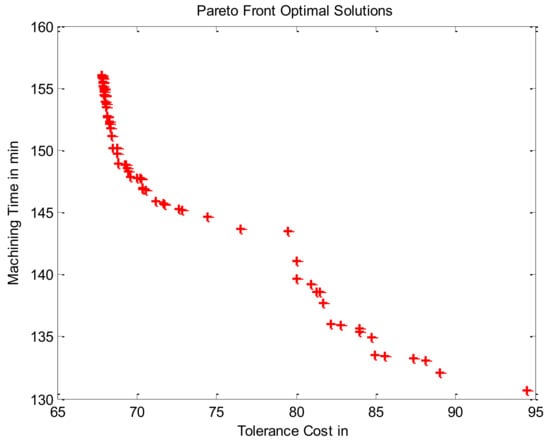
Figure 10.
Optimum Pareto front solutions.

Table 11.
Appraisal (APS) and assessment (AS) scores of EDAS and CODAS.

Table 12.
The optimum allocated tolerance of knuckle joint assembly.

Table 13.
Sub-assembly tolerance, total cost, and machining time.
Table 14 shows the machine engagement times of the individual machines to manufacture the knuckle joint assembly within the available machine time.

Table 14.
Machine engagement time (met) of individual machine.
For supporting the proposed method, the statistical analysis for EDAS and CODAS methods are executed through Minitab software. The statistical analysis results and probability plots for both the methods are presented in Figure 11. The probability values are 0.329 and 0.231 for the EDAS and CODAS methods, respectively. Since the value of probability is greater than 0.005 in both cases, it is clearly understood that the results obtained in 31 runs are from normally distributed data.
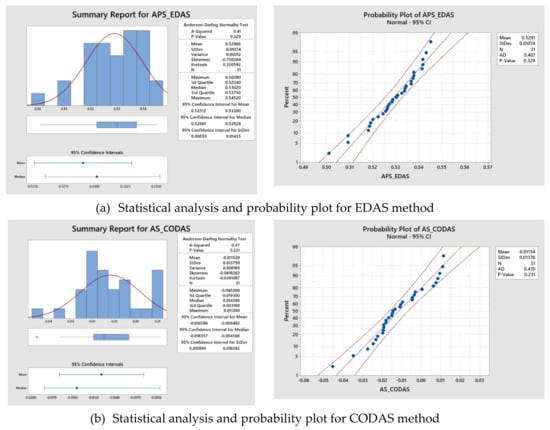
Figure 11.
Statistical analysis and probability plot for EDAS and CODAS methods.
6. Conclusions
Most previous studies on tolerance allocation problems concentrated on minimizing manufacturing costs, quality loss, or combining the two. Machining time, a vital manufacturing objective, has barely been contemplated. In this paper, the machining time was considered along with manufacturing cost in optimum tolerance allocation of complex assemblies, representing a more realistic product development scenario. Alternative machine and process selections with available machine time make this problem cumbersome and complicated. Therefore, a new methodology was developed that applies a heuristic approach and combines whale optimization algorithm with a univariate search method. The total manufacturing cost and machining time of 36.3 USD and 57.74 min reported in this paper for wheel mounting assembly is 2.73% and 15.35% less than the problem dealt with in case 1 by Geetha et al. (2013). Similarly in case 2, there was 6.22% and 20.32% of savings in the tolerance cost and machining time reported by implementing the proposed method. The results presented in this paper demonstrate that the proposed method can reduce tolerance cost and machining time simultaneously with less computation time. The proposed method is also suitable for solving two- and three-dimensional problems. As a further extension of this work, the operation sequence, machine sequence, or both may be considered with additional objectives such as total investment cost of machines, idle time of machines, idle cost of machines, and the number of machines required to manufacture the product.
Supplementary Materials
The following are available online at https://www.mdpi.com/article/10.3390/app11199164/s1, Figure S1: Figure S1: Wheel Mounting Assembly (WMA) [Geetha et al. (2013)], Figure S2: Selection of best machine for process number 1 to 5 to manufacture WMA, Figure S3: Selection of best machine for process number 1 to 9 to manufacture KJA, Table S1: Summary of literature survey, Table S2: Feasibility Matrix for WMA [Geetha et al. (2013)], Table S3: Cost and Time Function Constants for WMA [(Geetha et al. 2013)] [54,55,56,57,58,59,60,61,62,63,64,65,66,67,68,69].
Author Contributions
Conceptualization and methodology by L.N. and S.K.M.; writing—original draft preparation by L.N. and S.K.M.; writing—review and editing by S.S., E.A.N., J.P.D. and H.M.A.H. All authors have read and agreed to the published version of the manuscript.
Funding
The authors extend their appreciation to King Saud University for funding this work through Researchers Supporting Project number (RSP-2021/164), King Saud University, Riyadh, Saudi Arabia.
Institutional Review Board Statement
Not applicable.
Informed Consent Statement
Not applicable.
Data Availability Statement
Not applicable.
Conflicts of Interest
The authors declare that they have no conflict of interest.
References
- Vasseur, H.; Kurfess, T.R.; Cagan, J. Use of a quality loss function to select statistical tolerances. J. Manuf. Sci. Eng. 1977, 119, 410–416. [Google Scholar] [CrossRef]
- Cheng, K.M.; Tsai, J.C. Optimal statistical tolerance allocation of assemblies for minimum manufacturing cost. Appl. Mech. Mater. 2011, 52, 1818–1823. [Google Scholar] [CrossRef]
- Cheng, K.-M.; Jhy-Cherng, T. Optimal statistical tolerance allocation for reciprocal exponential cost–tolerance function. Proc. Inst. Mech. Eng. Part B J. Eng. Manuf. 2013, 227, 650–656. [Google Scholar] [CrossRef]
- Feng, C.X.; Kusiak, A. Robust tolerance design with the integer programming approach. ASME J. Manuf. Sci. Eng. 1997, 119, 603–610. [Google Scholar] [CrossRef]
- Chase, K.W.; Greenwood, W.H.; Loosli, B.G.; Hauglund, L.F. Least cost tolerance allocation for mechanical assemblies with automated process selection. Manuf. Rev. 1990, 3, 49–59. [Google Scholar]
- Jayaprakash, G.; Sivakumar, K.; Thilak, M. FEA compliant parametric tolerance allocation of mechanical assembly using neural network and differential evolution algorithm. Int. J. Comput. Integr. Manuf. 2012, 25, 636–654. [Google Scholar] [CrossRef]
- Zhang, C.; Wang, H.P. The discrete tolerance optimization problem. Manuf. Rev. 1993, 6, 60–71. [Google Scholar]
- Ji, S.; Li, X.; Ma, Y.; Cai, H. Optimal tolerance allocation based on fuzzy comprehensive evaluation and genetic algorithm. Int. J. Adv. Manuf. Technol. 2000, 16, 461–468. [Google Scholar] [CrossRef]
- Uttam, S. Optimal Tolerance Synthesis for Process Planning with Machine selection. Ph.D. Thesis, University of Cincinnati, Cincinnati, OH, USA, 2001. [Google Scholar]
- Singh, P.K.; Jain, P.K.; Jain, S.C. Simultaneous optimal selection of design and manufacturing tolerances with different stack-up conditions using genetic algorithms. Int. J. Prod. Res. 2003, 41, 2411–2429. [Google Scholar] [CrossRef]
- Prabhaharan, G.; Asokan, P.; Ramesh, P.; Rajendran, S. Genetic-algorithm-based optimal tolerance allocation using a least-cost model. Int. J. Adv. Manuf. Technol. 2004, 24, 647–660. [Google Scholar] [CrossRef]
- Singh, P.K.; Jain, P.K.; Jain, S.C. A genetic algorithm-based solution to optimal tolerance synthesis of mechanical assemblies with alternative manufacturing processes: Focus on complex tolerancing problems. Int. J. Prod. Res. 2004, 42, 5185–5215. [Google Scholar] [CrossRef]
- Etienne, A.; Dantan, J.Y.; Qureshi, J.; Siadat, A. Variation management by functional tolerance allocation and manufacturing process selection. Int. J. Interact. Des. Manuf. (IJIDeM) 2008, 2, 207–218. [Google Scholar] [CrossRef]
- Wu, F.; Dantan, J.Y.; Etienne, A.; Siadat, A.; Martin, P. Improved algorithm for tolerance allocation based on Monte Carlo simulation and discrete optimization. Comput. Ind. Eng. 2009, 56, 1402–1413. [Google Scholar] [CrossRef]
- Sivakumar, K.; Balamurugan, C.; Ramabalan, S. Optimal Concurrent Dimensional and Geometrical Tolerancing Based on Evolutionary Algorithms. In Proceedings of the 2009 World Congress on Nature & Biologically Inspired Computing (NaBIC), Coimbatore, India, 9–11 December 2009; pp. 300–305. [Google Scholar]
- Sivakumar, K.; Balamurugan, C.; Ramabalan, S. Concurrent multi-objective tolerance allocation of mechanical assemblies considering alternative manufacturing process selection. Int. J. Adv. Manuf. Technol. 2011, 53, 711–732. [Google Scholar] [CrossRef]
- Sivasubramanian, R.; Siva Kumar, M. Optimum tolerance synthesis with process and machine selection for minimizing manufacturing cost and machining time by using genetic algorithm. J. Manuf. Technol. Res. 2010, 2, 93–108. [Google Scholar]
- Kim, C.B.; Pulat, P.S.; Foote, B.L.; Lee, D.H. Least cost tolerance allocation and bicriteria extension. Int. J. Comput. Integr. Manuf. 1999, 12, 418–426. [Google Scholar] [CrossRef]
- Gadallah, M.H. Least sensitive tolerance allocation. Int. J. Qual. Eng. Technol. 2011, 2, 344–356. [Google Scholar] [CrossRef]
- Lee, W.J.; Woo, T.C. Optimum selection of discrete tolerances. ASME J. Mech Transm. Autom. Des. 1989, 111, 243–251. [Google Scholar] [CrossRef]
- Feng, C.X.; Kusiak, A. Robust tolerance synthesis with the design of experiments approach. J. Manuf. Sci. Eng. 2000, 122, 520–528. [Google Scholar] [CrossRef]
- Kumar, M.S.; Stalin, B. Optimum tolerance synthesis for complex assembly with alternative process selection using Lagrange multiplier method. Int. J. Adv. Manuf. Technol. 2009, 44, 405–411. [Google Scholar] [CrossRef]
- Armillotta, A. Concurrent optimization of dimensions and tolerances on structures and mechanisms. Int. J. Adv. Manuf. Technol. 2020, 111, 3141–3157. [Google Scholar] [CrossRef]
- Korbi, A.; Tlija, M.; Louhichi, B. Computer-Aided Design/Tolerancing Integration: A Novel Tolerance Analysis Model of Assemblies with Composite Positional Defects and Deformations of Nonrigid Parts. J. Manuf. Sci. Eng. 2021, 143, 081012. [Google Scholar] [CrossRef]
- Singh, P.K.; Jain, S.C.; Jain, P.K. A genetic algorithm based solution to optimum tolerance synthesis of mechanical assemblies with alternate manufacturing processes—Benchmarking with the exhaustive search method using the Lagrange multiplier. Proc. Inst. Mech. Eng. Part B J. Eng. Manuf. 2004, 218, 765–778. [Google Scholar] [CrossRef]
- Chase, K.W. Minimum Cost Tolerance Allocation; ADCATS Report No. 99-5; Department of Mechanical Engineering, Bringham Young University: Provo, UT, USA, 1999. [Google Scholar]
- Speckhart, F.H. Calculation of tolerance based on a minimum cost approach. ASME J. Eng. Ind. 1972, 94, 447–453. [Google Scholar] [CrossRef]
- Sutherland, G.H.; Roth, B. Mechanism design: Accounting for manufacturing tolerances and costs in function generating problems. ASME J. Eng. Ind. 1975, 97, 283–286. [Google Scholar] [CrossRef]
- Spotts, M.F. How to use wider tolerances, safely, in dimensioning stacked assemblies. Mach. Des. 1978, 50, 60–63. [Google Scholar]
- Chase, K.W.; Greenwood, W.H. Design issues in mechanical tolerance analysis. Manuf. Rev. 1988, 1, 50–59. [Google Scholar]
- Ostwald, P.F.; Huang, J. A method for optimal tolerance selection. ASME J. Eng. Ind. 1977, 99, 558–565. [Google Scholar] [CrossRef]
- Sampath Kumar, R.; Alagumurthi, N.; Ramesh, R. Integrated total cost and Tolerance Optimization with Genetic Algorith. Int. J. Comput. Intell. Syst. 2010, 3, 325–333. [Google Scholar] [CrossRef]
- Rao, Y.S.; Rao CS, P.; Janardhana, G.R.; Vundavilli, P.R. Simultaneous tolerance synthesis for manufacturing and quality using evolutionary algorithms. Int. J. Appl. Evol. Comput. (IJAEC) 2011, 2, 1–20. [Google Scholar] [CrossRef][Green Version]
- Geetha, K.; Ravindran, D.; Kumar, M.S.; Islam, M.N. Multi-objective optimization for optimum tolerance synthesis with process and machine selection using a genetic algorithm. Int. J. Adv. Manuf. Technol. 2013, 67, 2439–2457. [Google Scholar] [CrossRef]
- Liu, S.G.; Jin, Q. Closed-form optimal tolerance for minimum manufacturing cost and quality loss cost. Adv. Mater. Res. 2013, 655, 2084–2087. [Google Scholar] [CrossRef]
- Hallmann, M.; Schleich, B.; Wartzack, S. From tolerance allocation to tolerance-cost optimization: A comprehensive literature review. Int. J. Adv. Manuf. Technol. 2020, 107, 4859–4912. [Google Scholar] [CrossRef]
- Wu, Z.; Elmaraghy, W.H.; ElMaraghy, H.A. Evaluation of cost-tolerance algorithms for design tolerance analysis and synthesis. Manuf. Rev. 1988, 1, 168–179. [Google Scholar]
- Choi, H.G.R.; Park, M.H.; Salisbury, E. Optimal tolerance allocation with loss functions. J. Manuf. Sci. Eng. 2000, 122, 529–535. [Google Scholar] [CrossRef]
- Chou, C.Y.; Chang, C.L. Minimum-loss assembly tolerance allocation by considering product degradation and time value of money. Int. J. Adv. Manuf. Technol. 2001, 17, 139–146. [Google Scholar] [CrossRef]
- Ye, B.; Salustri, F.A. Simultaneous tolerance synthesis for manufacturing and quality. Res. Eng. Des. 2003, 14, 98–106. [Google Scholar] [CrossRef]
- Gopalakrishnan, B.; Jaraiedi, M.; Iskander, W.H.; Ahmad, A. Tolerance synthesis based on Taguchi philosophy. Int. J. Ind. Syst. Eng. 2007, 2, 311–326. [Google Scholar] [CrossRef]
- Zhang, C.; Wang HP, B. Integrated tolerance optimisation with simulated annealing. Int. J. Adv. Manuf. Technol. 1993, 8, 167–174. [Google Scholar] [CrossRef]
- Ming, X.G.; Mak, K.L. Intelligent approaches to tolerance allocation and manufacturing operations selection in process planning. J. Mater. Process. Technol. 2001, 117, 75–83. [Google Scholar] [CrossRef]
- Li, Z.; Izquierdo, L.E.; Kokkolaras, M.; Hu, S.J.; Papalambros, P.Y. Multiobjective optimization for integrated tolerance allocation and fixture layout design in multistation assembly. J. Manuf. Sci. Eng. 2008, 130. [Google Scholar] [CrossRef]
- Hung, T.C.; Chan, K.Y. Multi-objective design and tolerance allocation for single-and multi-level systems. J. Intell. Manuf. 2013, 24, 559–573. [Google Scholar] [CrossRef]
- Barari, A. Tolerance allocation based on the minimum deformation zone of finite element structural frame analysis. Comput.-Aided Des. Appl. 2013, 10, 629–641. [Google Scholar] [CrossRef]
- Rao, R.V.; More, K.C. Advanced optimal tolerance design of machine elements using teaching-learning-based optimization algorithm. Prod. Manuf. Res. 2014, 2, 71–94. [Google Scholar] [CrossRef]
- Ramesh Kumar, L.; Padmanaban, K.P.; Balamurugan, C. Optimal tolerance allocation in a complex assembly using evolutionary algorithms. Int. J. Simul. Model. (IJSIMM) 2016, 15. [Google Scholar] [CrossRef]
- Nagarajan, L.; Mahalingam, S.K.; Gurusamy, S.; Dharmaraj, V.K. Solution for bi-objective single row facility layout problem using artificial bee colony algorithm. Eur. J. Ind. Eng. 2018, 12, 252–275. [Google Scholar] [CrossRef]
- Vignesh Kumar, D.; Ravindran, D.; Lenin, N.; Siva Kumar, M. Tolerance allocation of complex assembly with nominal dimension selection using Artificial Bee Colony algorithm. Proc. Inst. Mech. Eng. Part C J. Mech. Eng. Sci. 2019, 233, 18–38. [Google Scholar] [CrossRef]
- Rezaei Aderiani, A.; Hallmann, M.; Wärmefjord, K.; Schleich, B.; Söderberg, R.; Wartzack, S. Integrated Tolerance and Fixture Layout Design for Compliant Sheet Metal Assemblies. Appl. Sci. 2021, 11, 1646. [Google Scholar] [CrossRef]
- Kumar, M.S.; Islam, M.N.; Lenin, N.; Kumar, D.V. Optimum tolerance synthesis for complex assembly with alternative process selection using bottom curve follower approach. Int. J. Eng. 2009, 3, 380–402. [Google Scholar]
- Adalı, E.A.; Tuş, A. Hospital site selection with distance-based multi-criteria decision-making methods. Int. J. Healthc. Manag. 2021, 14, 534–544. [Google Scholar] [CrossRef]
- Carfagni, M.; Governi, L.; Fhiesi, F. Development of a Method for Automatic Tolerance Allocation. In Proceedings of the XII ADM International Conference, Rimini, Italy, 5–7 September 2001. [Google Scholar]
- Chen, M.S. Optimising tolerance allocation for mechanical components correlated by selective assembly. Int. J. Adv. Manuf. Technol. 1996, 12, 349–355. [Google Scholar] [CrossRef]
- Diplaris, S.C.; Sfantsikopoulos, M.M. Cost–Tolerance function. A new approach for cost optimum machining accuracy. Int. J. Adv. Manuf. Technol. 2000, 16, 32–38. [Google Scholar] [CrossRef]
- Dong, Z.; Hu, W.; Xue, D. New production cost-tolerance models for tolerance synthesis. ASME J. Eng. Ind. 1994, 116, 199–206. [Google Scholar] [CrossRef]
- Janakiraman, V.; Saravanan, R. Concurrent optimization of machining process parameters and tolerance allocation. Int. J. Adv. Manuf. Technol. 2010, 51, 357–369. [Google Scholar] [CrossRef]
- Kumar, M.S.; Kannan, S.M.; Jayabalan, V. A new algorithm for optimum tolerance allocation of complex assemblies with alternative processes selection. Int. J. Adv. Manuf. Technol. 2009, 40, 819–836. [Google Scholar] [CrossRef]
- Loosli, B.G. Manufacturing Tolerance Cost Minimization Using Discrete Optimization for Alternate Process Selection. Master’s Thesis, Brigham Young University, Provo, UT, USA, 1987. [Google Scholar]
- Nagarwala, M.Y.; Simin Pulat, P.; Raman, S. A slope-based method for least cost tolerance allocation. Concurr. Eng. 1995, 3, 319–328. [Google Scholar] [CrossRef]
- Prabhaharan, G.; Asokan, P.; Rajendran, S. Sensitivity-based conceptual design and tolerance allocation using the continuous ants colony algorithm (CACO). Int. J. Adv. Manuf. Technol. 2005, 25, 516–526. [Google Scholar] [CrossRef]
- Rao, S.S.; Wu, W. Optimum tolerance allocation in mechanical assemblies using an interval method. Eng. Optim. 2005, 37, 237–257. [Google Scholar] [CrossRef]
- Savage, G.J.; Tong, D.; Carr, S.M. Optimal mean and tolerance allocation using conformance-based design. Qual. Reliab. Eng. Int. 2006, 22, 445–472. [Google Scholar] [CrossRef]
- Singh, P.K.; Jain, S.C.; Jain, P.K. Advanced optimal tolerance design of mechanical assemblies with interrelated dimension chains and process precision limits. Comput. Ind. 2005, 56, 179–194. [Google Scholar] [CrossRef]
- Sivakumar, K.; Balamurugan, C.; Ramabalan, S. Evolutionary multi-objective concurrent maximisation of process tolerances. Int. J. Prod. Res. 2012, 50, 3172–3191. [Google Scholar] [CrossRef]
- Zhang, C.; Wang, H.P. Robust design of assembly and machining tolerance allocations. IIE Trans. 1998, 30, 17–29. [Google Scholar] [CrossRef]
- Jeang, A.; Chang, C.L. Combined robust parameter and tolerance design using orthogonal arrays. Int. J. Adv. Manuf. Technol. 2002, 19, 442–447. [Google Scholar] [CrossRef]
- Huang, Y.M.; Shiau, C.S. Optimal tolerance allocation for a sliding vane compressor. J. Mech. Des. 2006, 128, 98–107. [Google Scholar] [CrossRef]
Publisher’s Note: MDPI stays neutral with regard to jurisdictional claims in published maps and institutional affiliations. |
© 2021 by the authors. Licensee MDPI, Basel, Switzerland. This article is an open access article distributed under the terms and conditions of the Creative Commons Attribution (CC BY) license (https://creativecommons.org/licenses/by/4.0/).