Article

Green Shipping—Multifunctional Marine Scrubbers for Emission Control: Silencing Effect

1
Department of Engineering and Architecture, University of Trieste, Via Alfonso Valerio 6, 34127 Trieste, Italy
2
Maritime Safety Research Centre, Department of Naval Architecture, Ocean and Marine Engineering, University of Strathclyde, Glasgow G4OLZ, UK
3
Department of Chemical and Pharmaceutical Sciences, University of Trieste, Via Licio Giorgieri 1, 34127 Trieste, Italy
*
Author to whom correspondence should be addressed.
Appl. Sci. 2021, 11(19), 9079; https://doi.org/10.3390/app11199079
Submission received: 17 August 2021 / Revised: 24 September 2021 / Accepted: 25 September 2021 / Published: 29 September 2021

Abstract

:

Featured Application

The presented investigation indicates the feasibility of an a priori numerical approach aimed at designing a multifunctional scrubber that includes muffler functionality within the product. The integration between this component along the exhaust line, for example scrubbers and silencers, allows for space to be saved onboard ships. The numerical investigation allows to study the optimized acoustic properties of marine scrubbers during the design phase while reducing the number of the prototypes that need to be constructed and tested. Considering the large dimensions of a scrubber–silencer design allows for time and money to be saved.

Abstract

Scrubber systems abate the sulphur oxide emissions of engines when cheap fuel oils that are high in sulphur content are employed as combustibles. However, the ships with these voluminous devices installed on board is space demanding. This work analyses the feasibility of incorporating the acoustic abatement of the exhaust gas noise functionality into the scrubber design to provide a combined scrubber–silencer system. For this purpose, a finite element analysis is performed on a simple expansion chamber, which is assessed using both analytical and experimental data. The transmission loss is the acoustic parameter chosen in this work. The numerical model depicts a good correlation with the transmission loss measured on a model scale scrubber. Finally, scrubber geometry modifications alter the transmission loss, changing and/or enhancing its featuring. These abilities indicate the feasibility to confer to scrubber silencing effects.

1. Introduction

Although maritime transport accounts for approximately 10–15% of global sulphur (SOx) and nitrogen (NOx) oxide emissions, the volume of seaborne trade has increased by about 3% annually over the past 50 years or so, accounting for about 80–85% of world trade by volume [1]. This has led to increasing concerns about the global impact of maritime emissions, and, consistently, the IMO (International Maritime Organization) has restricted the limits imposed by MARPOL 73/78 Regulations [2,3] on ship emissions, specifically those of SOx [3] and NOx [2].
EGR (exhaust gas recirculation) and SCR (selective catalytic reduction) systems are recognized as effective technologies for the control of marine NOx emissions [1,4]. However, the former solution increases particulate matter emissions and fuel consumption by about 4% [5], making SCR the preferred option.
Different strategies allow for SOx emissions to be reduced [6]: alternative fuels (e.g., LNG—liquefied natural gas), alternative energy sources (e.g., fuel cells), and conventional fuels with low a sulphur content (e.g., VLSFO—very low sulphur fuel oil).
Since January 2020, for ships using conventional fuels, the above-quoted regulations have made the use of VLSFO mandatory, as its sulphur content is lower than 0.5 wt%. Moreover, to sail in ECAs (emission control areas), ULSFO (ultra low sulphur fuel oil) must be used, as the sulphur content limit in fuels has been pushed down to 0.1 wt% in these areas. Whereas the adoption of alternative fuels or onboard energy sources represents, besides the costs, the burden of entire propulsion system refitting, the use of low sulphur content combustibles significantly impacts the total operating costs of a ship, with over 60% of them being associated with the fuel. Despite COVID-19 resulting in an extreme reduction in oil prices, prices of USD 365, USD 472, USD 515, and USD 520 per ton were reported for HSFO (high sulphur fuel oil), VLSFO, ULSFO, and MGO (marine gas oil), respectively, at the Rotterdam/Antwerp hub on 22 February 2021 [7], indicating that use of HSFO may represent higher savings compared to other fuels. Accordingly, an alternative solution is to install a scrubber as an emission abatement device, ensuring compliance with SOx regulations. Scrubbers represent a viable solution [8] and show a lower climate impact than low sulphur fuels [9].
The installation of both SCR and scrubber systems onboard ships could represent a reliable technical solution to satisfy the limits imposed on both NOx and SOx emissions; however, this solution is hardly applicable because of space limitations, especially for existing ships [10]. Indeed, pollution control devices are usually installed in the funnel and are often large in size, so integrating such systems with other exhaust line components, such as silencers, becomes mandatory in order to save space [1].
What is also remarkable is the importance of controlling and minimizing exhausted gas noise. Several regulations [11,12] limit the perceived noise level at ship decks and have prescribed distances from vessels. As such, the integration of pollution control devices and silencers can represent a smart way to satisfy these regulations by saving space along the exhaust line.
Concerning the acoustic performances of pollution control devices such as scrubbers, in the literature, only a notable example of an SCR converter [1] is present, and a patent for a marine scrubber with acoustic properties is deposited [13]. On the contrary, the acoustic performance of mufflers has been deeply studied [14,15,16,17,18].
The present work is a part of a research project (Project ABE: see funding) oriented to integrate different functionalities within emission control systems and intending to develop a methodology to achieve compact, efficient, and cost-effective scrubber-based marine engine exhaust emission systems. In the first instance, the integration of silencing effects within scrubber technology is addressed, and a FEM (finite element method) model that can predict the efficiency of a scrubber–silencer is developed.
In this work, transmission loss (TL) was used as an acoustic parameter to evaluate the acoustic performance of a model-scale scrubber; TL is a property of the muffler only, and it can be easily evaluated with models available in the literature [15].
Here, the FEM model used to evaluate the TL is compared with both analytical and experimental data.

2. Materials and Methods

The following sections first outline the theoretical aspects of the experimental measurement techniques and numerical methods used to evaluate TL. Then, we present the experimental set-up used to measure the TL of both a simple expansion chamber and a model-scale scrubber; finally, we address the case studies analysed in this work.

2.1. Transmission Loss Measurements and Calculations

In general, the TL of a component can be calculated with the following equation when considering an anechoic termination [16]:
TL = 10 log 10 W i W t     ,
where Wi and Wt are the sound power of the incident and the transmitted waves, respectively.

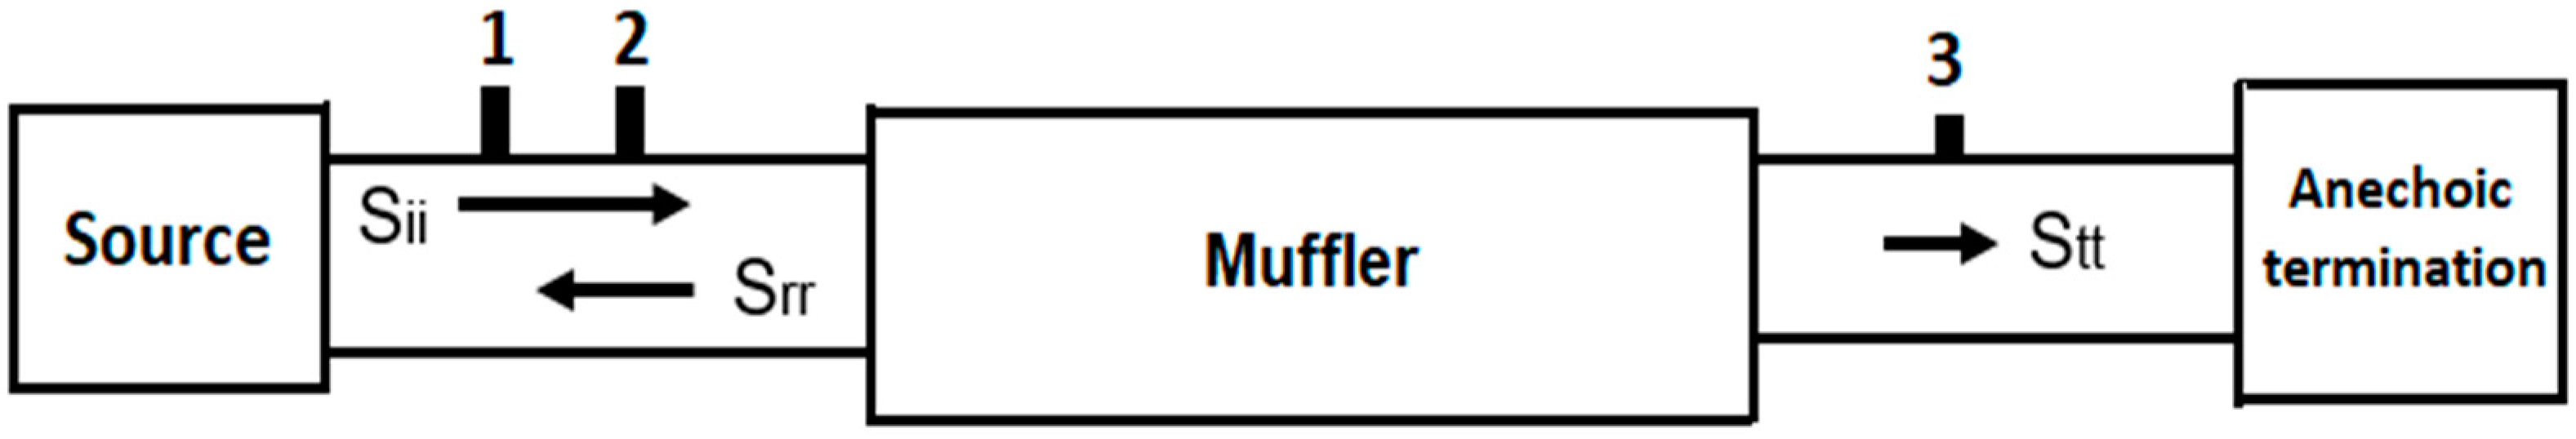
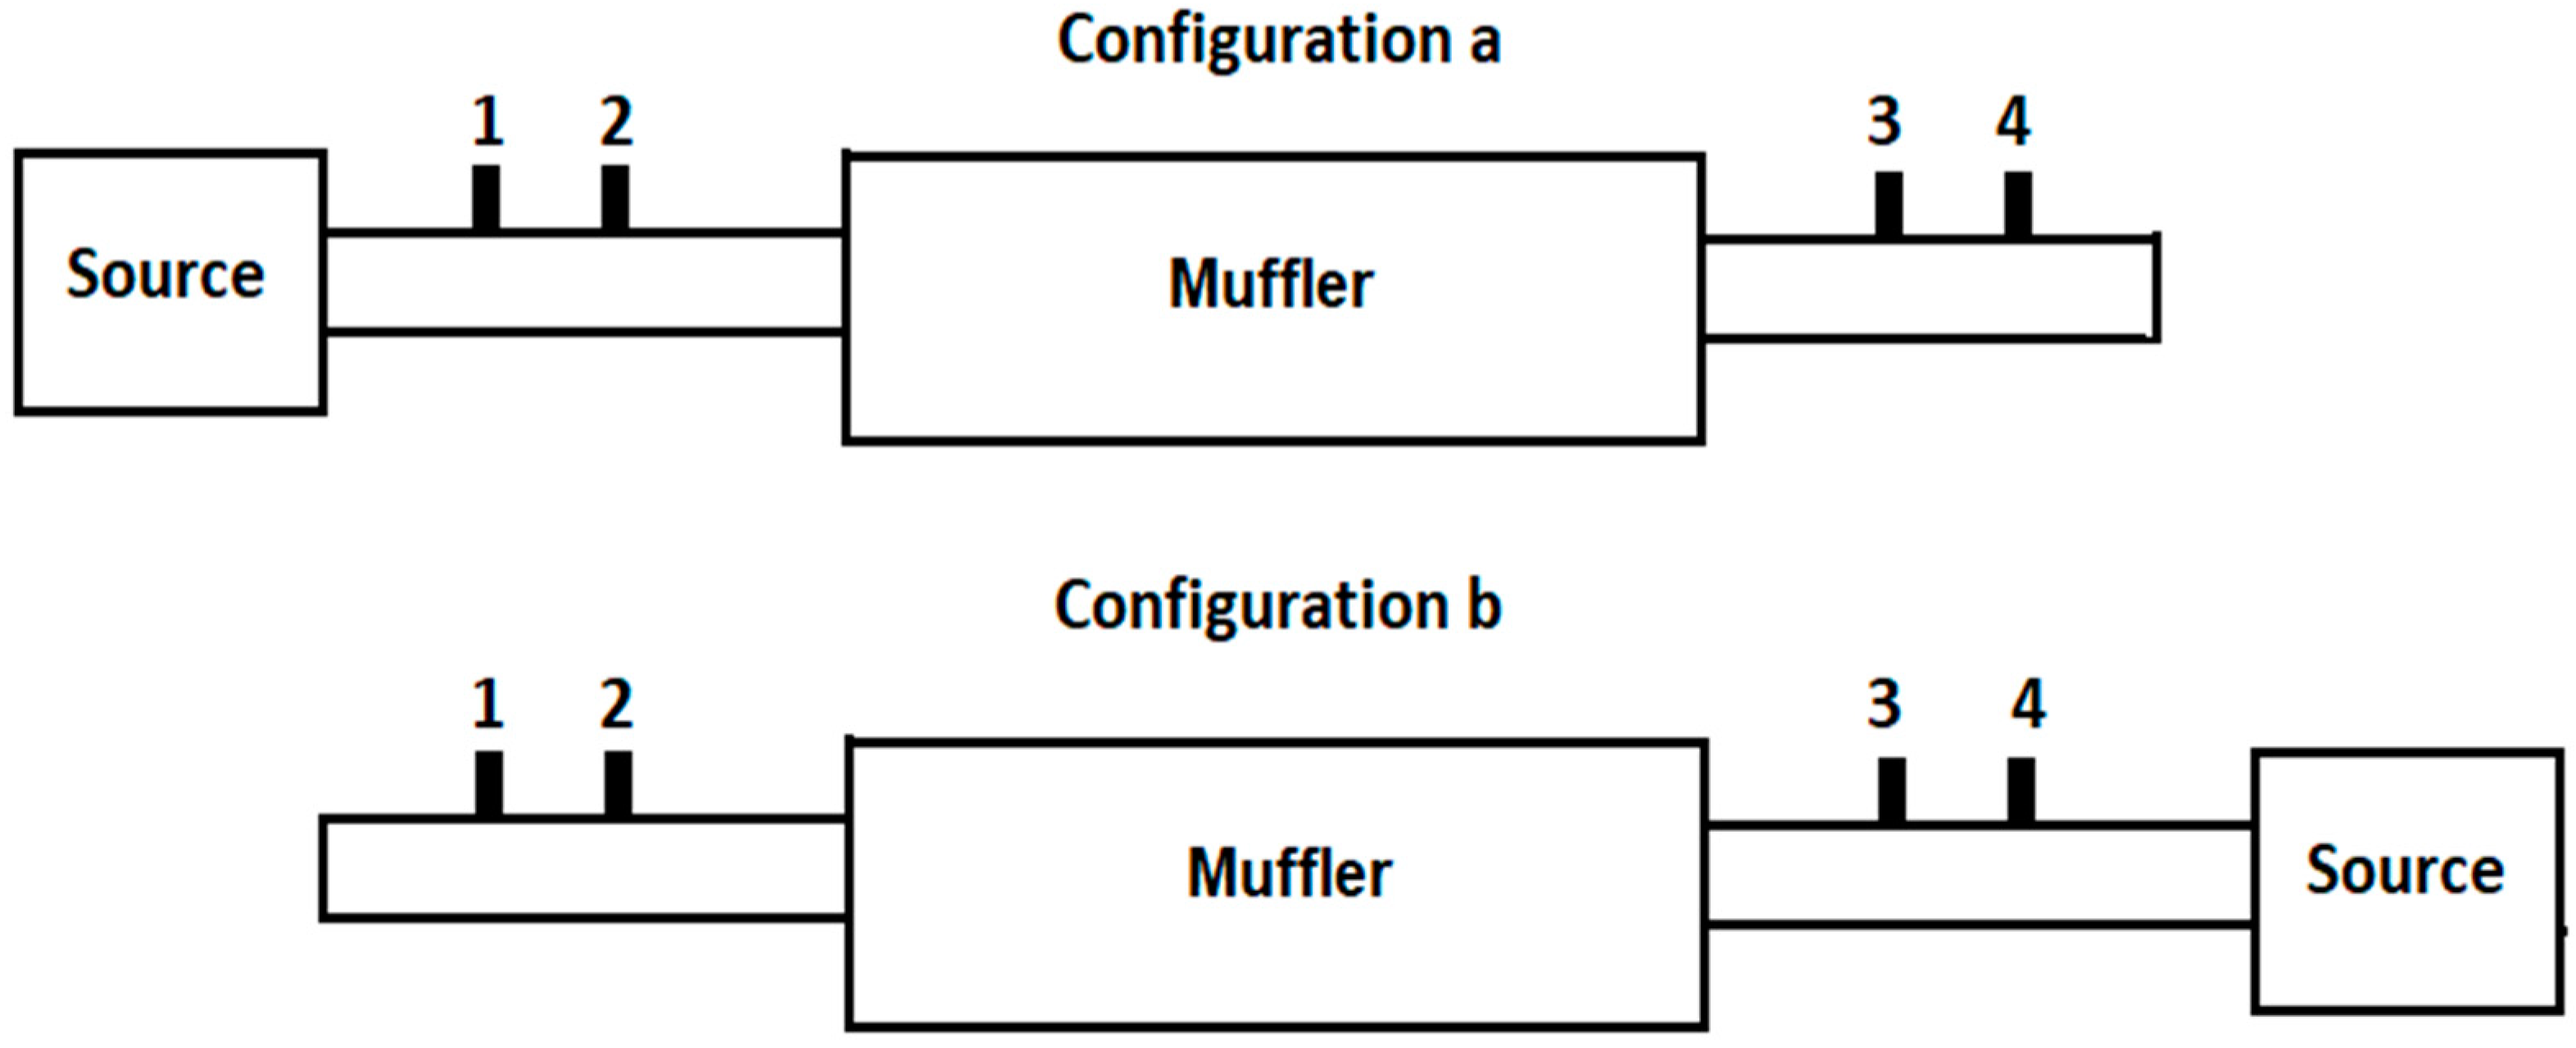
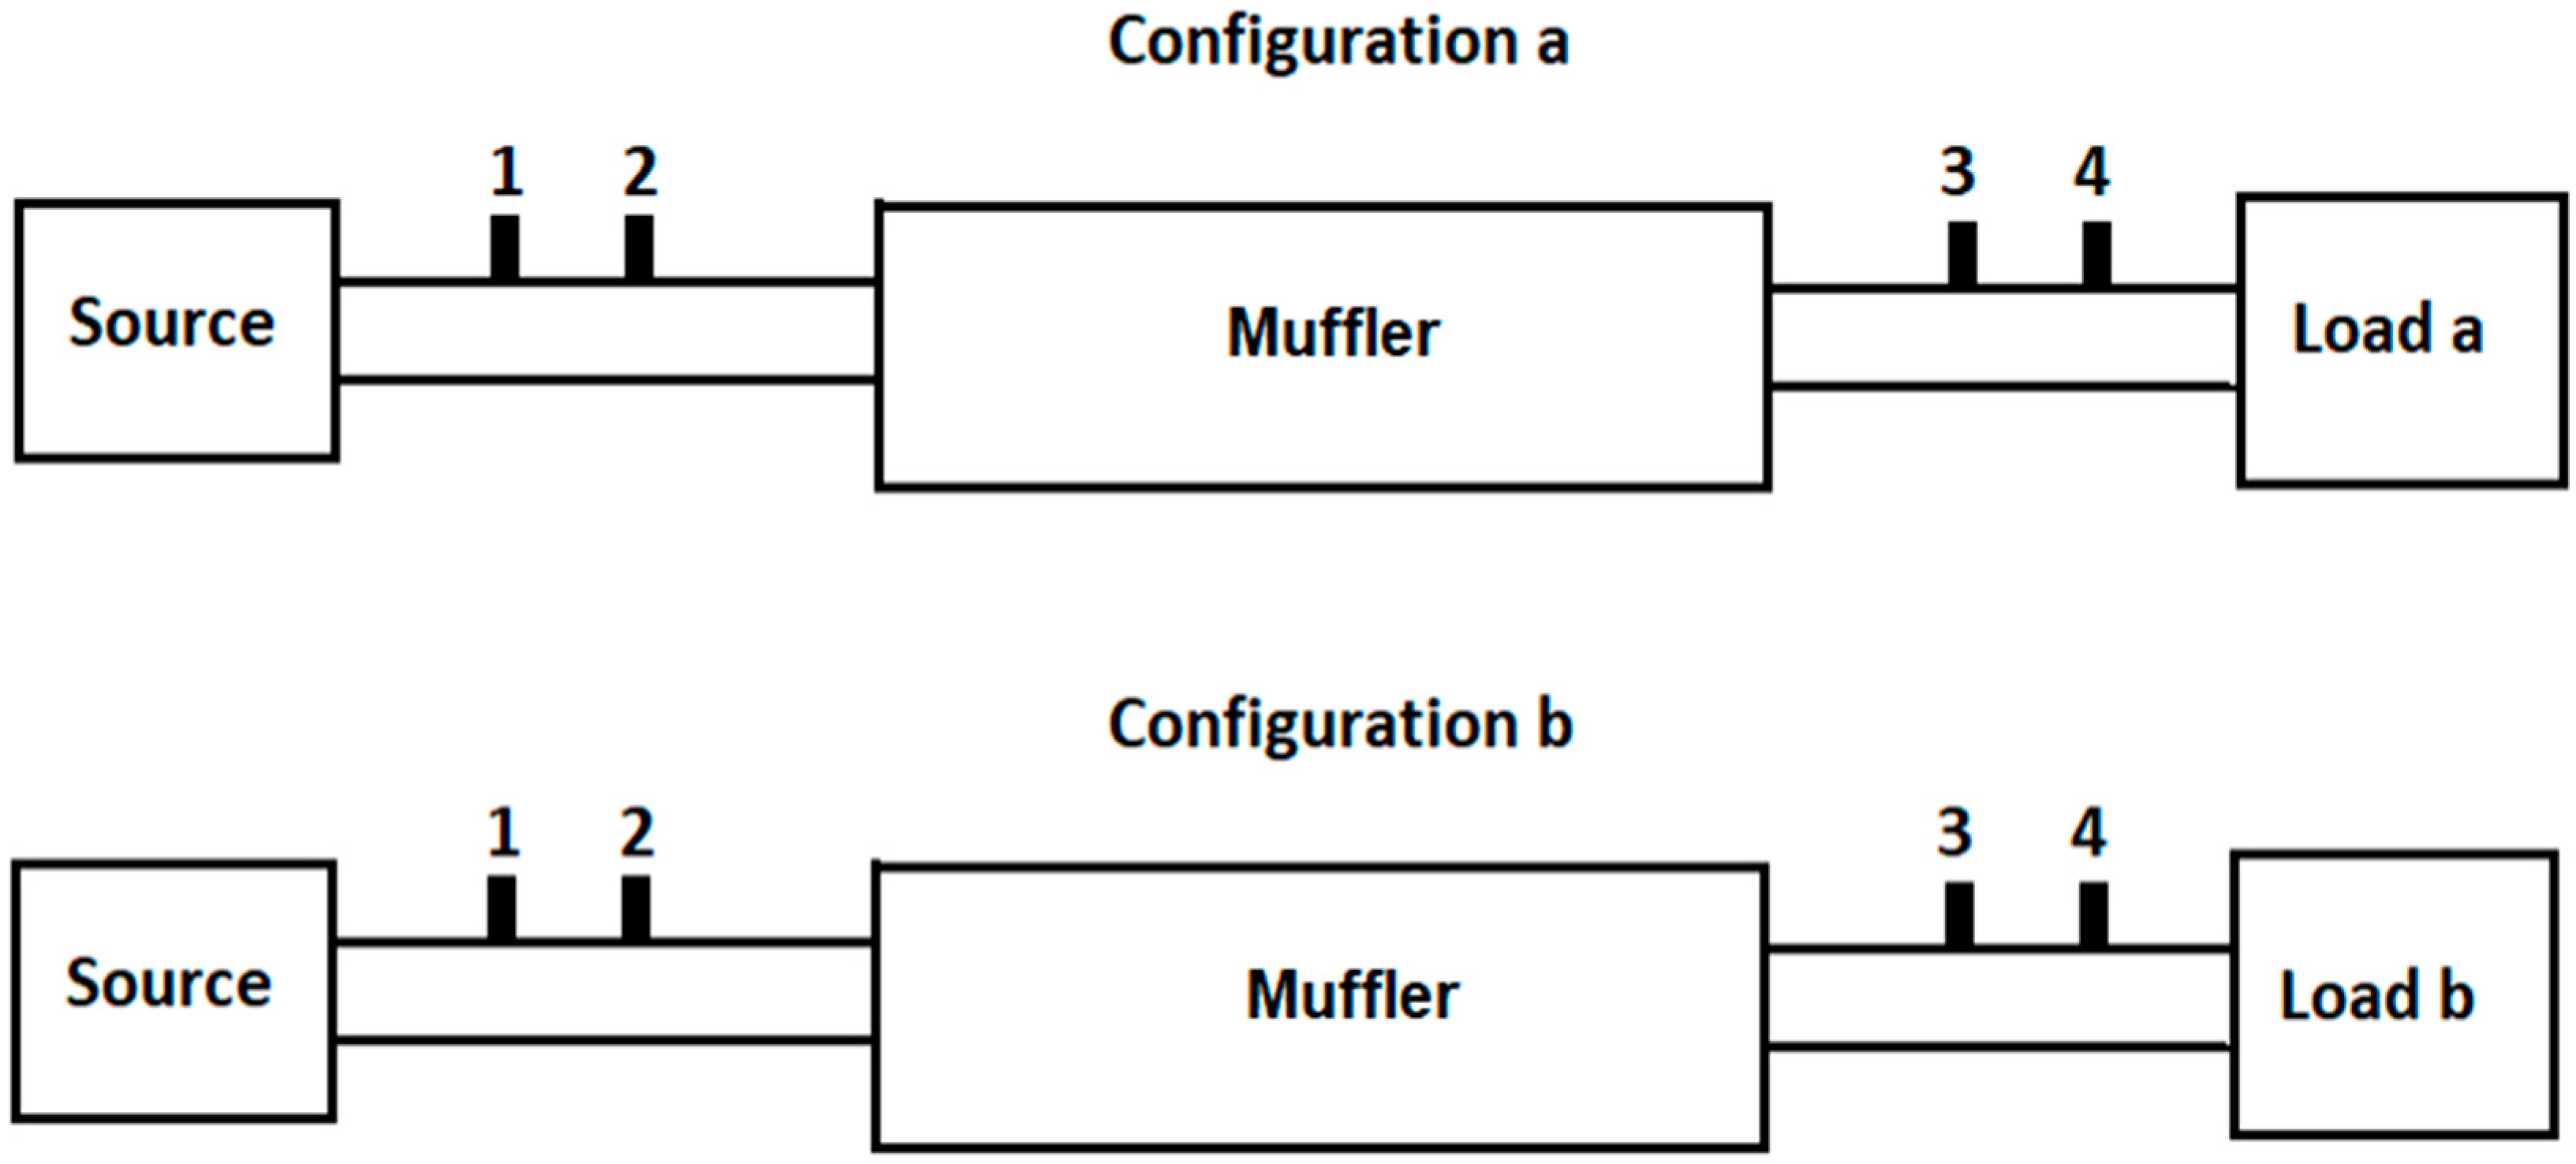
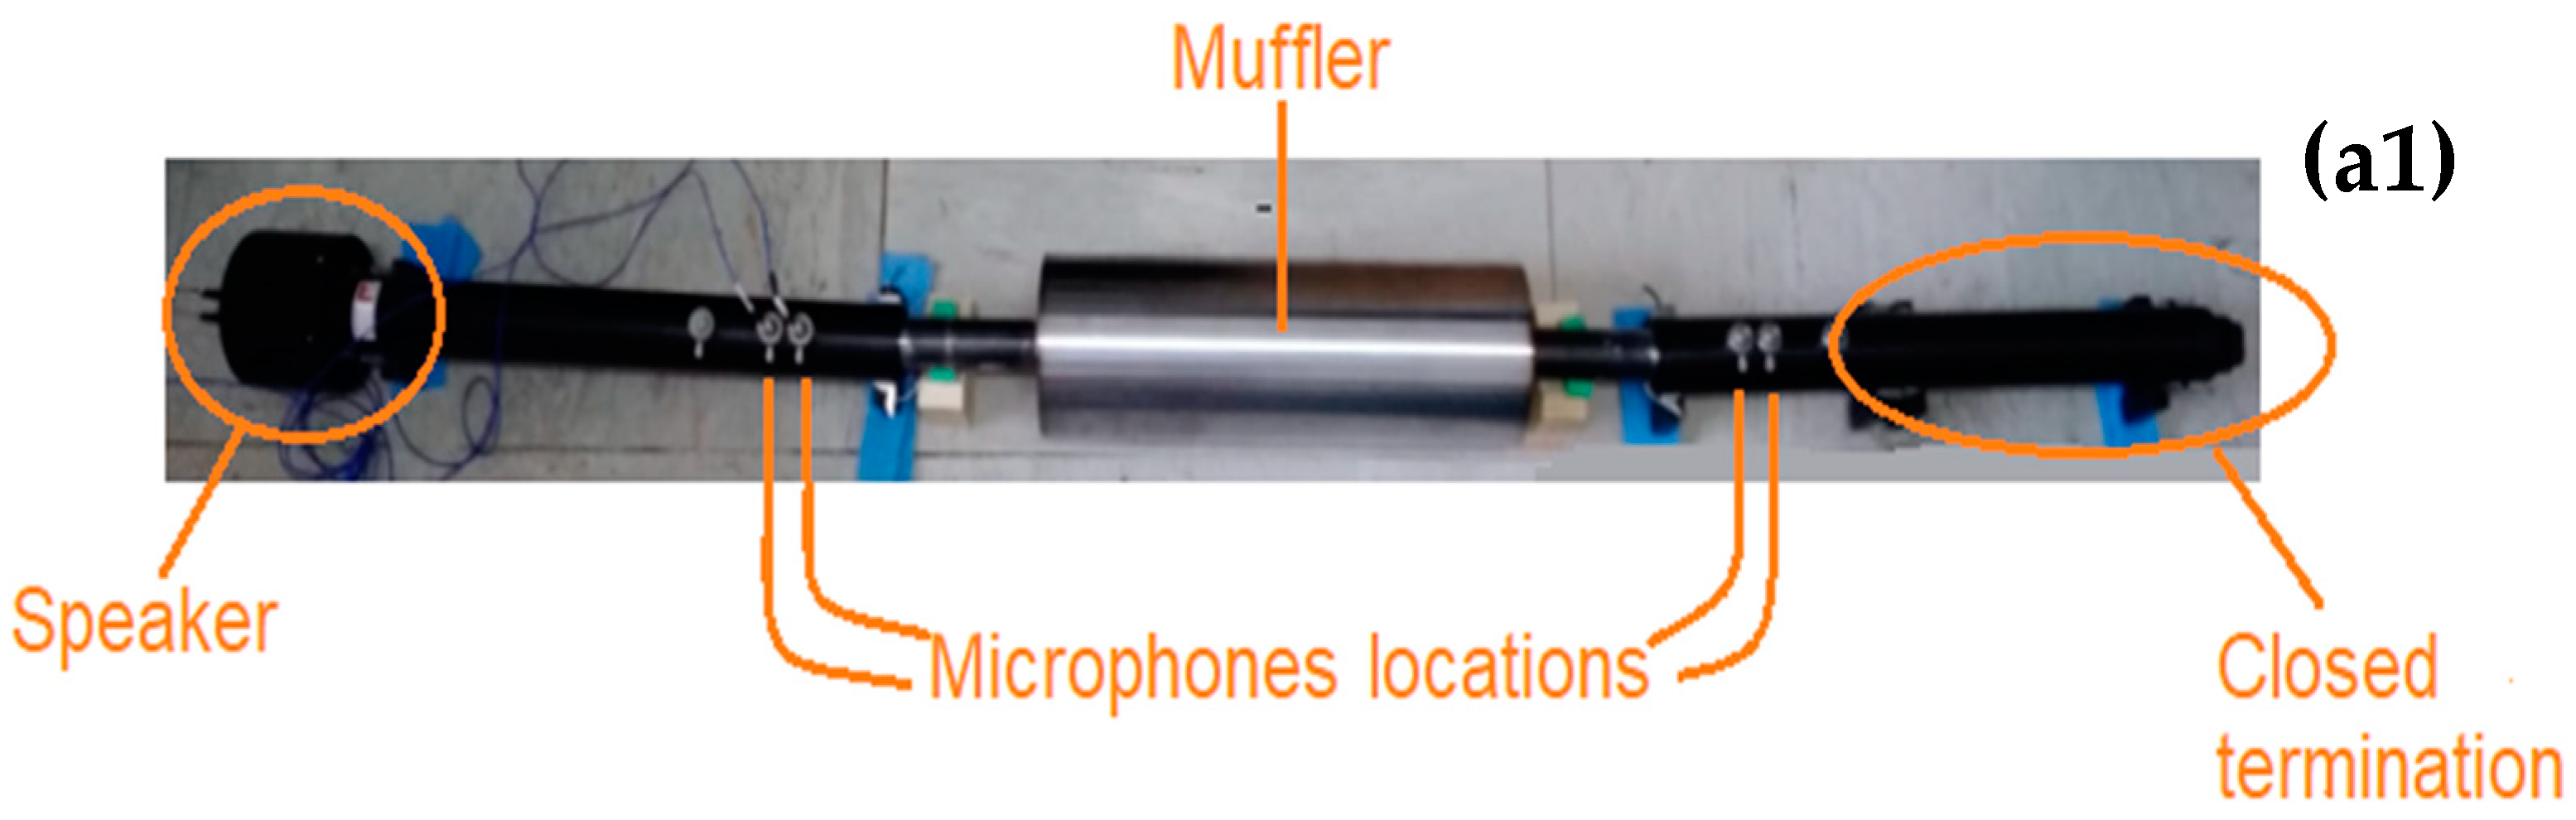
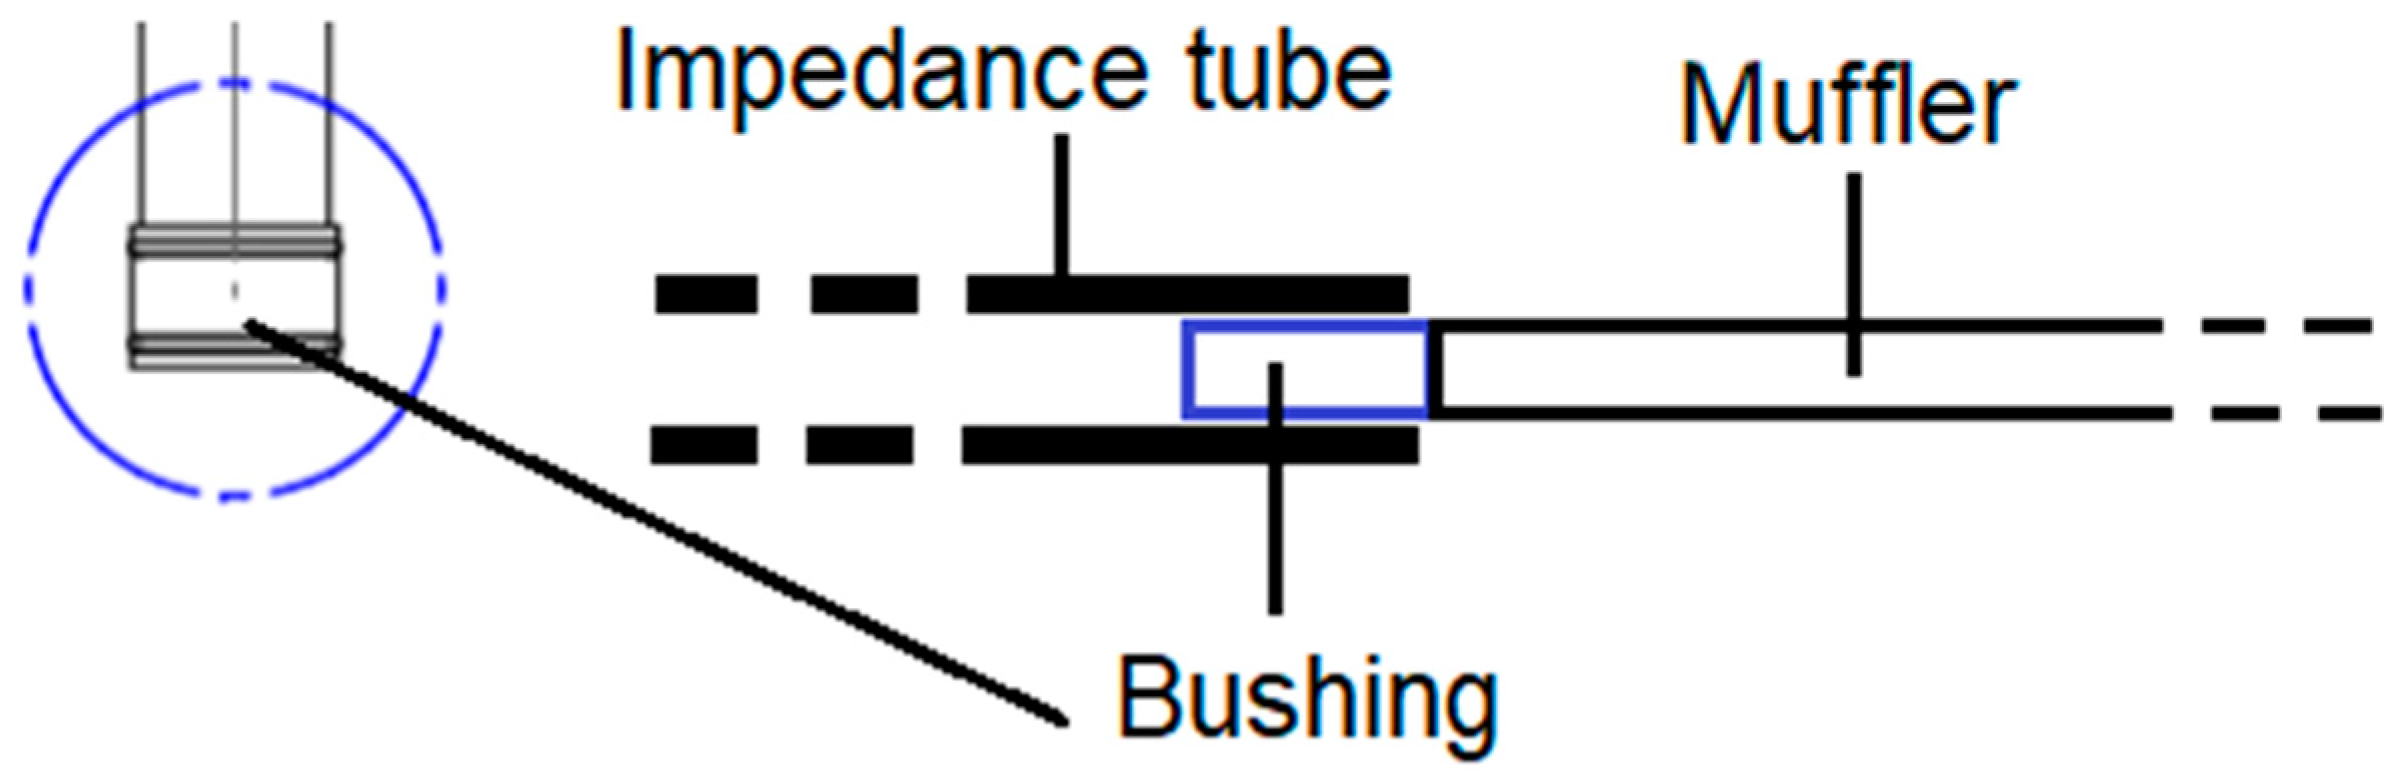
2.1.1. Experimental Techniques for Transmission Loss Measurements

Three distinct techniques allow the TL to be measured for mufflers using an impedance tube: the decomposition method, the two-source method, and the two-load method.
The decomposition method [19,20] properly measures the acoustic properties in ducts [21] using a measurement set-up as depicted in Figure 1, where 1, 2, and 3 represent microphone locations. Sii, Srr, and Stt represent the auto-spectra of the incident and the reflected and transmitted sound waves, respectively. The auto-spectra are defined as the product between a function and its complex conjugate; they provide the power distribution of the analyzed signal as a function of frequency.
Considering a plane wave propagation and using two microphones at locations 1 and 2, the sound pressure can be decomposed into its incident and reflected waves. The microphone at location 3 directly measures the transmitted sound pressure. The decomposition theory provides an expression for the auto-spectrum Sii of the incident wave, so the sound power of the incident and transmitted waves can be derived, and the TL can be expressed as follows [15]:
TL = 20 log 10 p i p t   +   10 log 10 S i S o       ,
where pi and pt are the rms of the sound pressure of the incident and transmitted waves, respectively, and Si and So are the cross-section area of the muffler inlet and outlet pipes, respectively.
The major drawback of the decomposition method is that a fully anechoic termination is difficult to reproduce in experiments, affecting the reliability of the TL measurement.
A muffler can also be modeled using the so-called four-pole parameters method [22]. The four parameters (A, B, C, and D) relate the inlet pressure (pi) and velocity (vi) to the respective outlet values (po, vo), assuming a plane wave propagation.
[ p i v i ] = [ A B C D ] [ p o v o ]       ,
Two methods are available to calculate the four-pole parameters exploiting the transfer-matrix approach: the two-source method and the two-loads method [15].
When using the two-sources method, four microphones are needed. Consequently, the test has to be performed in two configurations to have the data required for TL parameter calculation according to Equation (4). In Figure 2 the two configurations (a and b) are reported. They are implemented by changing the source position while keeping the other pipe termination open. The numbers 1, 2, 3, and 4 represent the microphone locations.
The muffler TL can be calculated as follows [16,23]:
TL = 20 log 10 { 1 2 | A 23 + B 23 ρ c + ρ c   C 23 + D 23 | } + 10 log 10 S i S o       ,
where ρ is the fluid density, c is the speed of sound in the fluid medium, and A23, B23, C23, and D23 are the four-pole parameters between microphones 2 and 3. The specific expressions for the parameters are given in [15].
Figure 3 shows the set-up of the two-load method; it requires two configurations and leads to the same results as the two-source process by changing the outlet impedance (expressed as load a and b in the picture) instead of the source location, resulting in the TL being calculated with Equation (4) [14]. Additionally, in Figure 3, numbers 1, 2, 3, and 4 denote the microphones locations.
Different strategies allow the termination impedance to be changed: two terminations with different lengths, terminations with and without absorbing material, or even a closed and an open end. Of course, if the two loads are very similar, the results will be unstable.
In this work, the two-loads method suits the experimental layout, as a fully anechoic termination is difficult to build, and the impedance tube that used was designed to change the tube’s end and not the source position.

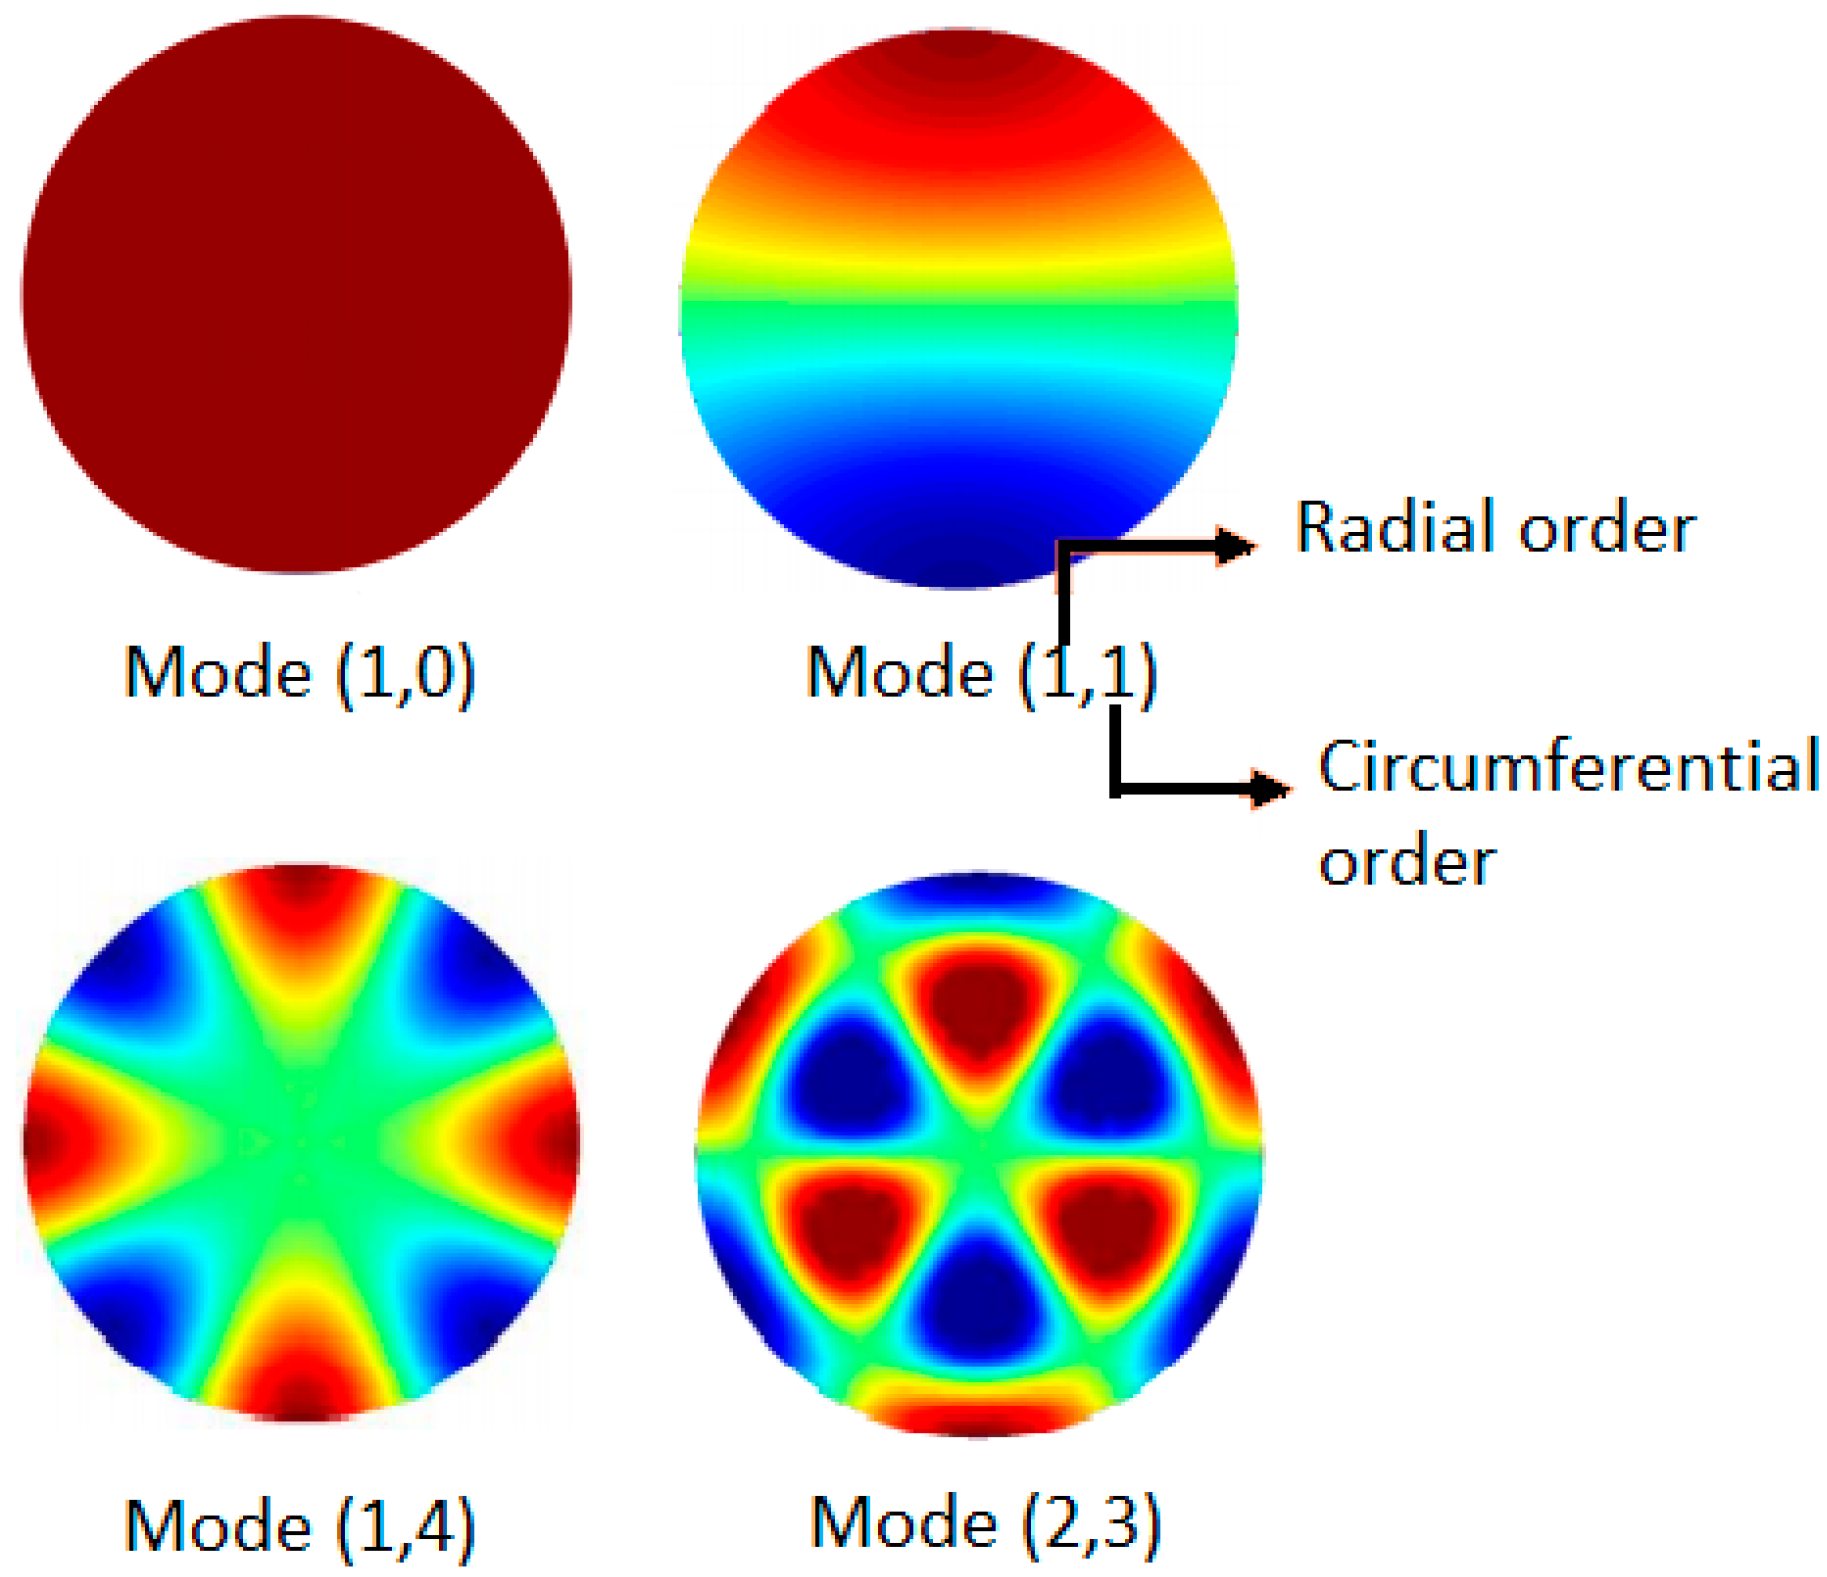
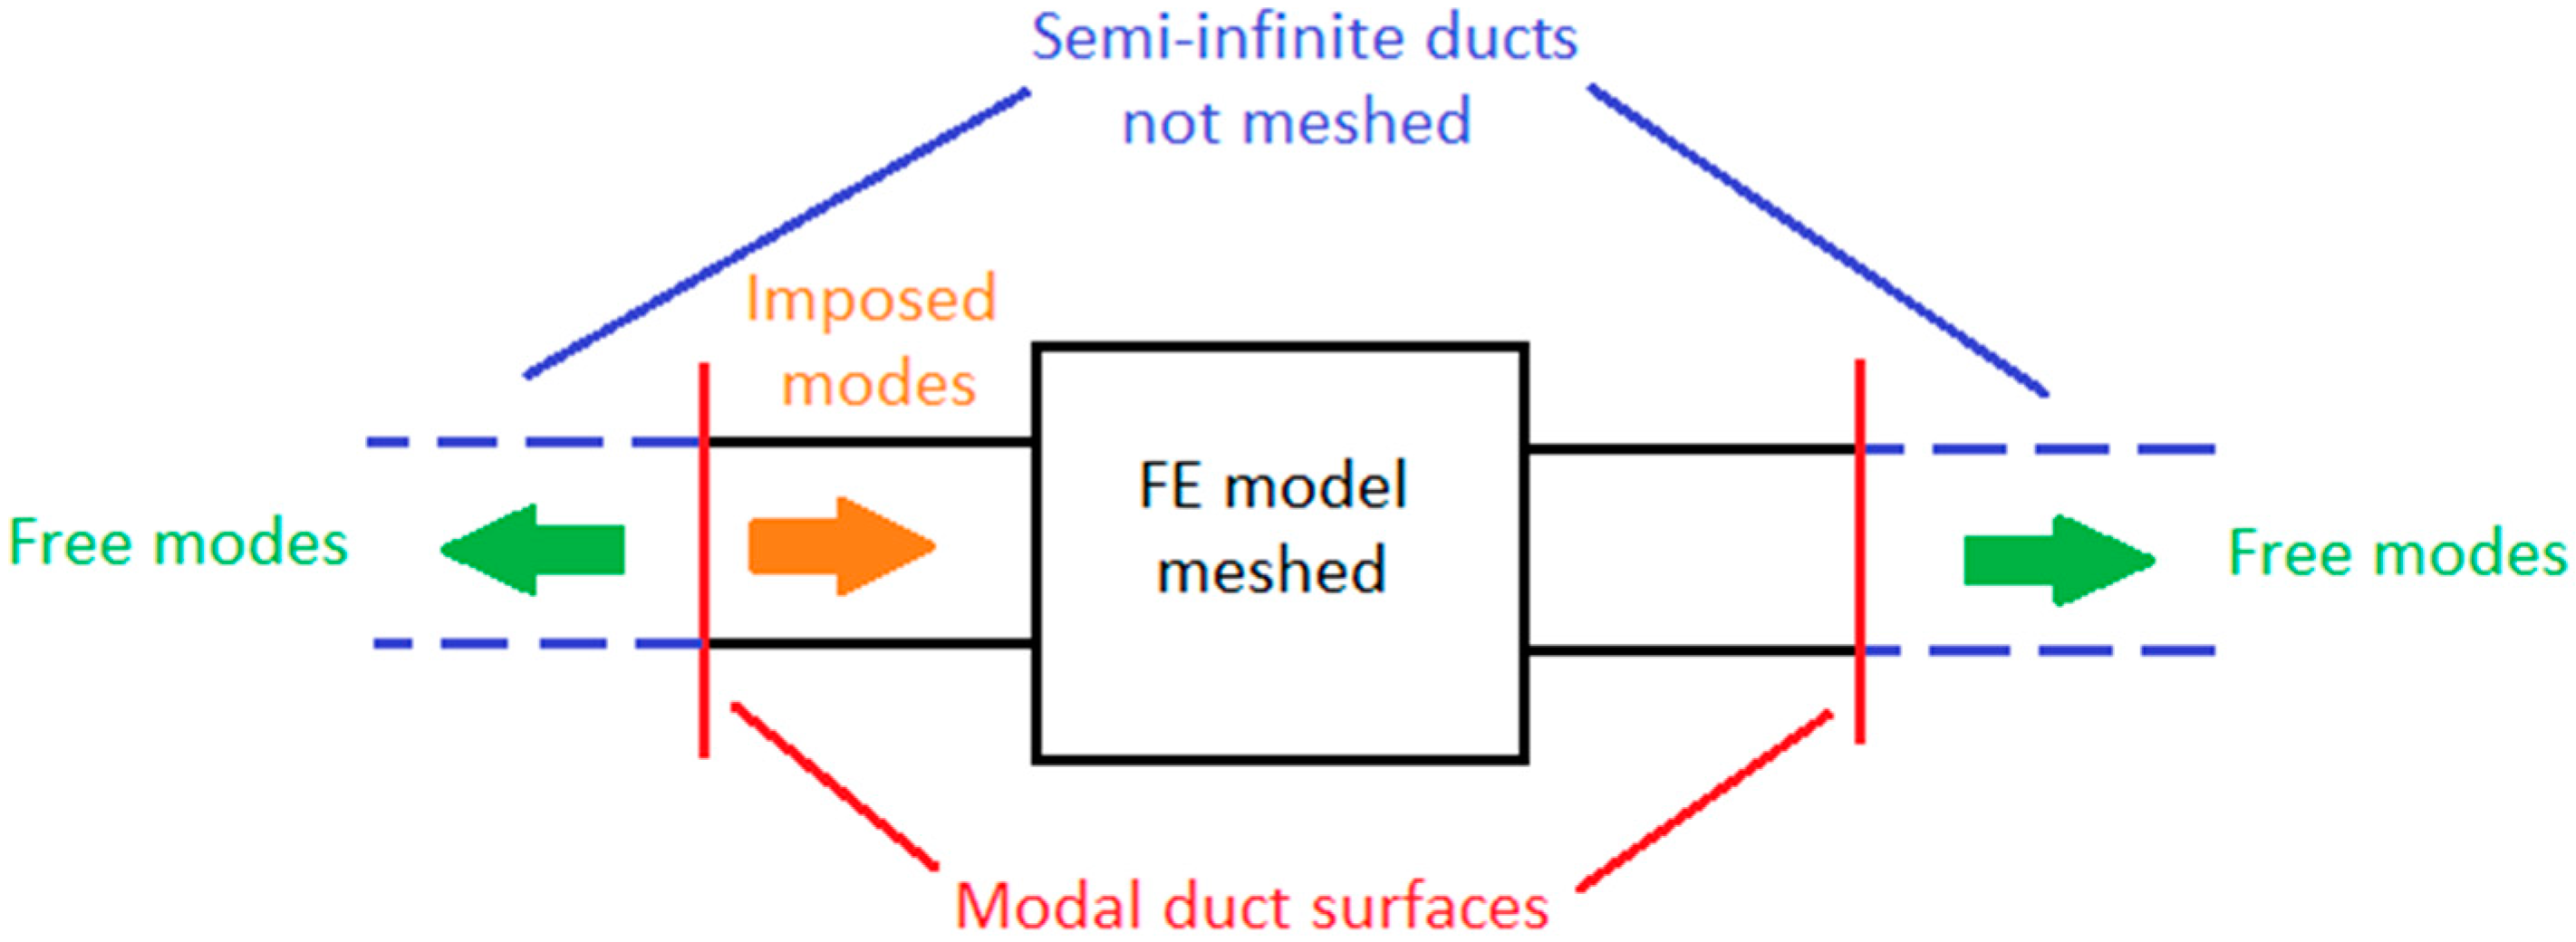
2.1.2. Numerical Methods to Evaluate Transmission Loss

Two numerical methods for the estimation of the acoustic properties of a muffler are reported in the literature: the CFD (computational fluid dynamics) approach [24,25] and the FEM approach [26].
In the CFD approach, the pressure recorded at prescribed points during the simulation run determines the TL [25]. This procedure allows the influence of the flow conditions on the acoustic attenuation of the muffler to be considered. However, the CFD simulations may represent a limit for the computational costs. Moreover, especially in the earlier stage of the design process, the flow conditions at the inlet may be unknown, making difficult to set the inlet parameters.
The FEM approach, despite not considering the viscous flow, represents an easier and faster method to estimate the TL. It was for this reason that a FEM model was adopted in this study.
The FEM model uses the duct modes to simulate the incident and reflected pressure waves at the inlet and the transmitted pressure waves at the outlet. Then, the global pressure wave propagation inside the ducts results from a superposition of the duct modes (Figure 4) [22].
The duct modes follow an analytical representation of a semi-infinite duct (i.e., plane wave propagation with no reflection at the boundaries) that does not need to be meshed (Figure 5). This approach simulates the excitation at the inlet with imposed duct modes and the anechoic condition with free duct modes.

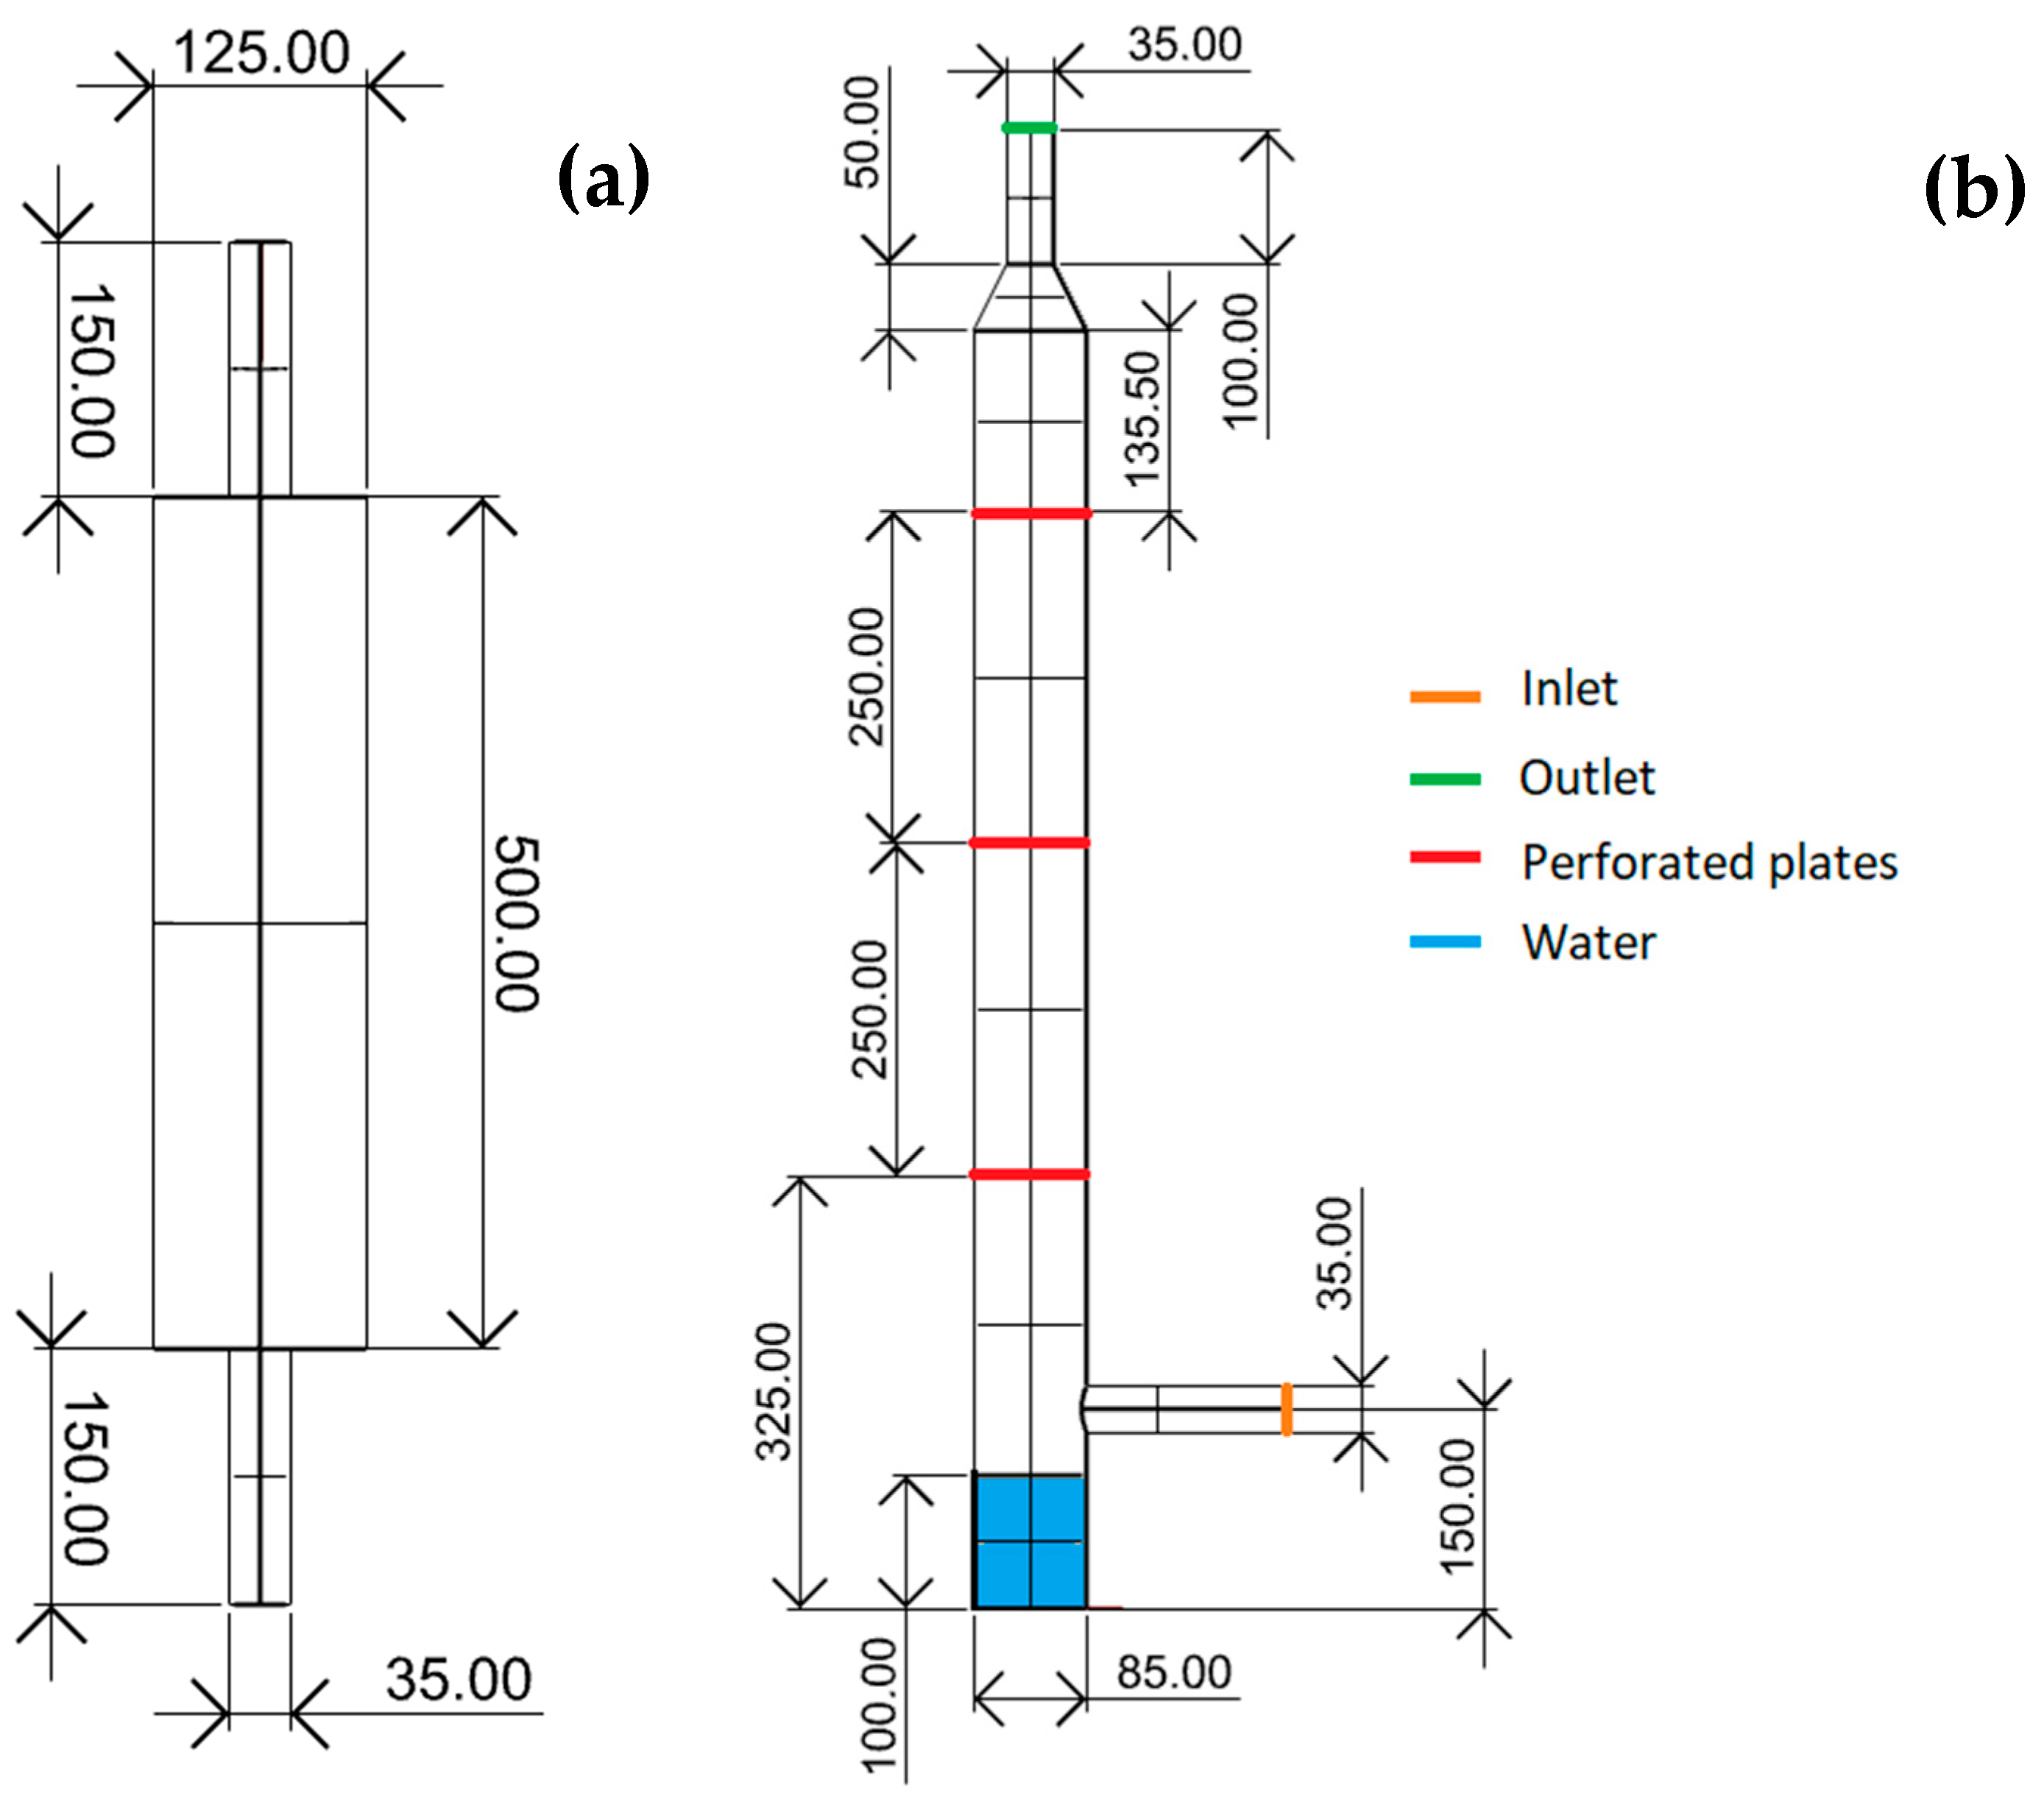
2.2. The Case Studies: Experimental Tests and Numerical Analyses

In this work, two geometries (Figure 6) were analysed: a simple expansion chamber and a model-scale scrubber.
The expansion chamber represents one of the simpler reactive mufflers, and its TL can also be easily calculated analytically with the following equation:
TL = 10 log 10 ( 1   +   1 4 ( h 1 h ) 2 sin 2 ( kl ) )       ,
where l is the expansion chamber length (500 mm in the present case), k is the wavelength, and h is the expansion ratio between the cross-sectional area of the chamber and the inlet/outlet pipe (12.7 in the present case), assuming the same diameter for the inlet and the outlet pipe [26]. Moreover, for a simple expansion chamber, the frequencies corresponding to the minima (fmin) and the maxima (fmax) of the TL curve can be calculated using the following equations, where n is the number of the considered harmonics [27]:
f min = n c 2 l       n = 0 ,   1 ,   2 , ,
f max = c 4 l + n c 2 l       n = 0 ,   1 ,   2 ,   ,
The analytical expression was used to assess both the experimental set-up and the numerical model.
Then, a model-scale scrubber with perforated plates was tested. The perforated plates of the model-scale scrubber (Figure 6b) are 1 mm thick, with holes featuring a diameter of 6 mm. The spacing of the holes is 9 mm. The water at the bottom of the model-scale scrubber, which is generated by the water spraying on the perforated plate in the chemical processing of the exhaust gases to reduce emissions, was only considered numerically. The experimental set-up with the impedance tube was not designed to test the prototype with water inside.
During the experimental tests, the room temperature and the pressure were 15 °C and 101,325 Pa, respectively. The same environmental conditions apply to the numerical models for air inside of the chamber and the water at the scrubber bottom. Table 1 summarizes the characteristics of the fluids.

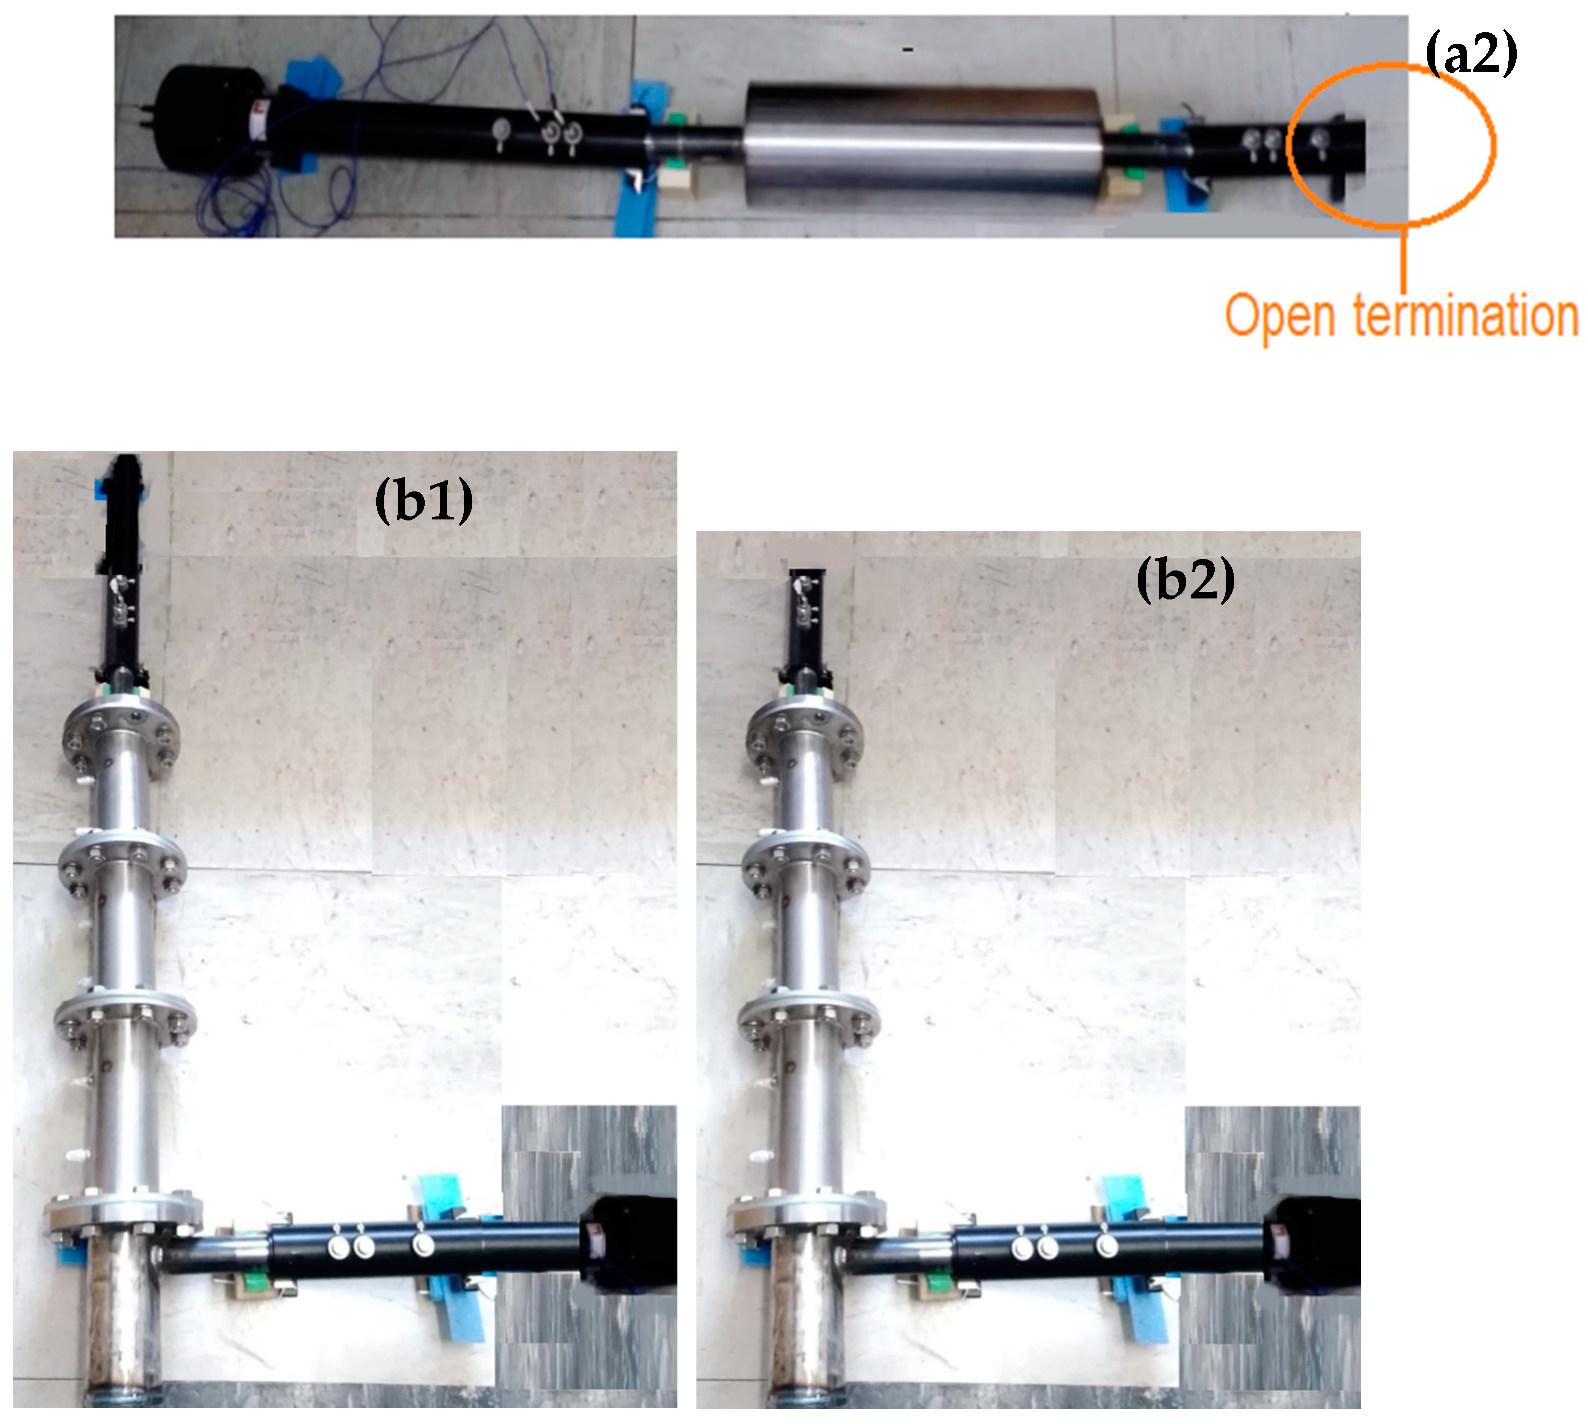
2.2.1. Transmission Loss Experimental Measurements

The TL measurement was performed using an impedance tube featuring a diameter of 45 mm. The two-load technique explained in Section 2.1.1 was adopted, and the two loads were reproduced using a closed and an open termination (Figure 7).
The speaker emits a sine sweep with the following parameters: duration 10 s, frequencies range 50–5000 Hz, and variable amplitude between 0.05 V and 0.40 V.
The signals were acquired by two PCB Piezotronics 378C10 microphones connected to a data acquisition device NI USB 4431, National Instruments, Austin, TX, USA. Three measurements were performed for each set-up configuration, moving microphone 2 to the locations 3 and 4 while keeping microphone 1 in its location (see Figure 3).
The acquired traces were elaborated upon in order to obtain the TL values using the Main_TL software developed by Materiacustica s.r.l.
The distance between microphones 1–2 and 3–4 is equal to 30 mm, which is in accordance with the standard ISO 10534-2 [21], which fixes the following limit to the distance s between the microphones:
s   <   0.45   c F   ,
where F is the maximum considered frequency.
Moreover, the distance between the sample and microphones 2 and 3 is greater than the 1–2 tube diameters suggested in the literature [28].
The ISO standard [21] also provides a frequency limit in order to ensure plane wave propagation:
f   <   0.586   c D ,
where D is the diameter of the largest pipe in the structure. In our case, the frequency limit is about 1700 Hz and 2300 Hz for, respectively, for the expansion chamber and the model-scale scrubber.
The experimental tests include three repetitions for each geometry and microphone location; the results are reproducible, as the standard deviation between the tests’ mean curve and the single experimental curve is less than 1%.
In this study, a bushing with O-rings (Figure 8) was realized to insert the pipes of the tested prototypes inside of the impedance tube. This solution ensures the airtightness of the system, facilitating the assembly of the setup but also creating discontinuity along the pipe that influences the measurements. The effects of this geometry setup on the TL will be analyzed using the FEM model in Section 3.1.2.

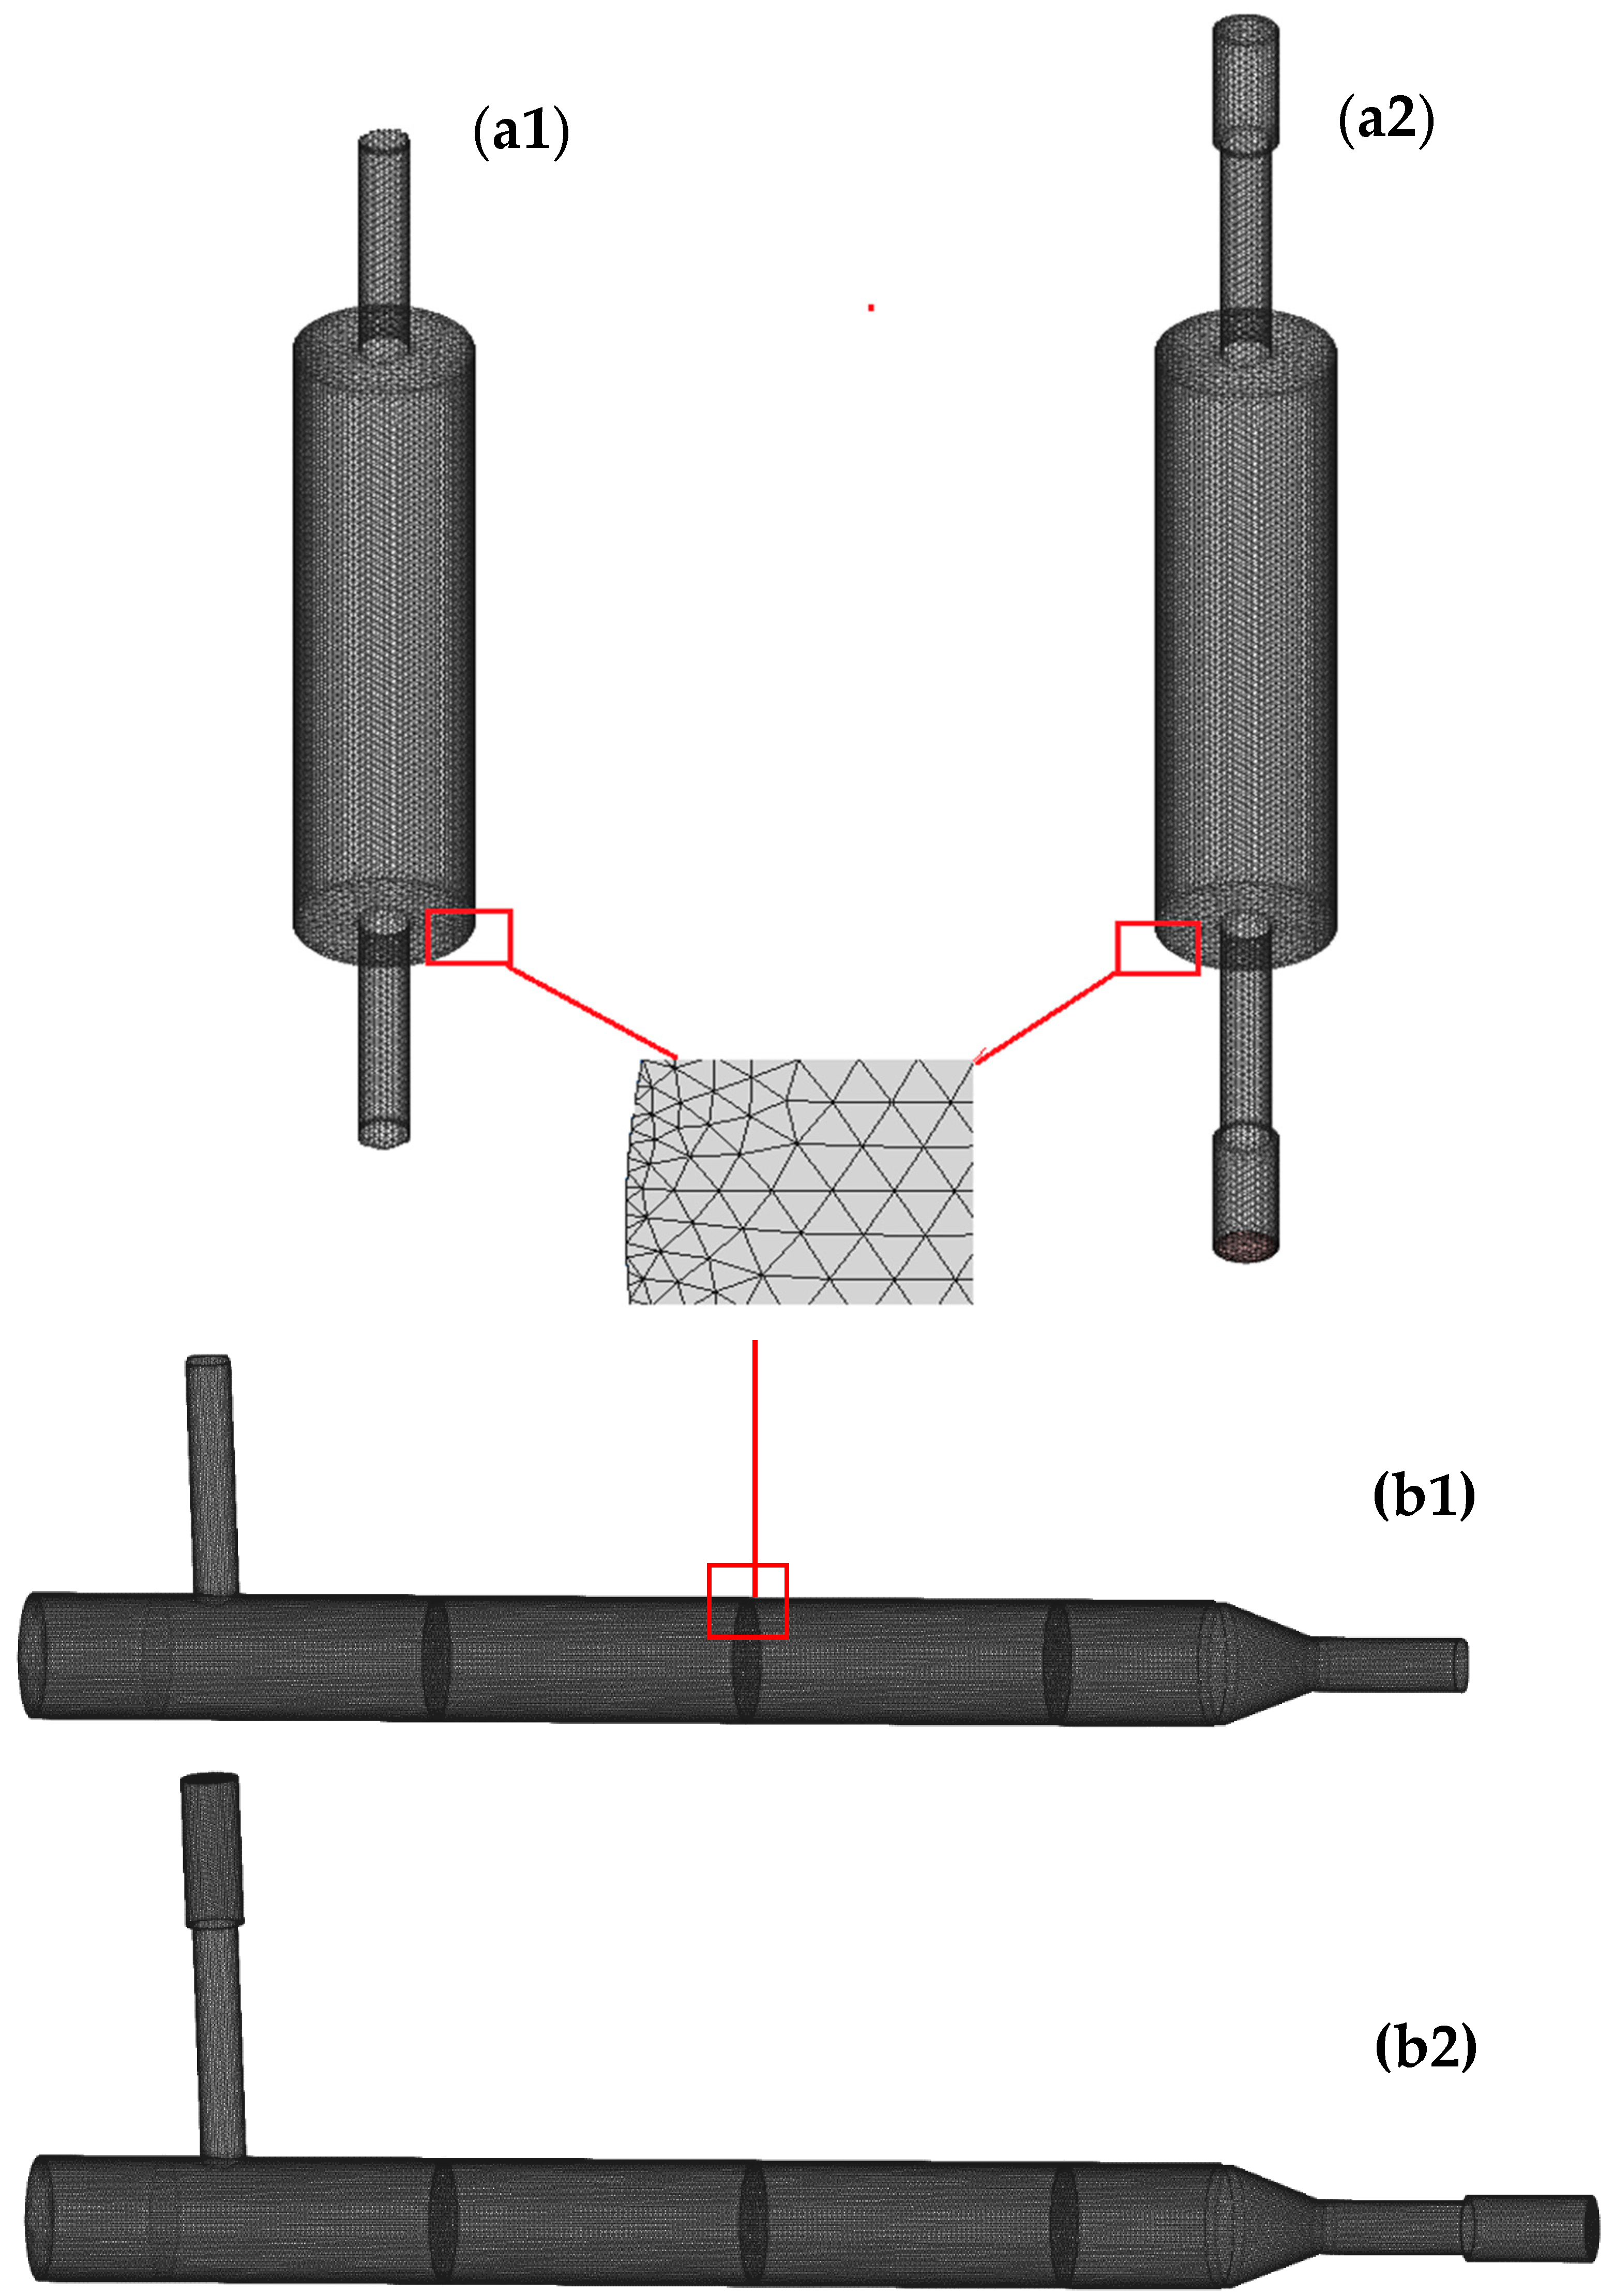
2.2.2. FEM Simulations of Transmission Loss

The numerical simulations were performed using the software Actran VI [29].
The geometries were discretized with the Actran mesh generator. First, the surfaces of the studied geometries were meshed, then the volume mesh was generated starting from the meshed surface to discretize the interior volume. The guidelines [29,30,31] suggest using a minimum of 8–10 linear elements per wavelength: in this case, the base size is 20 mm and 10 mm with a deviation of 0.1 mm for the simple expansion chamber and the model-scale scrubber, respectively. A tetrahedral mesh was used due to its high flexibility with complex geometries (e.g., scrubber with perforated plates and pipes). A mesh sensitivity study was not performed since the mesh size was calculated on the basis of the maximum wavelength to be considered, so the number of elements is sufficient to adequately reconstruct it. Considering 10 elements per wavelength, as in this case, the error on the pressure estimation remains less than 3% [31].
In Table 2, the mesh parameters ensuring the mesh quality [29,32] are reported.
Figure 9 shows the discretized geometries. Two configurations are used to analyse the geometries: the simple one is analysed as it is (Figure 9(a1,b1)), and the other one considers the discontinuity introduced by the connection (bushing in Figure 8) with the impedance tube (Figure 9(a2,b2)). The bushing discontinuity was modelled by considering a sudden change in diameter from 35 mm (prototypes pipe diameter) to 45 mm (impedance tube diameter).
The TL of the model-scale scrubber was evaluated with and without the presence of water at the bottom (Figure 6).
Perforated elements were modelled inside of the software environment considering their viscous dissipation. This was modelled by imposing a transfer admittance A derived from the fluid characteristics and perforation geometry as follows:
A = 1 Z p     ,
Zp is the transfer impedance of the perforated element expressed as follows:
Z p = Z σ     ,
where Z is the transfer impedance for a single hole expressed by Maa’s formulation, and σ is the porosity parameter reported in the following equations [33] according to a formulation that is valid for triangular meshes:
Z = 8 μ L a 2 1 + ( k s a ) 2 32 + j ω ρ l ( 1 + 1 9 + ( k s a ) 2 2 ) ,
σ = 2 π a 2 3 d 2   ,
where μ is the dynamic viscosity of the fluid, L is the thickness of the perforated shell, a is the hole radius, d is the hole spacing, ω is the angular frequency, ρ is the fluid density, and ks the shear wavenumber, which can be expressed as follows:
k s = ω ρ μ     ,
As discussed in Section 2.1.2, at the inlet, the duct modes were used to model the incident wave, imposing a plane wave propagation in a frequency range 0–1700 Hz and 0–2300 Hz for the expansion chamber and the model-scale scrubber, respectively. The upper limits were selected according to the ISO standard guidelines reported in Section 2.2 [21]. In order to avoid reflection, free mode propagation was set in the direction opposite to the excitation.
At the outlet, the anechoic condition was modelled using the duct modes and by setting free mode propagation.
Environmental conditions and fluid characteristics were set in the same way as they were during the experimental tests (Section 2.2.1, Table 1). The calculations assume the presence of a fluid inside the muffler but are not simulating the flow developing inside the geometry, as was the case during the tests using the impedance tube.

3. Results and Discussion

The comparison between the analytical and experimental TL of the simple expansion chamber is first addressed to assess the experimental setup. The accuracy of the numerical model is then evaluated. Finally, the assessed FEM model is used to estimate the TL of the model-scale scrubber, which was also measured experimentally, and, more importantly, to evaluate the influence of the modifications of the scrubber design on the TL.
In this work, to estimate the accuracy of the results, the guidelines suggested by Wärtsilä Italy S.p.A. [34] were used: a difference of less than 5% and 10% between the fmin and fmax, respectively, and a difference of 5 dB between the TL amplitudes were considered as a criterion to assess the reliable fit of the TL curves. These are the same guidelines that used to simulate marine engine behaviour in the industrial environment.
It is important to stress that the accurate detection of a system’s fundamental frequencies is of paramount importance, which corresponds to the fmin of the TL (i.e., frequencies at which the minima of the TL curve occur). The fmin are the so-called transparent frequencies, as they do not reflect the sound waves backwards, leading to sound attenuation at the outlet but allowing them to propagate unaltered through the component. As such, to reduce the exhausted gas noise, these frequencies must not coincide with the engine frequencies, producing a null sound attenuation.
Regarding the geometry modifications, ideally, TL values will increase. Higher TL values correspond to higher sound attenuation because the sound power transmitted through the component is less.

3.1. Simple Expansion Chamber

In the following sections, for the simple expansion chamber, the experimental and the numerical results are compared to the analytical TL to evaluate their accuracy. The FEM model is then used to investigate its influence on the TL of the discontinuity caused by the connection between the chamber and the impedance tube, as previously anticipated.

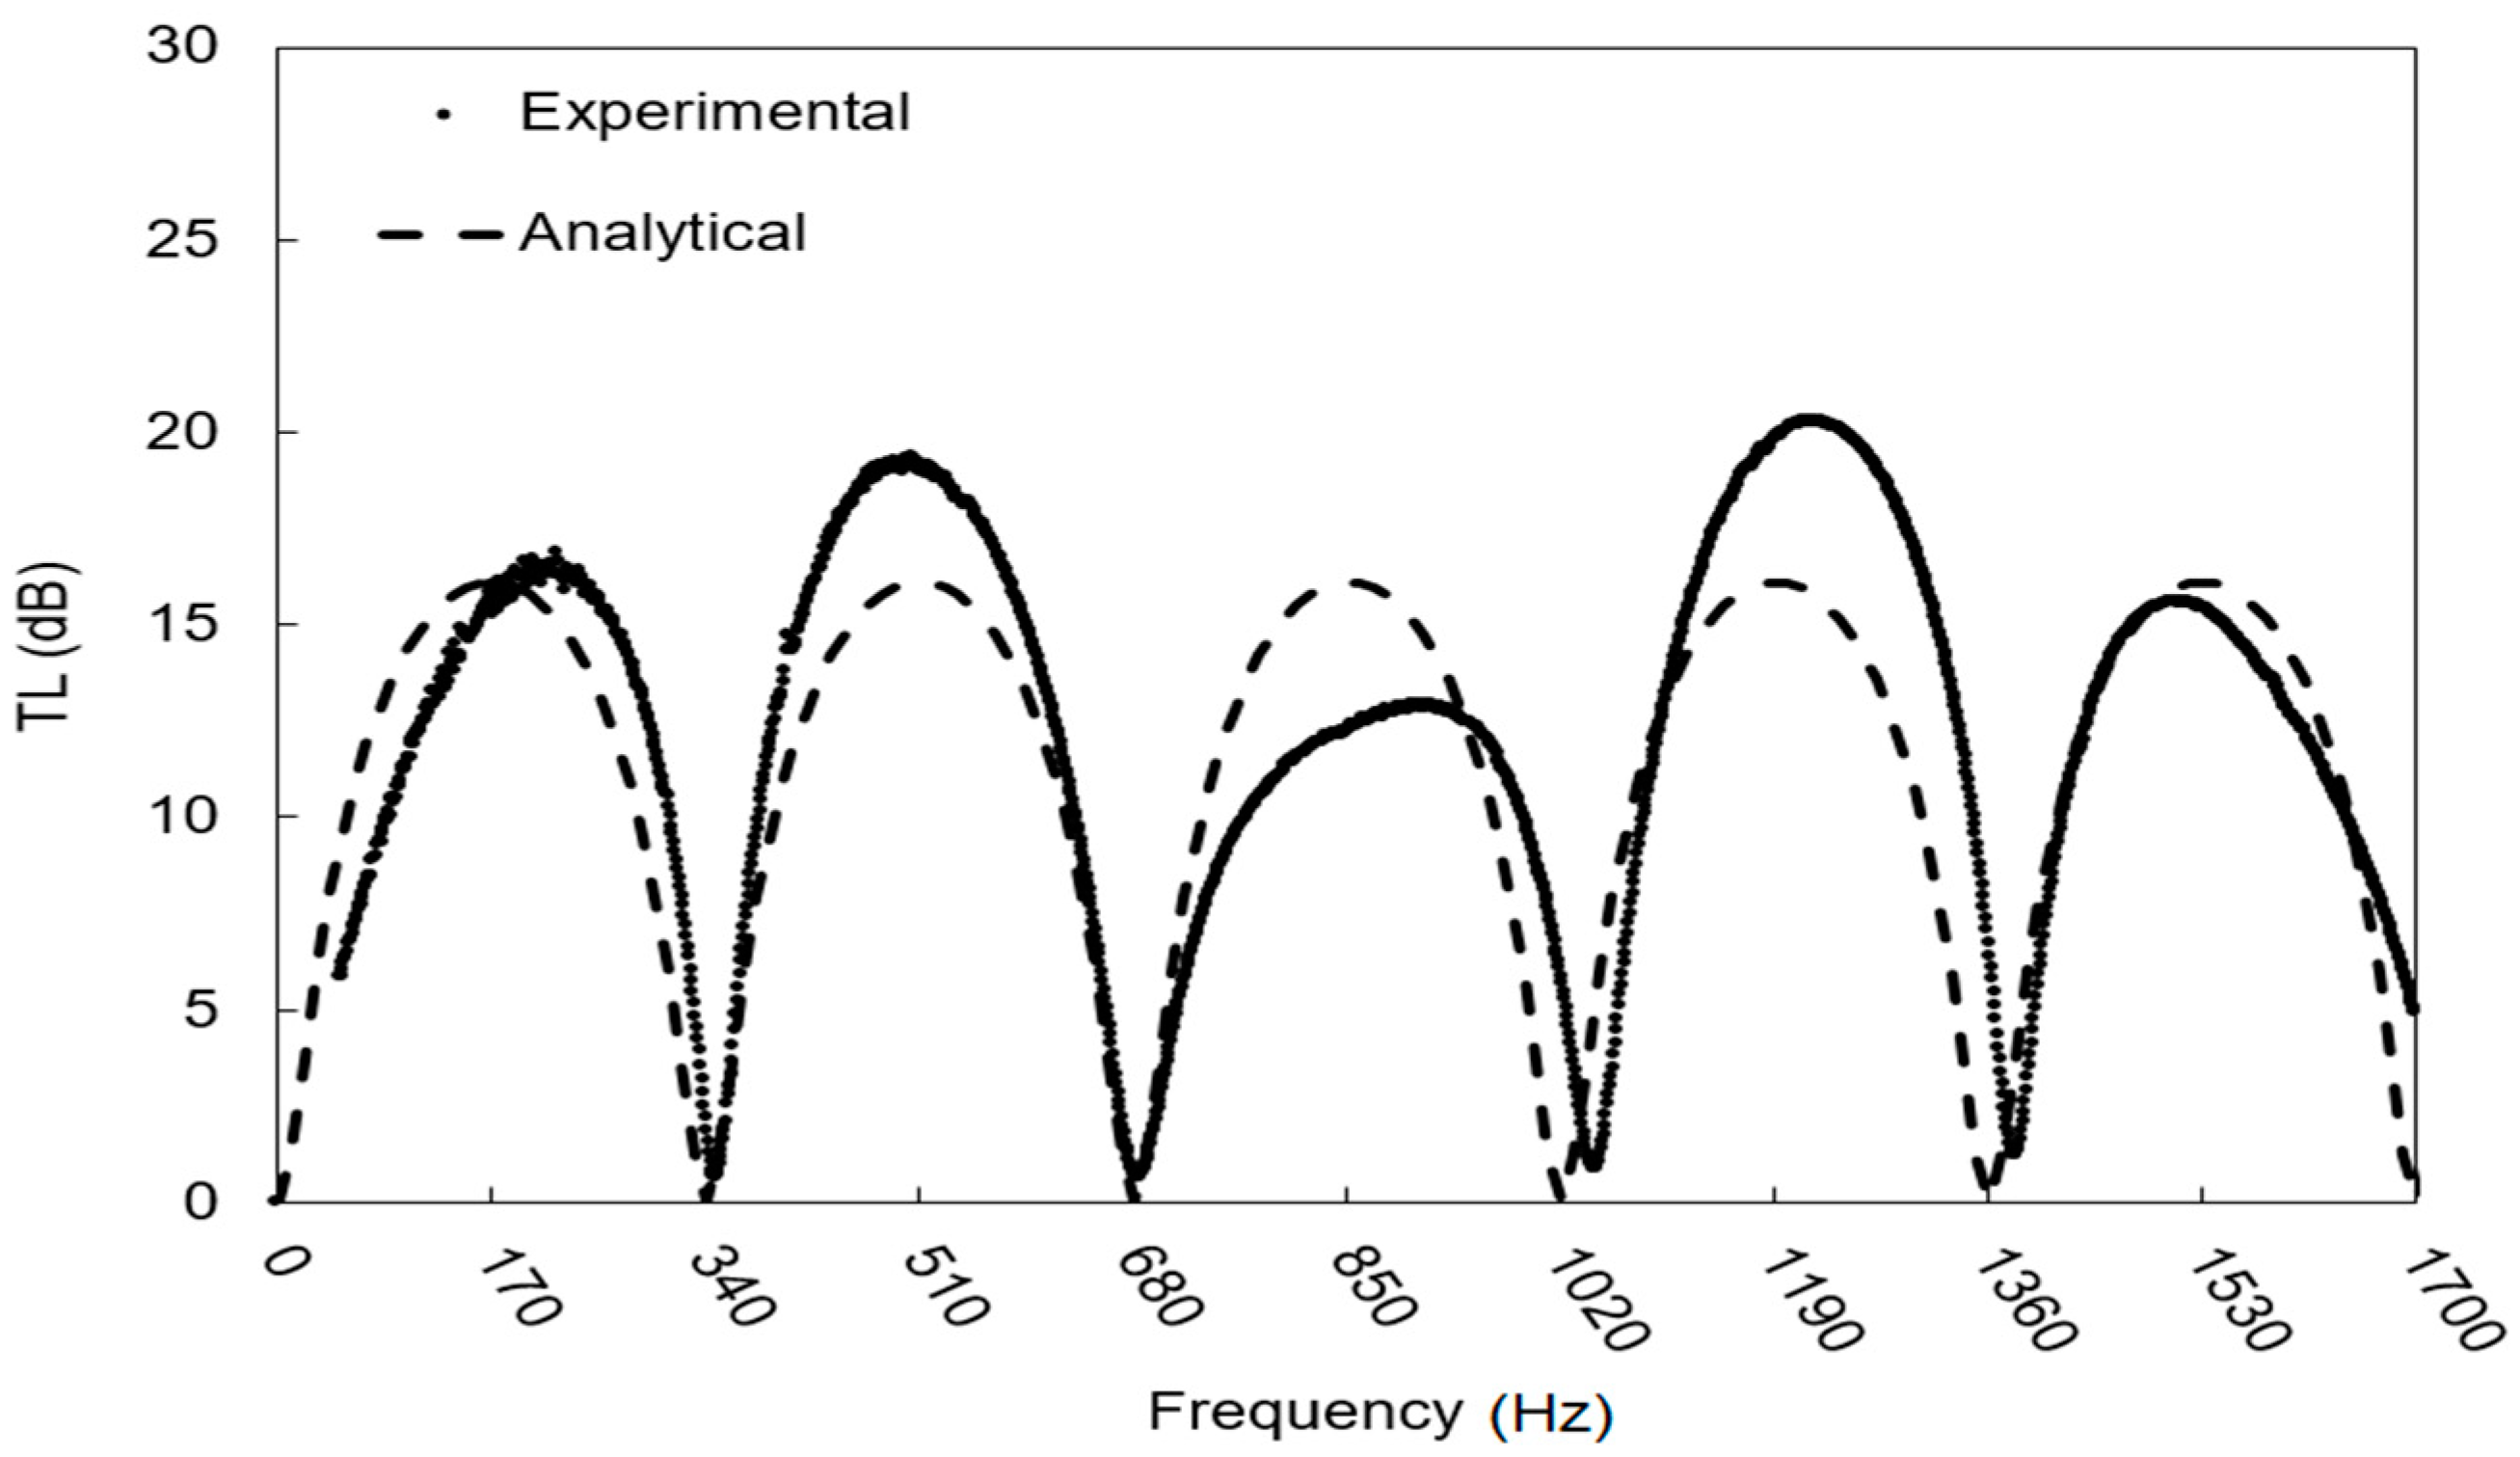
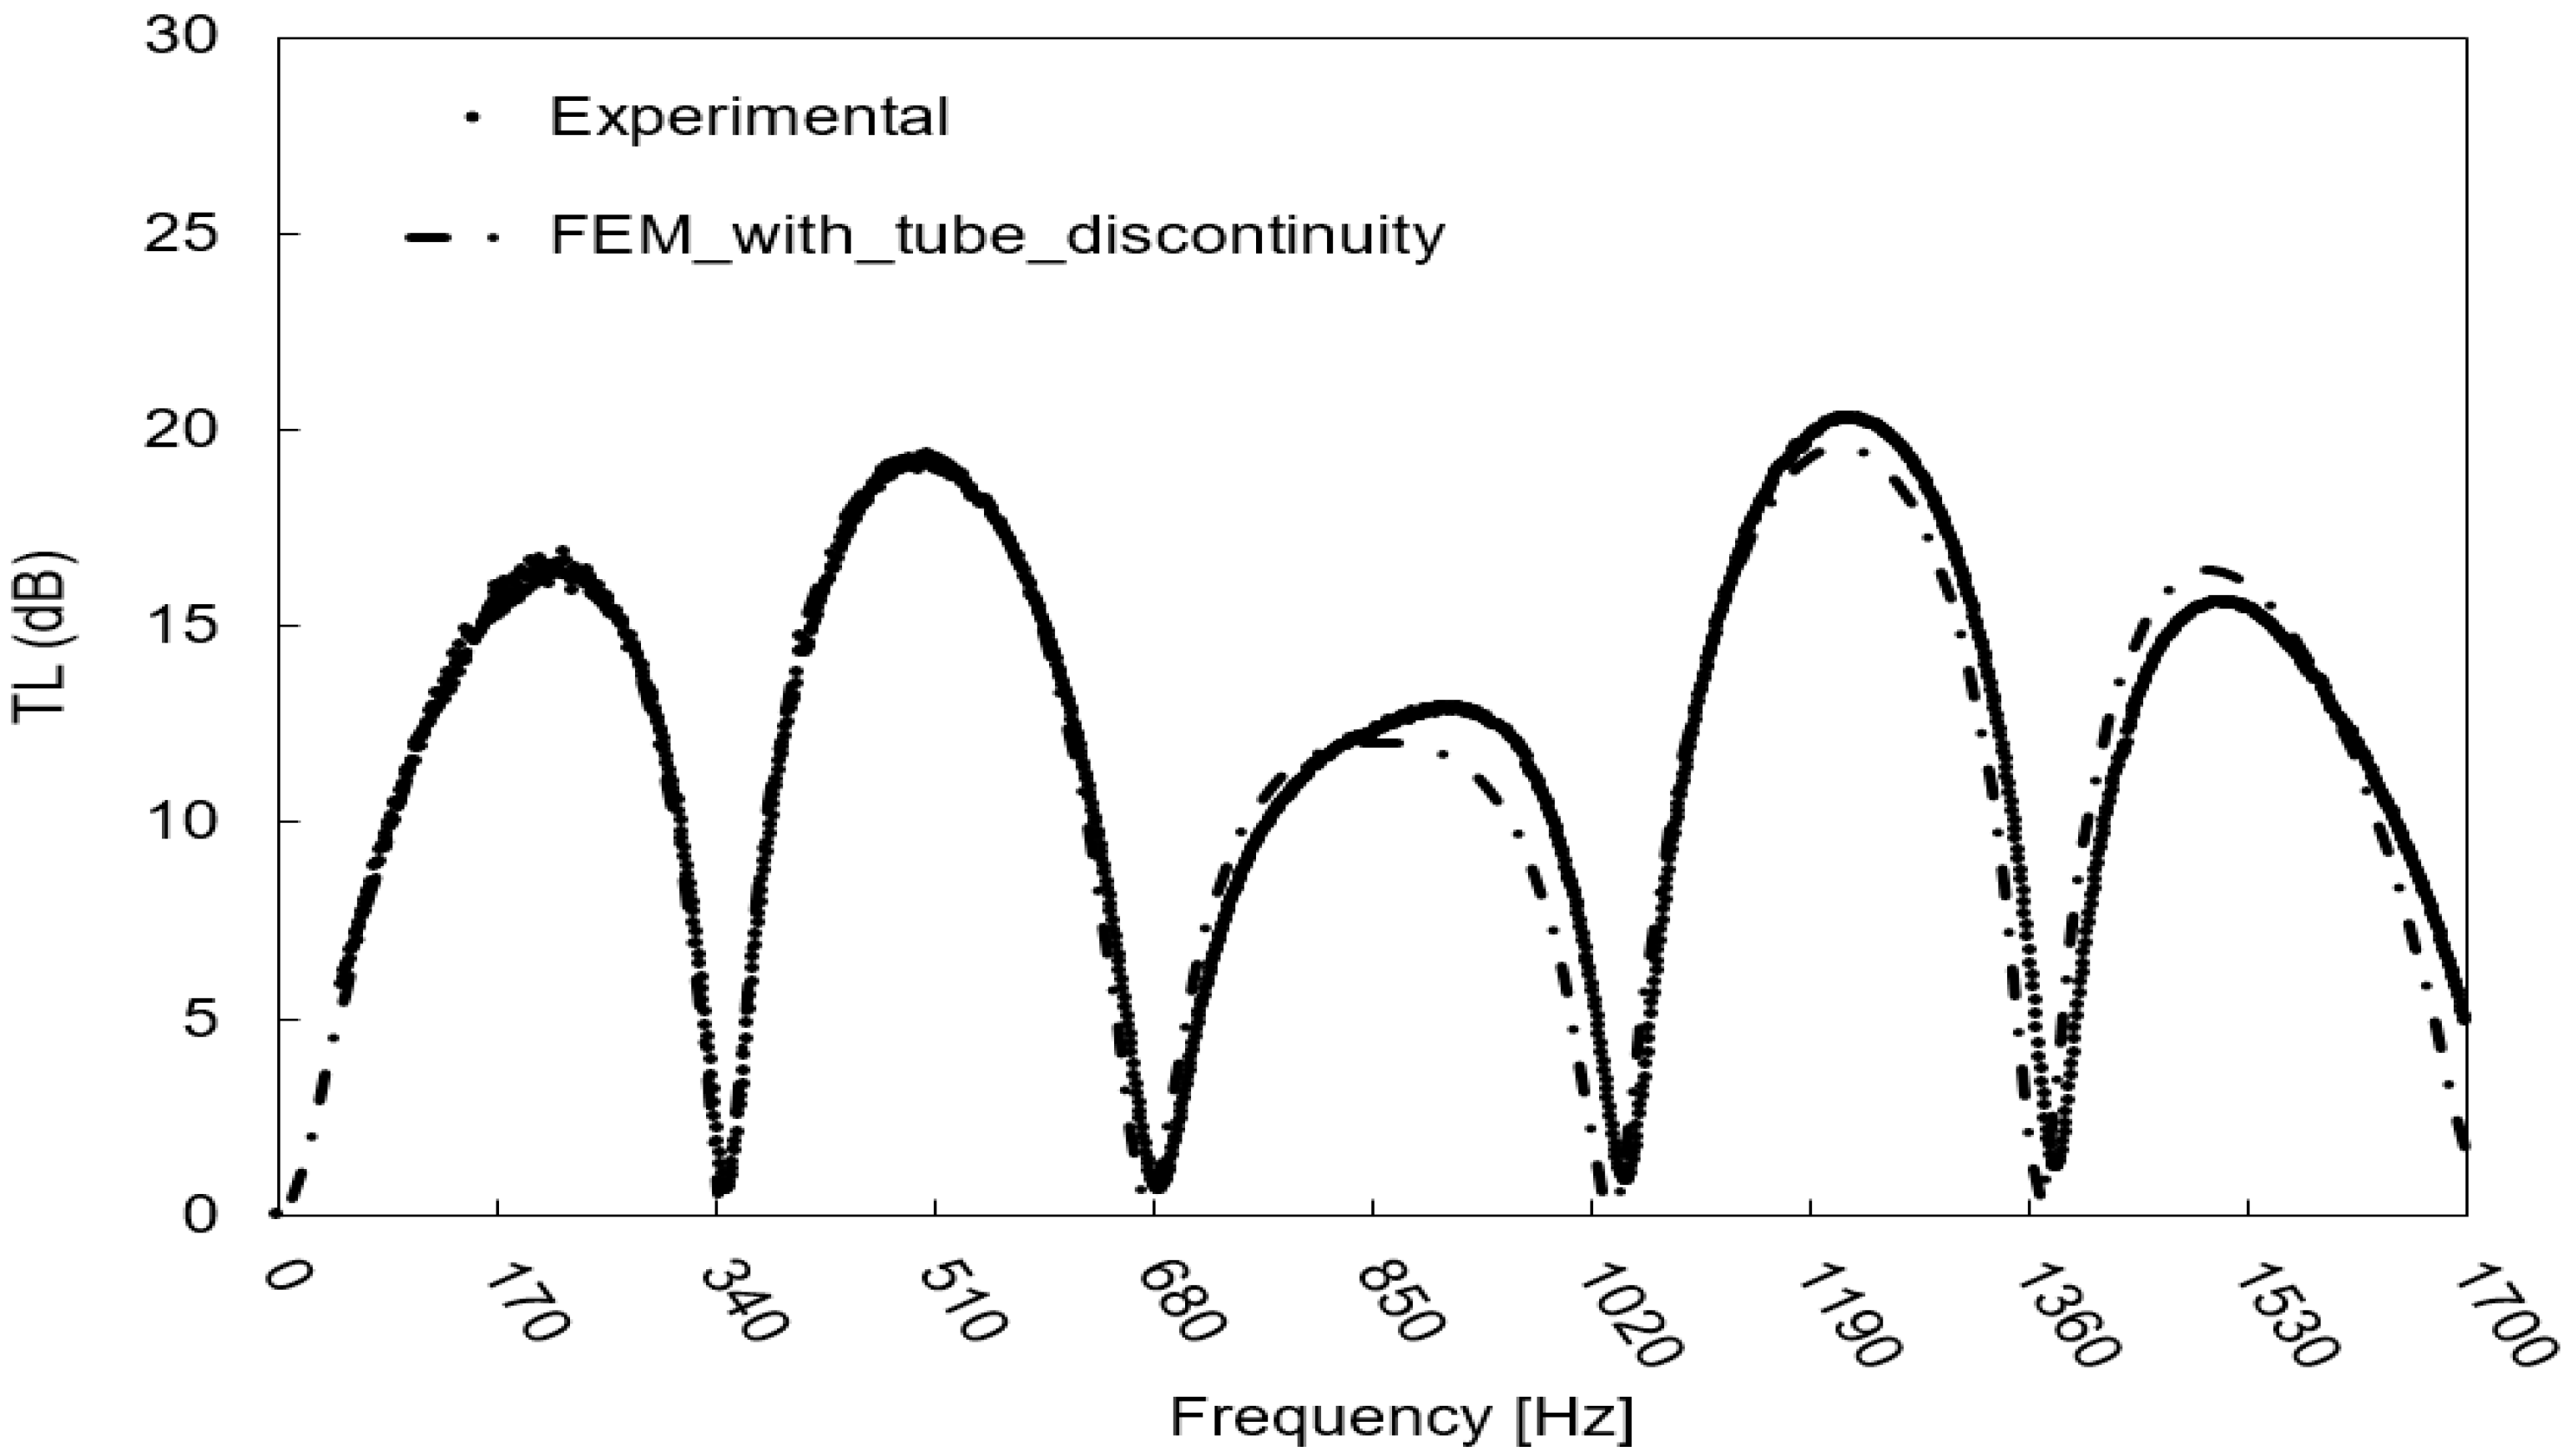
3.1.1. Experimental Transmission Loss Assessment

As previously highlighted, different parameters influence the measurement setup, so the evaluation of its accuracy becomes mandatory.
Figure 10 compares the analytical (calculated with Equation (5)) and experimental TL values as a function of frequency for the simple expansion chamber (Figure 6a).
Table 3 compares the frequencies at which the minima (fmin) and the maxima (fmax) of the TL occur, as calculated with Equations (6) and (7), respectively. Delta represents the percentage difference between the analytical and experimental data.
Table 4 compares the amplitudes of the experimental and analytical TL. Delta represents the difference between the analytical and experimental data.
A perusal of the data reported in Table 3 and Table 4 reveals differences of less than 3% between analytical and experimental fmin and differences of less than 5 dB between the analytical and experimental amplitudes of TL; accordingly, the above reported fitting criterion [34] is satisfied.
A somewhat worse fit is observed for the fmax, which can be attributed to the irregular features of the TL peaks shown in Figure 10, which are reasonably caused by the discontinuity introduced along the pipe by the bushing (Figure 8) used to connect the expansion chamber and the impedance tube, as described in Section 2.2. The irregular feature of the experimental TL will be studied in the next section using the assessed FEM model.
However, considering the fundamental importance of the fmin being measured correctly, as previously explained, the adopted experimental setup can be recognized as sufficiently accurate in the selected frequency range from an engineering point of view.

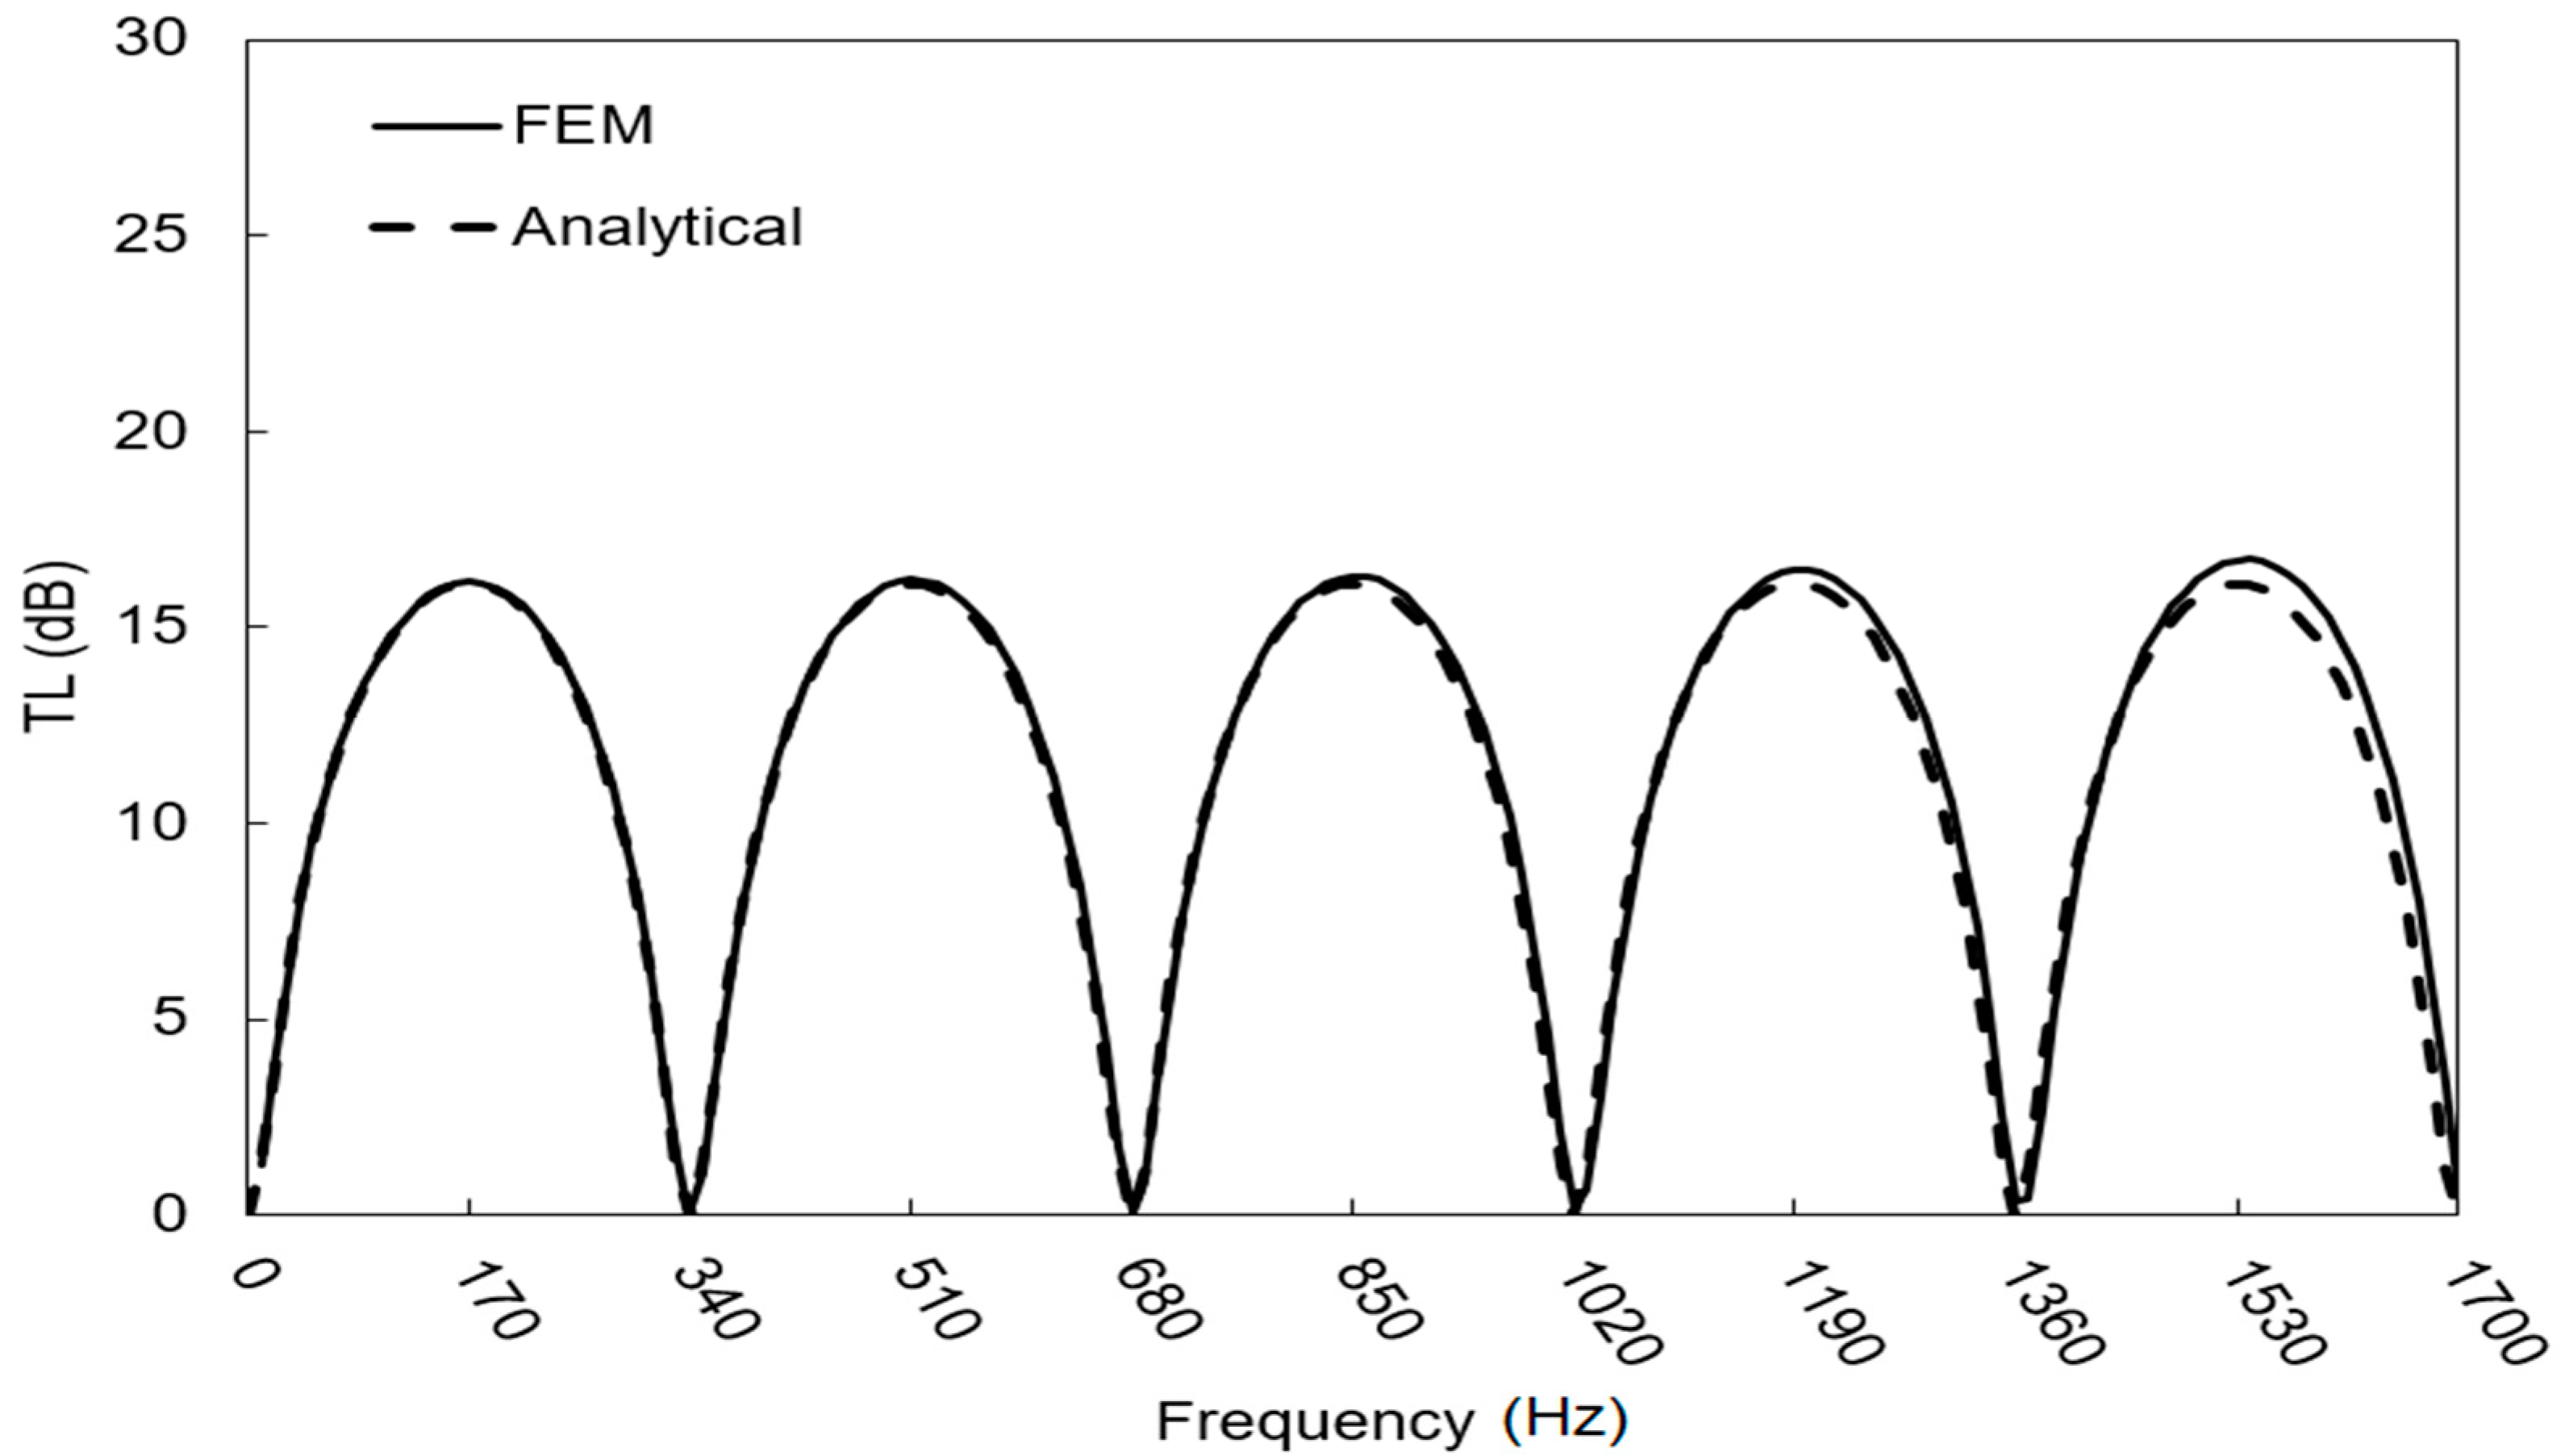
3.1.2. FEM Transmission Loss Assessment

The accuracy of the adopted numerical model has to be evaluated to ensure the correctness of the settings illustrated in Section 2.2.2. Figure 11 compares the analytical (calculated with Equation (5)) and numerical TL values as a function of frequency for the simple expansion chamber (Figure 9(a1)).
The analytical curve is nearly coincident with the FEM-simulated TL of the simple expansion chamber: frequency differences much lower than 1% and amplitude differences lower than 1 dB, as shown by the data comparison reported in Table 5. Delta represents the difference between the analytical and FEM-simulated TL of the simple expansion chamber. The above-reported fitting criterion [34] is satisfied, clearly proving the reliability of the numerical model.
After comparing the numerical model against the analytical data, the discontinuity along the tube caused by the bushing was modelled considering a variation in diameter (Figure 9(a2)), as previously discussed. The tube discontinuity significantly affects the FEM-simulated TL of the expansion chamber (Figure 12), reinforcing the above-reported suggestion that the irregular features of the amplitudes are caused by the connection between the chamber and the impedance tube (Figure 8).
The data reported in Table 6 highlight the good fit between experimental data and the TL calculated with the numerical model considering the tube discontinuity: the industrial guidelines [34] are satisfied, as the differences in the fmin value and amplitude are less than 1% and 1 dB, respectively. Moreover, the difference in terms of fmax is reduced compared to the delta between the analytical and experimental TL (Table 3). Indeed, the analytical model (Equation (5)) simulates an ideal geometry without geometrical variations along the pipes and the chamber.

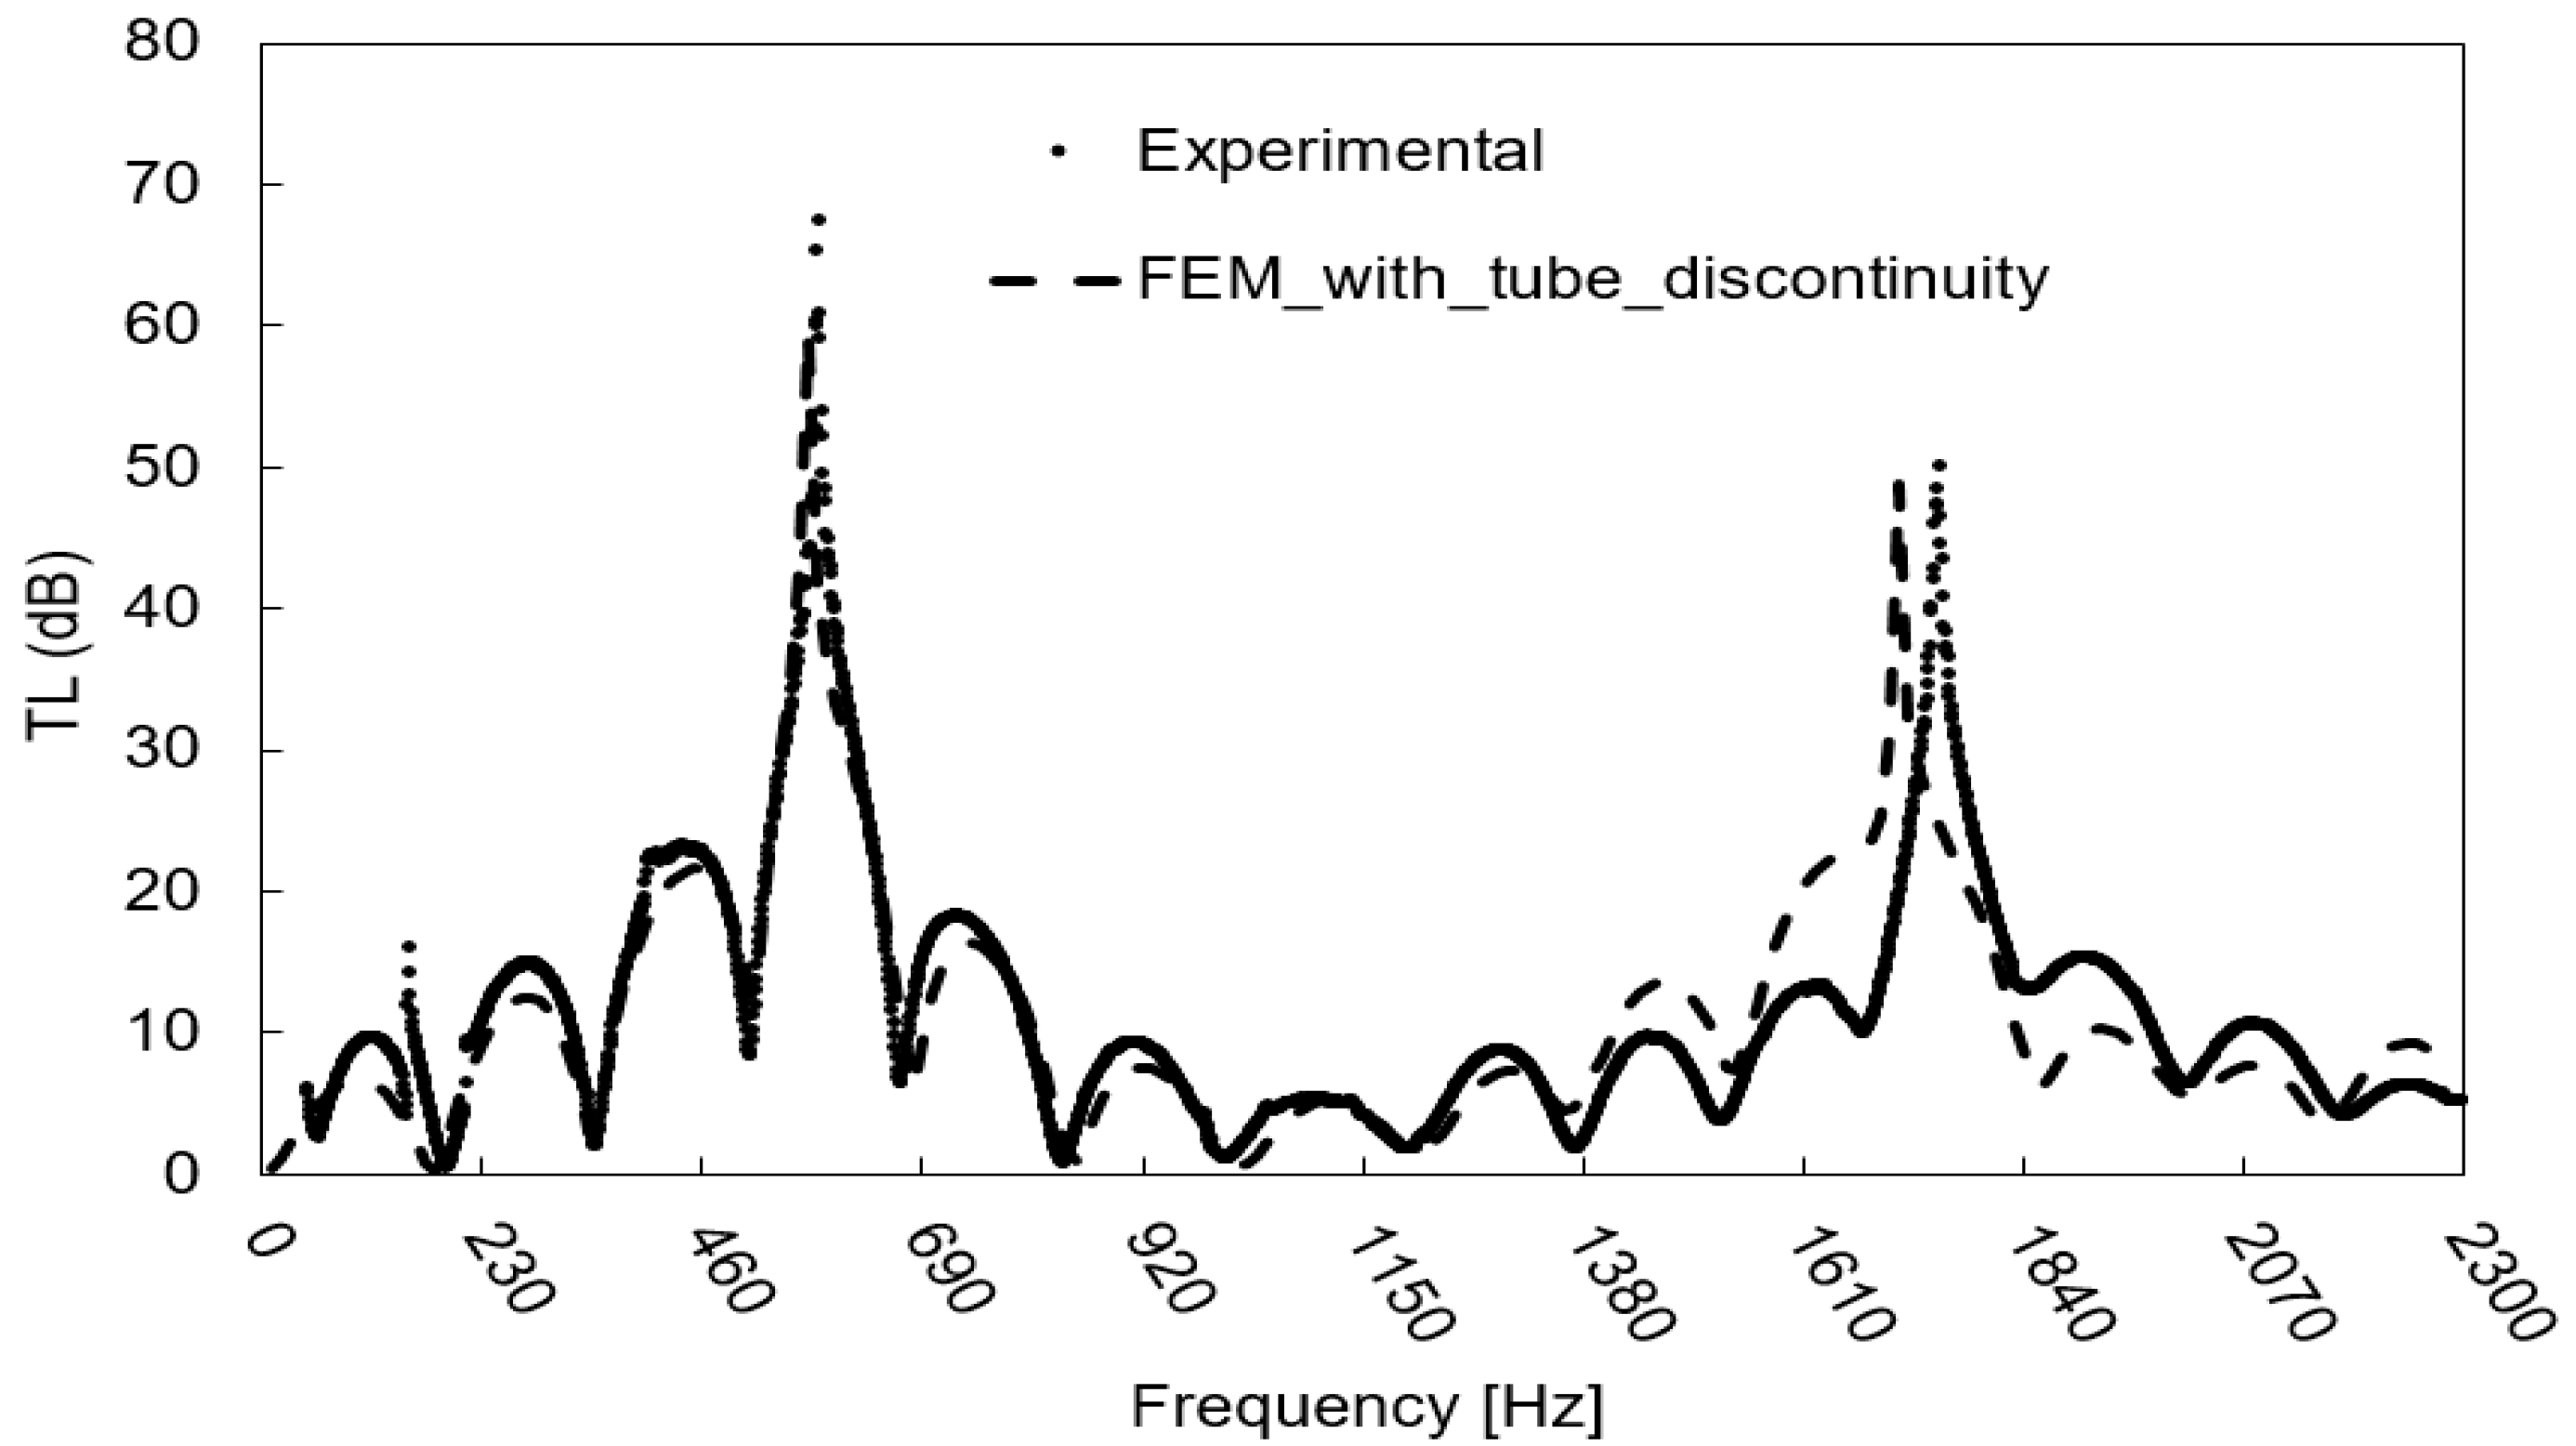
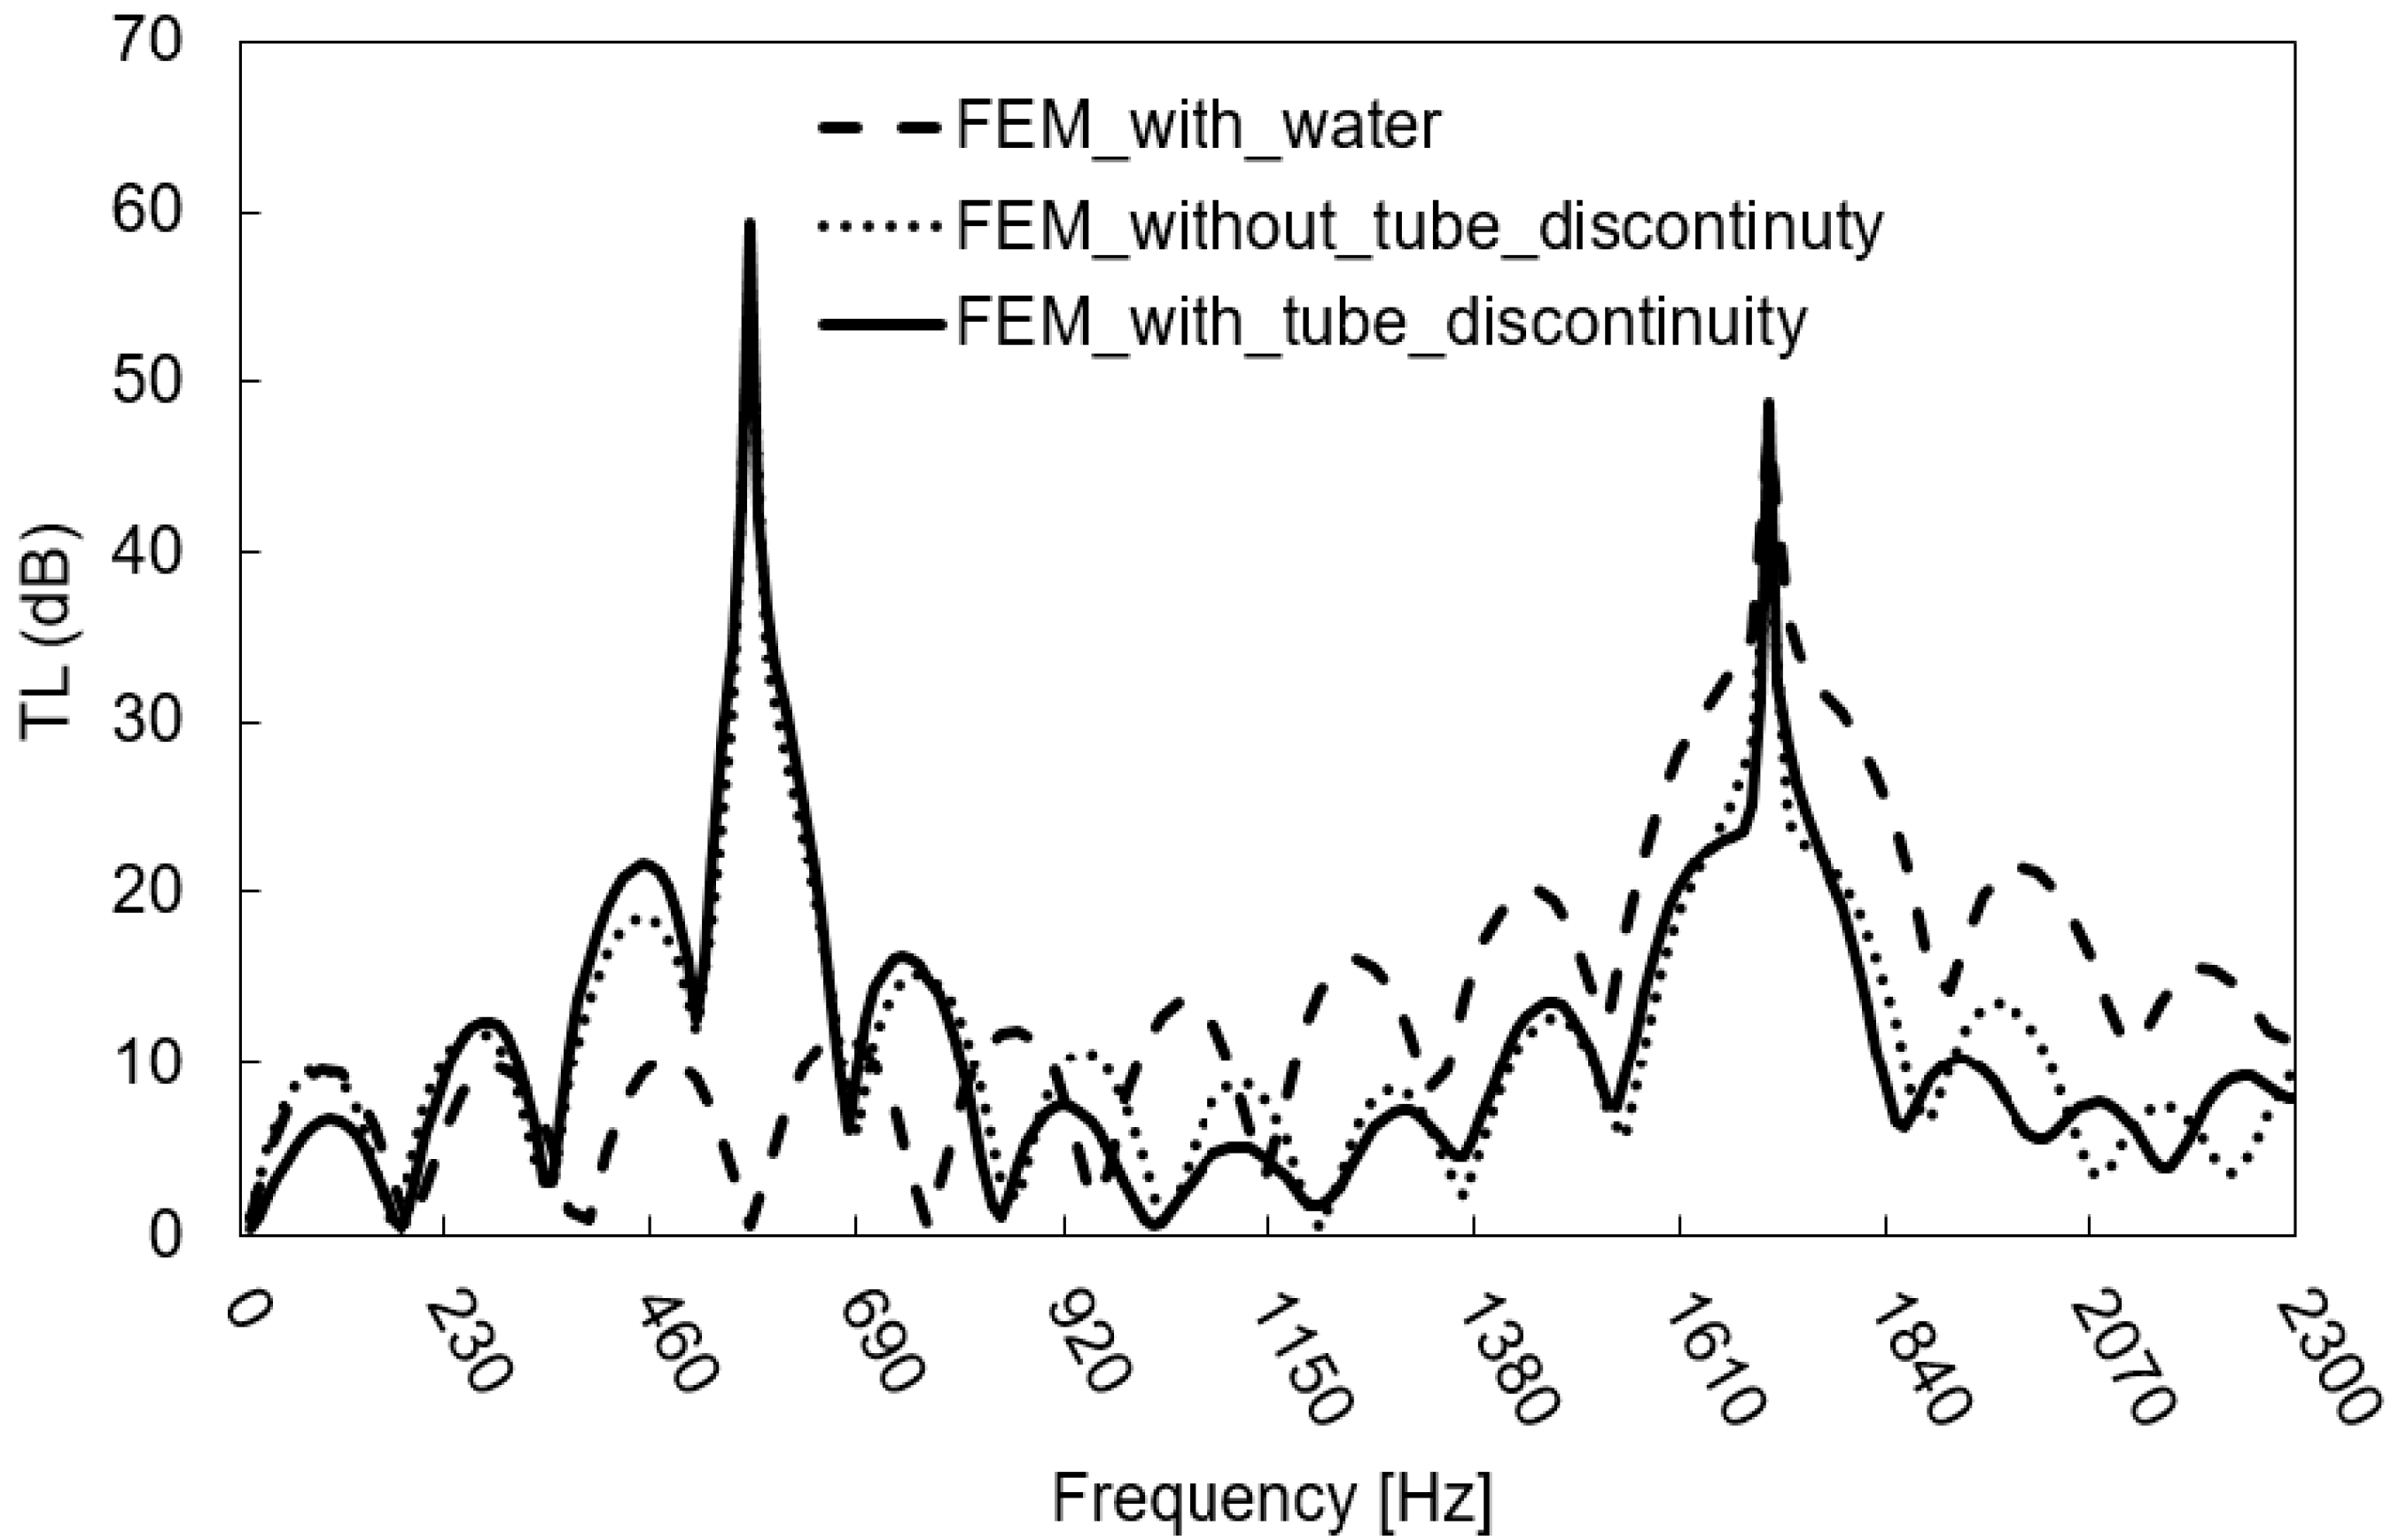
3.2. Model-Scale Scrubber

The simple FEM model was extended to simulate the TL of the model-scale scrubber. Considering the model of the scrubber with the tube discontinuity, a perusal of Figure 13 shows a good fit between the FEM-simulated and experimental TL curves in the frequency range up to 1500 Hz, where the discrepancy between fmin is less than 3%, and where between amplitudes, it is less than 5 dB (Table 7 and Table 8). At higher frequencies, the discrepancy between the TL amplitudes becomes higher. This inaccuracy is caused by a non-plane wave propagation of the sound at higher frequencies in the model-scale scrubber due to a change of the wave propagation direction caused by the angle between the inlet pipe and scrubber body [35]. In this regard, it should be remembered that the hypothesis of plane wave propagation was adopted both in the experimental measurements and in the numerical model.
However, the FEM model shows appreciable accuracy (Table 7 and Table 8) [34] in the frequency range 20–1000 Hz, the range in which human hearing is the most sensitive [36] and the range that is taken as a reference by industry [34]. Therefore, the assessed FEM model can be employed to analyse the effects of scrubber modifications (e.g., water presence or geometry modifications) on the TL.
For this purpose, a model-scale scrubber without tube discontinuity was first modelled in order to avoid the influence of such discontinuity on the TL. Indeed, the scrubber is usually connected to the exhaust line without tube discontinuity. A perusal of Figure 14 shows that the discontinuity influences the TL amplitudes in the frequency range of interest (20–1000 Hz) and the fmin and fmax at higher frequencies.
Using the model of the scrubber without discontinuity, the influence on the TL of the presence of water in the model-scale scrubber bottom (depicted in Figure 6b) has been considered: the TL peak at around 500 Hz is completely dumped, while the TL above 920 Hz is increased (Figure 14). This effect should be kept present when interactions with exciting frequencies are considered.

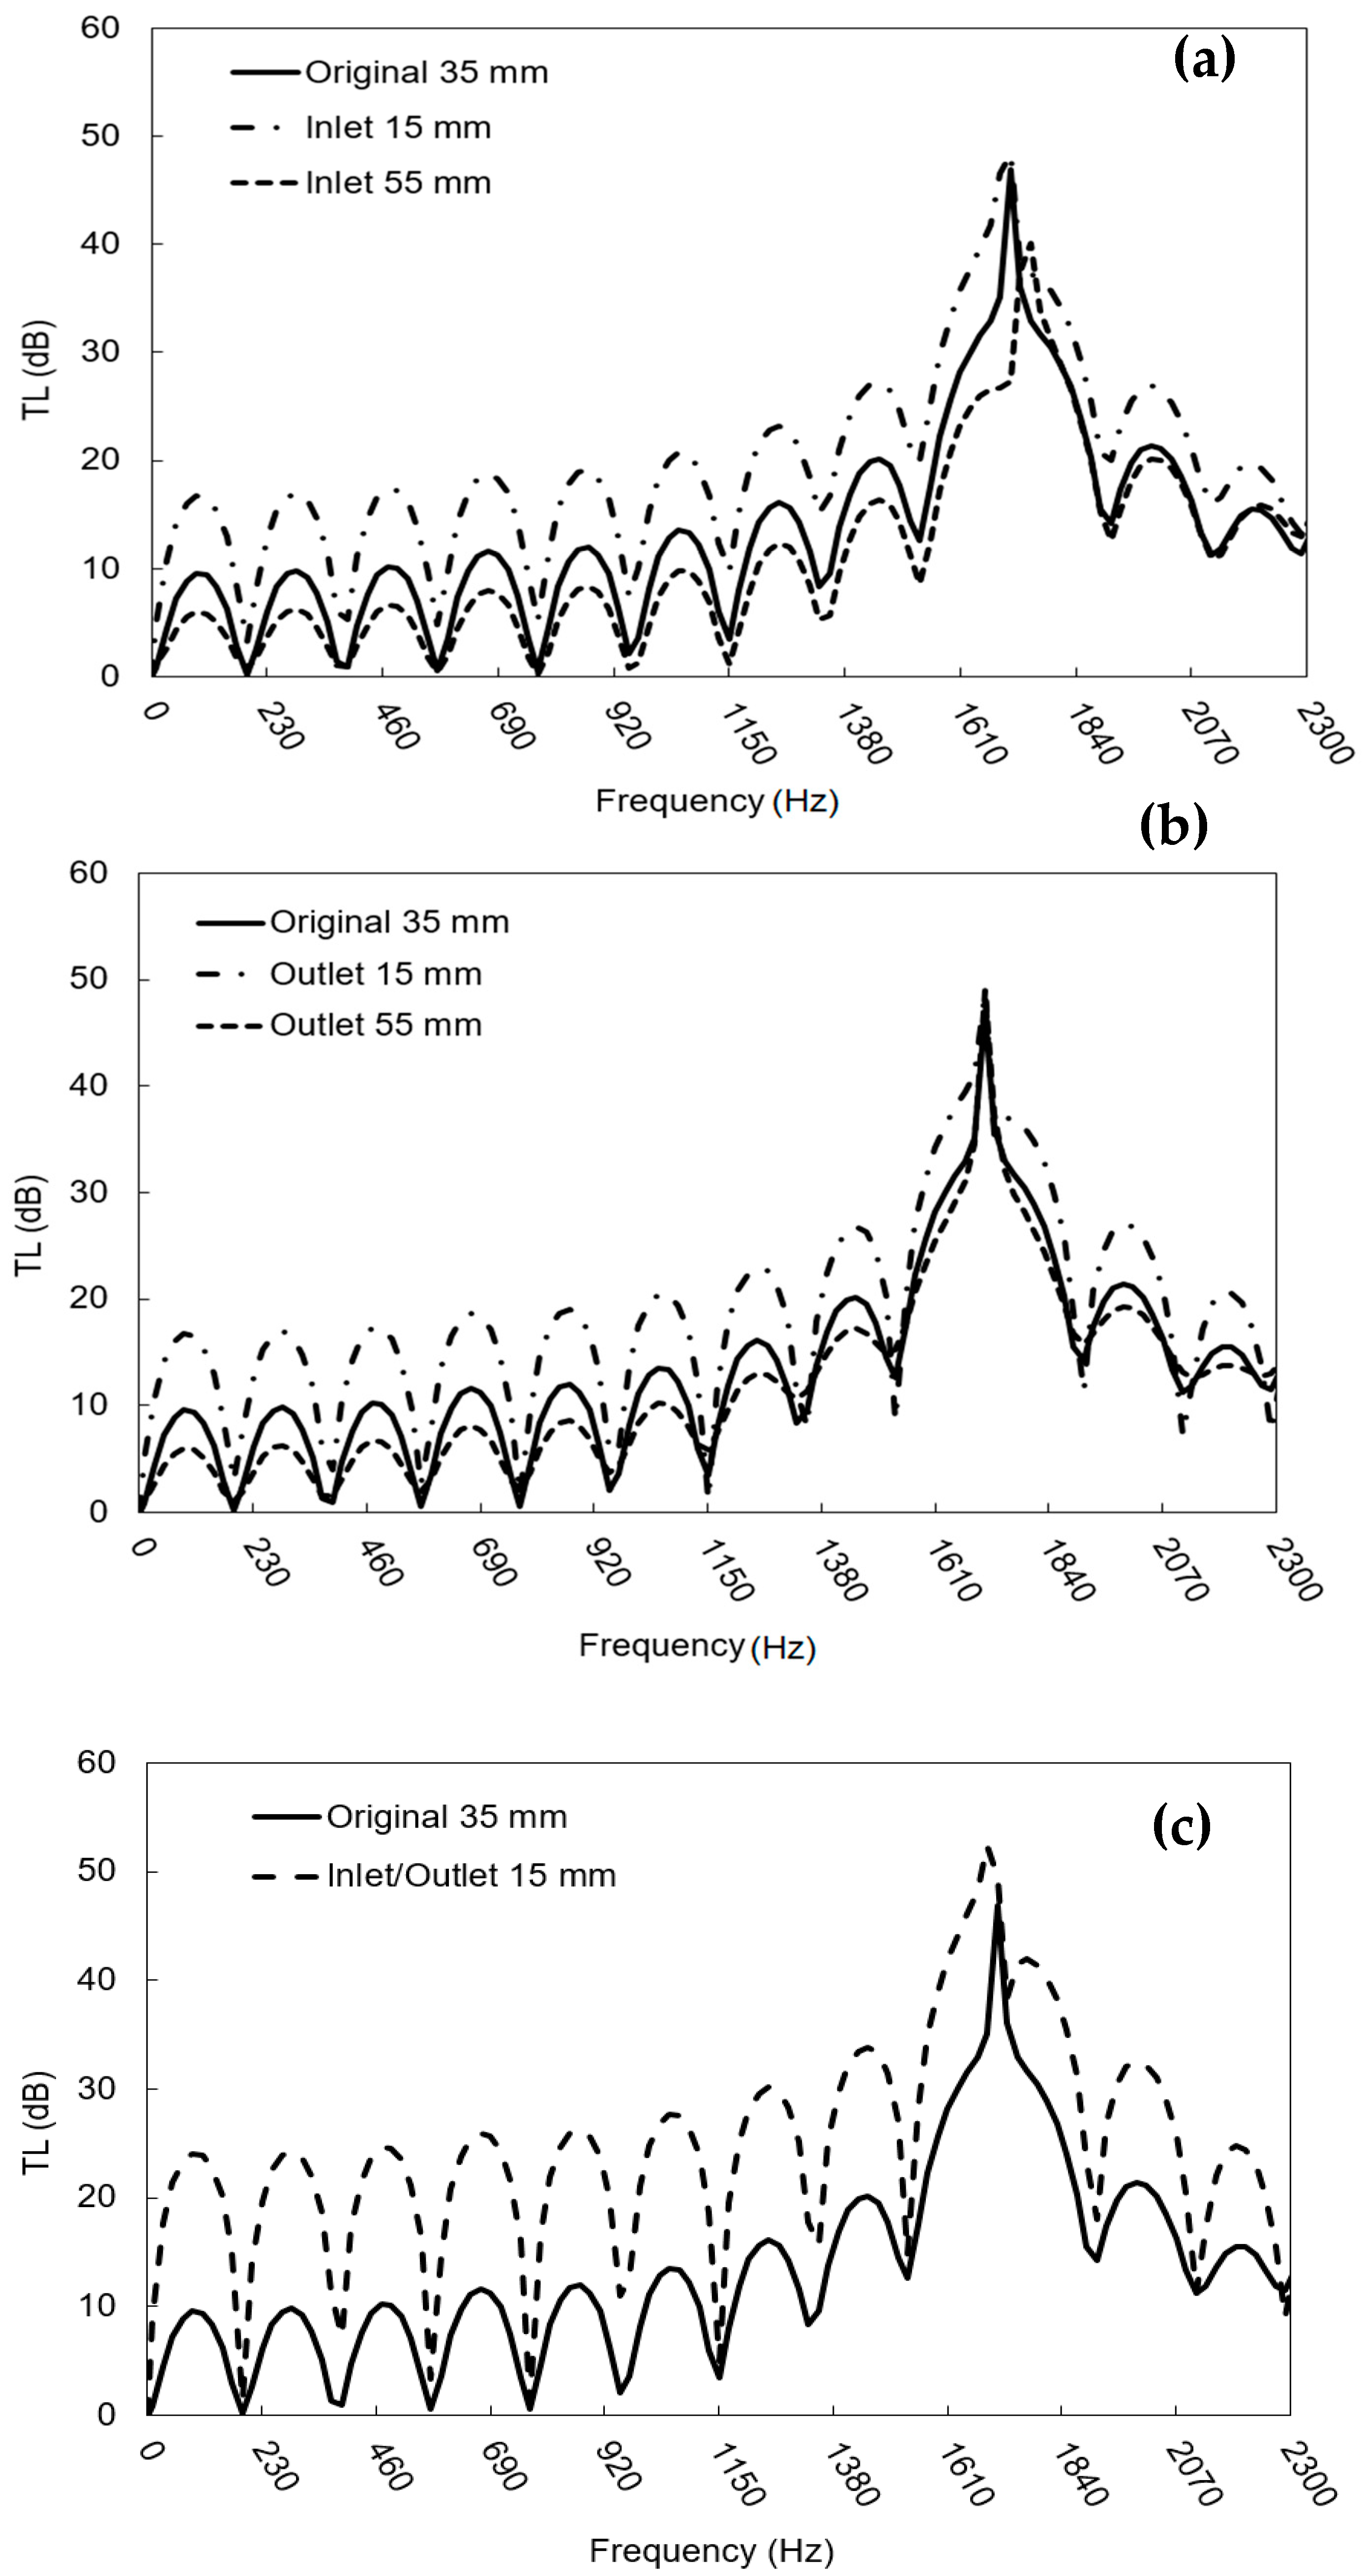
3.3. Effects of Scrubber Design on Transmission Loss

The basic design of the scrubber (i.e., characteristics of the perforated plates and scrubber diameter and height) should comply with the requirements of the chemical processing of exhaust gases and cannot be modified to improve the acoustic performance of the component. As such, the influence of modifications on the TL that do not influence the chemical process, such as the inlet/outlet pipes diameter and length, were investigated using the assessed FEM model without tube discontinuity. Moreover, the influence on the acoustic performance of the insertion of elements as perforated pipes or filler was studied.
The first modification that was performed was the increase and the reduction of the inlet pipe diameter by 20 mm in respect to the original one (35 mm) while keeping the other dimensions constant. The results reported in Figure 15a clearly show that reducing the inlet diameter leads to an increment of the TL along the whole range of considered frequencies, whereas the opposite occurs upon increasing the inlet diameter.
Figure 15b reports that the results for the outlet diameter change by 20 mm, while the other dimensions were maintained as the originals, reducing the diameter, allowing the TL amplitudes to increase but decreasing the TL minima. The increase in the diameter also leads to a worsening of the TL in this case.
Considering the effects obtained by alternately varying the inlet and outlet diameters, it was decided the influence of the simultaneous reduction of the diameters by 20 mm should be evaluated.
Considering the effects obtained by alternately varying the diameters of the inlet and outlet pipes, the influence of the simultaneous reduction of the diameters of both the inlet and outlet pipes by 20 mm was evaluated. Figure 15c shows a clear increment of the TL due to this change. This result is consistent with the literature [22]: increasing the expansion ratio between the cross-sectional area of the expansion chamber (body of the component) and the inlet/outlet pipe, the TL amplitudes increase. In the presented study, the expansion ratio of the original model-scale scrubber and the modified one with inlet and outlet pipe diameters of 15 mm were, 5.9 and 32.0, respectively.
The lengths of the inlet and outlet pipes were also increased and decreased by 50 mm without any appreciable effects on the TL (data not reported for brevity), which is consistent with the plane wave propagations in the tube [37].
Finally, the insertion of perforated pipes and filler into the model-scale scrubber, as illustrated in Figure 16, was investigated. Two perforated pipes with the following characteristics were considered: a pipe with a diameter of 17 mm, a thickness of 1.5 mm, holes featuring a diameter of 4 mm, and holes spacing of 8 mm. The filler had a flow resistivity of 3000 Pa·s/m2, which is typical of a rigid metal foam, and was 30 mm thick. Moreover, the water at the bottom of the scrubber was removed, as a water drain can be added to the scrubber in order to increment the TL and without influencing the chemical properties.
A perusal of Figure 17 shows that the insertion of the perforated pipes not only increases the TL amplitudes but also changes the fundamental frequencies of the system; this aspect has to be taken into account when considering coupling with the engine, as the transparent frequencies must not match with the exciting ones. The insertion of the filler clearly improves the TL and changes its features due to the viscous dissipation generated by the passage of the sound waves through its porous structure. The simultaneous addition of filler and perforated pipes further increased the TL, coupling the dissipation effects of the porous structure and the holes.

4. Conclusions

The results of the present investigation clearly indicate the feasibility of an a priori approach aimed at designing a multifunctional scrubber that includes a muffler functionality within the product. As a matter of fact, the assessment of the proper FEM model on the expansion chamber creates an effective tool that can be used to forecast the TL as a function of the small and subtle modification of the existing scrubber, the construction of which is dictated by the chemical requirements for exhaust abatement. In particular, this research highlighted the following points:
  • The importance of the geometry of the experimental set-up (i.e., connection between prototype and impedance tube) on the measured TL (Section 3.1 and Section 3.2);
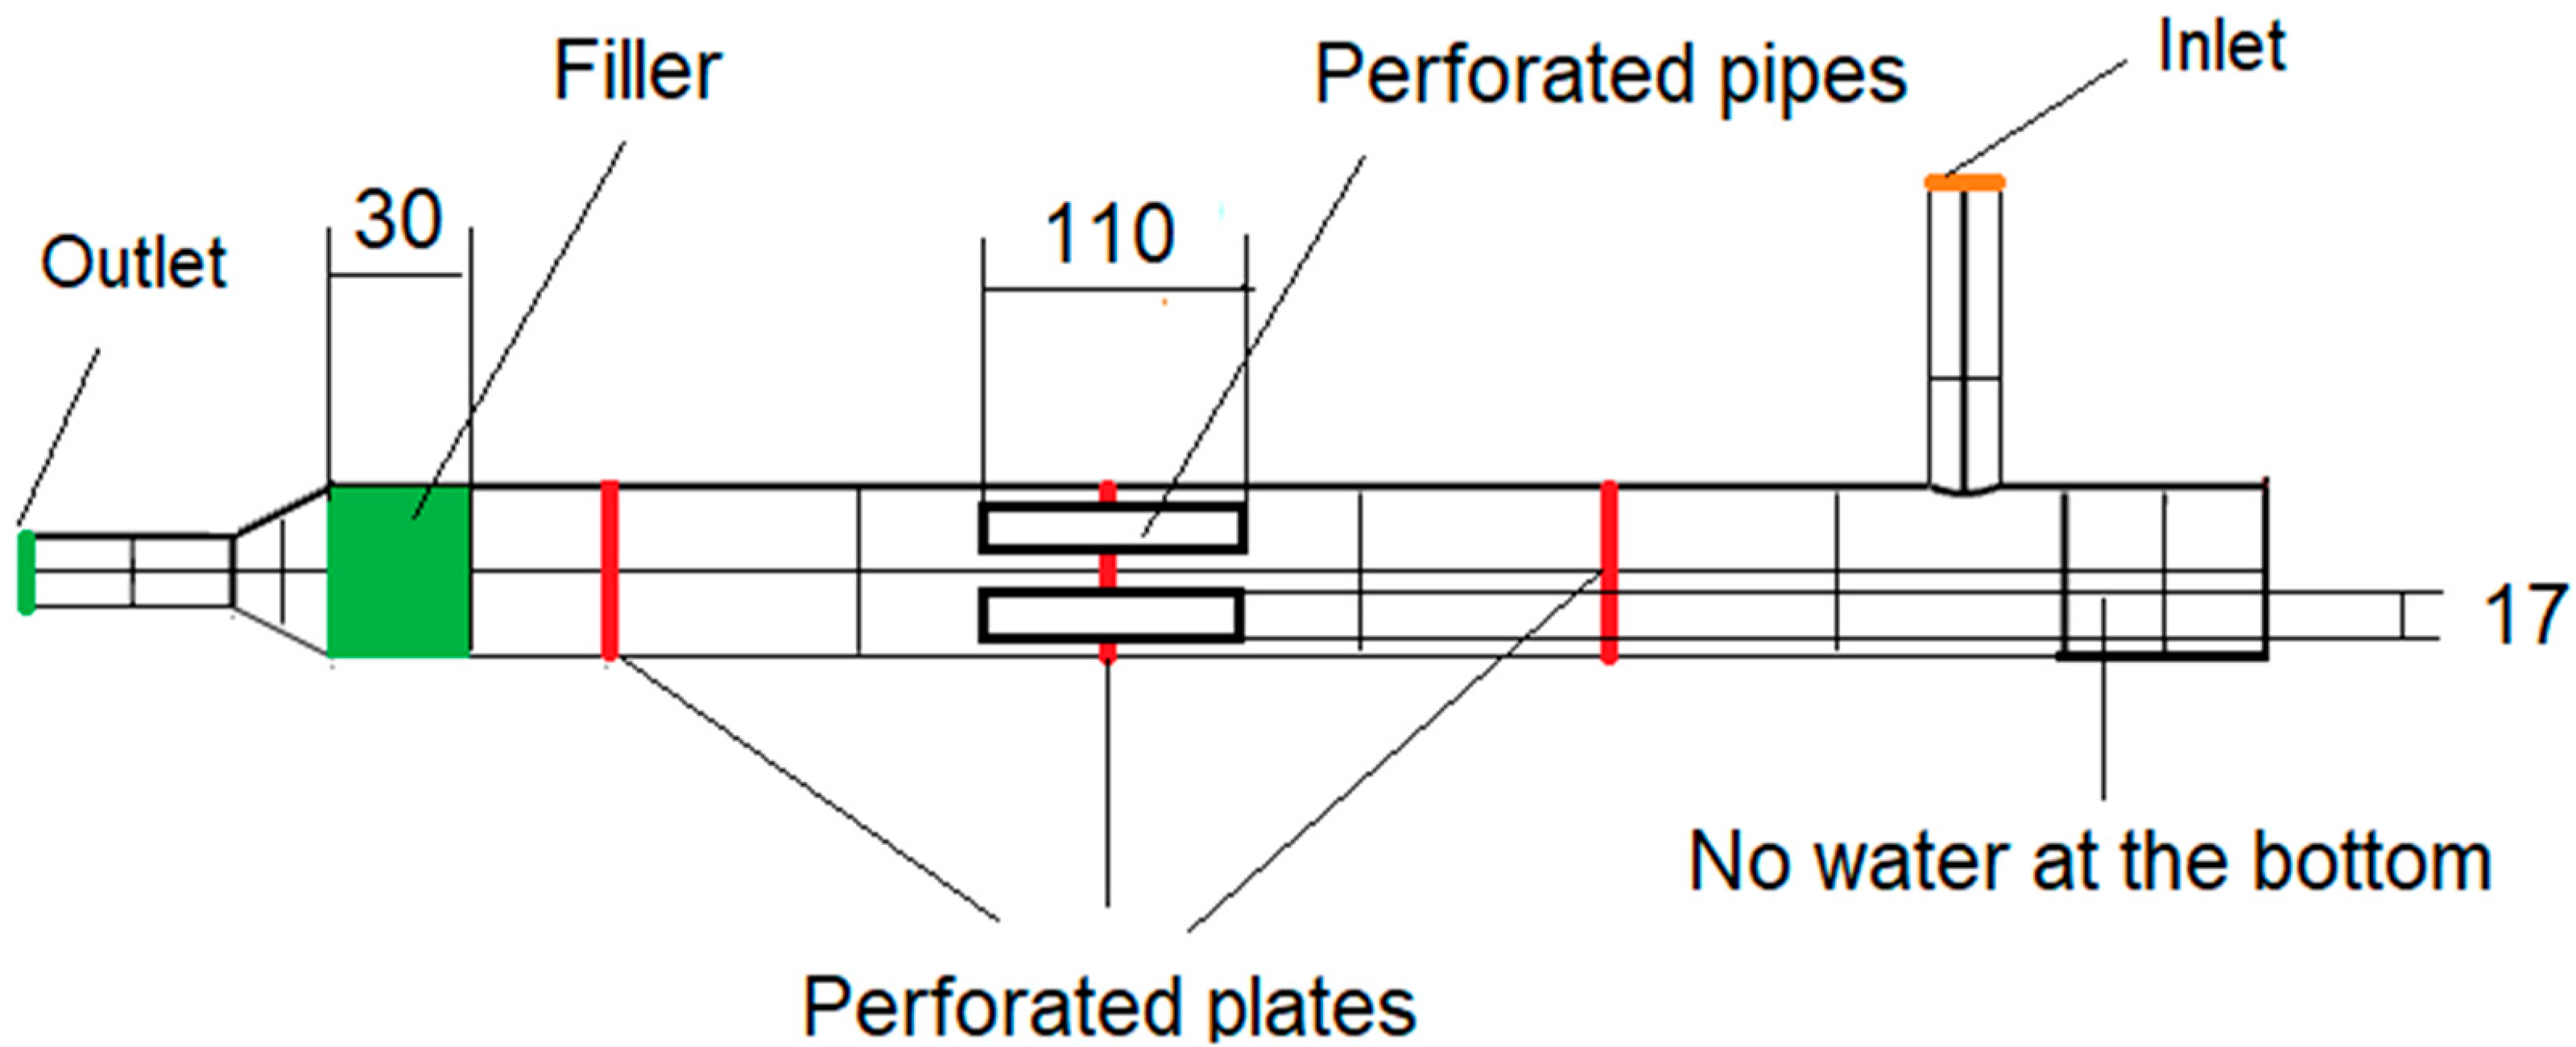
  • The removal of the water at the bottom of the scrubber (e.g., letting the water to directly flow out), allowing the TL increase at low frequencies (Section 3.2);
  • Decreasing the inlet and outlet pipe diameter of the scrubber, allowing its TL to increase along the entire frequency range (Section 3.3);
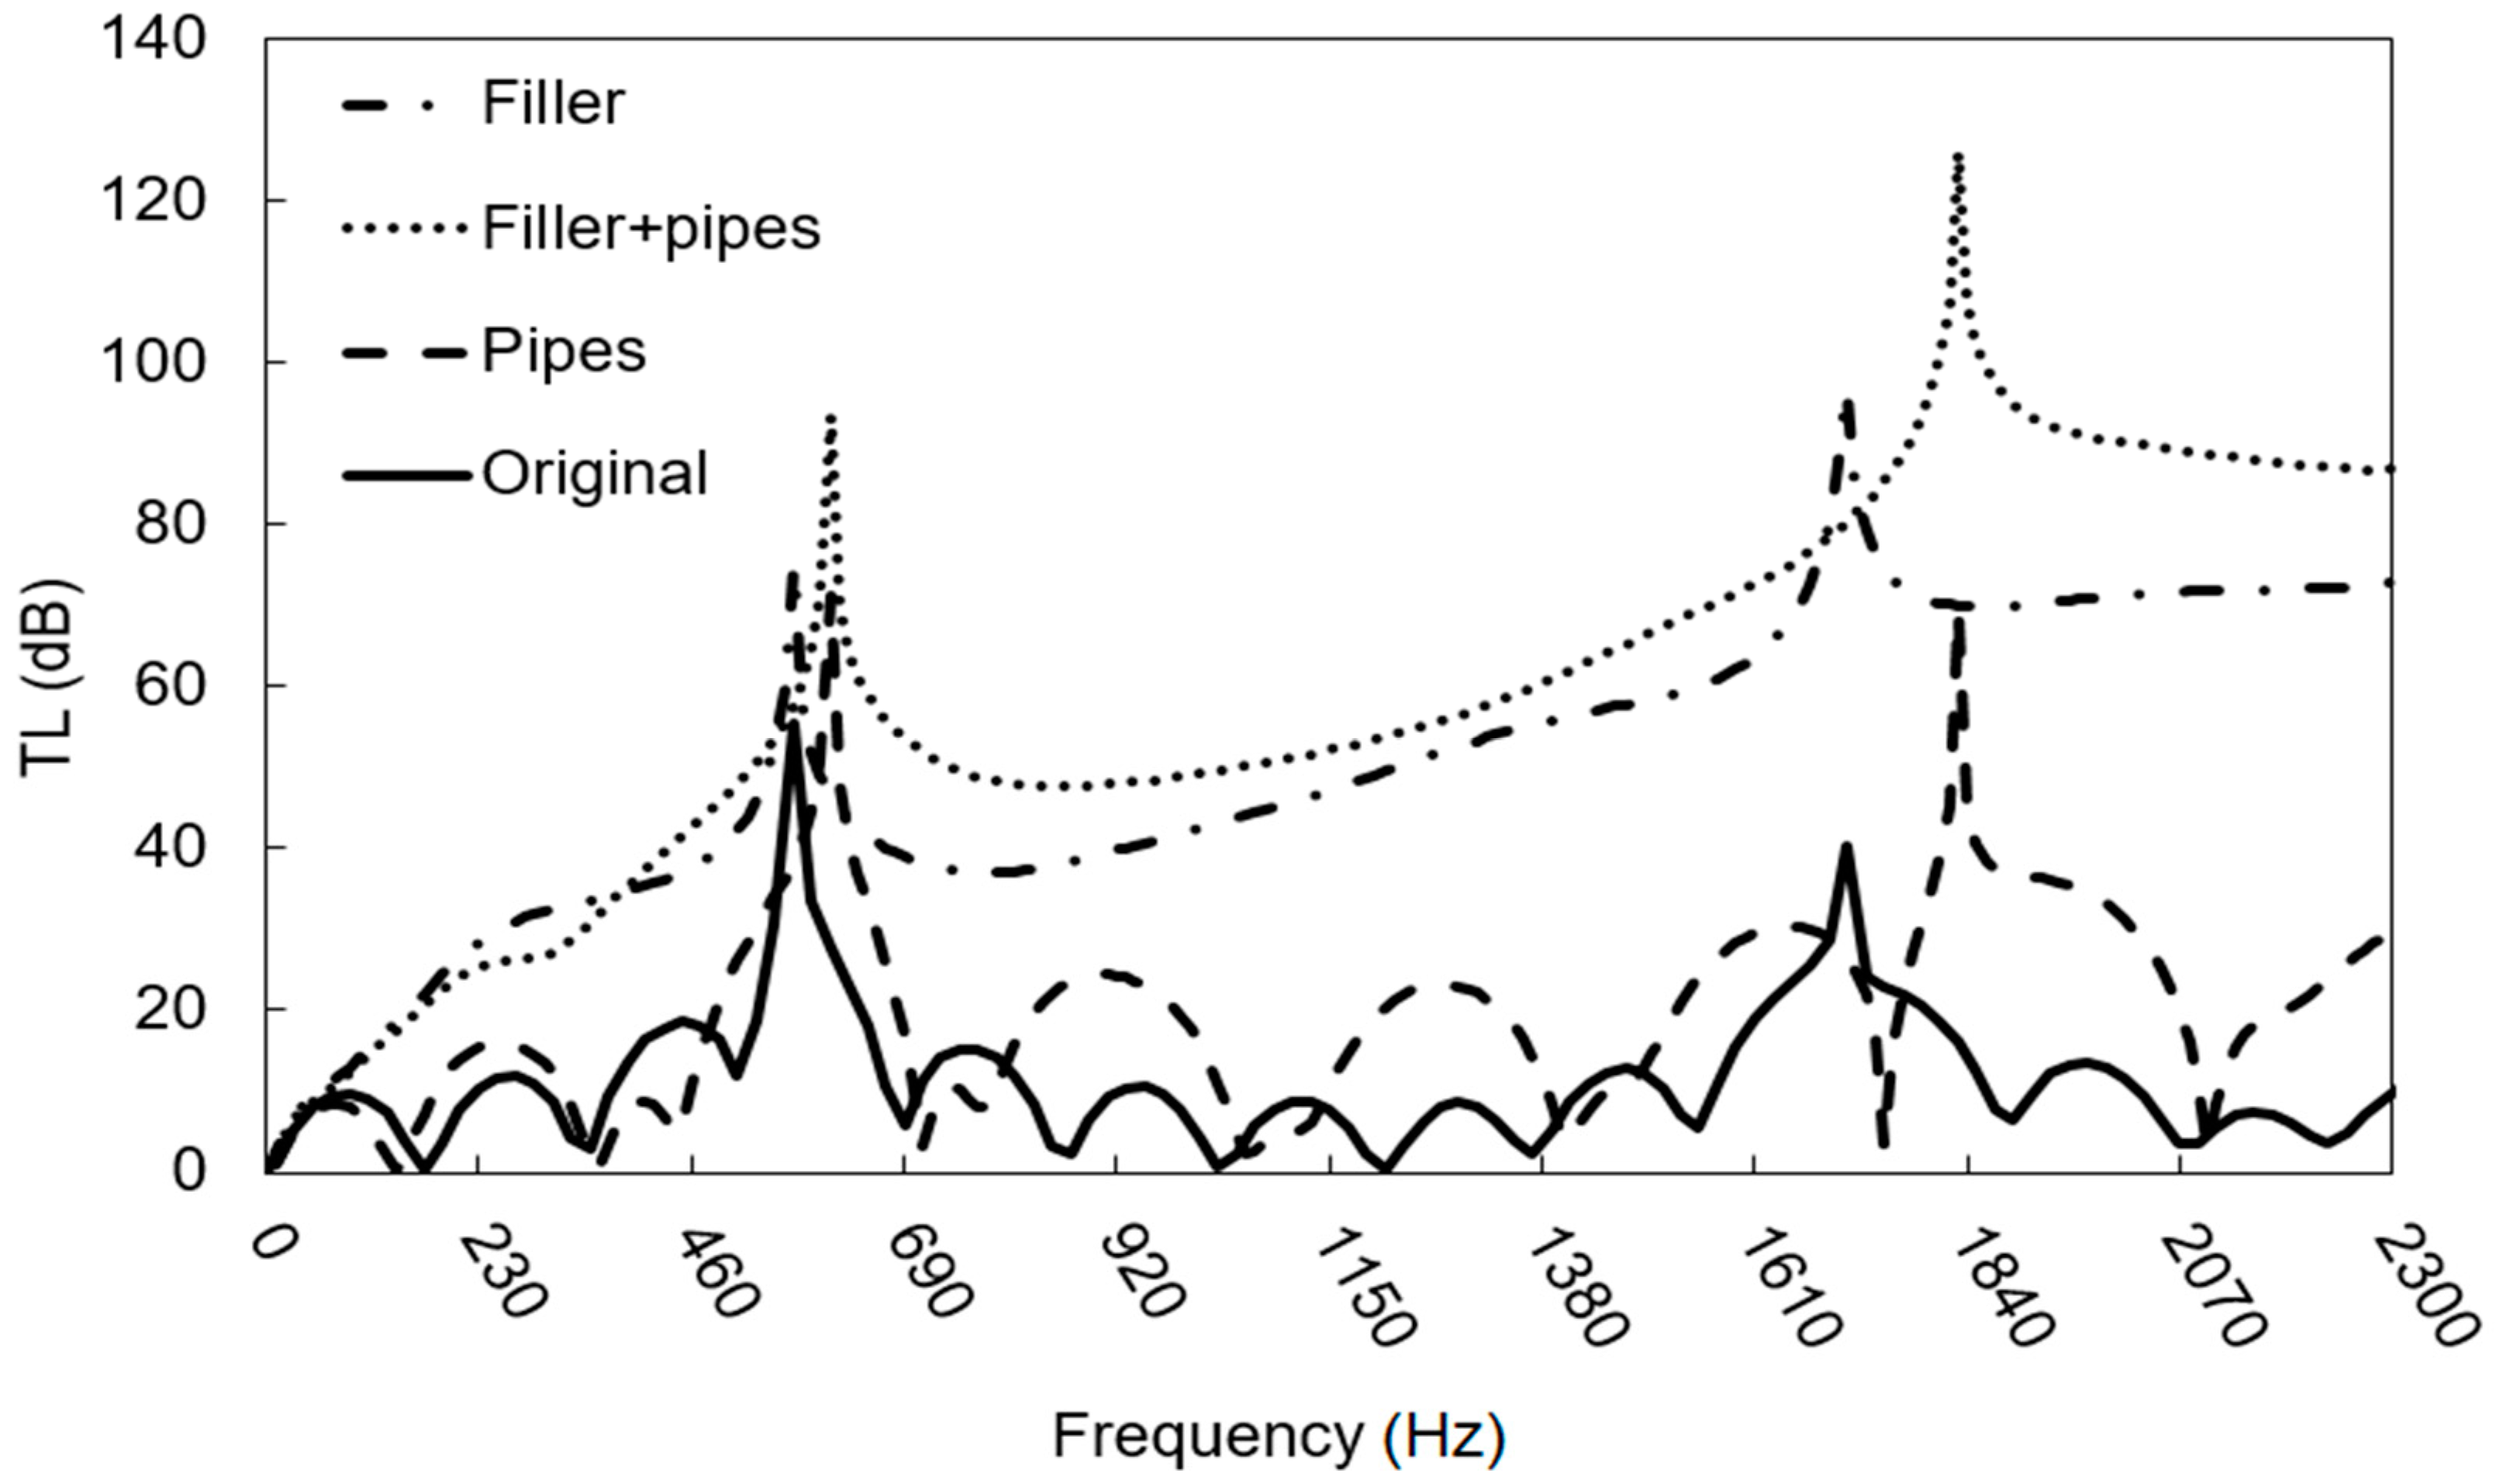
  • The addition of perforated pipes and/or a filler inside of the scrubber is possible to increase the TL and change the fundamental frequencies of the system (Section 3.3).
Clearly, further work is necessary as to assess the effect of the potential coupling of the transparent frequencies with those exciting frequencies emitted from engines that can be measured, for example, with the method proposed by [38], as an example to consider the influence of the viscous flow inside of the component. More studies on the number and type of perforated pipes and fillers considered inside the scrubber should be performed. The evidence reported here shows that even small geometry modifications allow for the acoustic properties of the scrubber (i.e., increase the TL) to be optimized and possibly allow the transparent frequency to be tuned (i.e., be able to shift the fmin away from the engine frequencies). These aspects lead to the possible reduction of the silencer dimension. Increasing the TL of the scrubber, the sound pressure exiting the system is minor, so the silencer has to ensure an inferior abatement in terms of dB that results in a lower volume. Notice that the volume of the scrubber is dictated by the chemistry/chemical engineering of the emission abatement process.

Author Contributions

Methodology, G.K.O.D.; software, G.K.O.D.; validation, G.K.O.D.; data curation, G.K.O.D.; writing—original draft preparation, G.K.O.D.; writing—review and editing, M.B., J.K. and F.M.; supervision, J.K. and F.M; funding acquisition, M.B. and J.K. All authors have read and agreed to the published version of the manuscript.

Funding

This work was supported by the “ABE-Abbattimento delle emissioni vibroacustiche e chimiche in ambito navale” project funded by Regione Autonoma Friuli Venezia Giulia, POR-FESR 2014–2020, attività 1.3b Incentivi per progetti di R&S da realizzare attraverso partenariati pubbico privati nelle aree di specializzazione Tecnologie Marittime e Smart Health—DGR 849/16.

Institutional Review Board Statement

Not applicable.

Informed Consent Statement

Not applicable.

Acknowledgments

The authors wish to gratefully thank Carlo Pestelli and Marko Gantar from Wärtsilä Italy S.p.A. for their helpful discussions and their valuable assistance in the experimental tests.

Conflicts of Interest

The authors declare no conflict of interest.

References

  1. Chen, Y.; Lv, L. Design and Evaluation of an Integrated SCR and Exhaust Muffler from Marine Diesels. J. Mar. Sci. Technol. 2015, 20, 505–519. [Google Scholar] [CrossRef]
  2. MARPOL 73/78. Annex VI-Regulations for the Prevention of Air Pollution from Ships, Chapter 3-Requirements for Control of Emissions from Ships, Regulation 13—Nitrogen Oxides (NOx); International Maritime Organization (IMO): London, UK, 2008. [Google Scholar]
  3. MARPOL 73/78. Annex VI-Regulations for the Prevention of Air Pollution from Ships, Chapter 3-Requirements for Control of Emissions from Ships, Regulation 14- Sulphure Oxides (SOx); International Maritime Organization (IMO): London, UK, 2008. [Google Scholar]
  4. Ushakov, S.; Stenersen, D.; Einang, P.M.; Ask, T.Ø. Meeting Future Emission Regulation at Sea by Combining Low-Pressure EGR and Seawater Scrubbing. J. Mar. Sci. Technol. 2020, 25, 482–497. [Google Scholar] [CrossRef]
  5. Zhao, Y.; Fan, Y.; Fagerholt, K.; Zhou, J. Reducing Sulfur and Nitrogen Emissions in Shipping Economically. Transp. Res. Part D: Transp. Environ. 2021, 90, 102641. [Google Scholar] [CrossRef]
  6. Johnsen, K.; Kock, F.; Strøm, A.; Chryssakis, C. Global Sulphur Cap 2020 Update. 2019, p. 52. Available online: https://www.dnvgl.com/maritime/publications/global-sulphur-cap-2020.html (accessed on 22 December 2020).
  7. Oil Price Information. Available online: https://www.petrolbunkering.com/price-information/ (accessed on 22 February 2021).
  8. Lindstad, H.E.; Rehn, C.F.; Eskeland, G.S. Sulphur Abatement Globally in Maritime Shipping. Transp. Res. Part D Transp. Environ. 2017, 57, 303–313. [Google Scholar] [CrossRef] [Green Version]
  9. Scrubbers Shown to Have Lower Climate Impact than Low-Sulphur Fuel, Wärtsilä Corporation. Available online: https://Www.Wartsila.Com/Media/News/22-09-2020-Scrubbers-Shown-to-Have-Lower-Climate-Impact-than-Low-Sulphur-Fuel-2786812 (accessed on 29 December 2020).
  10. Boscarato, I.; Hickey, N.; Kašpar, J.; Prati, M.V.; Mariani, A. Green Shipping: Marine Engine Pollution Abatement Using a Combined Catalyst/Seawater Scrubber System. 1. Effect of Catalyst. J. Catal. 2015, 328, 248–257. [Google Scholar] [CrossRef] [Green Version]
  11. International Maritime Organization. Resolution MSC.337(91), Code on Noise Levels on Board Schips; IMO: London, UK, 2012. [Google Scholar]
  12. Lloyd’s Register, ShipRight procedures, Additional Design & Construction Procedure (ADP), Procedure for the Determination of Airborne Noise Emissions from Marine Vessels, January 2019. Available online: https://www.lr.org/en/shipright-procedures/#accordion-additionaldesign&constructionprocedure(adp) (accessed on 28 December 2020).
  13. NAM KyoungHun. Scrubber with Noise Reduction on Ship. Korean Patent KR102039134 (B1), 5 November 2019.
  14. Sridhara, B.S.; Crocker, M.J. Review of Theoretical and Experimental Aspects of Acoustical Modeling of Engine Exhaust Systems. J. Acoust. Soc. Am. 1994, 95, 2363–2370. [Google Scholar] [CrossRef]
  15. Tao, Z.; Seybert, A.F. A Review of Current Techniques for Measuring Muffler Transmission Loss. J. Passeng. Car Mech. Syst. J. 2003, 112, 2096–2100. [Google Scholar]
  16. Beranek, L.L.; Ver, I.L. Noise and Vibration Control Engineering, 2nd ed.; John Wiley & Sons, Inc.: Hoboken, NJ, USA, 2005; ISBN 10-0471449423. [Google Scholar]
  17. Dokumaci, E. Duct Acoustics: Fundamentals and Applications to Mufflers and Silencers; Cambridge University Press: Cambridge, UK, 2021; ISBN 9781108887656. [Google Scholar] [CrossRef]
  18. Bodén, H.; Glav, R. Exhaust and intake noise and acoustical design of mufflers and silencers. In Handbook of Noise and Vibration Control; Crocker, M.J., Ed.; John Wiley & Sons, Inc.: Hoboken, NJ, USA, 2007; Chapter 85. [Google Scholar] [CrossRef]
  19. Chung, J.Y.; Blaser, D.A. Transfer Function Method of Measuring In-duct Acoustic Properties. II. Experiment. J. Acoust. Soc. Am. 1980, 68, 914–921. [Google Scholar] [CrossRef]
  20. Chung, J.Y.; Blaser, D.A. Transfer Function Method of Measuring In-duct Acoustic Properties. I. Theory. J. Acoust. Soc. Am. 1980, 68, 907–913. [Google Scholar] [CrossRef]
  21. ISO 10534: Acoustics—Determination of Sound Absorption Coefficient and Impedance in Impedances Tubes—Part 2: Transfer Function Method; International Organization for Standardization: Geneva, Switzerland, 2001.
  22. Munjal, M.L. Acoustics of Ducts and Mufflers, 2nd ed.; John Wiley & Sons, Inc.: Hoboken, NJ, USA, 2014; ISBN 10 1118443128. [Google Scholar]
  23. Munjal, M.L.; Doige, A.G. Theory of a Two Source-Location Method for Direct Experimental Evaluation of the Four-Pole Parametersof an Acoustic Element. J. Sound Vib. 1990, 141, 323–333. [Google Scholar] [CrossRef]
  24. Zhang, H.; Fan, W.; Guo, L.-X. A CFD Results-Based Approach to Investigating Acoustic Attenuation Performance and Pressure Loss of Car Perforated Tube Silencers. Appl. Sci. 2018, 8, 545. [Google Scholar] [CrossRef] [Green Version]
  25. Zhu, D.D.; Ji, Z.L. Transmission Loss Prediction of Reactive Silencers Using 3-D Time-Domain CFD Approach and Plane Wave Decomposition Technique. Appl. Acoust. 2016, 112, 25–31. [Google Scholar] [CrossRef]
  26. Bing, W.; Yongjuan, W.; Cheng, X. Study of Transmission Loss on Muffler. RJASET 2013, 5, 5556–5560. [Google Scholar] [CrossRef]
  27. Tan, W.-H.; Ripin, Z.M. Analysis of Exhaust Muffler with Micro-Perforated Panel. J. Vibroeng. 2013, 15, 558–573. [Google Scholar]
  28. Katz, B.F.G. Method to Resolve Microphone and Sample Location Errors in the Two-Microphone Duct Measurement Method. J. Acoust. Soc. Am. 2000, 108, 2231–2237. [Google Scholar] [CrossRef] [PubMed]
  29. MSC Software-Hexagon. Actran 2020 User’s Guide, Volume, Installation, Operations, Theory and Utilities; Free Field Technologies: Mont-Saint-Guibert, Belgium, 2020. [Google Scholar]
  30. Marburg, S.; Nolte, B. Computational Acoustics of Noise Propagation in Fluids: Finite and Boundary Element Methods; Springer: Berlin, Germany, 2008; ISBN 978-3-540-77447-1. [Google Scholar]
  31. Marburg, S. Six boundary elements per wavelength: Is that enough? J. Comput. Acoust. 2002, 10, 25–51. [Google Scholar] [CrossRef]
  32. Kurowski, P.M. Finite Element Analysis for Design Engineers, 2nd ed.; SAE International: Warrendale, PA, USA, 2017. [Google Scholar]
  33. Maa, D.-Y. Potential of Microperforated Panel Absorber. J. Acoust. Soc. Am. 1998, 104, 2861–2866. [Google Scholar] [CrossRef]
  34. Wartsila Italia S.p.A.; Trieste, Italy. Personal communication, 2021.
  35. Yang, Y.; Jia, H.; Lu, W.; Sun, Z.; Yang, J. Impedance-Matching Acoustic Bend Composed of Perforated Plates and Side Pipes. J. Appl. Phys. 2017, 122, 054502. [Google Scholar] [CrossRef] [Green Version]
  36. Dubno, J.R.; Eckert, M.A.; Lee, F.-S.; Matthews, L.J.; Schmiedt, R.A. Classifying Human Audiometric Phenotypes of Age-Related Hearing Loss from Animal Models. J. Assoc. Res. Otolaryngol. 2013, 14, 687–701. [Google Scholar] [CrossRef] [PubMed]
  37. Weston, D.E. The Theory of the Propagation of Plane Sound Waves in Tubes. Proc. Phys. Soc. B 1953, 66, 695–709. [Google Scholar] [CrossRef]
  38. Gao, Z.; Saine, K.; Hynninen, A.; Tanttari, J. Large engine exhaust noise in real life and measurement techniques in practice. In Proceedings of the 26th International Congress on Sound and Vibration, Montreal, QC, Canada, 7–11 July 2019. [Google Scholar]
Figure 1. Measurement set-up according to the decomposition theory.
Applsci 11 09079 g001
Figure 2. Measurement set-up according to the two-source method.
Applsci 11 09079 g002
Figure 3. Measurement set-up according to the two-load method.
Applsci 11 09079 g003
Figure 4. Example of acoustic mode shapes in circular ducts.
Applsci 11 09079 g004
Figure 5. Schematization of the acoustic FEM model with duct modes.
Applsci 11 09079 g005
Figure 6. Geometry of (a) expansion chamber and (b) model-scale scrubber; dimensions in mm.
Applsci 11 09079 g006
Figure 7. Experimental set-up of the (a) expansion chamber and the (b) model-scale scrubber with the closed (1) and the open (2) terminations.
Applsci 11 09079 g007aApplsci 11 09079 g007b
Figure 8. Details of the bushing used to connect the expansion chamber and the impedance tube.
Applsci 11 09079 g008
Figure 9. Discretized expansion chamber (a1) without and (a2) with the pipe discontinuity and model-scale scrubber (b1) without and (b2) with the pipe discontinuity.
Applsci 11 09079 g009
Figure 10. Comparison of analytical and experimental TL curves for the expansion chamber.
Applsci 11 09079 g010
Figure 11. Comparison between analytical and FEM-simulated TL of the simple expansion chamber without discontinuity.
Applsci 11 09079 g011
Figure 12. Comparison between experimental and FEM-simulated TL of the expansion chamber with tube discontinuity.
Applsci 11 09079 g012
Figure 13. Comparison between experimental and FEM-simulated TL of the model-scale scrubber with discontinuity.
Applsci 11 09079 g013
Figure 14. Comparison between experimental and FEM-simulated TL of the model-scale scrubber with and without discontinuity and with water.
Applsci 11 09079 g014
Figure 15. Influence of the pipe diameters on the model-scale scrubber TL: (a) inlet pipe, (b) outlet pipe, (c) combined inlet/outlet pipes.
Applsci 11 09079 g015
Figure 16. Model-scale scrubber geometry modifications.
Applsci 11 09079 g016
Figure 17. Influence of the insertion of a perforated pipes and filler on the model-scale scrubber TL.
Applsci 11 09079 g017
Table 1. Air and water characteristics used in the numerical model.
c (m/s)ρ (kg/m3)μ (Pa/s)
Air340.01.2251.78 × 10−5
Water1448.9999.11.14 × 10−3
Table 2. Mesh quality parameters.
MaxMeanMin
Jacobian111
Aspect Ratio6.421.761.03
Table 3. Comparison between analytical and experimental fmin and fmax of TL for the simple expansion chamber.
nAnalytical fmin
(Hz)
Experimental fmin
(Hz)
Delta fmin
(%)
Analytical fmax
(Hz)
Experimental fmax
(Hz)
Delta
fmax
(%)
0000.0170220+29.4
1340348+2.4510508−0.4
2680685+0.7850919+8.1
310201050+2.911901226+3.0
413601382+1.615301520−0.7
Table 4. Comparison between analytical and experimental TL amplitudes of simple expansion chamber.
nAnalytical Amplitudes
(dB)
Experimental Amplitudes
(dB)
Delta Amplitudes
(dB)
016.116.6+0.5
116.119.0+2.9
216.112.8−3.3
316.120.2+4.1
416.115.6−0.6
Table 5. Comparison between analytical and FEM data of simple expansion chamber without discontinuity.
nFEM fmin
(Hz)
Delta fmin
(%)
FEM fmax
(Hz)
Delta fmax
(%)
FEM Amplitudes
(dB)
Delta Amplitudes
(dB)
000.01700.016.10.0
13480.05100.016.10.0
26800.08500.016.10.0
310400.011900.016.5+0.4
413700.015300.016.7+0.6
Table 6. Comparison between experimental and FEM with discontinuity data of simple expansion chamber.
nFEM
Discontinuty fmin
(Hz)
Delta fmin
(%)
FEM
Discontinuty fmax
(Hz)
Delta fmax
(%)
FEM Discontinuty Amplitudes
(dB)
Delta
Amplitudes
(dB)
000.02200.016.3−0.3
13480.0510+0.419.3+0.3
2680−0.7860−5.712.0−0.8
31040−0.91220−0.519.5−0.7
41370−0.91510−0.716.4+0.8
Table 7. Comparison between experimental and FEM fmin and fmax of TL for the model-scale scrubber with discontinuity.
nExperimental fmin
(Hz)
FEM fmin
(Hz)
Delta fmin
(%)
Experimental fmax
(Hz)
FEM
fmax (Hz)
Delta
fmax (%)
0000.0119120+0.8
1195190−2.6288290+0.7
2351350−0.3448460+2.7
3511510−0.2584570−2.4
4668675+1.0731750+2.6
5838840+0.2911930+2.1
610081020+1.211101130+1.8
712061220+1.213041310+0.5
813761375−0.114671480+0.9
915271545+1.216321660+1.7
1016741680+0.417541710−2.5
1118481860+0.619181930+0.6
1220152020+0.220982100+0.1
1321822160−1.022482250+0.1
Table 8. Comparison between experimental and FEM amplitudes of model-scale scrubber with discontinuity.
nExperimental Amplitudes
(dB)
FEM Amplitudes
(dB)
Delta Amplitudes
(dB)
09.46.3−3.1
114.812.2−2.6
223.021.2−1.8
367.362.5−4.8
418.016.2−1.8
59.07.4+1.6
65.25.3+0.1
78.67.2−1.4
89.413.4+4.0
913.723.1+9.4
1049.948.8−1.1
1115.010.2−4.8
1210.27.3−2.9
136.19.2+3.1
Publisher’s Note: MDPI stays neutral with regard to jurisdictional claims in published maps and institutional affiliations.

