Article

Reliability-Based Design of Driven Piles Considering Setup Effects

1
School of Civil Engineering and Architecture, Wuhan Institute of Technology, Wuhan 430074, China
2
College of Civil Engineering and Architecture, Henan University of Technology, Zhengzhou 450001, China
*
Author to whom correspondence should be addressed.
Appl. Sci. 2021, 11(18), 8609; https://doi.org/10.3390/app11188609
Submission received: 20 August 2021 / Revised: 9 September 2021 / Accepted: 14 September 2021 / Published: 16 September 2021
(This article belongs to the Special Issue Mathematical Model and Computation in Geotechnical Engineering)

Abstract

:
The total ultimate resistance (or bearing capacity) of driven piles considering setup effects is composed of initial ultimate resistance and setup resistance, and the setup effects of driven piles are mainly reflected by the setup resistance. In literature, a logarithmic empirical formula is generally used to quantify the setup effects of driven piles. This paper proposes an increase factor (Msetup) to modify the resistance factor and factor of safety calculation formula in accordance with the load and resistance factor design (LFRD) principle; here, the increase factor is defined as the ratio of the setup resistance (Rsetup) to the initial ultimate resistance (R0) of driven piles. Meanwhile, the correlation between R0 and Rsetup is fully considered in the resistance factor and factor of safety calculation. Finally, the influence of four key parameters (ratio of dead load to live load ρ = QD/QL, target reliability index βT, Msetup, correlation coefficient between R0 and Rsetup, ρR0,Rsetup) on the resistance factor and factor of safety are analyzed. Parametric research shows that ρ has basically no effect on the resistance factor, which can be taken as a constant in further research, and ρ has a significant influence on the factor of safety. The value of Msetup has almost no effect on the resistance factor and factor of safety. However, βT and ρR0,Rsetup have a significant influence on the resistance factor and factor of safety, so the value selection of βT and ρR0,Rsetup are crucial for reliability-based design of driven piles. Through this study, it is concluded that considering setup effects in reliability-based design of driven piles will greatly improve the prediction for design capacity.

1. Introduction

During the process of pile installation, the excess pore pressure generated dissipates over time, and the effective stress in the soil will increase, which is the main reason for the increase in the total ultimate resistance of driven piles after installation with time [1,2]. This phenomenon is usually called the pile setup. In recent years, the setup effect of piles has been paid more attention. In fact, the total ultimate resistance is composed of initial ultimate resistance and setup resistance, and the setup resistance is the main factor to increase the total ultimate resistance [3,4,5]. Therefore, determination of setup resistance is important in the reliability-based design of driven piles. Haque et al. [6] report the field results of test piles driven in two different sites in Louisiana to evaluate the setup effect of piles. In order to better understand the effect of soil layering on the setup of piles, Ng and Ksaibati conducted four medium-scale experiments in the laboratory and concluded that the pile setup trend follows the mode of pore water pressure dissipation in cohesive soil [7]. Haque and Abu-Farsakh [8] analyzed twelve prestressed concrete test piles in different bridge construction projects in Louisiana and established an analysis model to estimate the setup effect of piles.
Many studies are available in the literature to evaluate the capacity of piles on the basis of static and dynamic load tests. Afsharhasani et al. [9] suggested installing the hydraulic jack as close to the caliche layers as possible. Doan et al. [10] proposed a new CPT method, which can be expected to lead to more reliable estimates of pile capacity. Farhangi et al. [11] presented a method in which the risk of soil liquefaction is reduced by using jet-grouted micropiles in sand. Qubain et al. [12] put forward the importance of understanding the unique aspects of the site geology. Baca and Rybak [13] presented three different pipe pile test methods, which provided the possibility to evaluate the pile base and shaft bearing capacities. However, it is not convenient to evaluate the setup effect of piles.
With the accumulation of experience and understanding of the pile setup phenomenon, some researchers [14,15,16] recommended that the pile setup phenomenon should be incorporated into the total ultimate resistance by the load and resistance factor design (LRFD) method. LRFD is a more advanced design method than the existing allowable stress design (ASD) [17], and many countries and regions, such as the United States, Canada, China mainland, Japan, Korea, Singapore, Europe, and Hong Kong, have replaced ASD with LRFD.
Against this background, many researchers calculated the resistance factor and factor of safety for driven piles considering the setup effects based on the LRFD method. Komurka et al. [18] used the factor of safety to estimate setup effects in the driven pile resistance. Yang and Liang [19] proposed to incorporate the setup resistance into LRFD of driven piles based on the first-order reliability method (FORM). A framework for calculating the resistance factor of LRFD for driven piles in clay was proposed, which can fully consider all necessary reliability-related parameters [20]. Ng and Sritharan [21] presented a method to incorporate the economic advantages of a pile setup into LRFD recommendations to further improve the efficiency of bridge foundations. Bian et al. [22] used reliability theory and the LRFD principle to establish an iterative algorithm of estimation of separate resistance factors. According to the LRFD methodology, the development of the analysis model is introduced to estimate the soil setup after the end of driving (EOD), and then the resistance factor of the pile setup is determined [16]. Bian et al. [23] put forward a methodology to separately calculate the resistance factors for ultimate base and shaft resistance for reliability-based design of driven piles considering setup effects based on the LRFD principle.
This paper modifies the resistance factor and factor of the safety formula of driven piles by incorporating setup effects into the LRFD principle. In the modified formula, the increase factor Msetup = Rsetup/R0, defined as the ratio of setup resistance to initial ultimate resistance, is used to express the increasing degree of the ultimate resistance with time. The influence of parameters (ratio of dead load to live load ρ = QD/QL, target reliability index βT, Msetup = Rsetup/R0, correlation coefficient between R0 and Rsetup, ρR0,Rsetup) on the resistance factor and factor of safety are analyzed.

2. Basic Estimation Methods of Pile Setup

Due to the pile setup, the total ultimate resistance of driven piles includes two parts, initial ultimate resistance and setup resistance, which can be expressed as the following equation:
R = R 0 + R setup
where R is the total ultimate resistance at time t after driving, R0 is the initial ultimate resistance at initial time t0, and Rsetup is the setup resistance at time t after driving.
The significant importance to accurately assess setup resistance for the reliability-based design of driven piles is indicated by Equation (1). Therefore, many researchers have paid attention to this issue and proposed empirical relationships for quantifying the setup effects of driven piles. An empirical formula for the setup was presented by Skov and Denver [24] based on a logarithmic augment in pile bearing capacity with time. Long et al. [25] proposed a formula predicting the rate at which the pile capacity augmented with the increase in time. The formula presented by Svinkin et al. [26] was used to predict the setup based on load test data on five concrete piles. An alternative method of using a hyperbolic function to predict the setup was developed by Bogard and Matlock [27]. Among the existing formulas, the logarithmic empirical relationship by Skov and Denver [24] has been commonly used for the prediction of the pile setup, that is:
R setup = R 0 A log t t 0
where t is the elapsed time from the end of initial pile driving; t0 is the reference time after which the resistance increases become linear on this plot; A is a factor that is a function of soil type and is the rate of pile resistance (R/R0) increase per log cycle of time (t/t0).

3. Estimation of the Resistance Factor of Driven Piles

3.1. General LRFD Principle of Driven Piles

In order to conduct reliability-based design of driven piles, the limit state equation should be established first. If the total ultimate resistance of driven piles (R) and the load effect (Q) are considered, the limit state equation can be expressed as:
g = R Q = 0
Because the LFRD method can well explain the uncertainty in geotechnical engineering, this method is often used for the reliability-based design of driven piles. The basic formula for the limit state design by AASHTO is [28]:
ϕ R n η γ i Q i
where ϕ is the resistance factor; Rn is the nominal resistance; η is the load modifier to account for effects of ductility, redundancy, and operational importance; Qi is the load effect and γi is the load factor. The value of η generally is obtained as 1.
The load effect Q, herein, only includes the combination of the dead load QD and the live load QL, and the LRFD criterion can be expressed as:
ϕ R n γ QD Q D + γ QL Q L
Therefore, the resistance factor ϕ can be estimated as [28]:
ϕ = λ R ( γ QD ρ + γ QL ) × 1 + COV QD 2 + COV QL 2 1 + COV R 2 ( λ QD ρ + λ QL ) × exp { β T ln [ ( 1 + COV R 2 ) ( 1 + COV QD 2 + COV QL 2 ) ] }
where λR, λQD, and λQL are the bias factors for resistance, dead load, and live load, respectively; COVR, COVQD, and COVQL are the coefficients of variation (COVs) for resistance, dead load, and live load, respectively. The following relevant statistics for QD and QL are accepted for further study: λQD = 1.080, λQL = 1.150, σQD = 0.140, σQL = 0.207, COVQD = 0.130, and COVQL = 0.180 [28]. Meanwhile, the distributions of QD and QL are assumed to be lognormal.
The corresponding factor of safety (FOS) in allowable stress design (ASD) can be calculated as follows:
F O S = γ Q D ρ + γ Q L ϕ ( 1 + ρ )
Substituting Equation (6) for (7), the computed formulas for the factor of safety for driven piles are as follows:
F O S = ( λ QD ρ + λ QL ) × exp { β T ln [ ( 1 + COV R 2 ) ( 1 + COV QD 2 + COV QL 2 ) ] } λ R ( 1 + ρ ) × 1 + COV QD 2 + COV QL 2 1 + COV R 2

3.2. Considering Setup Effects in the LRFD Principle of Driven Piles

In order to make the reliability-based design of driven piles conform to the LRFD framework, the principle of strength limit state function corresponding to setup effects is expanded as:
g = R 0 + R setup Q D Q L = 0
As the ultimate resistance of driven piles increases over time after pile driving, the setup effects further affect the resistance of driven piles. Incorporating the setup effect in the LRFD principle of driven piles is remarkable progress. For this, the LRFD standard can be re-expressed as:
ϕ ( R 0 + R setup ) γ QD Q D + γ QL Q L
The ratio of the setup resistance to the initial ultimate resistance of the driven piles is called the increase factor of the ultimate resistance of driven piles and denoted as Msetup by Equation (11).
M setup = R setup R 0
Based on Equations (2) and (11), the increase factor Msetup is re-expressed by:
M setup = A log t t 0
It can be seen from Equation (12) that Msetup is mainly determined by parameters A and log(t/t0). The research in Yang and Liang [19] indicated the approximate range of A from 0.1 to 1 for driven piles in clay. Meanwhile, Yang and Liang [29] also defined the approximate range of A from 0.1 to 0.9 for driven piles in sand. Comparing the results about parameter A from Yang and Liang [19,29], it is reasonable to accept the values of A from 0.1 to 1 in this study. Furthermore, time t after EOD for most cases occurs between 1 day and 100 days, for which log(t/t0) with t0 = 1 is between 0 and 2. Therefore, compiling the analysis about parameters A and log(t/t0), the increase factor Msetup is determined in the range of 0 to 2 for this study.
Then, Equations (13) and (14) are obtained based on Equation (11) and the LRFD principle [28]:
λ R R n = λ R 0 R 0 + λ Rsetup R setup = ( λ R 0 + λ Rsetup M setup ) R 0
and
λ R R n = λ R ( R 0 + R setup ) = λ R ( 1 + M setup ) R 0
so
λ R = λ R 0 + λ Rsetup M setup 1 + M setup
where λR0 is the bias factors for pile resistance at initial time t0.
Substituting Equation (15) into (6), the computed formulas for the resistance factor of driven piles considering setup effects is as follows:
ϕ = λ R 0 + λ Rsetup M setup 1 + M setup × ( γ QD ρ + γ QL ) × 1 + COV QD 2 + COV QL 2 1 + COV R 0 2 + COV Rsetup 2 ( λ QD ρ + λ QL ) × exp { β T ln [ ( 1 + COV R 0 2 + COV Rsetup 2 ) ( 1 + COV QD 2 + COV QL 2 ) ] }
In Equation (16), the formation mechanisms of initial ultimate resistance and setup resistance indicate that the development of the total ultimate resistance of driven piles is the result of the synergistic effect of initial ultimate resistance and setup resistance. Therefore, with the interaction between the initial ultimate resistance and setup resistance of driven piles, the inevitable correlation that exists between R0 and Rsetup should be seriously considered in reliability-based design. The expressions of the resistance factor of driven piles, considering the correlation between R0 and Rsetup, is:
ϕ = λ R 0 + λ Rsetup M setup 1 + M setup × ( γ QD ρ + γ QL ) × 1 + COV QD 2 + COV QL 2 1 + COV R 0 2 + 2 ρ R 0 , Rsetup COV R 0 COV Rsetup + COV Rsetup 2 ( λ QD ρ + λ QL ) × exp { β T ln [ ( 1 + COV R 0 2 + 2 ρ R 0 , Rsetup COV R 0 COV Rsetup + COV Rsetup 2 ) × ( 1 + COV QD 2 + COV QL 2 ) ] }
where ρR0,Rsetup is the correlation coefficient between R0 and Rsetup. When the distributions of R0 and Rsetup are assumed to be lognormal, the following relevant statistics for R0 and Rsetup are accepted for further study: λR0 = 1.158, λRsetup=1.023, σR0 = 0.393, σRsetup = 0.593, COVR0 = 0.339, and COVRsetup = 0.580, by referring to these literatures [29,30]. Meanwhile, when the distributions of Rsetup are assumed to be normal, the following relevant statistics for Rsetup are accepted for further study: λRsetup = 1.141, σRsetup = 0.543 and COVRsetup = 0.475 [19].
Substituting Equation (15) into (8), the computed formulas for the factor of safety of driven piles considering setup effects is as follows:
F O S = ( λ QD ρ + λ QL ) × exp { β T ln [ ( 1 + COV R 0 2 + COV Rsetup 2 ) × ( 1 + COV QD 2 + COV QL 2 ) ] } λ R 0 + λ Rsetup M setup 1 + M setup × ( 1 + ρ ) × 1 + COV QD 2 + COV QL 2 1 + COV R 0 2 + COV Rsetup 2
Therefore, the expressions of the factor of safety of driven piles, considering the correlation between R0 and Rsetup, is:
F O S = ( λ QD ρ + λ QL ) × exp { β T ln [ ( 1 + COV R 0 2 + 2 ρ R 0 , Rsetup COV R 0 COV Rsetup + COV Rsetup 2 ) × ( 1 + COV QD 2 + COV QL 2 ) ] } λ R 0 + λ Rsetup M setup 1 + M setup × ( 1 + ρ ) × 1 + COV QD 2 + COV QL 2 1 + COV R 0 2 + 2 ρ R 0 , Rsetup COV R 0 COV Rsetup + COV Rsetup 2

4. Parametric Analysis

4.1. Effect of ρ on the Resistance Factor and the Factor of Safety

This section intends to study the effect of ρ on the resistance factor and the factor of safety for driven piles. βT is designed as 2.33 (corresponding failure probability is 0.01), and the increase factor Msetup is accepted as a value of 1, which is the mean value of the recommended range between 0 and 2. According to Hansell et al. [31] point out that for the relationship of the ratio of ρ = QD/QL and the bridge span length, the values in the range of 0.5 to 4 for ρ = QD/QL are used. It should be noted that the correlation between R0 and Rsetup is not considered in this section. Based on these proposed values of key parameters, the resistance factor and factor of safety can be calculated using Equations (17) and (19). The variations of the calculated resistance factor and factor of safety with ρ = QD/QL for driven piles in clay and sand are shown in Figure 1.
ϕ slightly decreases as ρ increases from 0.5 to 4 in the distribution curve of ϕ versus ρ. In particular, the resistance factor decreases obviously when ρ is between 0.5 and 2, but the resistance factor tends to be constant when ρ is between 2 and 4. Meanwhile, Figure 1 also can verify driven piles considering setup effects have greater uncertainties in sand, because the resistance factor of driven piles in clay is larger than the resistance factor of driven piles in sand for the same value of ρ, the average difference is about 22%. Particularly, for ρ = 2.0, the recommended resistance factor of driven piles in clay and sand are estimated as 0.26 and 0.20, respectively.
The value of FOS decreases obviously as ρ increases from 0 to 4 in the distribution curve of FOS versus ρ, but the decreasing rate decreases gradually, and the value of FOS approaches a constant when ρ tends to infinity. Meanwhile, when ρ increases from 0 to 4, the value of FOS nearly decreases from 7.98 to 1.6 in clay, with a decrement of about 79.9%; when ρ increases from 0 to 4, the value of FOS nearly decreases from 9.47 to 1.89 in sand, with a decrement of about 80%. Therefore, the value of ρ is one of the most important factors for the factor of safety.
By comparing the two figures in Figure 1, it can be concluded that the resistance factor and factor of safety for driven piles in sand and clay both decrease with the increase in ρ, but varying ρ is not largely sensitive to the resistance factor for reliability-based design of driven piles, which is consistent with other research in this field [32,33]. On the contrary, the factor of safety for driven piles in clay and sand decreases greatly with ρ.

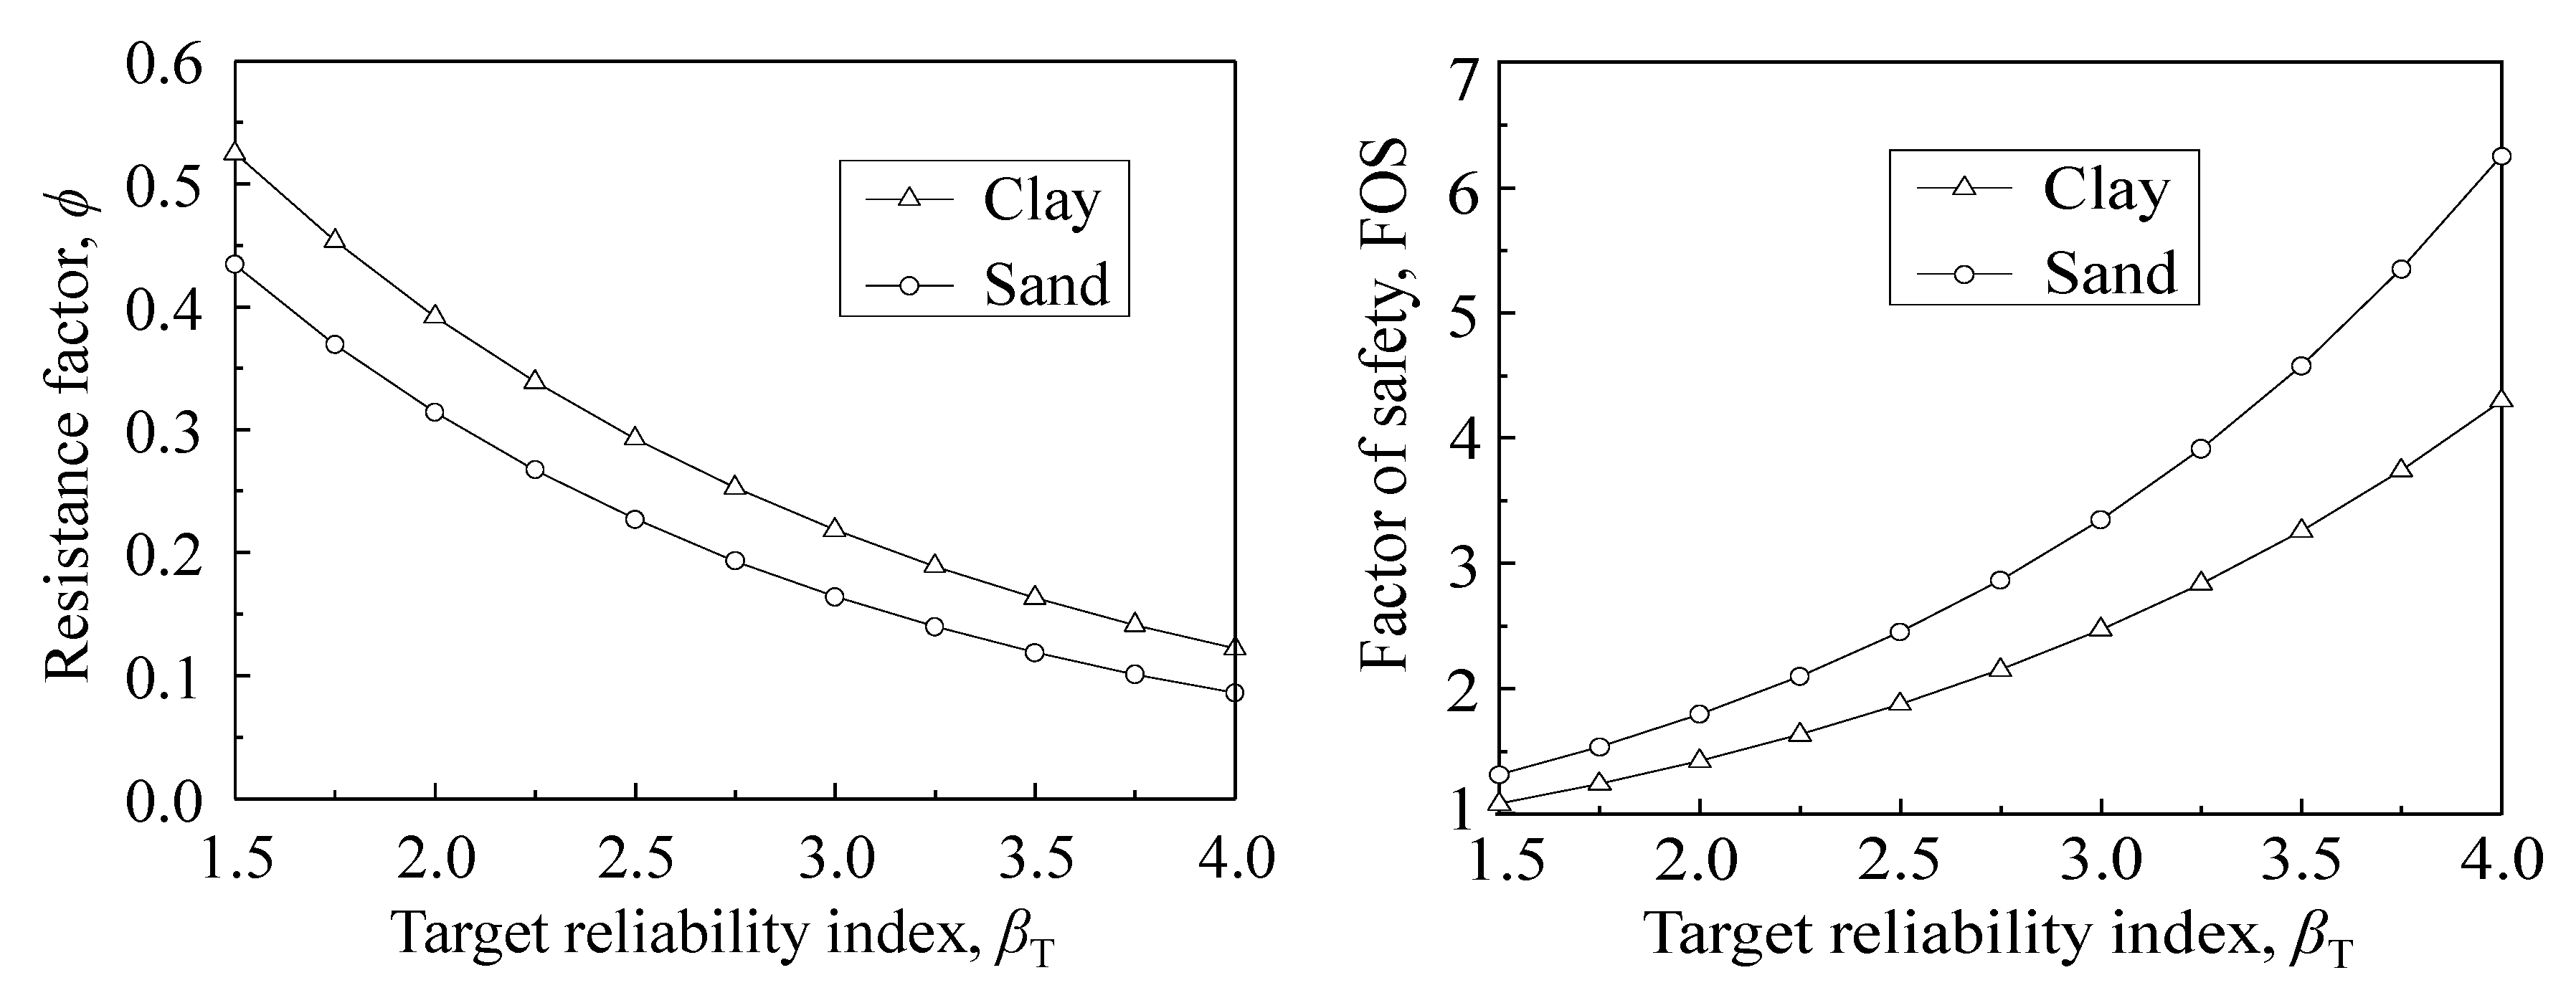
4.2. Effect of βT on the Resistance Factor and the Factor of Safety

βT is one of the most important factors for reliability-based design of driven piles. The six allowable values of βT are 1.5, 2.0, 2.5, 3.0, 3.5, and 4.0, respectively, and it is indisputably accepted to study the effect of βT on the resistance factor and the factor of safety for driven piles. Meanwhile, some parameters are determined as follows, Msetup = 1.0, ρ = 3.69 [34,35]. It should be noted that the correlation between R0 and Rsetup is not considered in this section. Using the above parameters, the resistance factor and the factor of safety are calculated by Equations (17) and (19), and the relationships between the resistance factor and the factor of safety against βT are shown in Figure 2.
In the distribution curve of ϕ versus βT, it is obvious that the ϕ of driven piles in clay and sand both decrease with the increase in βT. The ϕ of driven piles decreases tardily with βT increasing from 1.5 and 2.5, and by contrast, decreases rapidly with increasing βT from 2 to 4. These phenomena illustrate that ϕ of driven piles in clay and sand are sensitive to βT. When βT increases from 1.5 to 4.0, ϕ nearly decreases from 0.52 to 0.12 in clay, with a decrement of about 77%; when βT increases from 1.5 to 4, ϕ nearly decreases from 0.43 to 0.09 in sand, with a decrement of about 79%.
In the distribution curve of FOS versus βT, it is obvious that the value of the FOS of driven piles in clay and sand both increase with the increase in βT, and the FOS of driven piles decreases rapidly with increasing βT from 2.5 to 4. These phenomena indicate that the higher the target reliability of driven piles is, the safer the structure is.
By comparing the two figures in Figure 2, it can be concluded that βT has a significant effect on the resistance factor and factor of safety. Therefore, the value of βT is one of the most important factors for the reliability-based design of driven piles.

4.3. Effect of Msetup on the Resistance Factor and the Factor of Safety

Msetup is one of the important factors for analyzing the influence of the resistance factor and the factor of safety. Therefore, in order to study the influence of Msetup on the resistance factor and factor of safety for driven piles in clay and sand, the values of key parameters are determined, such as βT = 2.33 and ρ = 3.69. It should be noted that the correlation between R0 and Rsetup is not considered in this section. Meanwhile, based on the previous discussion of Msetup, there are sufficient reasons to make Msetup equal to 0.5, 1.0, 1.5, 2.0, 2.5, 3.0, 3.5 and 4.0, respectively. The varying regularity of the resistance factor and factor of safety for the driven piles in clay and sand with Msetup are shown in Figure 3.
In the distribution curve of ϕ versus Msetup, it can be obviously seen that the ϕ of driven piles in sand decreases slowly with the increase in Msetup. In the clay, the resistance factor of the driven piles remains basically unchanged with the increase in Msetup. Meanwhile, it can be seen from Equations (11) and (12) that the value of Msetup is larger and the value of Rsetup is larger. The value of Msetup is determined by the type of soil, so it is concluded that the size of Msetup is adjusted by selecting different soil, and then the size of Rsetup is controlled.
In the distribution curve of FOS versus Msetup, it can be obviously seen that the value of FOS of driven piles in sand and clay both increase slowly with the increase in Msetup. It can be further seen that the calculated factor of safety of driven piles in sand is larger than those in clay, and the difference between them is about 20% for a given Msetup. This phenomenon shows that the type of soil has a great influence on the factor of safety for driven piles, which should be emphasized in practical application.
By comparing the two figures in Figure 3, it can be concluded that the resistance factor of driven piles in sand and clay decreases with the increase in Msetup, while the factor of safety for driven piles in clay and sand increases with the increase in Msetup. Particularly, no matter how Msetup changes, the resistance factor and the factor of safety remain basically unchanged. Therefore, the final resistance factor of driven piles in clay and sand are 0.25 and 0.19, respectively, and the final factor of safety of driven piles in clay and sand are 1.70 and 2.20, respectively.

4.4. Effect of ρ R 0 , R s e t u p on Resistance Factor and Factor of Safety

In order to illustrate the effect of the correlation coefficient between R0 and Rsetup, ρR0,Rsetup on resistance factor and factor of safety for driven piles in sand and clay, Equations (16) and (18) are used to calculate the resistance factor and factor of safety. Meanwhile, in order to further analyze the influence of ρR0,Rsetup on the resistance factor and the factor of safety, some parameters are determined, for example βT = 2.33, Msetup = 1.0, ρ = 3.69. The variations of the calculated resistance factor and factor of safety with ρR0,Rsetup for driven piles in clay and sand are shown in Figure 4.
It can be seen that the resistance factor of driven piles in clay and sand both decrease with increasing ρR0,Rsetup, but the decreasing rate of resistance factor with ρR0,Rsetup between −1.0 and 0 is obviously greater than that with ρR0,Rsetup between 0 and 1.0 in clay and sand. This indicates that the negative correlation between R0 and Rsetup has a significant influence on the resistance factor of driven piles, while the positive correlation between R0 and Rsetup has a slight influence on the resistance factor of driven piles. It is obvious from Figure 4 that the resistance factor of driven piles in clay and the resistance factor of driven piles in sandy are quite different, and the difference is about 20% under the same correlation coefficient between R0 and Rsetup levels. Therefore, the value selection of ρR0,Rsetup is crucial in geotechnical engineering.
In the distribution curve of FOS versus ρR0,Rsetup, the value of FOS increases obviously when ρR0,Rsetup increases from −1 to 1. The increasing rate of driven piles in sand increases gradually, but the decreasing rate of driven piles in clay decreases gradually. This indicates that the positive correlation between R0 and Rsetup has a significant influence on the safety of driven piles, while the negative correlation between R0 and Rsetup has a little influence on the safety of driven piles.

5. Conclusions

There are the following conclusions to be obtained.
(1)
ρ = QD/QL has basically no effect on the resistance factor of driven piles in clay and sand, so ρ can be regarded as a constant. Meanwhile, the resistance factor of driven piles in clay is greater than the resistance factor of driven piles in sand under the same ratio of dead load to live load level. It shows that the uncertainty of driven piles considering setup effects in sand is greater than the uncertainty of driven piles considering setup effects in clay.
(2)
Through the analysis of parametric βT, it is found that the smaller the resistance of the driven piles is, the higher the factor of safety for the driven piles, and the more reliable the driven piles are.
(3)
Through the analysis of parametric Msetup, it is found that the soil type has a great influence on the reliability-based design of driven piles. Meanwhile, whichever value of Msetup is selected, the resistance factor of driven piles considering setup effects in sand and clay are basically 0.25 and 0.32, respectively, and the factor of safety for driven piles considering setup effects in clay and sand are basically 1.7 and 2.2, respectively.
(4)
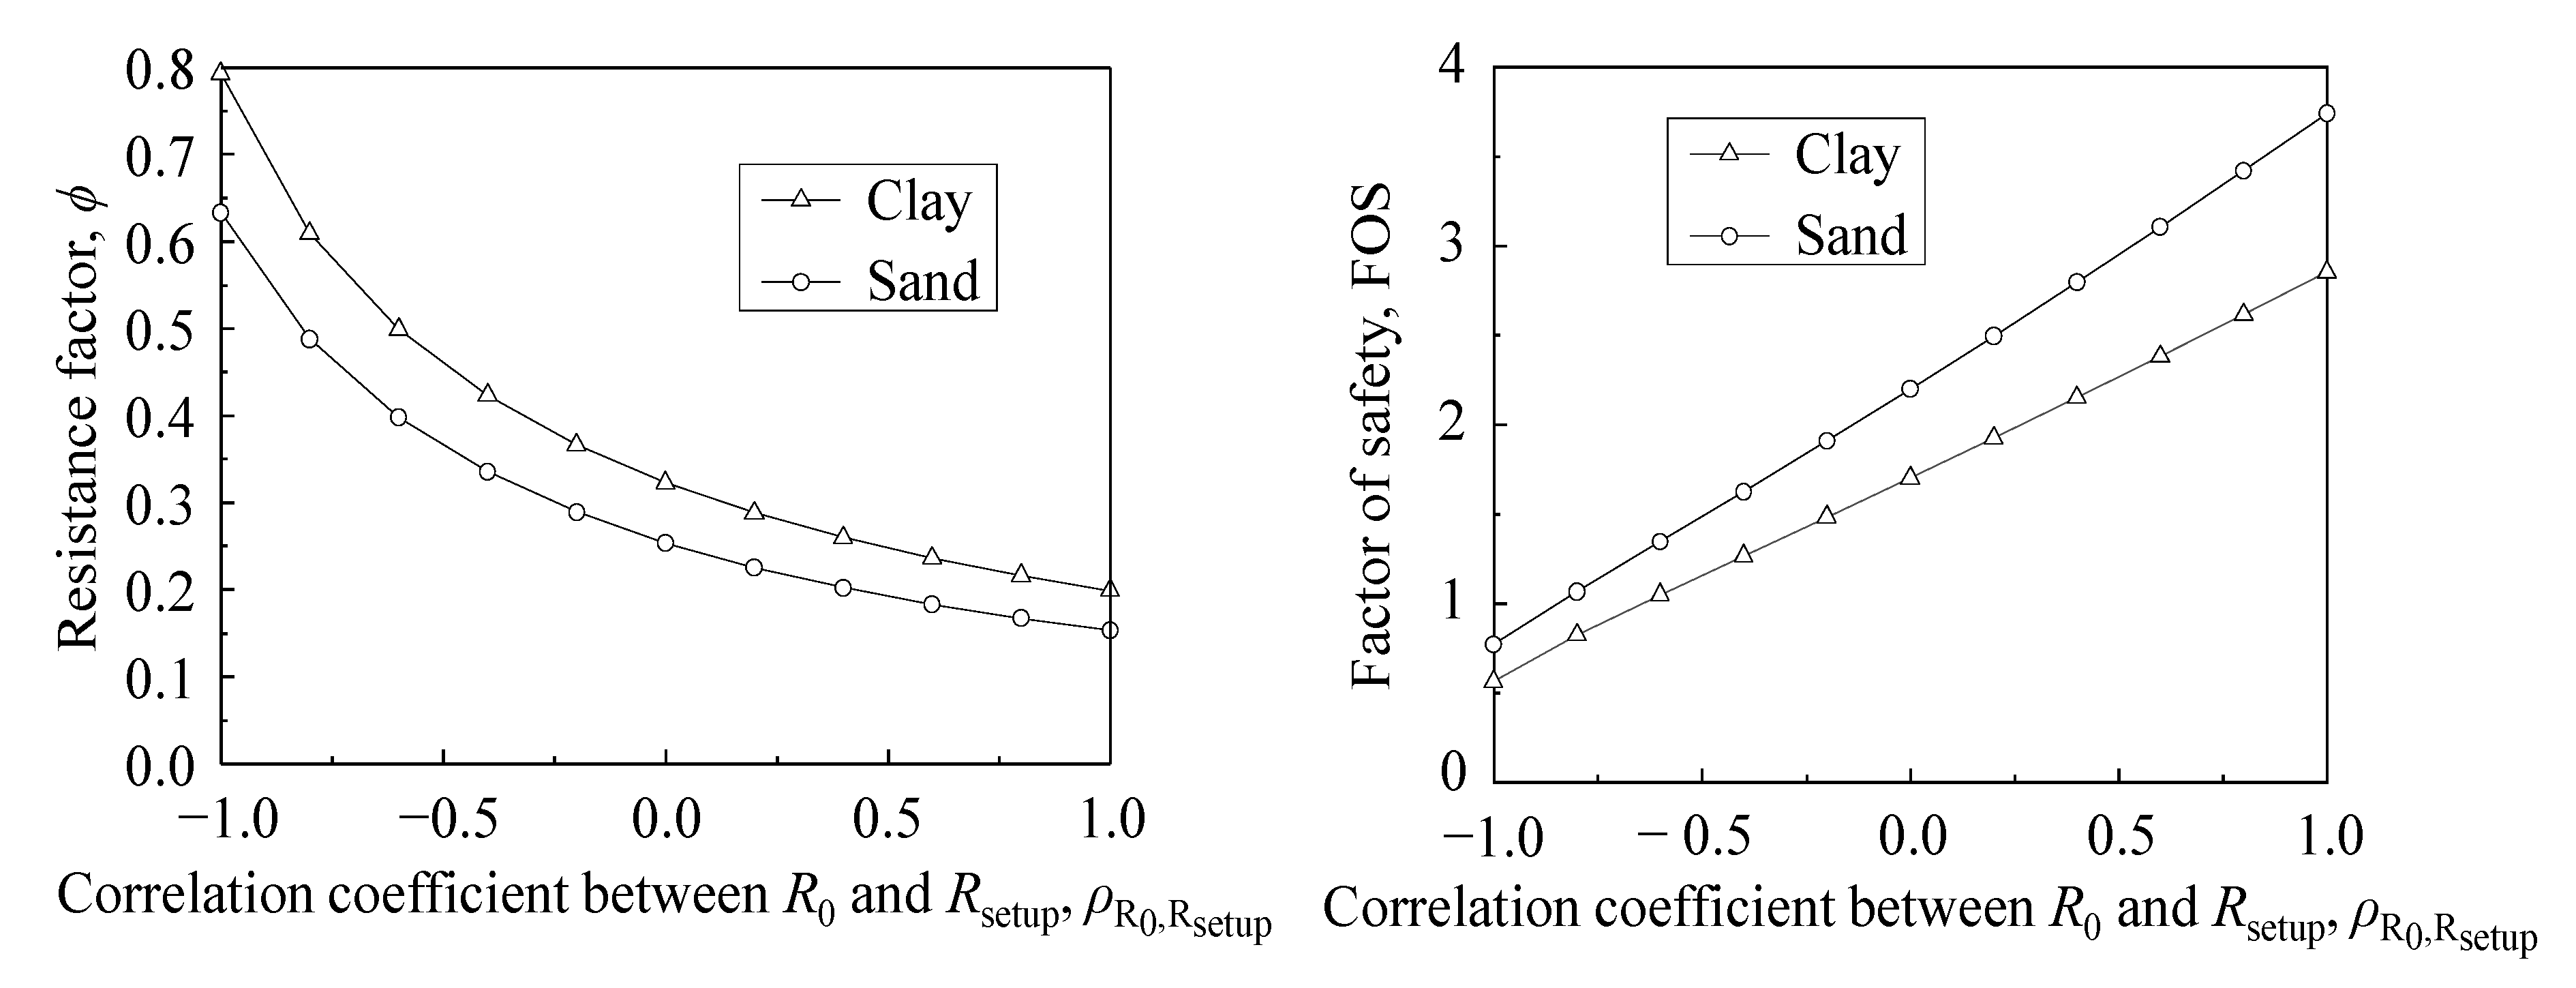
The analysis of the influence of ρR0,Rsetup on the resistance factor and factor of safety for driven piles indicates that the negative correlation between R0 and Rsetup has a significant influence on the resistance factor of driven piles, while the positive correlation between R0 and Rsetup has a slight influence on the resistance factor of driven piles. However, the factor of safety is just the opposite. Therefore, the correlation between R0 and Rsetup should be paid attention to in engineering applications.
This paper proposes a methodology to calculate the resistance factor and factor of safety for driven piles considering the setup effects. Through parametric analysis, it is concluded that the total ultimate resistance is significantly improved when driven piles consider the setup effects. The length of the pile or the number of piles could be reduced, and an economic design of driven piles could be achieved.

Author Contributions

Conceptualization, X.B.; methodology, X.B., X.C.; validation, X.B., X.C., J.C. and Z.X.; writing—original draft preparation, X.B. and J.C.; writing—review and editing, X.B., J.C. and Z.X. All authors have read and agreed to the published version of the manuscript.

Funding

This work was supported by the National Natural Science Foundation of China (52078396, 51978247, 51708428).

Conflicts of Interest

The authors declare no conflict of interest.

References

  1. Konrad, J.M.; Roy, M. Bearing capacity of friction piles in marine clay. Geotechnique 1987, 37, 163–175. [Google Scholar] [CrossRef]
  2. Carter, J.P.; Randolph, M.F.; Wroth, C.P. Stress and pore pressure changes in clay during and after the expansion of a cylindrical cavity. Numer. Anal. Methods Geomech. 1980, 17, 305–322. [Google Scholar] [CrossRef]
  3. Chow, F.C.; Jardine, R.J.; Brucy, F.; Nauroy, J.F. Effects of time on capacity of pipe piles in dense marine sand. J. Geotech. Geoenvironmental Eng. 1999, 125, 254–264. [Google Scholar]
  4. Fellenius, B.H.; Riker, R.E.; O’Brien, A.J.; Tracy, G.R. Dynamic and static testing in soil exhibiting set-up. J. Geotech. Eng. 1989, 115, 984–1001. [Google Scholar] [CrossRef]
  5. Bullock, P.J.; Schmertmann, J.H.; McVay, M.C.; Townsend, F.C. Side shear set-up. I: Test piles driven in florida. J. Geotech. Geoenvironmental Eng. 2005, 131, 292–300. [Google Scholar] [CrossRef]
  6. Haque, M.N.; Abu-Farsakh, M.Y.; Zhang, Z.J. Evaluation of pile capacity from CPT and pile setup phenomenon. Int. J. Geotech. Eng. 2020, 14, 196–205. [Google Scholar] [CrossRef]
  7. Ng, K.; Ksaibati, R. Effect of soil layering on shorter-term pile setup. J. Geotech. Geoenvironmental Eng. 2018, 144, 04018020. [Google Scholar] [CrossRef]
  8. Haque, M.N.; Abu-Farsakh, M.Y. Development of analytical models to estimate the increase in pile capacity with time (pile setup) from soil properties. Acta Geotech. 2019, 14, 881–905. [Google Scholar] [CrossRef]
  9. Afsharhasani, R.; Karakouzian, M.; Farhangi, V. Effect of competent caliche layers on measuring the capacity of axially loaded drilled shafts using the osterberg test. Appl. Sci. 2020, 10, 6169. [Google Scholar] [CrossRef]
  10. Doan, L.V.; Lehane, B.M. CPT-based design method for axial capacities of drilled shafts and auger cast-in-place piles. J. Geotech. Geoenvironmental Eng. 2021, 147, 04021077. [Google Scholar] [CrossRef]
  11. Farhangi, V.; Karakouzian, M.; Geertsema, M. Effect of micropiles on clean sand liquefaction risk based on CPT and SPT. Appl. Sci. 2020, 10, 3111. [Google Scholar] [CrossRef]
  12. Qubain, B.S.; Seksinsky, E.J.; Li, J.C.; Nuzha, K.; Eshete, D.W. Drilled shaft load testing during Design. In Proceedings of the International Foundations Congress and Equipment Expo, Dallas, TX, USA, 10–14 May 2021; Volume 323, pp. 257–266. [Google Scholar]
  13. Baca, M.; Rybak, J. Pile base and shaft capacity under various types of loading. Appl. Sci. 2021, 11, 3396. [Google Scholar] [CrossRef]
  14. Roling, M.J.; Sritharan, S.; Suleiman, T.M. Introduction to PILOT database and establishment of LRFD resistance factors for the construction control of driven steel H-piles. J. Bridge Eng. 2011, 16, 728–738. [Google Scholar] [CrossRef]
  15. Abu-Hejleh, N.; DiMaggio, W.M.; Kramer, S. Implementation of AASHTO LRFD design specifications for driven piles. Fed. Highw. Adm. 2013. Rep. No FHWA RC-13-001. [Google Scholar]
  16. Haque, M.N.; Abu-Farsakh, M. Estimation of pile setup and incorporation of resistance factor in load resistance factor design framework. J. Geotech. Geoenvironmental Eng. 2018, 144, 04018077. [Google Scholar] [CrossRef]
  17. Foye, K.C.; Salgado, R.; Scott, B. Resistance factors for use in shallow foundation LRFD. J. Geotech. Geoenvironmental Eng. 2006, 132, 1208–1218. [Google Scholar] [CrossRef]
  18. Komurka, V.E.; Winter, C.J.; Maxwell, S.G. Applying separate safety factors to end-of-drive and set-up components of driven pile capacity. In Proceeding of the 13th Great Lakes Geotechnical and Geoenvironmental Conference, Milwaukee, WI, USA, 13 May 2005; pp. 65–80. [Google Scholar]
  19. Yang, L.; Liang, R. Incorporating set-up into reliability-based design of driven piles in clay. Can. Geotech. J. 2006, 43, 946–955. [Google Scholar] [CrossRef]
  20. Kim, D.; Lee, J. Resistance factor contour plot analyses of load and resistance factor design of axially-loaded driven piles in clays. Comput. Geotech. 2012, 44, 9–19. [Google Scholar] [CrossRef]
  21. Ng, K.; Sritharan, S. Integration of construction control and pile setup into load and resistance factor design of piles. Soils Found. 2014, 54, 197–208. [Google Scholar] [CrossRef] [Green Version]
  22. Bian, X.Y.; Zheng, J.J.; Xu, Z.J.; Zhang, R.J. A method to calculate resistance factors for LRFD of driven piles. In Proceedings of the 6th Asian-Pacific Symposium on Structural Reliability and its Applications (APSSRA2016), Shanghai, China, 28–30 May 2016; pp. 157–163. [Google Scholar]
  23. Bian, X.Y.; Xu, Z.J.; Zhang, R.J. Resistance factor calculations for LRFD of driven piles based on setup effects. Results Phys. 2018, 11, 489–494. [Google Scholar] [CrossRef]
  24. Skov, R.; Denver, H. Time dependence of bearing capacity of piles. In Proceedings of the 3rd International Conference on the Application of Stress-Wave Theory to Piles, Ottawa, ON, Canada, 25–27 May 1988; pp. 879–888. [Google Scholar]
  25. Long, J.H.; Kerrigan, J.A.; Wysochey, M.H. Measured time effects for axial capacity of driven piling. Transp. Res. Rec. 1999, 1663, 8–15. [Google Scholar] [CrossRef]
  26. Svinkin, M.R.; Morgano, C.M.; Morvant, M. Pile capacity as a function of time in clayey and sandy soils. In Proceedings of the 5th International Conference and Exhibition on Piling and Deep Foundations, Bruges, Belgium, 13–15 June 1994; pp. 1.11.1–1.11.8. [Google Scholar]
  27. Bogard, J.D.; Matlock, H. Application of model pile tests to axial pile design. Am. Soc. Civ. Eng. 1990, 3, 217–278. [Google Scholar]
  28. AASHTO. LRFD Bridge Design Specifications, 4th ed.; American Association of State Highway and Transportation Officials: Washington, DC, USA, 2007. [Google Scholar]
  29. Yang, L.; Liang, R. Incorporating setup into load and resistance factor design of driven piles in sand. Can. Geotech. J. 2009, 46, 296–305. [Google Scholar] [CrossRef]
  30. Paikowsky, S.G.; Birgisson, B.; McVay, M.; Nguyen, T.; Kuo, C.; Beacher, G.; Ayyub, B.; Stenersen, K.; O’Malley, K.; Chernauskas, L. Load and resistance factor design (LRFD) for deep foundations. In Proceeding of the 6th International Conference on the Application of Stress-Wave Theory to Piles, Sao Paulo, Brazil, 28–29 September 2004; pp. 281–304. [Google Scholar]
  31. Hansell, W.C.; Viest, I.M. Load factor design for steel highway bridges. AISC Eng. J. Am. Inst. Steel Constr. 1971, 8, 113–123. [Google Scholar]
  32. Perez, A.; Birgisson, B.; Zhang, L.; McVay, M.C.; Putcha, S. Load and resistance factor design (LRFD) for driven piles using dynamic methods-a florida perspective. Geotech. Test. J. 2000, 23, 55–66. [Google Scholar]
  33. Zhang, L.M.; Li, D.Q.; Tang, W.H. Reliability of bored pile foundations considering bias in failure criteria. Can. Geotech. J. 2005, 42, 1086–1093. [Google Scholar] [CrossRef] [Green Version]
  34. Barker, R.; Duncan, J.; Rojiani, K. Manuals for the Design of Bridge Foundations; National Cooperative Highway Research Program (NCHRP) Report 343; Transportation Research Board: Washington, DC, USA, 1991. [Google Scholar]
  35. Zhang, L.M.; Tang, W.H. Bias in axial capacity of single bored piles arising from failure criteria. In Proceedings of the International Conference on Structural Safety and Reliability, Newport Beach, CA, USA, 17–22 June 2001; pp. 1–8. [Google Scholar]
Figure 1. Resistance factor and factor of safety with ρ for driven piles in clay and sand.
Applsci 11 08609 g001
Figure 2. Resistance factor and factor of safety with βT for driven piles in clay and sand.
Applsci 11 08609 g002
Figure 3. Resistance factor and factor of safety with Msetup for driven piles in clay and sand.
Applsci 11 08609 g003
Figure 4. Resistance factor and factor of safety with ρR0,Rsetup for driven piles in clay and sand.
Applsci 11 08609 g004
Publisher’s Note: MDPI stays neutral with regard to jurisdictional claims in published maps and institutional affiliations.

