Abstract
It is widely accepted that human activities largely contribute to global emissions and thus, greatly impact climate change. Awareness promotion and adoption of green transportation mode could make a difference in the long term. To achieve behavioural change, we investigate the use of a persuasive game utilising online transportation mode recognition to afford bonuses and penalties to users based on their daily choices of transportation mode. To facilitate an easy identification of transportation mode, classification predictive models are built based on accelerometer and gyroscope historical data. Preliminary results show that the classification true-positive rate for recognising 10 different transportation classes can reach up to 95% when using a historical set (66% without). Results also reveal that the random tree classification model is a viable choice compared to random forest in terms of sustainability. Qualitative studies of the trained classifiers and measurements of Android-device gravity also raise several issues that could be addressed in future work. This research work could be enhanced through acceleration normalisation to improve device and user ambiguity.
1. Introduction
This research presents an approach to invoke human behaviour change via machine-learning-supported persuasive games. The primary goal of the game is to explore if it could affect decreased transportation-related carbon footprints through behavioural change. Currently, transportation is the largest source of carbon emissions in the USA [1] and UK [2]. According to OECD [3], it is the fastest growing major contributor to global climate change, accounting for 23% of carbon emissions. According to Bin and Dowlatabadi [4], 22% of total emissions stem from ‘personal travel’, of which 68% comes from direct usage while 32% is from indirect influences. On the other hand, research conducted by the Tyndall Centre [5] indicates that personal land-based transport is the major source of carbon dioxide emissions in the UK transport sector and the study reveals that behavioural change is generally perceived as an intractable issue. However, the UK Department of Transport [6] views the promotion of behavioural change and sustainable modes of transport (e.g., public transport) as part of a low-carbon transport strategy for a greener future. Thus, an individual’s daily choices of transport could have a significant impact on the total carbon emissions, and it is recommended that cleaner modes of transportation be adopted (i.e., ranging from public transit to biking and walking) [7]. To reiterate, the effectiveness of a carbon reduction strategy largely depends on user acceptability [8], which is closely linked to users’ personal preferences change. The 5 stages (or trans-theoretical) of change model have been discussed in [9]. However, in this research, our focus is on: Stage 3 Preparation—collect information about change and take steps toward the change; Stage 4 Action—take direct action towards achieving a goal; Stage 5 Maintenance—maintain new behaviour (see [9,10] for details). Information is considered a key element to begin to prepare for change, and strong motivators are key elements for maintaining change. All these elements are prominent in games, making them a viable medium to persuade users to change their behaviour. Hervas and colleagues [11] have conducted a critical survey of gamification mechanics to effect behavioural change. These form the bases for the development of a prototype persuasive game for our research. Using techniques from augmented reality and transport detection via machine-learning algorithms, it provides a personal feedback loop to users. Daily physical actions will have repercussions within the game world, stimulating behaviour change. The prototype game fosters multiplayer interaction, which is often lacking in contemporary persuasive games. The game is implemented on Android devices with accelerometers and gyroscope sensors being used to gather data to identify the mode of transportation. The developed prototype persuasive game addresses the following research questions:
- i.
- RQ1: What aspects of persuasive games could impact on transportation choices?
- ii.
- RQ2: How could specific forms of transport be automatically detected without significantly reducing battery life?
2. Related Work
To reiterate, in this research, the developed persuasive mobile game application aims to influence people’s choice of modes of transportation. The review of related work encompasses two relevant areas: Persuasive Games encompasses gamification and games with persuasive design; Transportation Mode Detection includes the use of mobile sensors such as accelerometer, gyroscope, and geo-locational sensors.
2.1. Persuasive Games
Fogg [12] pioneers the concept of persuasive technologies. Persuasive games and gamification have been employed to effect behavioural change in the following areas: health and wellbeing [13] (e.g., exercise, healthy eating), see comprehensive literature review conducted by [14]; education and learning promotion [15]; smoking cessation [16]; homelessness views [17]; transportation greening [18,19]. Khaled et al. [16] discuss several challenges relating to the effective impacts of persuasive games: managing player attention, balancing game contents with reality, and issues concerning identity and target audiences. Orji et al. [20] conduct an analysis of persuasive games and target players followed by proposing an approach to motivate players of certain gamer types with specific game mechanics. Deterding [21] discusses approaches to persuade users. Several examples include constraints (making the unwanted impossible), default settings (to use the ‘path of least resistance’), and facilitation (easing change, e.g., by making behaviour-change-related data visible). He also argues that games are good platforms for persuasive design as they are generally voluntary (possessing intrinsic motivators for players to play the games), generally pre-structured, and have clear goals—while still fostering interesting interactions. Extrinsic motivators such as money and grades are typically proven to work well only in the short term. For social multiplayer games, there are also social motivators such as recognition, belongingness, cooperation, competition, etc.
Ferrara argues that persuasive games and gamification could cause real change, but highlights that inattention to the quality of player experience jeopardises its success [22]. Additionally, he argues that we should design games for change, rather than merely applying specific gamification elements and hoping that they achieve the same effect that a whole game does.
The UbiGreen project by Froelich and colleagues uses positive and negative feedback to promote greener transportation [18,19] and is closely aligned to our research work. In their work, they combine a self-reporting system with a special pedometer and a dynamic graphic design to promote greener transportation. Their participants suggest the use of negative as well as positive feedback, to include more statistical figures of transport usage, and complain of discomfort due to an additional wearable sensor. The participants also appreciate the use of visual stimuli, but request diversity over time (as it only features linear positive graphical progressions). However, the UbiGreen mobile application uses Global System for Mobile Communication System (GSM) and Global Positioning System (GPS) information for semi-automatic sensing of transit activity [18,19]. However, our proposed Evergreen Persuasive Game mobile application uses the mobile inbuilt accelerometer- and gyroscope-related data for automatic transit activity sensing.
2.2. Transportation Mode Recognition
In recent years, transportation mode recognition has been used for: the identification of peoples’ physical activities [23]; user dynamic control of their optimal route [24]; to support intelligent transportation systems [25]. However, limited research has been conducted on transportation mode recognition to promote sustainability awareness. There are various approaches for transportation mode recognition or classification. Our review focuses on smartphone-based approaches, which is relevant for our research. Research conducted to distinguish motorised transportation as one class from all other modes of transportation has been mostly successful [26,27]. However, it is challenging to distinguish the different types of motorised transports, and typically, this is addressed by using specific sensors targeting a specific type of transportation mode [28]. Activity recognition is a separate branch of targeted human-centred activities machine learning and, to date, has achieved more than 90% classification accuracy for common classes (sitting, lying down, walking, running) [29], or even higher rates for more classes if additional sensors are deployed [30].
Accelerometer-only approaches have been largely successful in the classification of a constrained number of motorised vehicles. For example, 97% classification accuracy for three classes (car, train, and pedestrian) has been achieved using support vector machines [31], and 80% classification accuracy for six modes of transportation (walk, bus, train, metro, tram, and car) has been achieved using many features (i.e., 78 features) from the gathered data [32]. Lorintiu and Vassilev (2016) propose a hybrid model (using random forest and discrete hidden Markov chain filters) that attains 94% accuracy [33]. They use both accelerometer and magnetometer data to identify eight classes (still, walk, run, bike, road, rail, plane, and other). Jahangiri and Hesham (2015) employ a range of supervised learning approaches to classify five transportation modes (car, bicycle, bus, walking, and running) [34]. Methods tested include K-nearest neighbour (KNN), support vector machines (SVMs), and tree-based models including random forest (RF). They use a total of 80 features extracted from four smartphone sensors (accelerometer, gyroscope, GPS, and rotation vector) to train their models and manage to achieve classification accuracies of 91.2% for KNN, 94.6% for SVMs, 87.3% for decision trees, and 95.1% for a bagging and RF model. Bedogni and colleagues [35] propose the use of so-called ‘magnitude’ values as well as a time-based history set to filter out noise for enhanced classifier results. They attain an initial 97.7% accuracy for three classes (walking, car, and train). In their subsequent publication [36], Bedogni and colleagues further evaluate their approach using seven classes (standing, walking, driving, train, bike, city bus, and national bus), where they achieve a mean accuracy of 79% for accelerometer-only, 87% for accelerometer and Gyroscope, and 95% for using accelerometer, gyroscope, and geo-locational data all together.
3. Delimitations and Experiment Overview
The delimitation for this research is its constraint to only the Android mobile platform for developing the prototype game and the deployment of only 4 different machine-learning algorithms (i.e., random forest, random tree, Bayesian network, naïve Bayes). The Weka toolkit [37] is employed for data mining tasks. For an initial offline analysis as well as for comparison studies, the version 3.8.2-Snapshot [38] is used. For all Android-related online and offline analysis, a GUI-stripped port of the Weka 3 is employed (Weka-for-Android on GitHub) [39]. A maximum difference of 1% classification true-positives difference is noted for Weka’s pre-built Explorer application [40] and our own offline analysis software based on the Android-port.
4. Methodology
In this section, we shall discuss the following: the mobile application architecture; associated applications developed to support the Evergreen persuasive game; evaluation of behavioural change.
4.1. Mobile Application Architecture
For this research, a series of applications are developed: an accelerometer sampler application and a persuasive game. The sampler application is called Transportation Mode Sampler, as it includes the categorisation of sampling data for the 9 target transport modes (bus, foot, car, bike, train, tram, subway, boat, and plane) and system idle mode. This application helps volunteers gather data for transportation classification tests. Evergreen is a game with embedded persuasive elements. It is a representation of evergreen trees, a symbol of sustainability, and since it also provides a good picture of what the game is about—surviving out in the wilderness against forest beasts.
Figure 1 provides an overview of the Evergreen mobile application architecture that has three components: (i) Smartphone Sensors Manager – an application (known as Transportation Mode Sampler) collects accelerometer and gyroscope-related data (data being queried at a rate of 20 Hz); (ii) Transportation Recognition Service—based on data collated in (i), a set of 4 values are calculated (minimum, maximum, average, and standard deviation values) and used for machine-learning classifier training and detection of corresponding transportation mode; (iii) Evergreen Persuasive Game—a Java-based game that provides bonuses or penalties based on transportation mode-related data received from (ii).
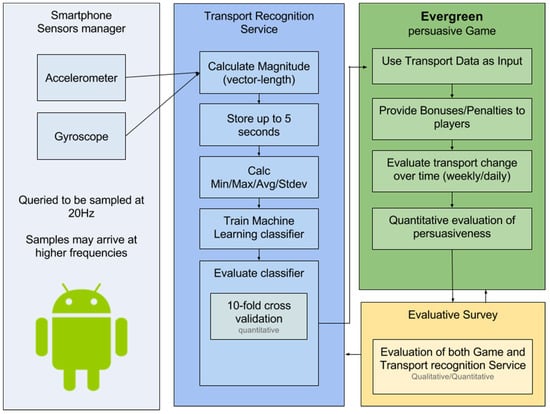
Figure 1.
Overview of system architecture for Evergreen mobile application.
4.2. Applications to Support Evergreen Persuasive Game
Here, we shall provide further discussion for the three types of applications listed in the preceding sub-section. They are:
- I.
- Transportation Model Sampler: It is an application for gathering data samples (see Figure 2). Volunteers help gather training data for (ii). This mobile application enables users to observe current data, see the preliminary window feature values, and export data into other relevant applications. If classification errors are found early in testing, further samples are gathered to improve classification of a particular transport mode. Sensor sample data collected for this research are depicted in Table 1.
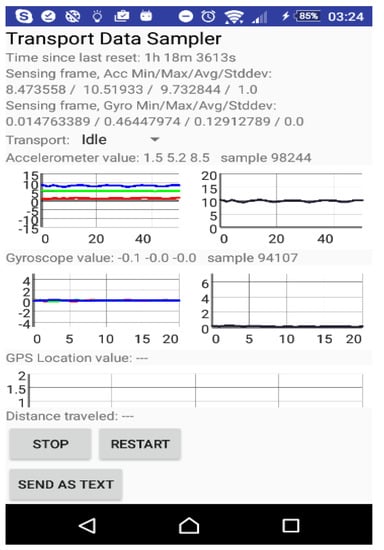 Figure 2. Transport Data Sampler application for the submission of transport sample data.
 Table 1. Breakdown of collected transport data and corresponding duration.
A total of 21,096 interval window features (or samples) have been gathered for this research. It corresponds to 29 h and 18 min worth of data. The corresponding duration for each transportation mode is depicted in Table 1.
- II.
- Transportation Recognition Service: an Android-based service to detect the transportation mode used is based on Weka machine-learning algorithms (in Java) [41]. Transportation mode detection is based on [35,36].
4.3. Model Building and Deployment
Historical sensor data have been gathered and trained using machine-learning classifiers (i.e., random forest, random tree, Bayesian network, and naïve Bayes) for the Transport Recognition Service module (in Figure 1). Thus, 4 classification models have been built and deployed to detect transportation mode based on new accelerometer and gyroscope data input. During deployment, accelerometer and gyroscope data are queried at a rate of 20 Hz (i.e., period is 0.05 s) and saved in non-overlapping 5-second interval windows. The magnitude value (related to the 3D orientation/position) of each sample I in an interval window is calculated using Equation (1).
Each interval window has a set of magnitude values, and based on these values, 4 values are calculated: minimum, maximum, average, and standard deviation. Each sensor has 4 values per interval window and a total of 8 values (for both the sensors) make up the interval window features that are subsequently used for machine-learning classifier training and detection tests. To reiterate, in order to train the classifiers, data are gathered with the help of volunteers for 9 transportation modes (bus, foot, car, bike, train, tram, subway, boat, and plane) and idle mode. Each instance is fed into the training classifiers which consist of 8 interval window features (for both the sensors). During prediction, 8 interval window features are fed into the model followed by conducting a query to detect the transportation mode that is currently being used.
4.4. Noise Reduction by Using a Historical Set
According to Gupta and Gupta (2019), noisy data could significantly impact on prediction accuracy [42]. In our research, we adapt the use of a time-based historical set [35,36] as a noise filter in classifier predictions. As an example, consider the following predicted sequence: bike, bike, bus, bike, bike. It is unlikely that a user would take a bus for a few seconds while all other predictions, before and after, indicate that the user is riding a bike. Figure 3 depicts how the historical set is used for noise reduction. The usage of the historical dataset of a threshold size N is as follows: when a new prediction is made, it is added to the historical dataset. If the set has more than N predictions (in the example below, N = 3), the oldest prediction is discarded. The transport of highest frequency within the set (i.e., car) is returned and used instead of the initial prediction (i.e., train) for interval Window 4.
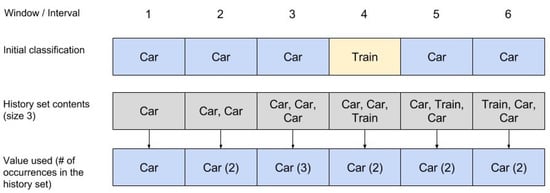
Figure 3.
How the historical set can remove noise. It is improbable for a transportation mode to switch for only 5 s (1 interval window).
4.5. Sleep Sessions
Evergreen is similar to the popular Pokémon Go game in terms of its associated effects of battery life degradation (due to prolonged use) and augmented reality. To explore the battery-related sustainability problem, we have introduced sleep sessions in between samplings. However, our research aims to explore the trade-off between performance (i.e., prediction accuracy) and sustainability (i.e., mobile device battery drain). Our novel contribution is to estimate how much time the transport detection service could sleep while retaining a certain classification accuracy. Figure 4 and Figure 5 depict the integration of the historical set approach and sleep settings. The two figures demonstrate the test with short alternating and serial sleep sessions (i.e., zzz).
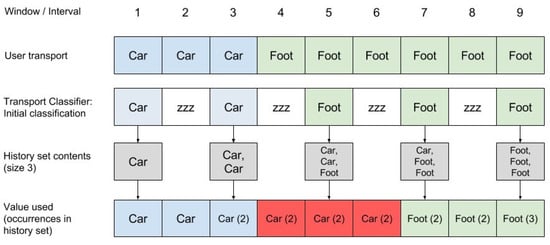
Figure 4.
Historical set with alternate sleep sessions.
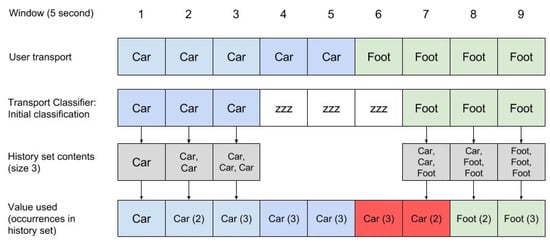
Figure 5.
Historical set with serial sleep sessions.
In order to maintain the battery performance during testing, the sensor sampling service within the resulting game uses an alternating sleep schedule to reduce energy consumption. The qualitative tests (using machine learning within the game) generally include alternate sleeping using a 1:1 ratio of sensing and sleeping intervals (e.g., a repetitive sampling interval of 2 min followed by a sleeping interval of 2 min). This is similar to the approach shown in Figure 5. Figure 6 depicts the effect of the ratio of sensing and sleep session intervals on a number of errors.
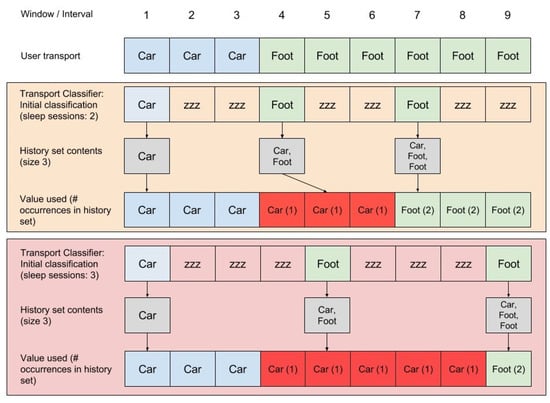
Figure 6.
Effect of sensing and sleep session intervals ratio on the number of errors.
4.6. Gravity Measurement Miscalibration
After the initial positive tests on classifier accuracy, a real-life test is carried out with the same classifier integrated into the game. Due to the number of errors that emerge, we hypothesise that the device orientation could have impacted the transport recognition. Brief tests reveal that the total gravity sensed varies with each device and orientation, which would in turn affect all machine-learning classifier results including the accelerometer.
To justify the need of acceleration sample data normalisation on an Android device, orientation gravity measurements are collected and presented in Table 2. The columns represent different volunteers’ respective devices, with standard deviations presented both on a per-device and per-orientation basis. Note the increased deviations for the face right and face left orientations, which are common for devices placed in pants’ pockets while sitting. In order to ensure that the whole procedure and data are thoroughly device and orientation ambiguous, as well as remove the effect of sensor-axis miscalibration, normalisation of acceleration values is applied to the minimum, maximum, and averages of the acceleration sensor magnitude values. This is done by subtracting the mean from each value and dividing the difference with the mean.
Table 2.
Gravity measurements for sample Android devices and 6 different orientations.
- III.
- Evergreen Persuasive Game: An Evergreen game server is a Java-based back-end to support the co-ordination of online multi-player game mode. Details about the game are discussed as follows: game genre; game goals; game fantasy; game curiosity; game design details.
Game Genre: A turn-based strategy and role-playing game hybrid is chosen. There are several reasons for this. Firstly, it enables an iterative approach to persuade players for each turn or day that they are playing the game. Secondly, players of role-playing games tend to play them for a long time, as long as they are well-designed. In the game, each turn would correspond to one real-life day. Actions in real life (transport mode taken) would affect, to some extent, results in the game and, thus, give an incentive for players to subsequently choose greener modes of transportation. Using a turn-based approach also makes it available to a larger audience, as less time is required to play it (a few minutes per turn or day), whereas a real-time game may distract and interfere with daily life. Pokémon Go is a great comparison as it is also in the same kind of genre, has garnered huge popularity, caused a distinct change in behavioural patterns of players, though it has disadvantages and hazards inherent in the game design [43,44].
Game Goals: The primary goal of this research work is to design a persuasive game to: (i) reduce carbon emissions via opting for greener forms of transportation; (ii) promote awareness of environmental footprint; (iii) defeat other players by being the longest survivor. To maintain the game captivation element, the first and second implicit sub-goals are built into the game. They appear as tools and parameters in the game that players can use to achieve the third sub-goal. Within the resulting game, these goals are integrated into the generation of random events that are spawned subjecting to the type of transport players use, as well as one of the main game statistics called ‘Emissions’. The third sub-goal is a typical game goal that resonates well with general and contemporary game designs because it is likely to evoke emotions and is more likely to entice game players. Within the game, players may also set their own goals—such as helping others, building the largest shelter, etc. Due to the complexity of the resulting game (and role-playing games in general), players tend to set up different own goals based on what they most enjoy in games.
Game Fantasy: Intrinsic and extrinsic fantasy (see [45,46]) aim to afford motivation in educational games. The former is defined as one where fantasy context and instructional content is intertwined [46]. Through intrinsic fantasy, the player can choose a wide array of actions within a conflict-ridden fantasy world, and through the extrinsic fantasy, the players’ real-life actions will be fed back into the game, stimulating transportation choice. Through this, the game will permeate players’ daily lives, possibly generating a behavioural change—which is the aim of this game. Fantasies help satisfy players’ emotional needs [47]. However, people have different emotional demands, and may have idiosyncratic appealing fantasies. In order to appeal to at least one group of players, the genre of the game and most of the mechanics have already been decided: post-apocalypse where nature is out to get you. Common game mechanics from turn-based strategy and role-playing games are chosen, as they best fit in with the designed player experience and projected playing time required for behavioural change.
Game Curiosity: Curiosity is one of the elements that contribute to game engagement [48]. A comprehensive taxonomy and definition of curiosity has been discussed in [49] and curiosity could either positively or negatively influence human behaviours [50]. It may be independent of goals and fantasies, but may be stimulated by the game environments, or the complexity of the game. Just as in movies, clues are given to where the story will end up, or what will be revealed, and curiosity will be satiated once it is finally revealed. Such storytelling scenarios are present in games as well.
Baranes and colleagues [43] reveal that intrinsically motivated exploration in games are shaped by: task difficulty (need to progress from easier to more difficult tasks), novelty, and size of choice set (note this relates to search space). The game should be novel and surprising to some extent but should also not be too complex that it deters players. Some expectations should be met (adhering to certain common game mechanics and interactions), while some parts should be novel and surprising (new game mechanics or new interpretations of existing ones) to provide appeal to many players. The Evergreen game follows some common rules and game mechanics found in modern turn-based role-playing games (RPGs) and strategy games. The game also features new game mechanics to make it novel as well as stimulate curiosity and fulfil the requirements of a persuasive game (here defined as stimulating behaviour change regarding transportation mode). As for sensory curiosity, the game incorporates extensive sensory events as rewards when noteworthy events occur within the game. For example, the player’s dwelling graphics are enhanced to commensurate with upgrades, and the background picture evolves into different shades based on the amount of a player’s emission. At the outset of the game, the player has zero emission and has a nice and soft green background. As emissions increase beyond a certain threshold, it turns to yellow at the bottom. In the subsequent stages, the colour gradually changes to orange, red, and lastly, black. At each progression, the ‘decaying’ colours also gradually move upwards, so that the entire screen may be of a dark red and black gradient (at the end of the game). Figure 7 shows the colour progression implemented in the Android prototype game.

Figure 7.
Sequence of background images as emissions increase.
Game Design Details: In Evergreen, the following daily actions are chosen: gathering food or materials, inventing and crafting weapons, armour and tools, building defences, scouting, interacting with other players, etc. The daily actions are then used as inputs for the game once each new day or a turn is simulated. Players could opt for skills to be trained so that they may specialise and hone their skills, or attempt to motivate cooperation. Some actions and skills are competitive, for example, stealing from or attacking other players. Active actions such as sending resources, items, or messages between players could be executed on demand to foster some flexibility. Within the game, there are some relevant statistics, with emissions being the next-most important one (affecting the overall game difficulty) besides hit points (the standard statistics used to represent a character’s vitality in many role-playing games). Different modes of transport contribute to varying amounts of bonuses to the in-game daily actions, as well as generate varying amounts of emission. Choosing specific actions within the game that consume resources (crafting, inventing, building defences) also increase the emissions statistics, while some actions and skills actively reduce or indirectly reduce current or future emissions generation. To adhere to good game and software development practices, the development lifecycle is preceded with the development and evaluation of a paper prototype [51]. Volunteers are recruited and the game is tested in groups (maximum size of 3). Four separate groups test the game for initial feedback and iterations. Testers of the paper prototype find the game interesting and this forms the basis of the Evergreen prototype shown in Figure 8. Screenshots of the Android-based version of the Evergreen game are shown in Figure 9 and more screenshots are published on social media from the tested game version that can be found in [52].
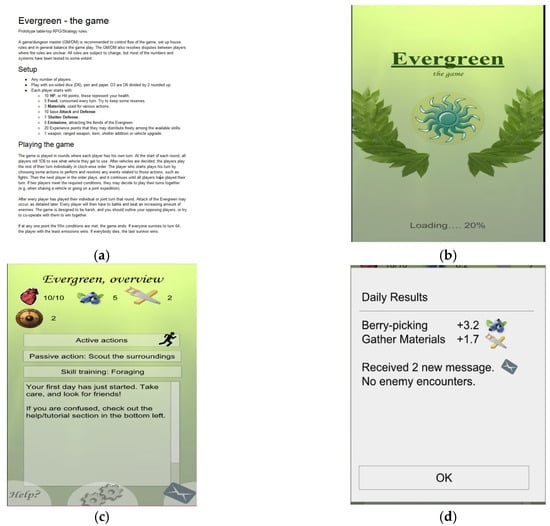
Figure 8.
Early design stages of the Evergreen persuasive game. (a) First page of the initial paper prototype (11 pages in total) [51]. (b) Early design of the game’s splash screen. (c) Early design of the game’s main screen showing player statistics in the top, buttons for actions, and a log of what has hap-pened previously. (d) Early design of the results screen, which is displayed after each new day.
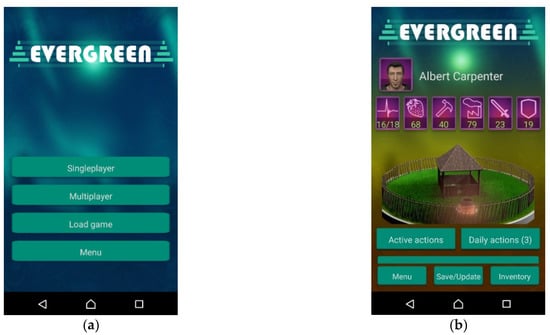
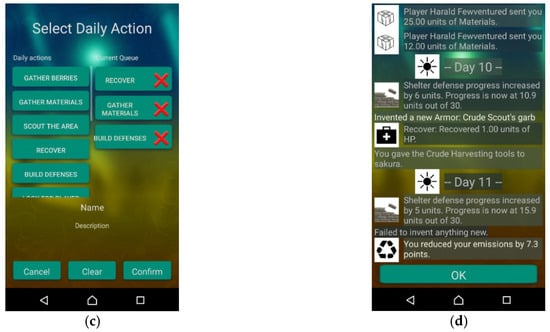
Figure 9.
Screenshots from the Android version of the game Evergreen.(a) Splash screen. (b) Main screen, showing statistics in the top 6 icons. (c) ‘Daily Actions’ selection screen. (d) The results screen displays what has happened during the most recent days/turns.
5. Results
The discussion of results is divided into the following sections: game design—a questionnaire is administered during the requirements and testing phases; transportation mode data sampling, offline classification model training, and prediction—shows data sampling and effects of device orientation on sampled gravity measurements followed by building classification models; transportation mode detection—various tests on collected data including n-fold cross-validation, the use of a history set to filter noise, and input data with normalised acceleration values; game evaluation (see Section 6)—qualitative feedback on the game persuasive effects and limitations is provided by testers of the game. To reiterate, the game that was developed is a persuasive game called Assaults of the Evergreen or just Evergreen. Its official Facebook page with links to some relevant questionnaires can be found here https://www.facebook.com/AssaultsOfTheEvergreen/ (accessed date: 14 September 2021).
5.1. Game Design
Two primary surveys are conducted for this research (details are found in [52]): the ‘Expectations’ questionnaire is administered during the first survey, which is conducted prior to the development of Evergreen (n = 40, purposive sampling); the ‘Pre-testing’ questionnaire is administered for the second survey prior to testing of Evergreen (n = 24, purposive sampling). Respondents for the ‘Expectations’ questionnaire are asked the extent a game (designed to improve their daily choices of transportation) could impact their lifestyle and design of the game. The majority of them have experience in playing digital games (smartphone, console, or PC). Figure 10 shows the results for impact of lifestyle-related question: 1 is labelled ‘Not at all’ and 5 is labelled ‘A lot’. More than 90% of the respondents seem to perceive games as having an impact on their lifestyles.
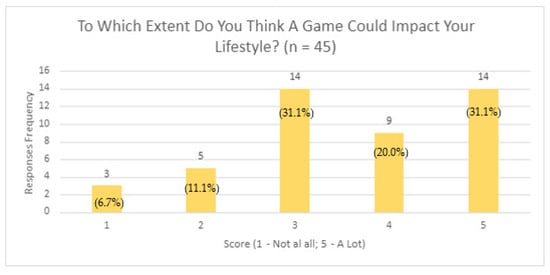
Figure 10.
Expectation of the impact of a game.
Responses to the persuasive game design open question are: display of real-time data, personal statistics, and achievements; adaptivity (i.e., adaptive to players’ personal schedules); notification functionality; battery life concerns; privacy of collected data (e.g., locational); not time consuming; fun and motivation elements (e.g., leader board); embedded social aspect (e.g., competition); guide for greener transportation mode selection for a specific journey. Some respondents mention they would not play the game because they are already green (i.e., walking or biking). Responses to the open question on how successful a persuasive game could be for transportation are: practicality is subject to distances travelled because greener modes of transport are not practical for long journeys; adopt ideas from Pokémon Go; conditions are quality of the game and good promotion. For the ‘Pre-Testing’ questionnaire, responses to the question on the likely success of a game (e.g., Evergreen) in influencing transportation mode choice are depicted in Figure 11. The value 1 implies ‘Zero Likelihood’ while value of 5 represents ‘Very High Likelihood’. The graph reveals that 100% of the respondents perceive persuasive games as having an influence on people’s choice of transportation modes.
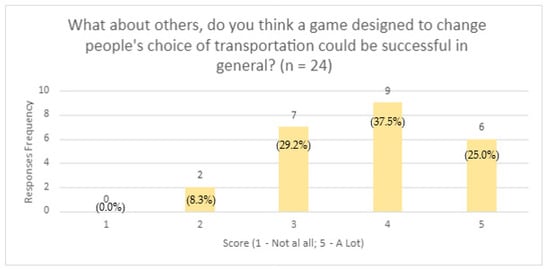
Figure 11.
Potential success of persuasive games.
5.2. Transportation Mode Data Sampling, Offline Classification Training Models, and Prediction
To reiterate, for data gathering, a total of 21,096 time window features (or samples) were gathered, corresponding to 29 h and 18 min of data, divided into the transport classes depicted in Table 1. To justify the need of acceleration sample normalisation, some brief data on Android device orientation gravity measurements are presented in Table 2. The columns represent different volunteers’ respective devices, with standard deviations presented both on a per-device and per-orientation basis. Note the increased deviations for the face right and face left orientations, which are common for devices placed in pants’ pockets while sitting.
To reiterate, four common machine-learning classification approaches are employed for this research. They are: random forest, random tree, Bayesian network, and naïve Bayes. Criteria for selection are: extensive use (Bayesian network) [53]; easy and fast processing (naïve Bayes [54]; random tree [55]); versatility (random forest [56]).
Initial classifier results using 10-fold cross-validation and two-fold cross-validation for the four types of classifiers are shown in Table 3 where the first two columns are for without ‘normalised accelerometer values’ while the last two columns are with ‘normalised accelerometer values’ (to ensure device and orientation ambiguity). Results reveal that the random forest classifier has the highest accuracy while naïve Bayes has the lowest accuracy. Table 4 presents the classification details for each class when performing the 10-fold cross-validation using random forest (RF). The worst performing classification is for the subway, probably because it is underground and, thus, would have a negative effect on mobile wireless signal transmission and reception.
Table 3.
Classifier results using 10- and 2-fold cross-validation, without normalised accelerometer values and with normalised accelerometer values (NA).
Table 4.
Detailed results by class of transportation mode (RF, 10-fold).
Table 5 shows the confusion matrix as well as true-positive percentage rates (on the right-hand side) when analysed for our test-suite (10-fold cross-validation, RF). The classes that score more than 70% TP rate are: foot, boat, and plane, while once again, the class subway scores the lowest.
Table 5.
Confusion matrix for the classes (10-fold, RF).
Table 6 shows the results when using 10-fold cross-validation, while Table 7 shows the results using two-fold cross-validation. Both tables present the classification results of the chosen classifiers using different sizes of the history set. Percentages displayed are the true-positive rates when using historical set sizes (HSS) ranging from 0 to 50. Highlighted are those results where the classification rate reached its highest point for that classifier.
Table 6.
Classifier results for 10-fold cross-validation for varying historical set sizes (HSS).
Table 7.
Classifier results for 2-fold cross-validation (RF) for varying historical set sizes (HSS).
A comparative analysis of Table 6 reveals that the accuracy for the four machine-learning approaches (10-fold cross-validation) decreases with an increase in HSS sizes (starting from size 10 to 50). However, the results for two-fold cross-validation are rather inconclusive. Random forest performs the best for both 10-fold and two-fold cross-validation followed by random tree while naïve Bayesian is the worst performing machine-learning approach.
Table 8 presents the confusion matrix for the best performing classification results (two-fold cross-validation, RF, HSS 20). Note that almost all classes have now reached over 95% classification TP rate, with the exception of subway (which is under-sampled and is misclassified as bus) and tram (which is also relatively under-sampled and misclassified as bus or car). The performance of all classifiers is lower than those results presented by Bedogni and colleagues, but the same ranking of classifiers is shown, where RF performs best, followed by RT, BN, and NB (84%, 80%, 78%, and 54% accordingly in their results) [36]. Some possible reasons for the lower accuracy rates are less samples for training and testing (roughly half), less total time for the corresponding samples (each sample recorded by Bedogni et al. is an average of 10 s vs. our 5 s), and the increased number of classes (10 instead of seven).
Table 8.
Confusion matrix for the best results (2-fold cross-validation, RF, HSS 20).
Table 9 shows the confusion matrix for the best results when using normalized acceleration values (two-fold cross-validation, RF, HSS 30). Most transportation modes have TP rates above 90%, with the exception of train, tram, and subway, all of which misclassified as bus or car.
Table 9.
Confusion matrix for normalised acceleration values (2-fold cross-validation, RF, HSS30).
Table 10 depicts the training and prediction times required by the various classifiers when run on a laptop (featuring an Intel Core i7-4700MQ CPU @ 2.40 GHz). While training the classifiers on the target development Android device (a Sony Xperia Z3 Compact), the corresponding training times are multiplied by a factor of more than 5, making the random forest classifier eventually unsuitable for iterated testing (i.e., training the classifier would take minutes instead of seconds). The table specifically shows the total time required to train the classifiers and predict all values when performing the 10-fold cross-validation with and without using the historical set (HSS 0 and 50). All time values presented are in milliseconds. As can be seen, the use of the historical set adds a seemingly indistinguishable amount of extra computation time (in the order of 1–2 ms for 30 k predictions at most). Random forest consumes the most time both for model training and prediction, while naïve Bayesian consumes the lowest time for model training, and random tree consumes the lowest for prediction.
Table 10.
Time consumption for classification training and prediction.
5.3. Online Transportation Mode Detection
Online tests using the random tree classifier are employed within the prototype game. For all tests, the historical set is used (usually size 12) and sleep settings are set to the same number as the historical set. Using a setting of 12 means that the background sensor service should have been active for 1 min, followed by sleep for 1 min, and restarting.
A screen within the game enables users to view the detected transportation mode for the past day, as well as other timeframes (minutes, hours, and weeks). Figure 12 shows the screen design within the app. At the top part of the screen, the current sensor state and detected transport are displayed. Some settings could be selected, a graph for the chosen time is displayed, and at the bottom, a list of the N last detected transportation modes is listed. In the initial versions of the app, the historical set size and sleep sessions are configurable for testing purposes. However, for all tests with the four test users, the values of the historical set and sleep sessions are locked at 12 for consistency purposes. Figure 12 also shows the detection results when the state is first idle followed by a brief walk. However, the user does not take a bus nor a boat during that day, and thus, their associated values are false positives.
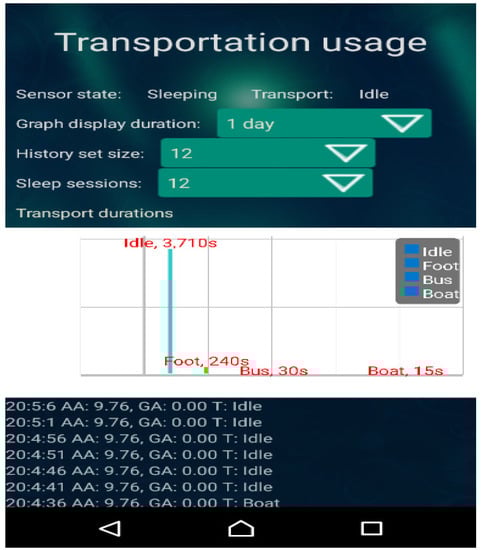
Figure 12.
Screenshot of the transportation usage screen. Within Evergreen (1 day).
Figure 13 shows the results for when a user is in a bus and exits at a bus stop to change buses. As can be seen, false positives arise again for train and car, as well as plane. Similarly, Figure 14 shows the results of 1 h of usage for foot, bus, and train, and their respective false positives that predominantly occur during transition. For both data gathering and evaluation, some devices encounter difficulties or are not able to gather gyroscope data. One of the test user’s devices prevents the transport detection background service from operating normally in the background, resulting always in near-0 total seconds for the past 24 h, as compared to thousands of seconds for other users.
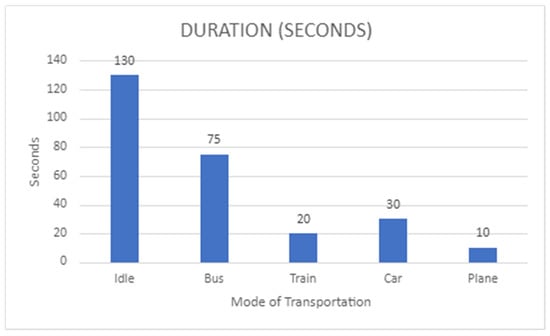
Figure 13.
Transportation detection while in a bus and exiting at a bus stop (total of 10 min total).
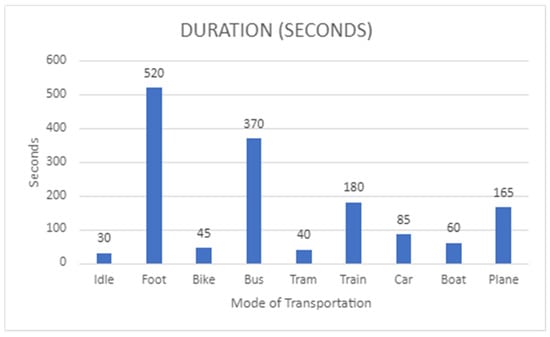
Figure 14.
Transportation detection for foot, bus, and train (total of 1 h).
6. Discussion of Results
Discussion of the results for this research is organised in two categories: game evaluation; comparative analysis with existing related research.
6.1. Game Evaluation
The game has testers who play the game in a multiplayer mode for at least 10 days. Two out of four players continue playing the game for 50 days after the launch. The four players play the game for at least 10 days each and spend either 1–5 min or 6–10 min a day on the game, and a similar amount of time talking about it with friends, colleagues, or others. They generally perceive the game as well-designed, with well thought graphics, it is not too difficult to understand and play, and has sufficient character customisation flexibility. Some comments include a lack of interaction with other players and insufficient proper tutorials. Another suggestion is that a more significant decrease in emissions ought to be associated to foot and bike transportation modes. Additionally, the connection between the actual opted transportation mode and in-game consequences is rather vague. One of the players also suggests the use of more ‘in-your-face’ pop-ups as in contemporary smartphone games. Some players prefer more content in the game, and would like to play it more than the few minutes spent each day to dictate their daily actions.
Another suggestion includes start and stop buttons for foot or bike sessions (the green transports) with a desired outcome. For example, player A wants to gather berries within the game. The player then activates an active foraging session within the game that verifies that the player is indeed walking then. After walking for some prescribed time, player A stops walking and requests for a confirmation of what is obtained during the walk session. Depending on the duration of the session, player A may obtain an increasing amount of food points representing the berries gathered within the game world (e.g., 1 point of food for each 5, 10, or 15 min of walking could be tested). The player who suggests this game mechanics also states that it would motivate them to go for more frequent walks, presumably if the feedback is immediate (note: the standard game would only yield results every 24 h). This would help promote good health and green transportation awareness.
In the opinion of most players, the game influences their choice of transportation mode. Half of the players seem to walk more than before, while another half seem to drive a car less than before. One of the players states that the game has made him more aware of his actions; however, other factors (distance, weather, time, etc.) largely influence the decision-making process. One participant states that travel by car is a necessity due to where he lives. If he had lived closer to a city, he would have walked or taken buses more often.
6.2. Comparative Analysis
The transportation mode detection algorithm (Transportation Recognition Service in Section 4) is an evolved version of one proposed by Bedogni et al. [36]. The addition of the normalisation of accelerometer values is not in any contemporary literature and, thus, calls for further analysis. User experience-based analysis may be necessary to fully render the approach device and orientation ambiguous, as some orientations are more prone to errors in gravity measurements than others (left and right side), and there may be biases in the sampled data towards some orientations, which may produce errors in specific use cases.
Compared with the results of Bedogni et al. [36], our results could be further enhanced. This is probably due to our smaller sample data size. Bedogni and colleagues generously share with us their collected data (i.e., a total of 38,061 samples, each representing 10 s each). This shows they have collected a total of 105.7 h while ours is only 29.3 h. We ran their data (seven classes of idle, bus, foot, car, bike, train, and tram) using the same high-performance classifiers (RF, RT). (Details of the analyses are found in Appendices 4–7 of [52]).
Some of our classes’ data are insufficiently sampled. For example, subway only has 444 samples, and since its data share many characteristics with other transports, the TP rate is logically low. The trend of ‘the more, the better’ is observed when gathering samples for all transportation modes. Classification tests are regularly run as each batch of data is collected. It is observed that gathering of more samples improves the accuracy of transportation mode classification.
6.3. Persuasive Effect
This study is short term (i.e., a 10-day period) and a small number of testers play the game in a multi-player mode. However, two of the four players continue to play the game 50 days after it is launched. Although persuasive effect of the game cannot be measured, the game seems to have positive effect on the players and it appears to have promoted awareness of green transportation.
7. Conclusion and Future work
To reiterate, one key disadvantage of this research is its short duration (10 days). A longitudinal study ought to be conducted. The number of testers of the Evergreen game is limited. However, here, we shall re-visit the initial research questions:
- i.
- What aspects of persuasive games could have impact on transportation choices?
Use a game design based on iterative playing, highlighting co-operative and competitive interactions, and highlighting the impact of real-life transportation mode choice within the game.
- ii.
- How could specific forms of transport be automatically detected without significantly reducing battery life?
Using machine-learning algorithms coupled with a historical set approach to remove noise provides a good base for further research work. Random forest may not be appropriate for online games due to its relatively small performance gain and high computation time compared to random tree.
In summary, the Evergreen game has an embedded transportation detection algorithm to feed real-life actions into the game. Transportation recognition is based on accelerometer and gyroscope data that are normalised and analysed to ensure that it is fully device–orientation ambiguous. Results from the transport classifier tests reveal that with normalised acceleration measurements, the proposed transportation mode detection could reach a classification true-positive rate of up to 87% for 10 classes. The corresponding value for non-normalised acceleration measurements could attain a classification TP rate of up to 95%. Game players reveal that deploying persuasive games to promote greener transportation may have some positives but this varies according to each individual’s situation. Players who are on the game for at least 10 days state that they try to choose greener forms of transportation (a maximum of 25% of their total travel time) and have recommended appropriate ways to improve the Evergreen game.
Future work could include larger test groups over a longer duration to provide more sample data (to improve transportation classifier stability and accuracy) and evidence of persuasive effect of the game and identify actual behaviour changes. Other behavioural changes relating to environmental footprint could also be investigated on using persuasive games. One such example is what we choose to eat. Reports suggest that up to 10% of our total consumption footprint, or half of our footprint concerning what we eat, could be reduced by switching to a vegetarian diet [52]. However, using persuasive games for behavioural changes requires user input for step-by-step analysis of any change. This would require different evaluation methods and yield different results. Additionally, General Data Protection Regulation (GDPR) procedures will be complied with to ensure users’ data privacy and security.
Author Contributions
E.H.—researcher, Evergreen developer, and primary author of this paper; A.-L.K.—primary author of this paper and research supervisor; J.H.—reviewer and research supervisor; K.A.—reviewer and research supervisor; C.P.—research supervisor; M.C.—reviewer. All authors have read and agreed to the published version of the manuscript.
Funding
EU funded EMJMD PERCCOM (2012–2019).
Institutional Review Board Statement
This research has been approved by the LBU Local Research Ethics Coordinator.
Data Availability Statement
Not applicable.
Acknowledgments
This work is part of the European Funded Erasmus Mundus Master programme in Pervasive Computing and Communication for Sustainable Development (PERCCOM) [57 58].
Conflicts of Interest
The authors declare no conflict of interest.
References
- C2ES. (nd). Reducing Your Transportation Footprint. Available online: https://www.c2es.org/content/reducing-your-transportation-footprint/ (accessed on 9 January 2019).
- Environment Protection UK. (nd). Air Pollution and Transport. Available online: https://www.environmental-protection.org.uk/policy-areas/air-quality/air-pollution-and-transport/ (accessed on 9 January 2019).
- OECD. Reducing Carbon Emissions from Transport Projects. 2010. Available online: https://www.oecd.org/derec/adb/47170274.pdf (accessed on 23 August 2021).
- Bin, S.; Dowlatabadi, H. Consumer Lifestyle Approach to US Energy Use and The Related CO2 Emissions. Energy Policy 2005, 33, 197–208. [Google Scholar] [CrossRef]
- Tyndall Centre for Climate Change Research. How Can We Reduce Carbon Emissions from Transport? Technical Report 15. 2004. Available online: https://www.lowcvp.org.uk/assets/reports/How_Can_We_Reduce_Carbon_Tyndall.pdf (accessed on 26 October 2018).
- UK Department of Transport. Low Carbon Transport: A Greener Future; 2009. Available online: https://assets.publishing.service.gov.uk/government/uploads/system/uploads/attachment_data/file/228897/7682.pdf (accessed on 26 October 2018).
- EESI. (nd). Public Transit, Walking, and Biking. Available online: https://www.eesi.org/topics/public-transit-walking-biking/description (accessed on 26 October 2018).
- Exergia. Study on Clean Transport Systems: Project 2010 n. 419-1-Unit Move B4 (Funded by European Commission). 2011. Available online: https://ec.europa.eu/transport/sites/transport/files/themes/urban/studies/doc/2011-11-clean-transport-systems.pdf (accessed on 26 October 2018).
- Prochaska, J.O.; Norcross, J.C.; DiClemente, C.C. Applying the stages of change. In Psychologists’ desk reference; Koocher, G.P., Norcross, J.C., Greene, B.A., Eds.; Oxford University Press: Oxford, UK, 2013; pp. 176–181. [Google Scholar] [CrossRef] [Green Version]
- Verywellmind. The 6 Stages of Behavior Change. 2018. Available online: https://www.verywellmind.com/the-stages-of-change-2794868 (accessed on 21 December 2018).
- Hervas, R.; Ruiz-Carrasco, D.; Mondejar, T.; Bravo, J. Gamification Mechanics for Behavioural Change: A Systematic Review and Proposed Taxonomy. In Proceedings of the 11th EAI International Conference on Pervasive Computing Technologies for Healthcare, Pervasive Health’17, Barcelona, Spain, 23–26 May 2017; pp. 395–404. [Google Scholar] [CrossRef]
- Fogg, B.J. Persuasive Computers: Perspectives and Research Directions. In Proceedings of the CHI’98, Los Angeles, CA, USA, 18–23 April 1998; Available online: http://www.cse.chalmers.se/research/group/idc/ituniv/kurser/07/idproj/papers/fogg.pdf (accessed on 21 December 2018).
- Orji, R.; Moffatt, K. Persuasive Technology for Health and Wellness: State-Of-The-Art And Emerging Trends. Health Inform. J. 2016. [Google Scholar] [CrossRef] [PubMed]
- Johnson, D.; Deterding, S.; Kuhn, K.-A.; Staneva, A.; Stoyanov, S.; Hides, L. Gamification for Health And Wellbeing: A Systematic Review of The Literature. Internet Interv. 2016, 6, 89–106. [Google Scholar] [CrossRef] [PubMed] [Green Version]
- Connolly, T.M.; Boyle, E.A.; MacArthur, E.; Hainey, T.; Boyle, J.M. A Systematic Literature Review of Empirical Evidence on Computer Games and Serious Games. Comput. Educ. 2012, 59, 661–686. [Google Scholar] [CrossRef]
- Khaled, R.; Barr, P.; Noble, J.; Fischer, R.; Biddle, R. Fine Tuning the Persuasion in Persuasive Games. In Proceedings of the 2nd International Conference on Persuasive Technology, PERSUASIVE’07, Palo Alto, CA, USA, 26–27 April 2007. [Google Scholar]
- Lavender, T. Games just wanna have fun…or do they? In Proceedings of the Canadian Games Study Association (CGSA) Symposium, Toronto, ON, Canada, 21–24 September 2006. [Google Scholar]
- Froehlich, J.; Dillahunt, T.; Klasnja, P.; Mankoff, J.; Consolvo, S.; Harrison, B.; Landay, J.A. UbiGreen: Investigating a Mobile Tool for Tracking and Supporting Green Transportation Habits. In Proceedings of the SIGCHI Conference on Human Factors in Computing Systems, Boston, MA, USA, 4–9 April 2009; pp. 1043–1052. [Google Scholar] [CrossRef]
- Froehlich, J.E. Sensing and Feedback of Everyday Activities to Promote Environmental Behaviors. Unpublished. PhD Thesis, University of Washington, Washington, DC, USA, 2011. Available online: https://makeabilitylab.cs.washington.edu/media/publications/Sensing_and_Feedback_of_Everyday_Activities_to_Promote_Environmental_Behaviors_Eye7nYF.pdf (accessed on 19 August 2021).
- Orji, R.; Mandryk, R.L.; Vassileva, J.; Gerling, K.M. Tailoring Persuasive Health Games to Gamer Type. In Proceedings of the SIGCHI Conference on Human Factors in Computing Systems, Paris, France, 27 April–2 May 2013; pp. 2467–2476. [Google Scholar] [CrossRef] [Green Version]
- Deterding, S. The Fine Art of Separating Users from Their Bad Behaviours. Presentation, Reboot11: »Action«, 25 June 2009, Copenhagen, Denmark. 2017. Available online: http://codingconduct.cc/Persuasive-Design (accessed on 10 January 2019).
- Ferrara, J. Games for Persuasion. Games Cult. 2013, 8, 289–304. [Google Scholar] [CrossRef] [Green Version]
- Feng, T.; Timmermans, H. Transportation Mode Recognition Using GPS and Accelerometer Data. Transp. Res. Part C Emerg. Technol. 2013, 37, 118–130. [Google Scholar] [CrossRef]
- Priscolli, F.D.; Giuseppi, A.; Lisi, F. Automatic Transportation Mode Recognition on Smartphone Data Based on Deep Neural Networks. Sensors 2020, 20, 7228. [Google Scholar] [CrossRef]
- Liang, X.; Zhang, Y.; Wang, G.; Xu, S. A Deep Learning Model for Transportation Mode Detection Based on Smartphone Sensing Data. IEEE Trans. Intell. Transp. Syst. 2019, 21, 5223–5235. [Google Scholar] [CrossRef]
- Reddy, S.; Mun, M.; Burke, J.; Estrin, D.; Hansen, M.; Srivastava, M. Using Mobile Phones to Determine Transportation Modes. ACM Trans. Sens. Netw. (TOSN) 2010, 6, 13. [Google Scholar] [CrossRef]
- Nham, B.; Siangliulue, K.; Yeung, S. Predicting Mode of Transport From Iphone Accelerometer Data, Stanford University Class Project. 2008. Available online: https://pdfs.semanticscholar.org/111a/8a8faf04e754dcef1f0d4701a2d6af36ce8b.pdf (accessed on 9 January 2019).
- Ernest, P.; Mazl, R.; Preucil, L. Train Locator Using Inertial Sensors and Odometer. In Proceedings of the Intelligent Vehicles Symposium, Parma, Italy, 14–17 June 2004. [Google Scholar] [CrossRef]
- Anguita, D.; Ghio, A.; Oneto, L.; Parra, X.; Reyes-Ortiz, J.L. Human Activity Recognition on Smartphones Using a Multiclass Hardware-Friendly Support Vector Machine. In Proceedings of the 4th International Workshop on Ambient Assisted Living and Home Care, Vitoria-Gasteiz, Spain, 3–5 December 2012; pp. 216–223. [Google Scholar] [CrossRef] [Green Version]
- Reyes-Ortiz, J.L.; Oneto, L.; Sama, A.; Parra, X.; Anguita, D. Transition-Aware Human Activity Recognition Using Smartphones. Neurocomputing 2016, 171, 754–767. [Google Scholar] [CrossRef] [Green Version]
- Nick, T.; Coersmeier, E.; Geldmacher, J.; Goetze, J. Classifying Means of Transportation Using Mobile Sensor Data. In Proceedings of the 2010 International Joint Conference on Neural Networks (IJCNN), Barcelona, Spain, 18–23 July 2010. [Google Scholar] [CrossRef]
- Hemminki, S.; Nurmi, P.; Tarkoma, S. Accelerometer-Based Transportation Mode Detection on Smartphones. In Proceedings of the 11th ACM Conference on Embedded Networked Sensor Systems, Roma, Italy, 11–15 November 2013. [Google Scholar] [CrossRef]
- Lorintiu, O.; Vassilev, A. Transportation Mode Recognition Based on Smartphone Embedded Sensors for Carbon Footprint Estimation. In Proceedings of the IEEE 19th International Conference on Intelligent Transportation Systems (ITSC), Rio De Janeiro, Brazil, 1–4 November 2016. [Google Scholar] [CrossRef]
- Jahangiri, A.; Rakha, H.A. Applying Machine Learning Techniques to Transportation Mode Recognition Using Mobile Phone Sensor Data. IEEE Trans. Intell. Transp. Syst. 2015, 16, 2406–2417. [Google Scholar] [CrossRef]
- Bedogni, L.; Di Felice, M.; Bononi, L. Context-Aware Android Applications through Transportation Mode Detection Techniques. J. Wirel. Commun. Mob. Comput. 2016, 16, 2523–2541. [Google Scholar] [CrossRef] [Green Version]
- Bedogni, L.; Di Felice, M.; Bononi, L. By Train or by Car? Detecting the User’s Motion Type through Smartphone Sensors Data. In Proceedings of IFIP Wireless Days (WD), Dublin, Ireland, 21–23 November 2012. [Google Scholar] [CrossRef] [Green Version]
- Hall, M.; Frank, E.; Holmes, G.; Pfahringer, B.; Reutemann, P.; Witten, I.H. The WEKA Data Mining Software: An Update. ACM SIGKDD Explor. Newsl. 2009, 11, 10–18. [Google Scholar] [CrossRef]
- CHSD. (nd). SNAPshot Version 3.8 User Manual. Available online: https://ahsri.uow.edu.au/content/groups/public/@web/@chsd/documents/doc/uow082650.pdf (accessed on 21 December 2018).
- Rjmarsan, Weka-For-Android, the Weka Project with the GUI Components Removed so It Works with Android. 16 February 2011. Available online: https://github.com/rjmarsan/Weka-for-Android/ (accessed on 6 March 2017).
- University of Waikato. WEKA Explorer User Guide for Version 3-4-3. 2004. Available online: http://weka.sourceforge.net/manuals/ExplorerGuide.pdf (accessed on 21 December 2018).
- Weka 3: Data Mining Software in Java. Available online: https://www.cs.waikato.ac.nz/ml/weka/ (accessed on 3 January 2019).
- Gupta, S.; Gupta, A. Dealing with Noise Problem in Machine Learning Data-sets: A Systematic Review. Procedia Comput. Sci. 2019, 161, 466–474. [Google Scholar] [CrossRef]
- Baranes, A.F.; Oudeyer, P.Y.; Gottlieb, J. The effects of task difficulty, novelty and the size of the search space on intrinsically motivated exploration. Front. Neurosci. 2014, 8, 317. [Google Scholar] [CrossRef] [PubMed] [Green Version]
- Serino, M.; Cordrey, K.; McLaughlin, L.; Milanaik, R.L. Pokémon Go and Augmented Virtual Reality Games: A Cautionary Commentary for Parents and Paediatricians. Curr. Opin. Paediatr. 2016, 28, 673–677. [Google Scholar] [CrossRef] [PubMed]
- Habgood, M.P.J.; Ainsworth, S.E.; Benford, S. Endogenous fantasy and learning in digital games. Simul. Gaming 2005, 36, 483–498. [Google Scholar] [CrossRef]
- Malone, T.W.; Lepper, M.R. Making learning fun: A taxonomy of intrinsic motivations for learning. In Aptitude, Learning and Instruction: III. Conative and Affective Process Analyses; Snow, R.E., Farr, M.J., Eds.; Lawrence Erlbaum: Hillsdale, NJ, USA, 1987; pp. 223–253. [Google Scholar]
- Malone, T.W. Toward a Theory of Intrinsically Motivating Instruction. Cogn. Sci. 1981, 4, 333–369. [Google Scholar] [CrossRef]
- Malone, T. What Makes Things Fun to Learn? Heuristics for Designing Instructional Computer Games. In Proceedings of the 3rd ACM SIGSMALL Symposium and the 1st SIGPC Symposium, Palo Alto, CA, USA, 18–19 September 1980; pp. 162–169. [Google Scholar] [CrossRef]
- Kidd, C.; Hayden, B.Y. The psychology and neuroscience of curiosity. Neuron 2015, 88, 449–460. [Google Scholar] [CrossRef] [Green Version]
- Loewenstein, G. The Psychology of Curiosity: A Review and Reinterpretation. Psychol. Bull. 1994, 116, 75–98. [Google Scholar] [CrossRef]
- Hedemalm, E. Evergreen—The Game, Prototype Table-Top RPG/Strategy Rules. 2016. Available online: https://docs.google.com/document/d/155rwYDJeFLjx18rsv1tPCDg5rYvEK2pewqZfo4WNhxs/edit?usp=sharing (accessed on 12 November 2016).
- Hedelmalm, E. Promoting Green Transportation via Persuasive Games. Unpublished. Master’s Thesis, Lulea University of Technology, Lulea, Sweden, 2017. [Google Scholar]
- Goldszmidt, M. Bayesian Network Classifiers; Wiley Online Library: New York, NY, USA, 2011. [Google Scholar] [CrossRef]
- ScikitLearn. (nd). Naïve Bayes. Available online: https://scikit-learn.org/stable/modules/naive_bayes.html (accessed on 20 August 2021).
- O’Reilly. (nd). Decision Trees Learning Pros and Cons. Available online: https://www.oreilly.com/library/view/machine-learning-with/9781787121515/697c4c5f-1109-4058-8938-d01482389ce3.xhtml (accessed on 21 August 2021).
- Dataversity. Machine Learning Algorithms: Introduction to Random Forests. 2017. Available online: https://www.dataversity.net/machine-learning-algorithms-introduction-random-forests/ (accessed on 21 August 2021).
- Klimova, A.; Rondeau, E.; Andersson, K.; Porras, J.; Rybin, A.; Zaslavsky, A. An International Master’s Program in Green ICT as a Contribution to Sustainable Development. J. Clean. Prod. 2016, 135, 223–239. [Google Scholar] [CrossRef]
- Kor, A.L.; Rondeau, E.; Andersson, K.; Porras, J. Education in Green ICT and Control of Smart Systems: A First Hand Experience from the International PERCCOM Masters Programme. In Proceedings of the 12th International Federation of Automatic Control Symposium on Advances in Control Education (IFAC-ACE 2019), Philadelphia, PA, USA, 7–9 July 2019; Volume 52, Article Id 9. pp. 1–8. [Google Scholar] [CrossRef]
Publisher’s Note: MDPI stays neutral with regard to jurisdictional claims in published maps and institutional affiliations. |
© 2021 by the authors. Licensee MDPI, Basel, Switzerland. This article is an open access article distributed under the terms and conditions of the Creative Commons Attribution (CC BY) license (https://creativecommons.org/licenses/by/4.0/).