
THz-TDS Techniques of Thickness Measurements in Thin Shim Stock Films and Composite Materials


Abstract
:1. Introduction
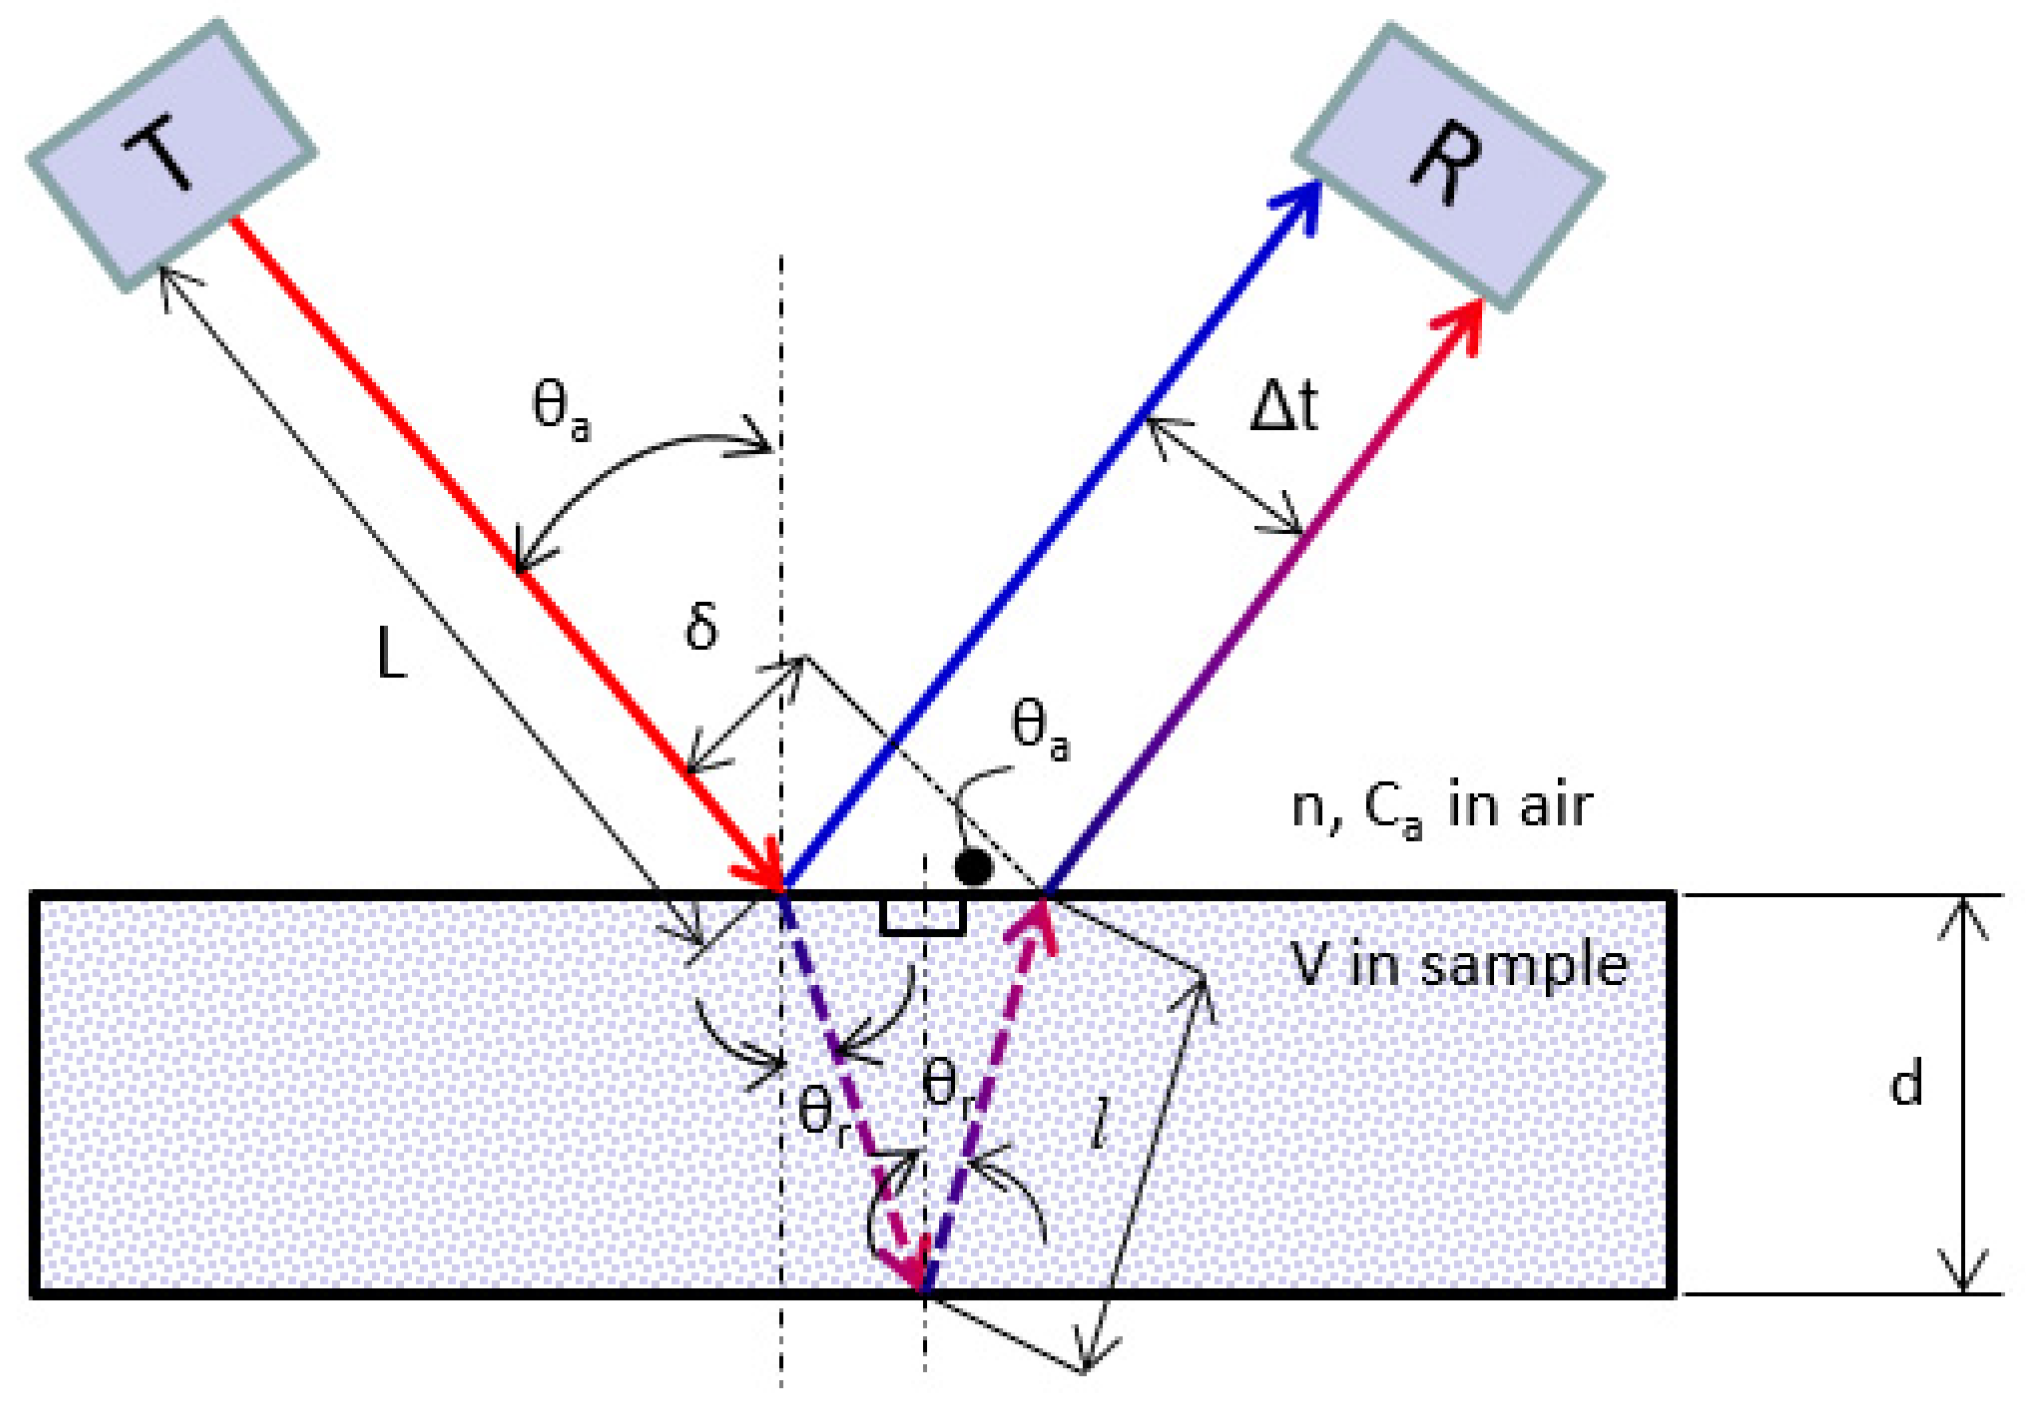
2. Fundamental Theory
2.1. Measurement of Refractive Index
2.2. Measurement of Refractive Index
3. Experiment System and Measurement
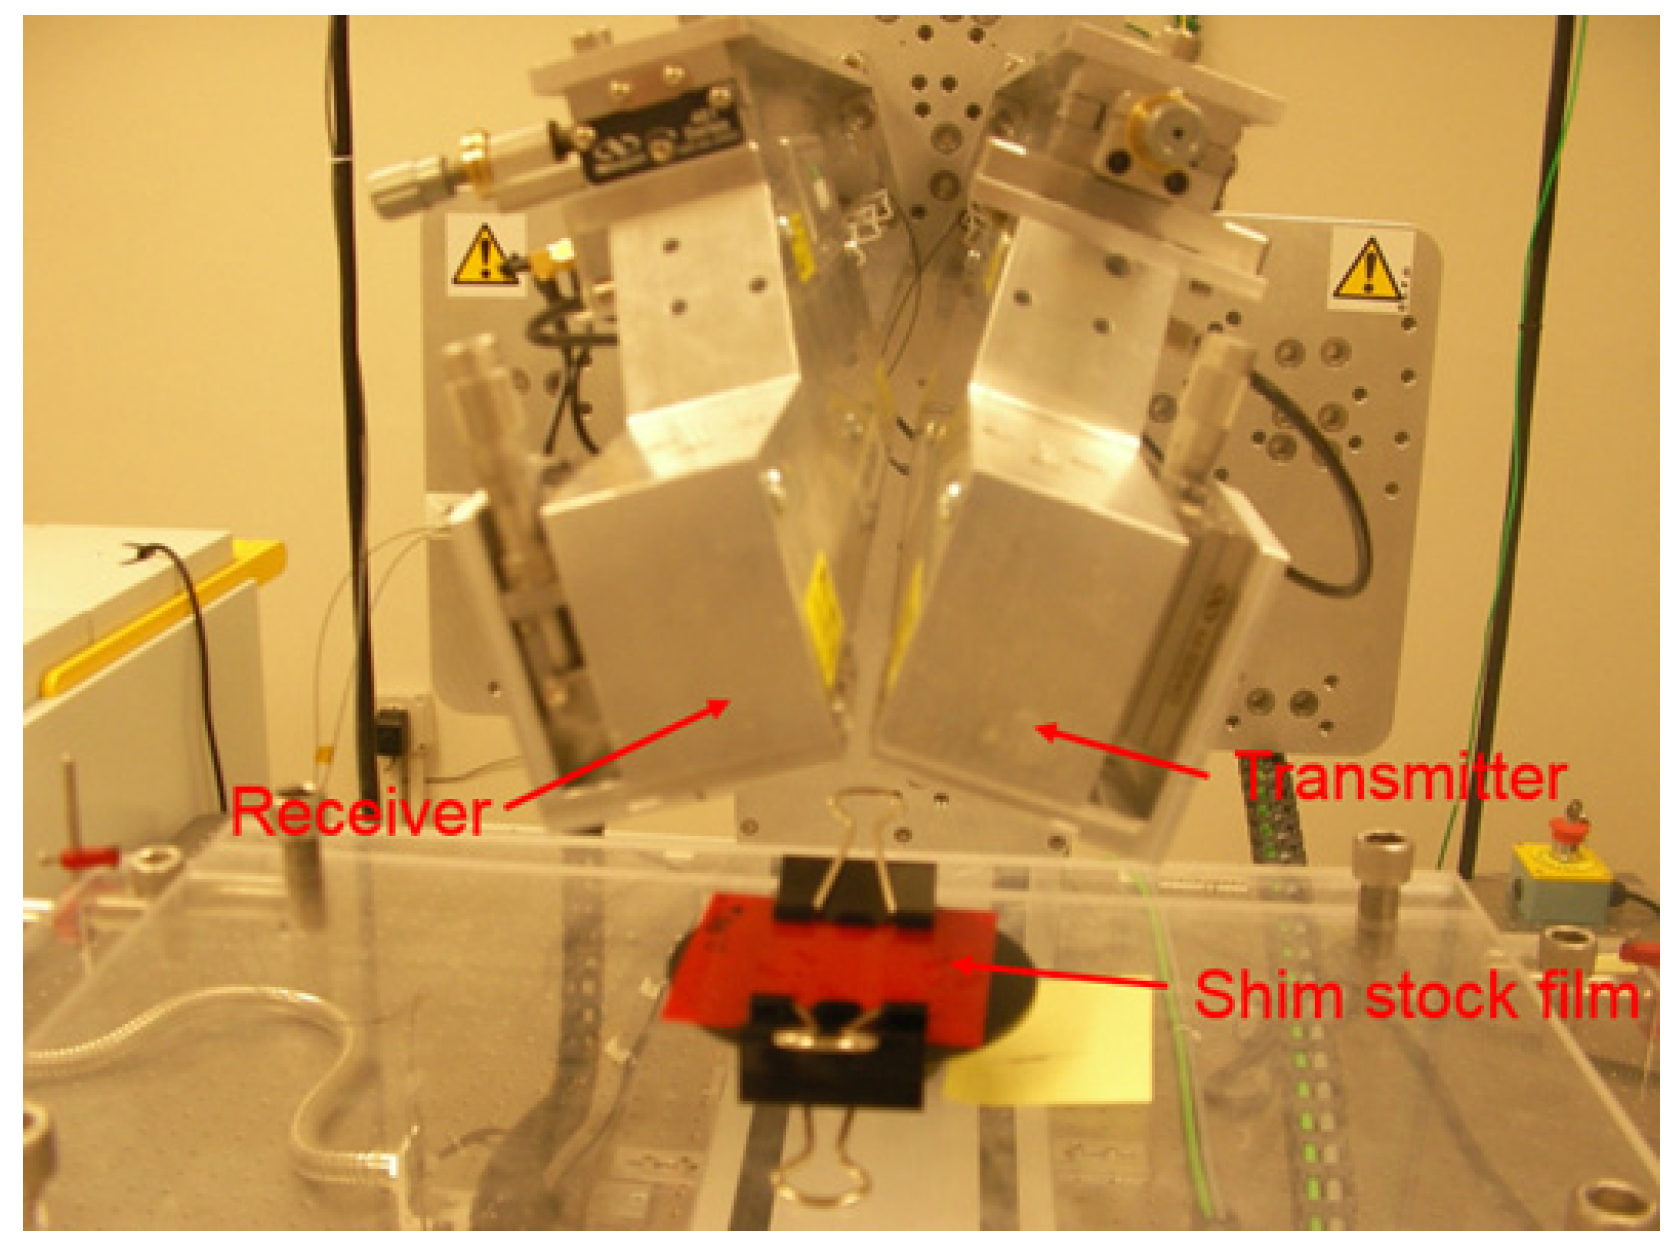
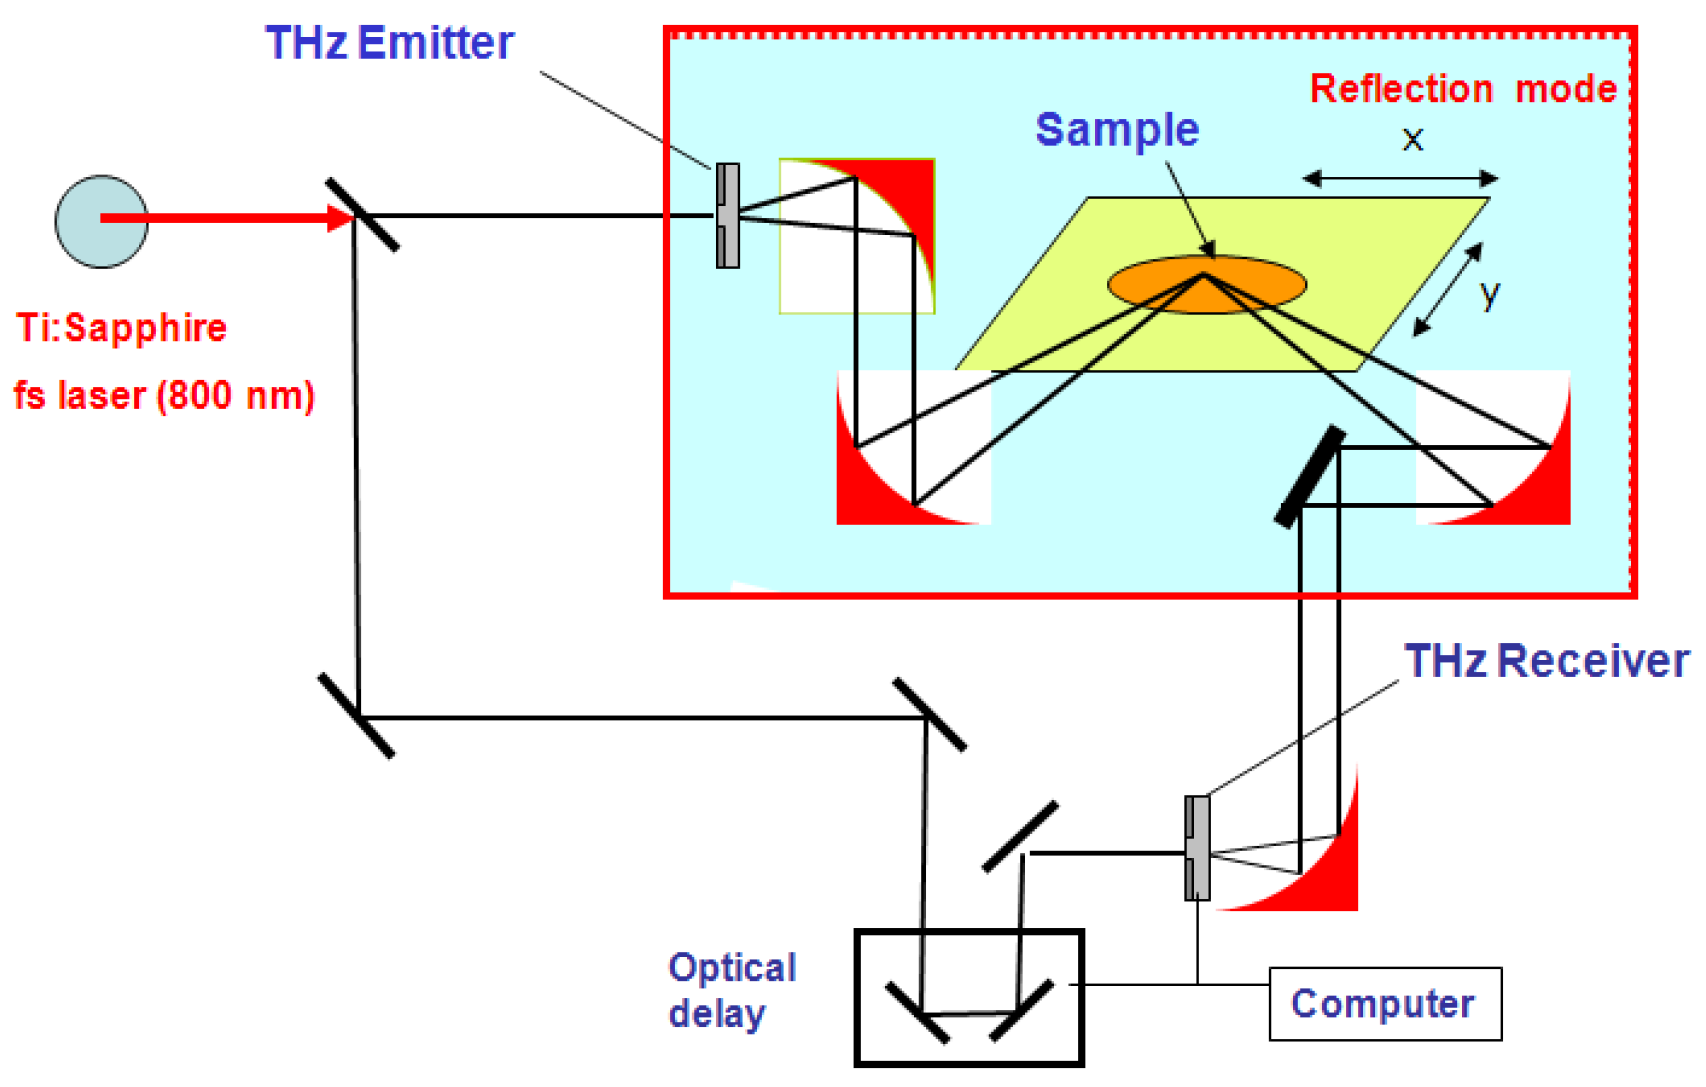
3.1. Measurement System
3.2. Measurement Method
4. Results and Discussion
4.1. Measurement of Terahertz Refractive Index
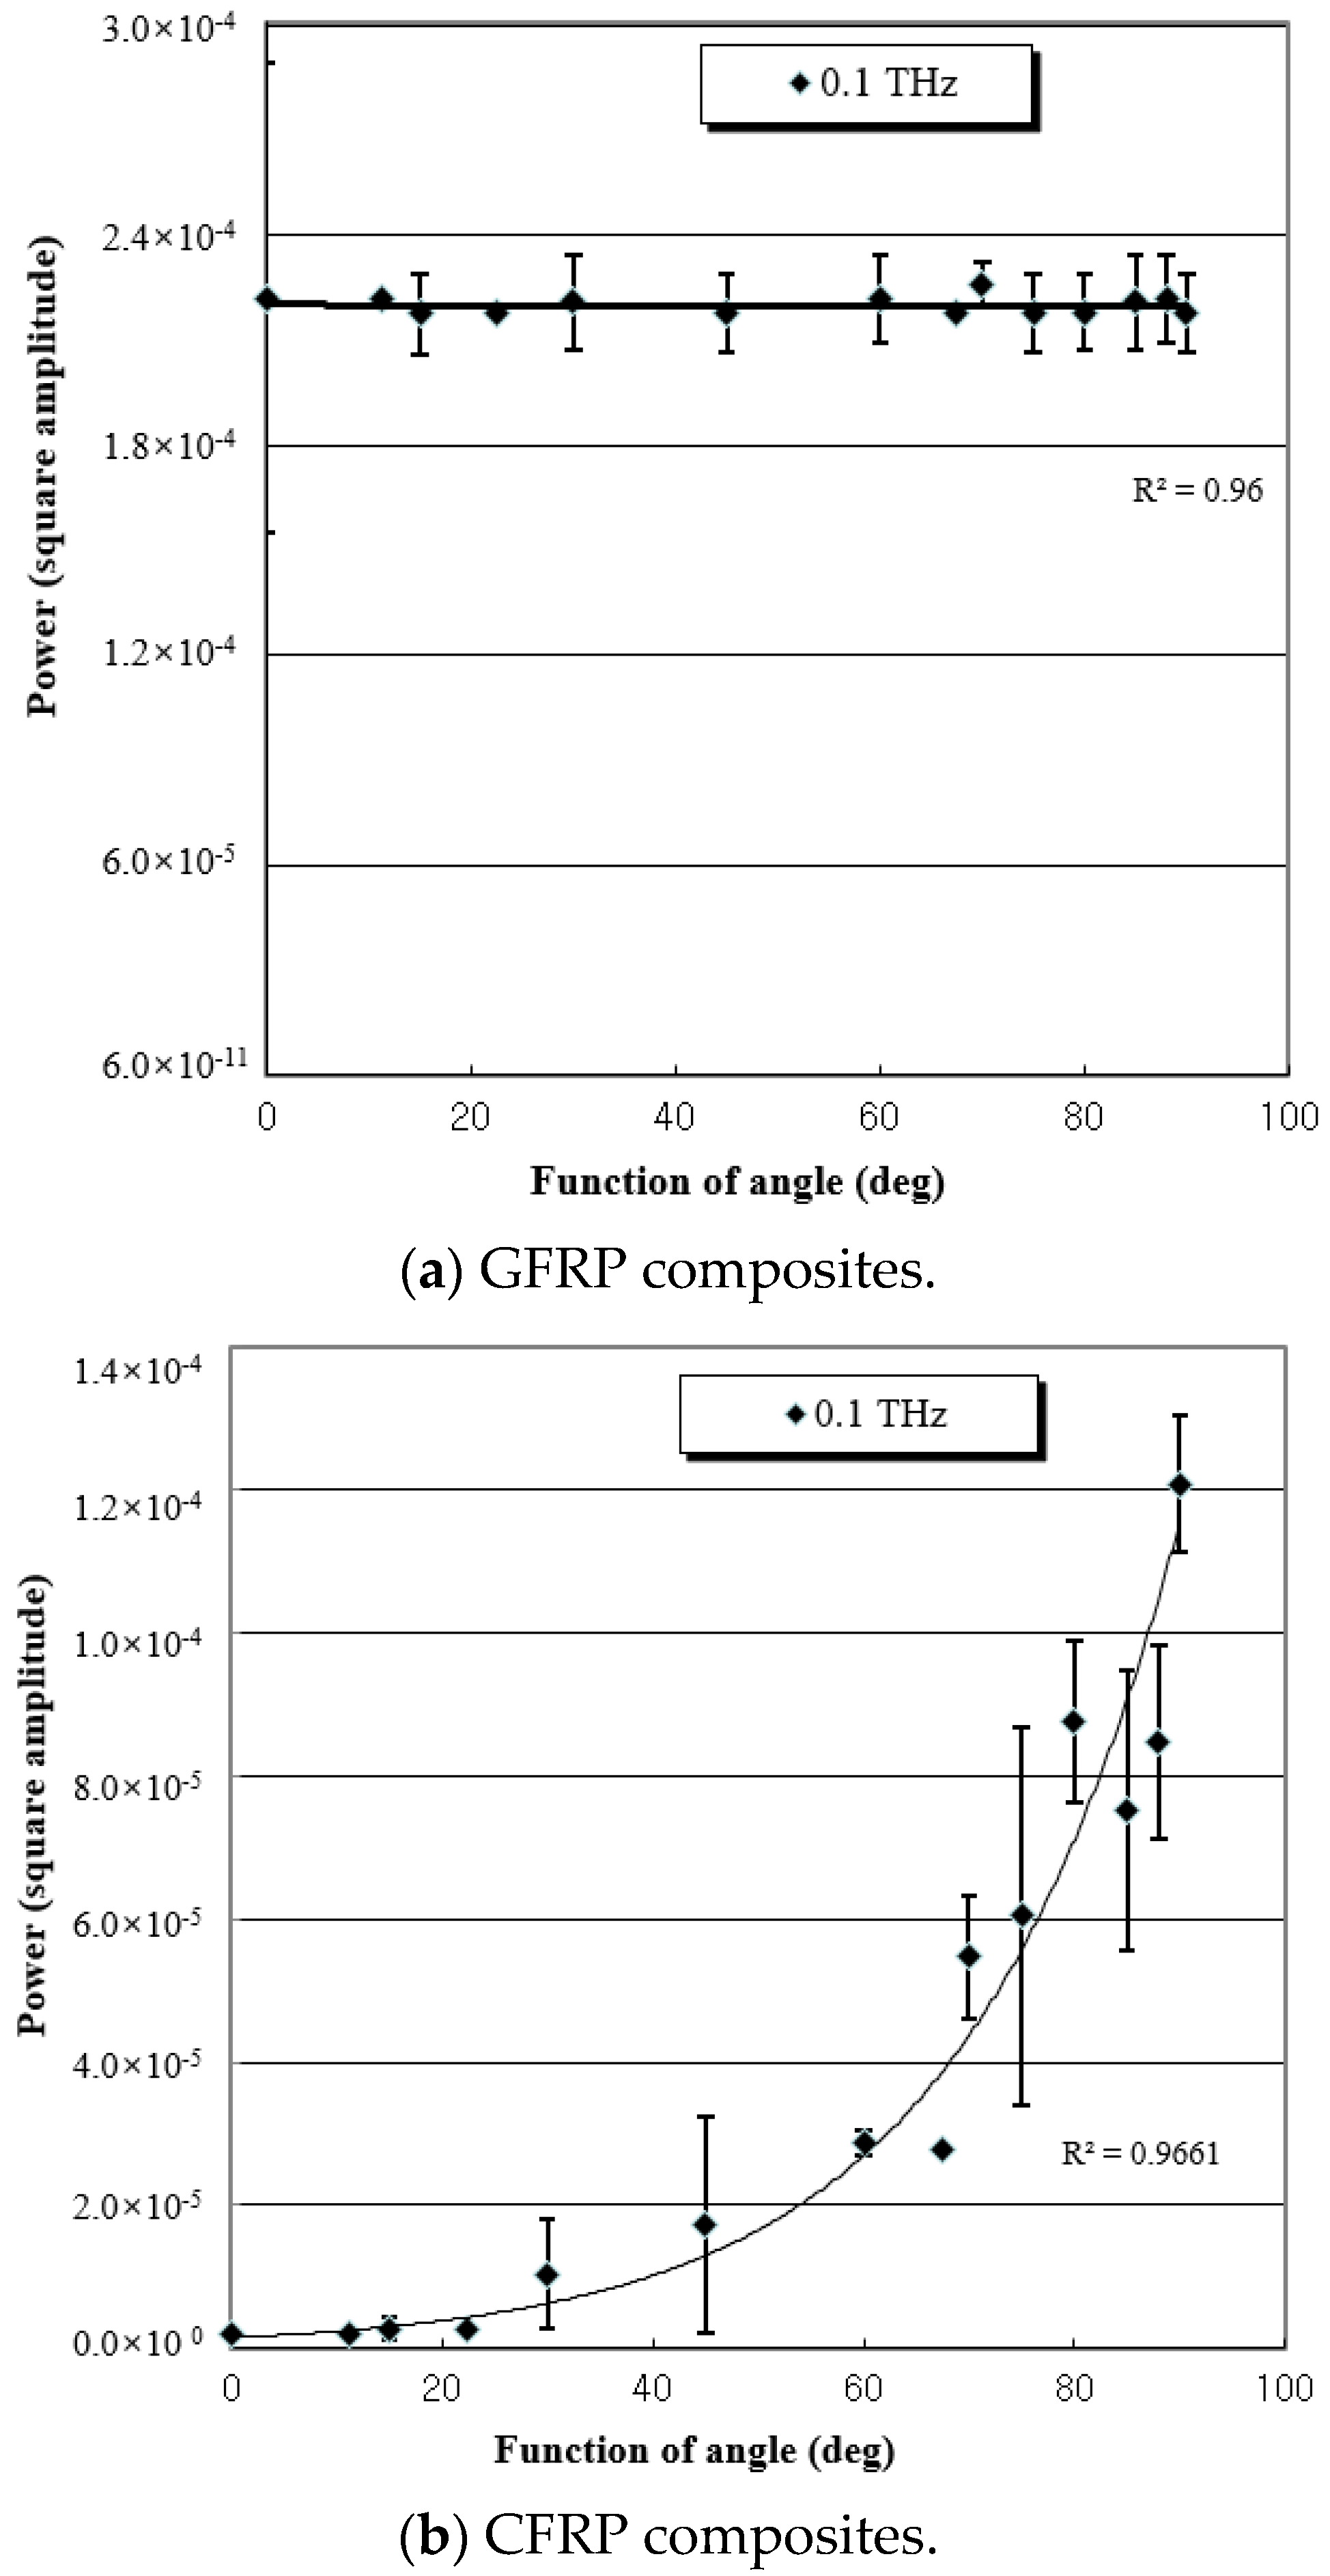
4.2. Electric Field Evaluation of Carbon Fiber
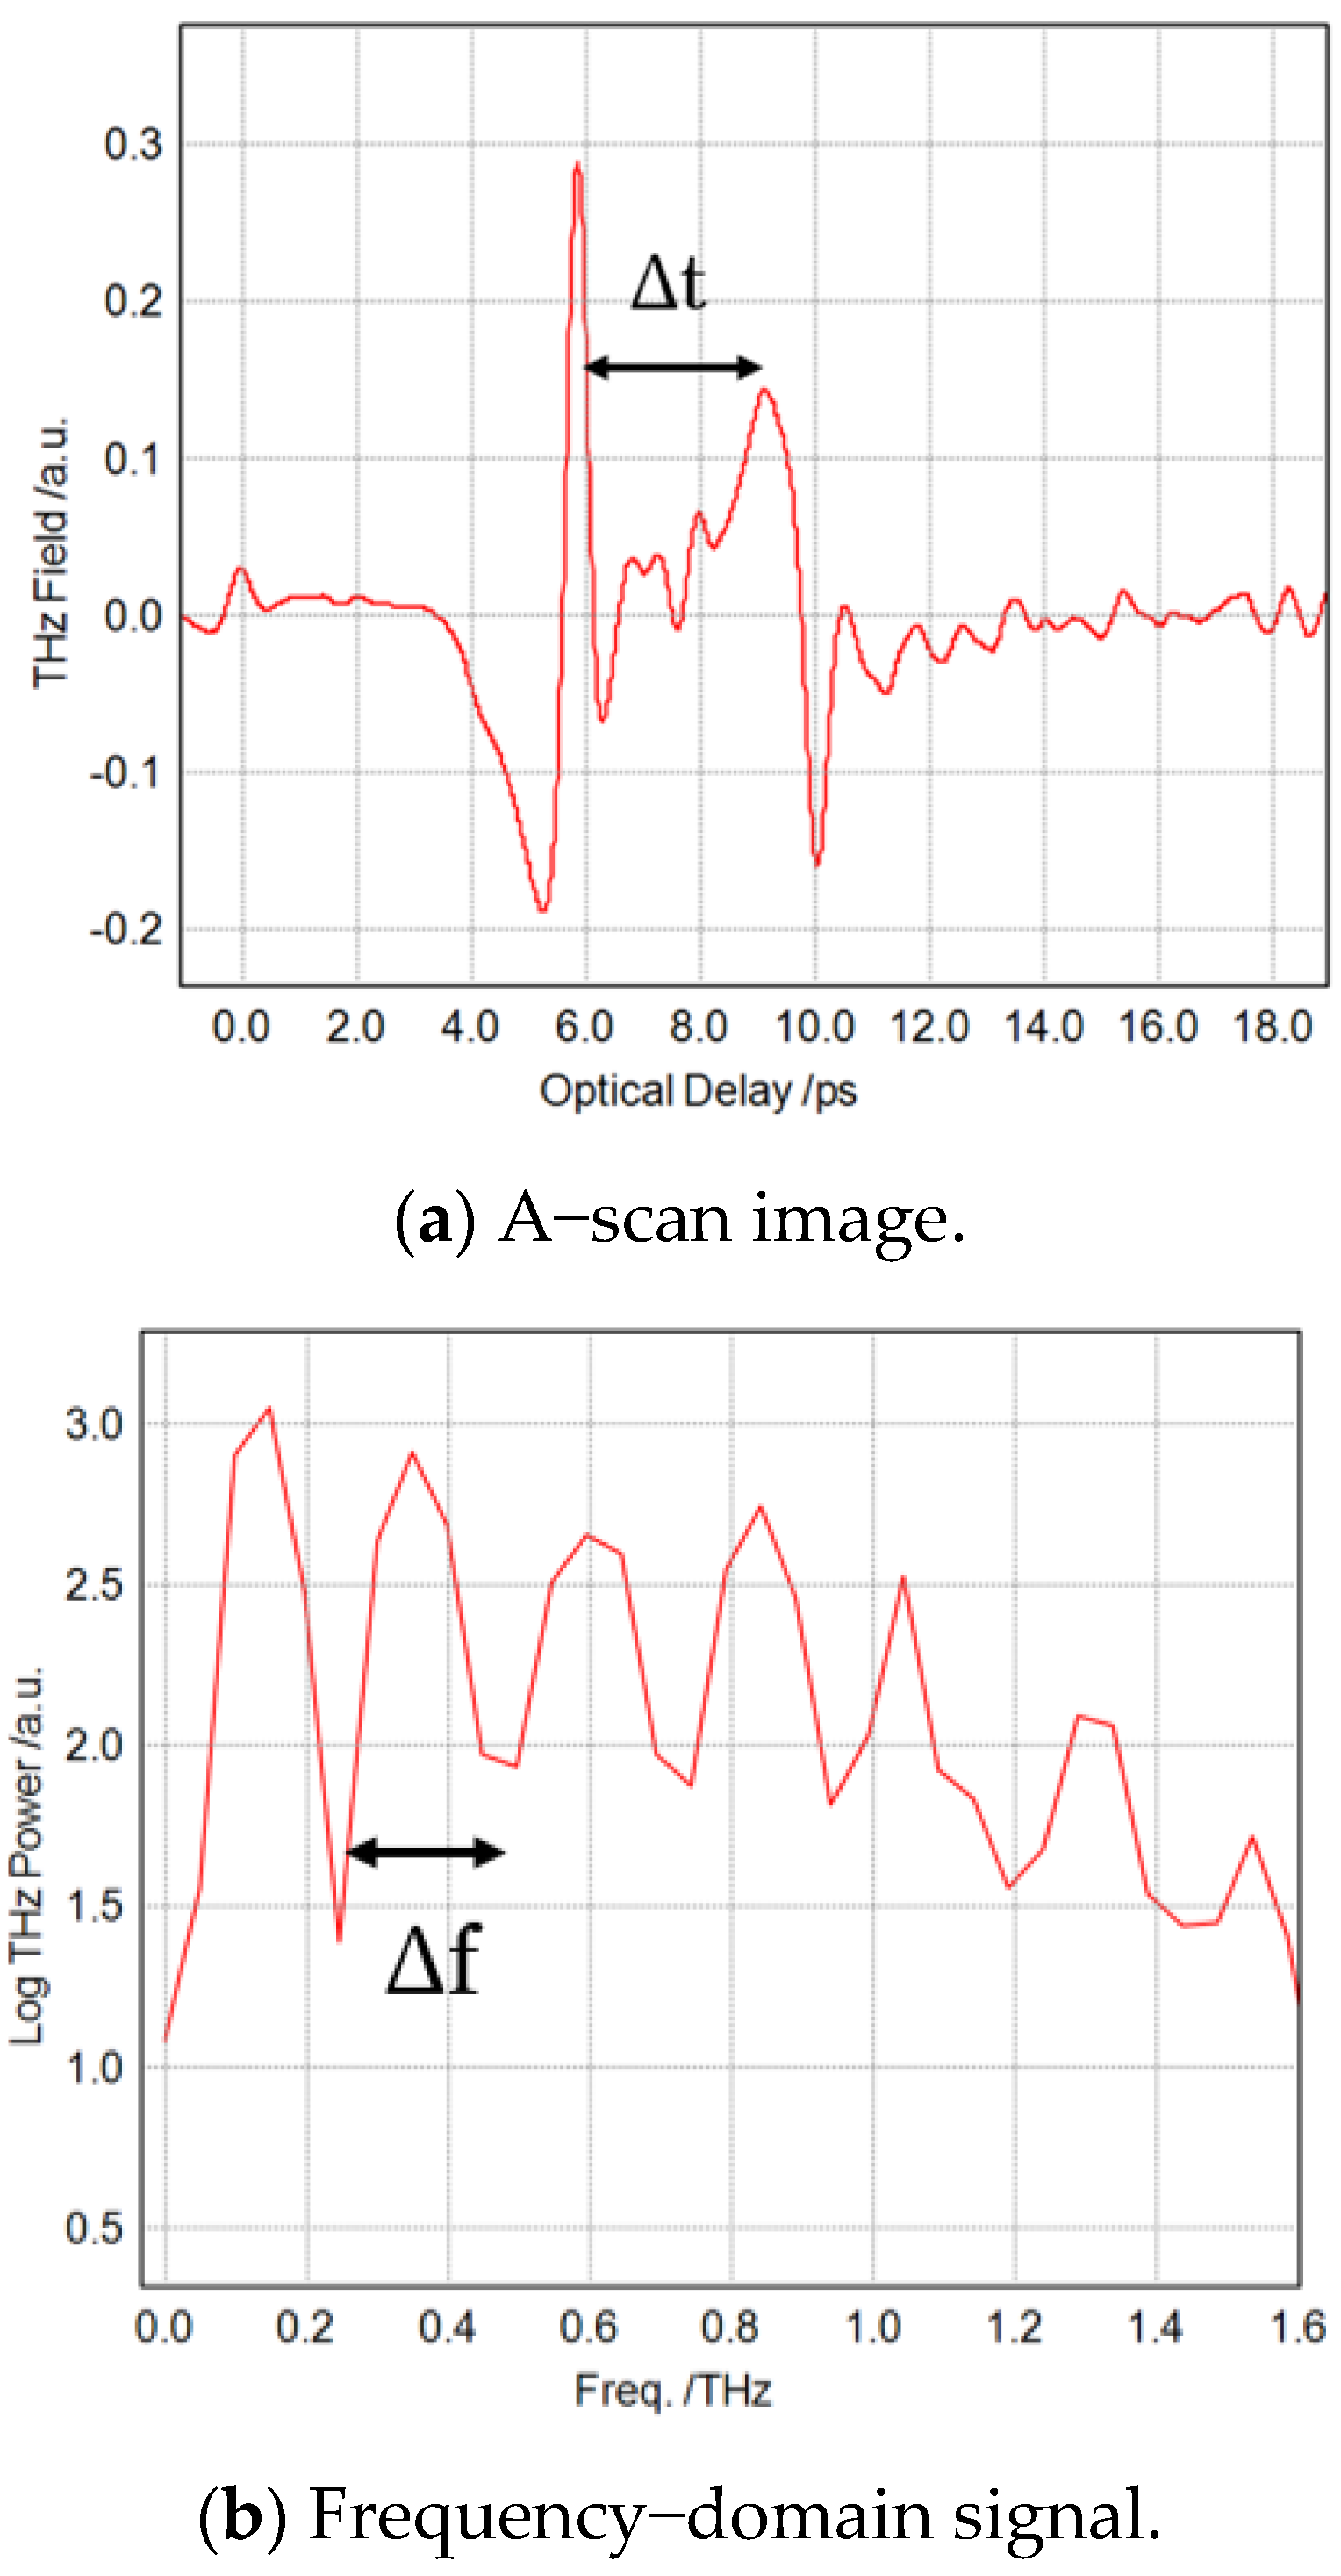
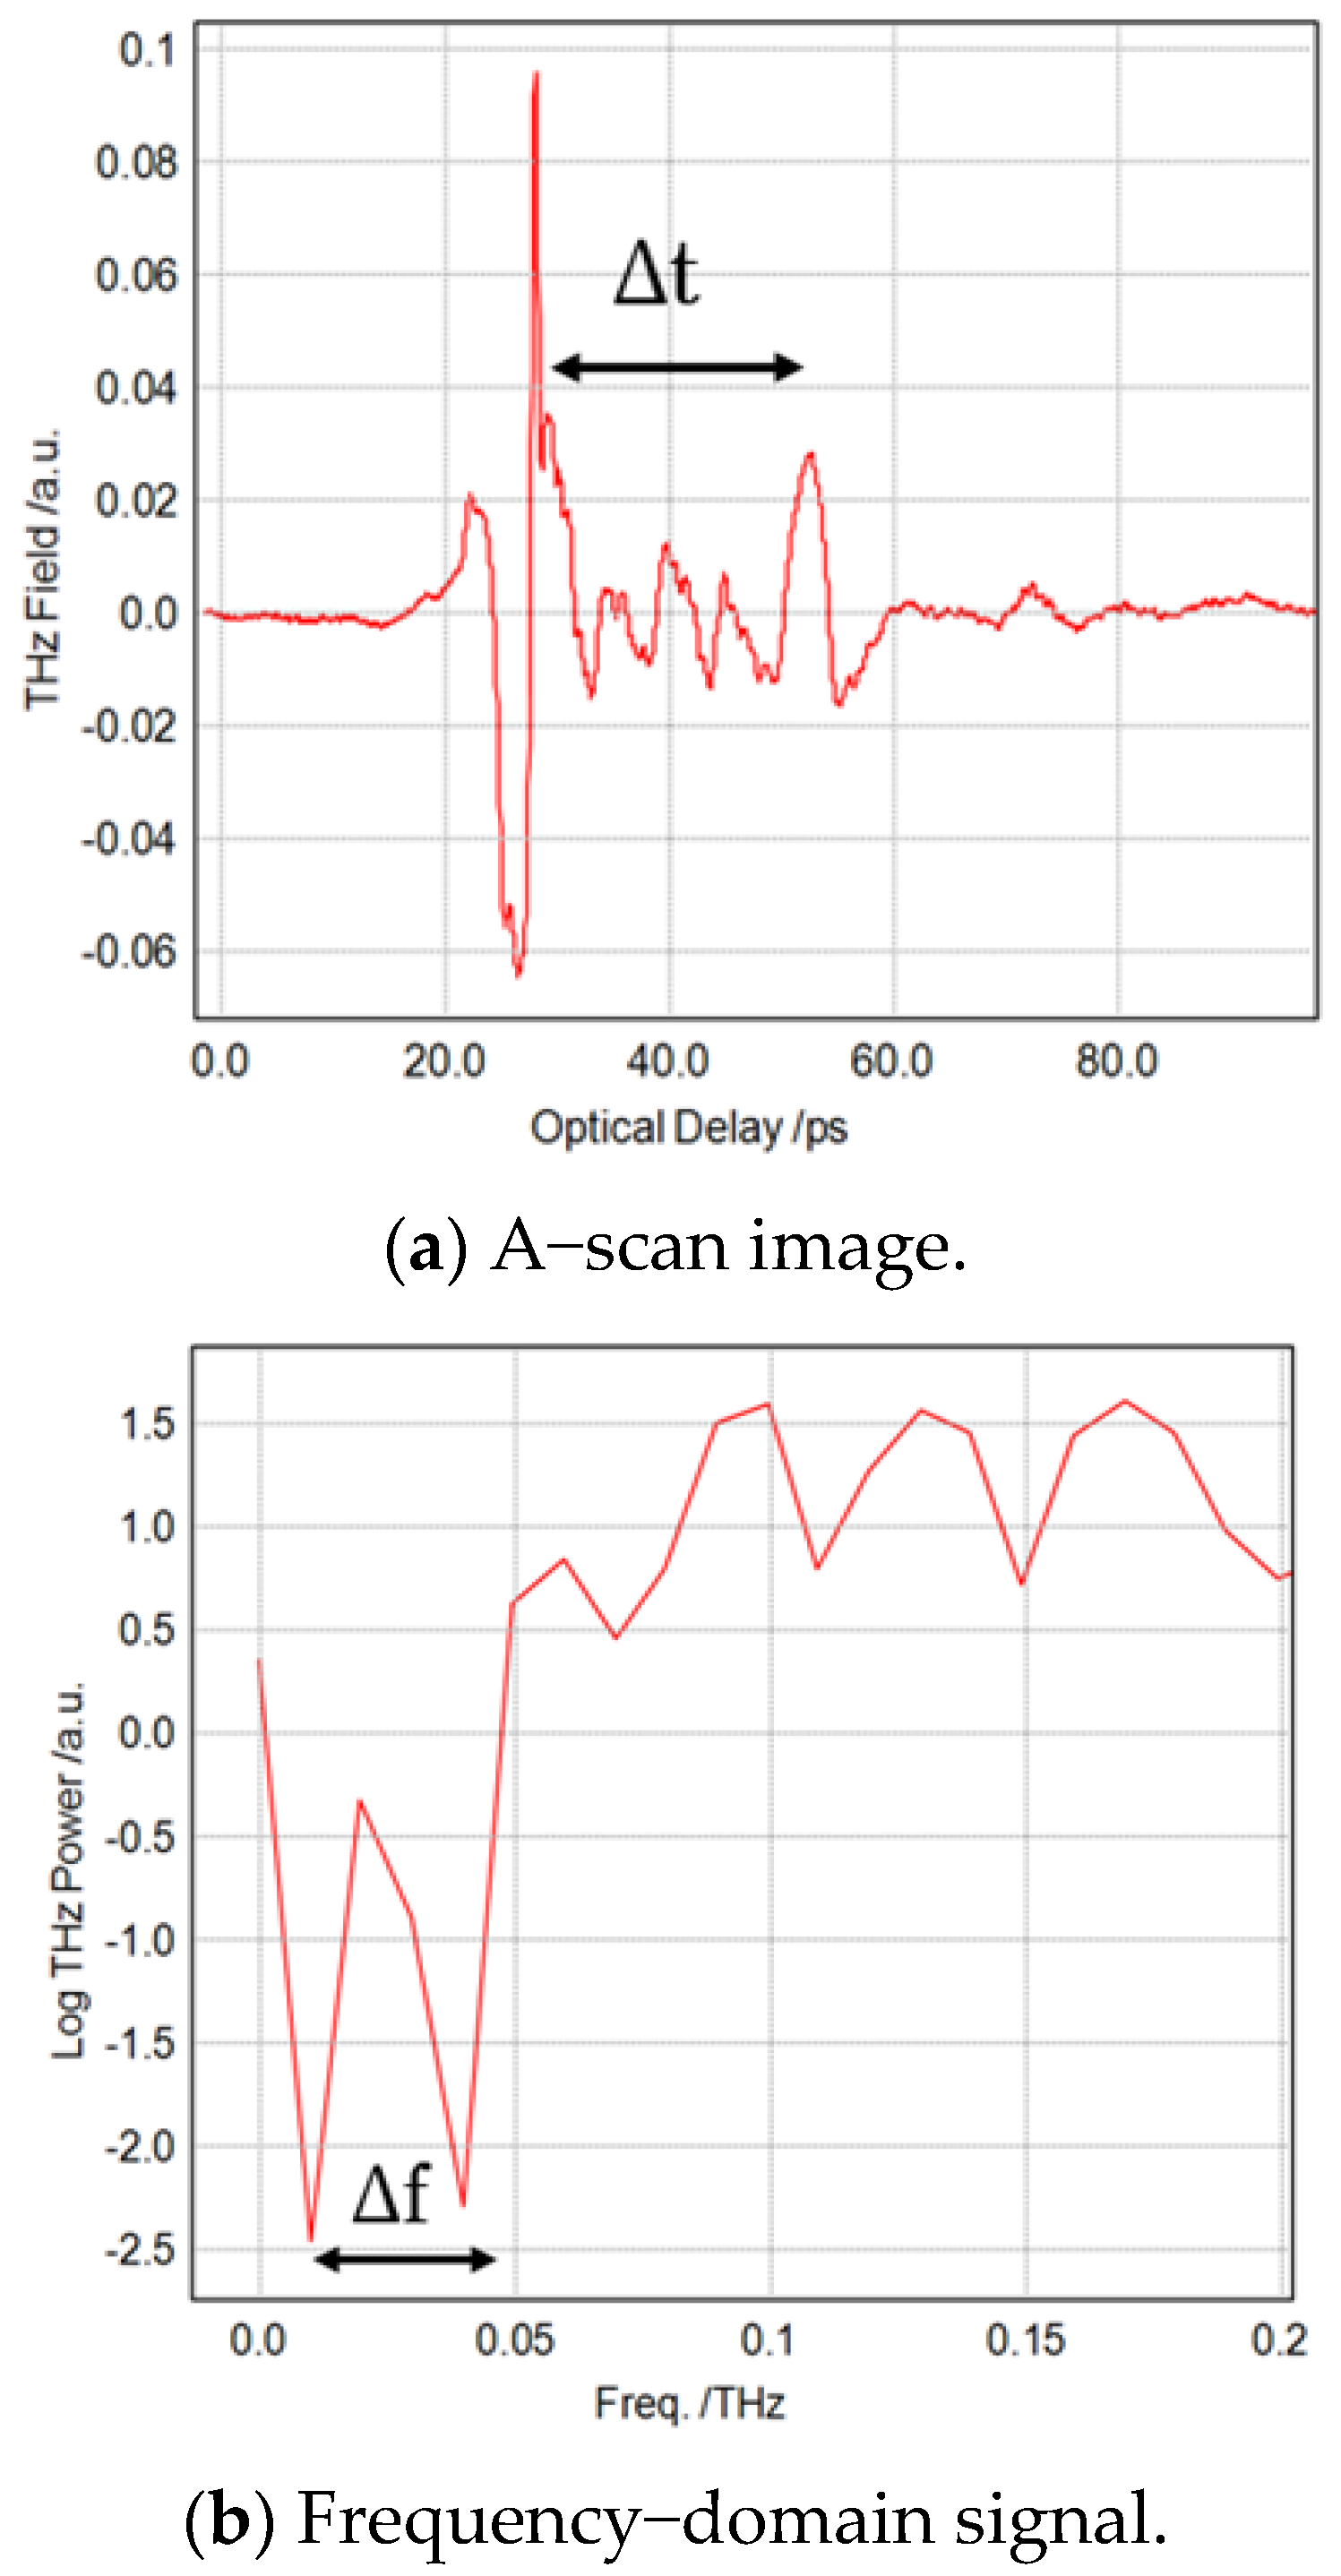
4.3. Measurement of Thickness Using the Reflection Mode
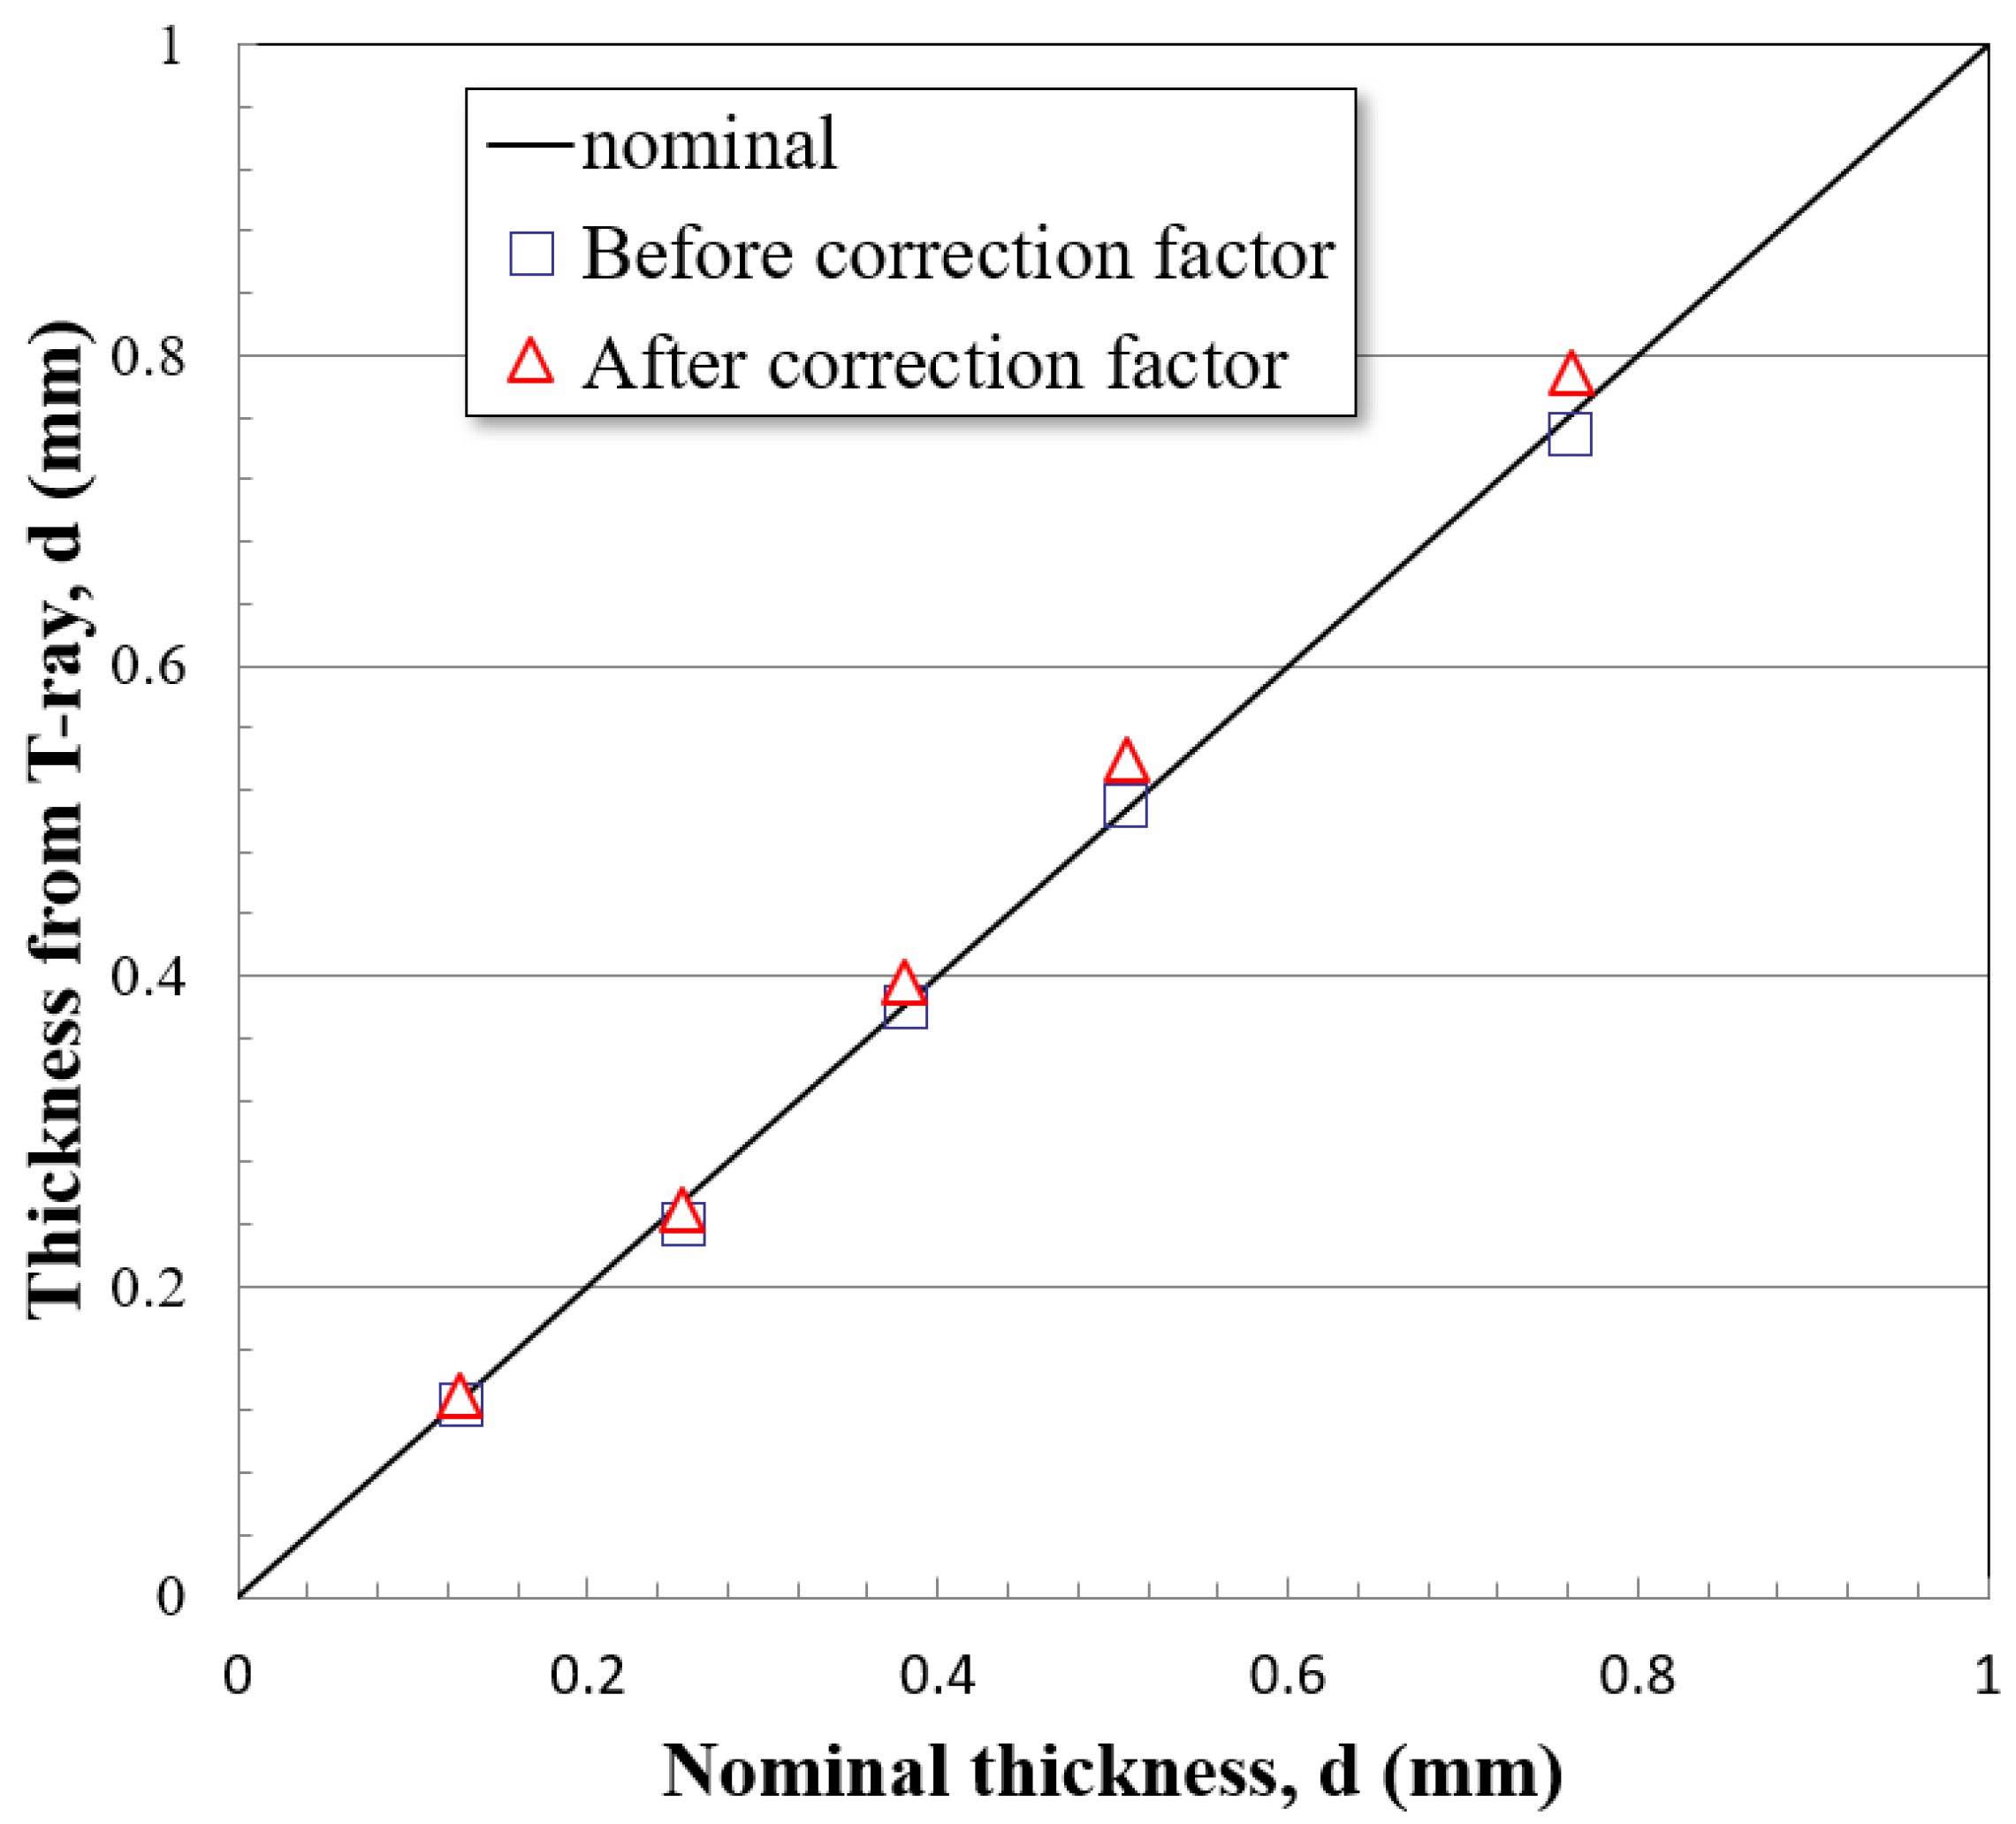
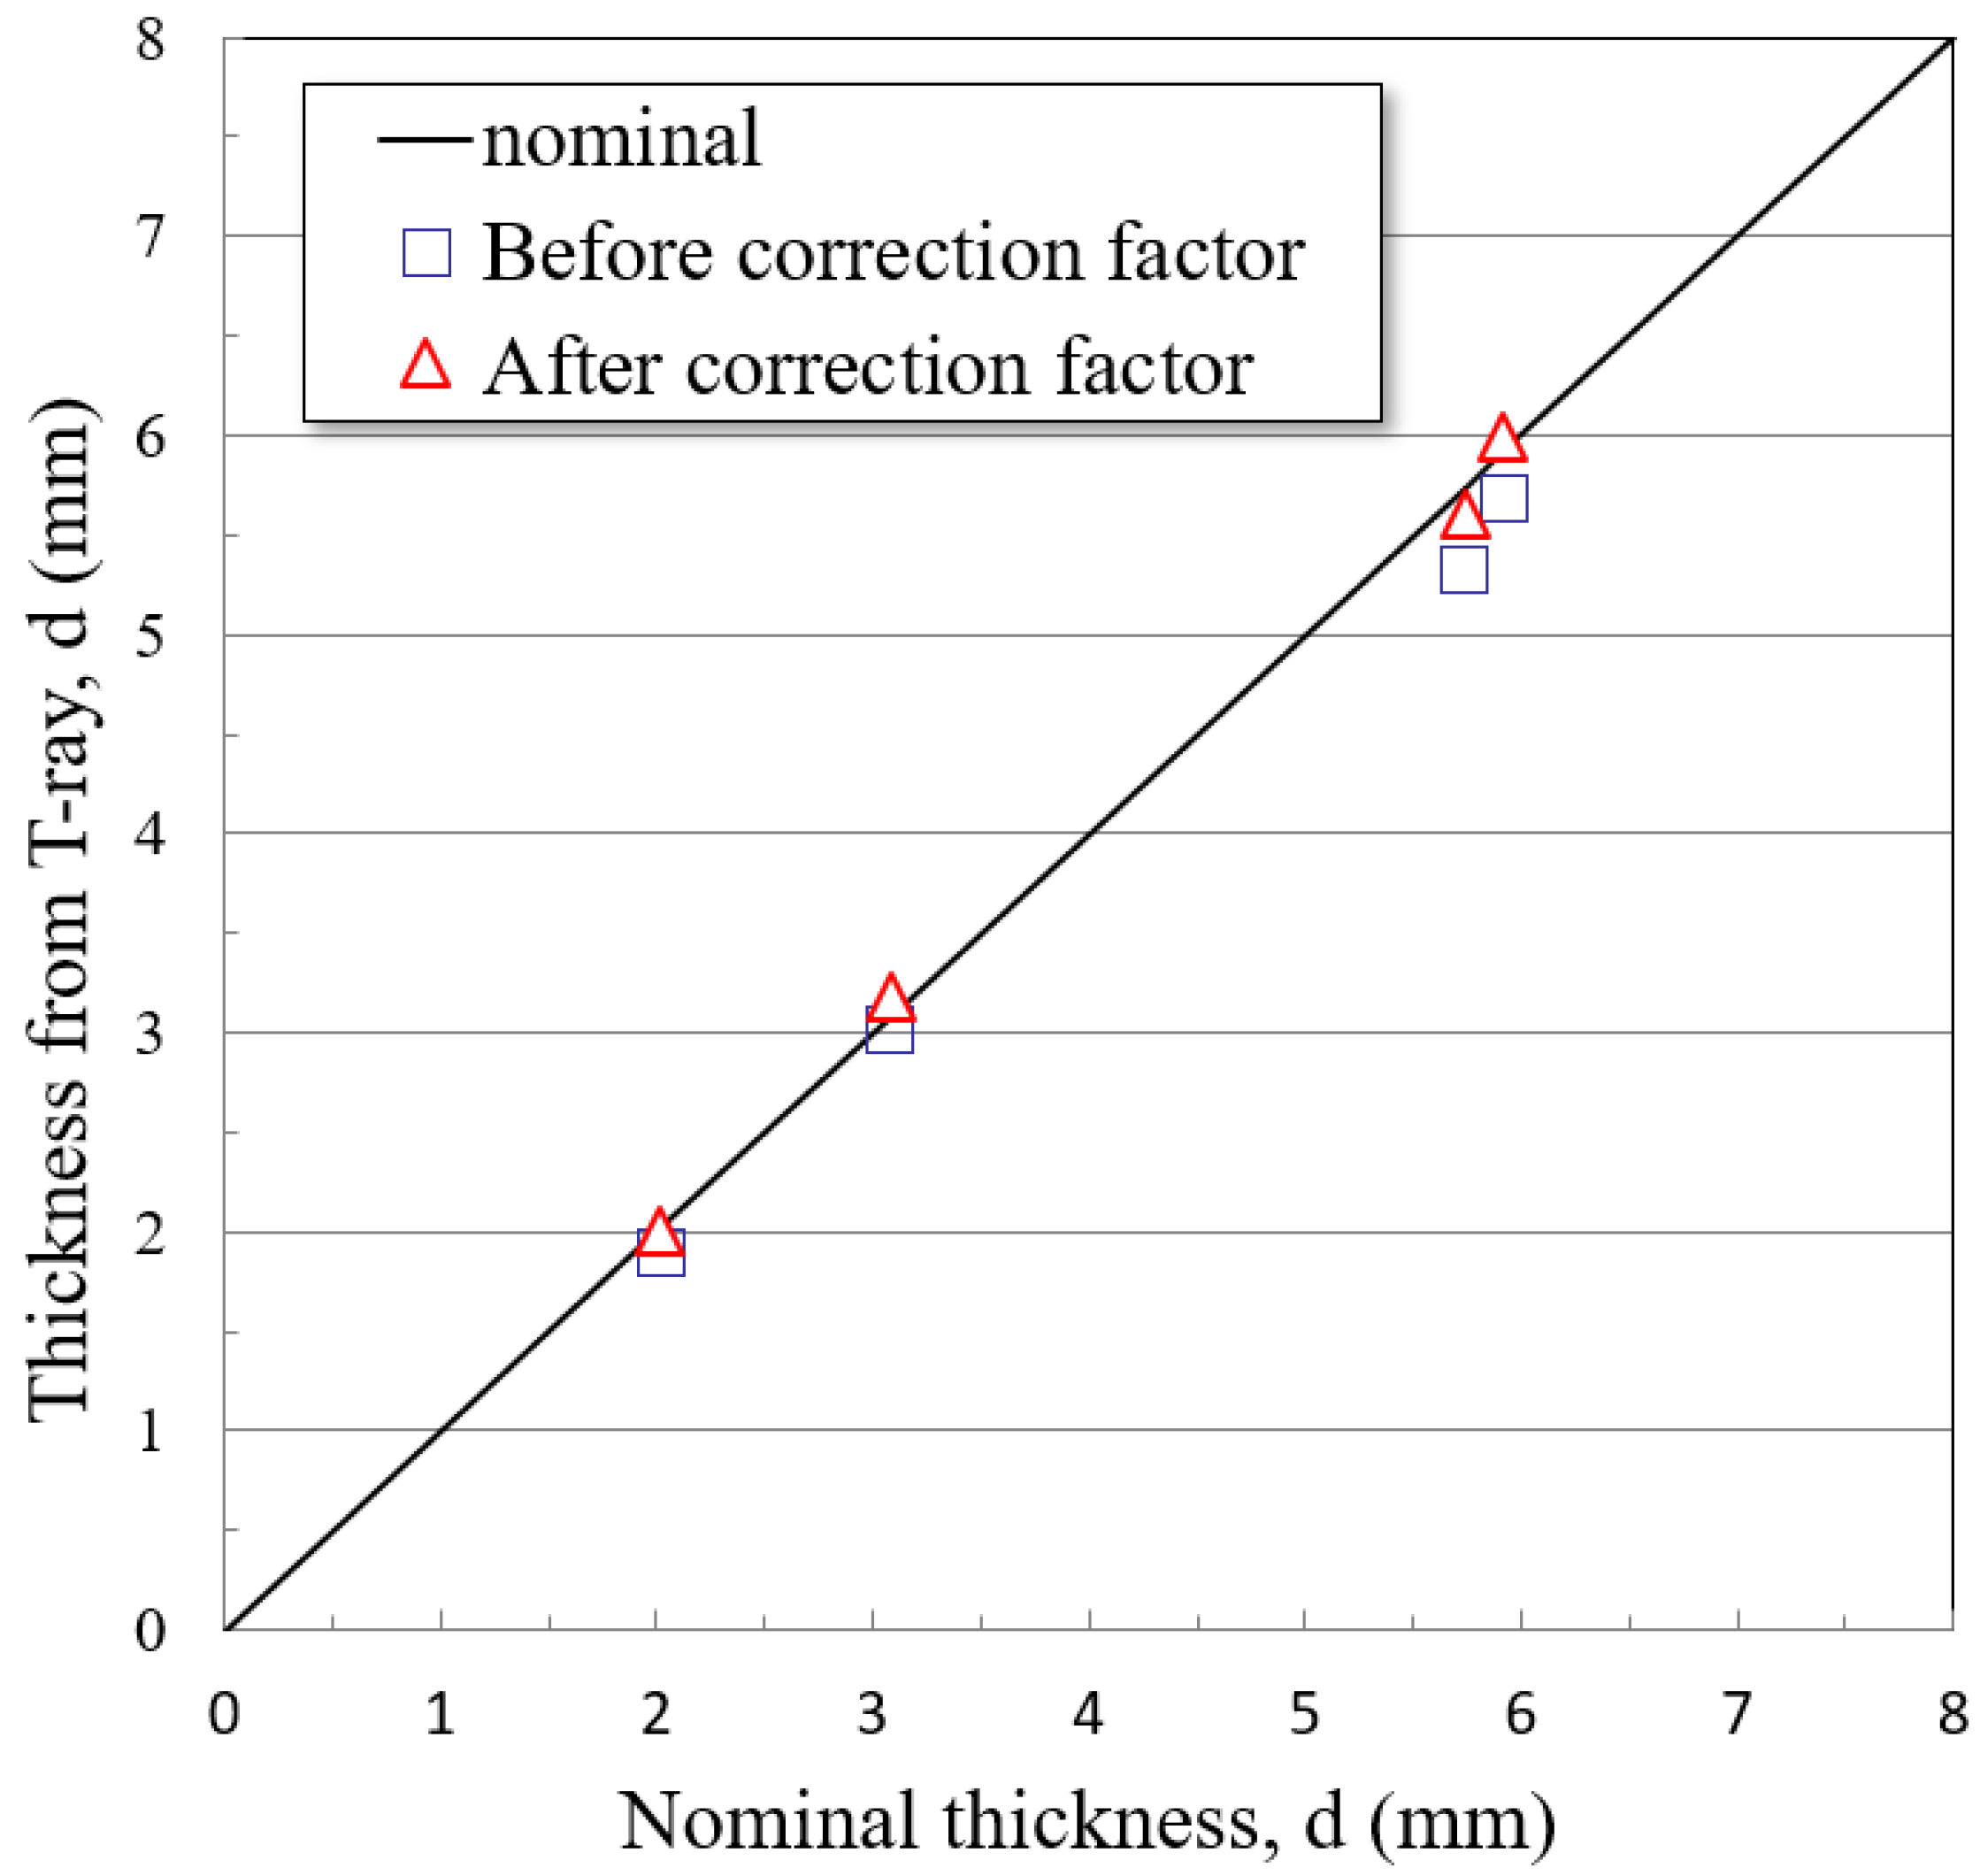
4.4. Relation between Nominal Thickness and Thickness Measured from T-ray Techniques
5. Conclusions
Author Contributions
Funding
Institutional Review Board Statement
Informed Consent Statement
Data Availability Statement
Conflicts of Interest
References
- Chiou, C.P.; Blackshire, J.L.; Thompson, R.B.; Hu, B.B. Terahertz Ray System Calibration and Material Characterzations. Rev. QNDE 2009, 28, 410–417. [Google Scholar]
- Im, K.H.; Lee, K.S.; Yang, I.Y.; Yang, Y.J.; Seo, Y.H.; Hsu, D.K. Advanced T-ray Nondestructive Evaluation of Defects in FRP Solid Composites. Int. J. Precis. Eng. Manuf. 2013, 14, 1093–1098. [Google Scholar] [CrossRef]
- Li, M.W.; Liang, C.P.; Zhang, Y.B.; Yi, Z.; Chen, X.F.; Zhou, Z.G.; Yang, H.; Tang, Y.J.; Yi, Y.G. Terahertz Wideband Perfect Absorber Based on Open Loop with Cross Nested Structure. Results Phys. 2019, 15, 102603. [Google Scholar] [CrossRef]
- Chunlian, C.; Zhang, Y.; Chen, X.; Yang, H.; Yi, Z.; Yao, W.; Tang, Y.; Yi, Y.; Wang, J.; Wu, P. A Dual-Band Metamaterial Absorber for Graphene Surface Plasmon Resonance at Terahertz Frequency. Phys. E Low-Dimens. Syst. Nanostruct. 2020, 117, 113840. [Google Scholar] [CrossRef]
- Zhang, Y.; Wu, P.; Zhou, Z.; Chen, X.; Yi, Z.; Zhu, J.; Zhang, T.; Jile, H. Study on Temperature Adjustable Terahertz Metamaterial Absorber Based on Vanadium Dioxide. IEEE Access 2020, 8, 85154–85161. [Google Scholar] [CrossRef]
- Im, K.-H.; Kim, S.-K.; Jung, J.-A.; Cho, Y.-T.; Woo, Y.-D.; Chiou, C.-P. NDE Detection Techniques and Characterization of Aluminum Wires Embedded in Honeycomb Sandwich Composite Panels Using Terahertz Waves. Materials 2019, 12, 1264. [Google Scholar] [CrossRef] [PubMed] [Green Version]
- Huber, R.; Brodschelm, A.; Tauser, A.; Leitenstorfer, A. Generation and Field-Resolved Detection of Femtosecond Electromagnetic Pulses Tunable up to 41 THz. Appl. Phys. Lett. 2000, 76, 3191–3199. [Google Scholar] [CrossRef]
- Rudd, J.V.; Mittleman, D.M. Influence of Substrate-Lens Design in Terahertz Time-Domain Spectroscopy. J. Opt. Soc. Am. B 2000, 19, 319–329. [Google Scholar] [CrossRef]
- Gregory, I.S.; Baker, C.; Tribe, W.; Bradley, I.V.; Evans, M.J.; Linfield, E.H. Optimization of Photomixers and Antennas for Continuous-Wave Terahertz Emission. IEEE J. Quantum Electron. 2000, 41, 717–728. [Google Scholar] [CrossRef] [Green Version]
- Brown, E.R.; Smith, F.W.; McIntosh, K.A. Coherent Millimeterwave Generation by Heterodyne Conversion in Low-Temperature-Grown GaAs Photoconductors. J. Appl. Phys. 1993, 73, 1480–1484. [Google Scholar] [CrossRef] [Green Version]
- Hsu, D.K.; Lee, K.S.; Park, J.W.; Woo, Y.D.; Im, K.H. NDE Inspection of Terahertz Waves in Wind Turbine Composites. Int. J. Precis. Eng. Manuf. 2012, 13, 1183–1189. [Google Scholar] [CrossRef]
- Hsu, D.K.; Hughes, M.S. Simultaneous Ultrasonic Velocity and Sample Thickness Measurement and Applications in Composites. J. Acoust. Soc. Am. 1992, 92, 669–675. [Google Scholar] [CrossRef]
- Brown, E.R.; McIntosh, K.A.; Nichols, K.B.; Dennis, C.L. Photomixing up to 3.8 THz in Low-Temperature-Grown GaAs. Appl. Phys. Lett. 1995, 66, 285–287. [Google Scholar] [CrossRef]
- Zhang, J.; Li, W.; Cui, H.L.; Shi, C.; Han, X.; Ma, Y.; Chen, J.; Chang, T.; Wei, D.; Zhang, Y.; et al. Nondestructive Evaluation of Carbon Fiber Reinforced Polymer Composites Using Reflective Terahertz Images. Sensors 2016, 16, 875. [Google Scholar] [CrossRef] [PubMed] [Green Version]
- Li, L.; Yang, W.; Shui, T.; Wang, X. Ultrasensitive Sizing Sensor for a Single Nanoparticle in a Hybrid Nonlinear Microcavity. IEEE Photonics J. 2020, 12, 1–8. [Google Scholar] [CrossRef]
- Wu, P.; Chen, Z.; Jile, H.; Zhang, C.; Xu, D.; Lv, L. An Infrared Perfect Absorber Based on Metal-Dielectric-Metal Multi-Layer Films with Nanocircle Holes Arrays. Results Phys. 2020, 16, 102952. [Google Scholar] [CrossRef]
- Schueler, R.; Joshi, S.P.; Schulte, K. Damage Detection in CFRP by Electrical Conductivity Mapping. Compos. Sci. Technol. 2001, 61, 921–930. [Google Scholar] [CrossRef]
- Hsu, D.K. Characterization of a Graphite/Epoxy Laminate by Electrical Resistivity Measurements. Rev. QNDE 1985, 4, 1219–1228. [Google Scholar]
- Tse, K.W.; Moyer, C.A.; Arajs, S. Electrical Conductivity of Graphite Fiber epoxy Resin Composites. Mater. Sci. Eng. 1981, 49, 41–46. [Google Scholar] [CrossRef]


| Materials | Refractive Index (n) * | Refractive Index (n) |
|---|---|---|
| Reflection Mode | ||
| PMMA | 1.60 ± 0.08 | 1.59 ± 0.07 |
| Shim Stock films | - | 1.52 ± 0.03 |
| Fused quartz | 1.95 ± 0.05 | 1.94 ± 0.09 |
| GFRP | - | 2.17 ± 0.05 |
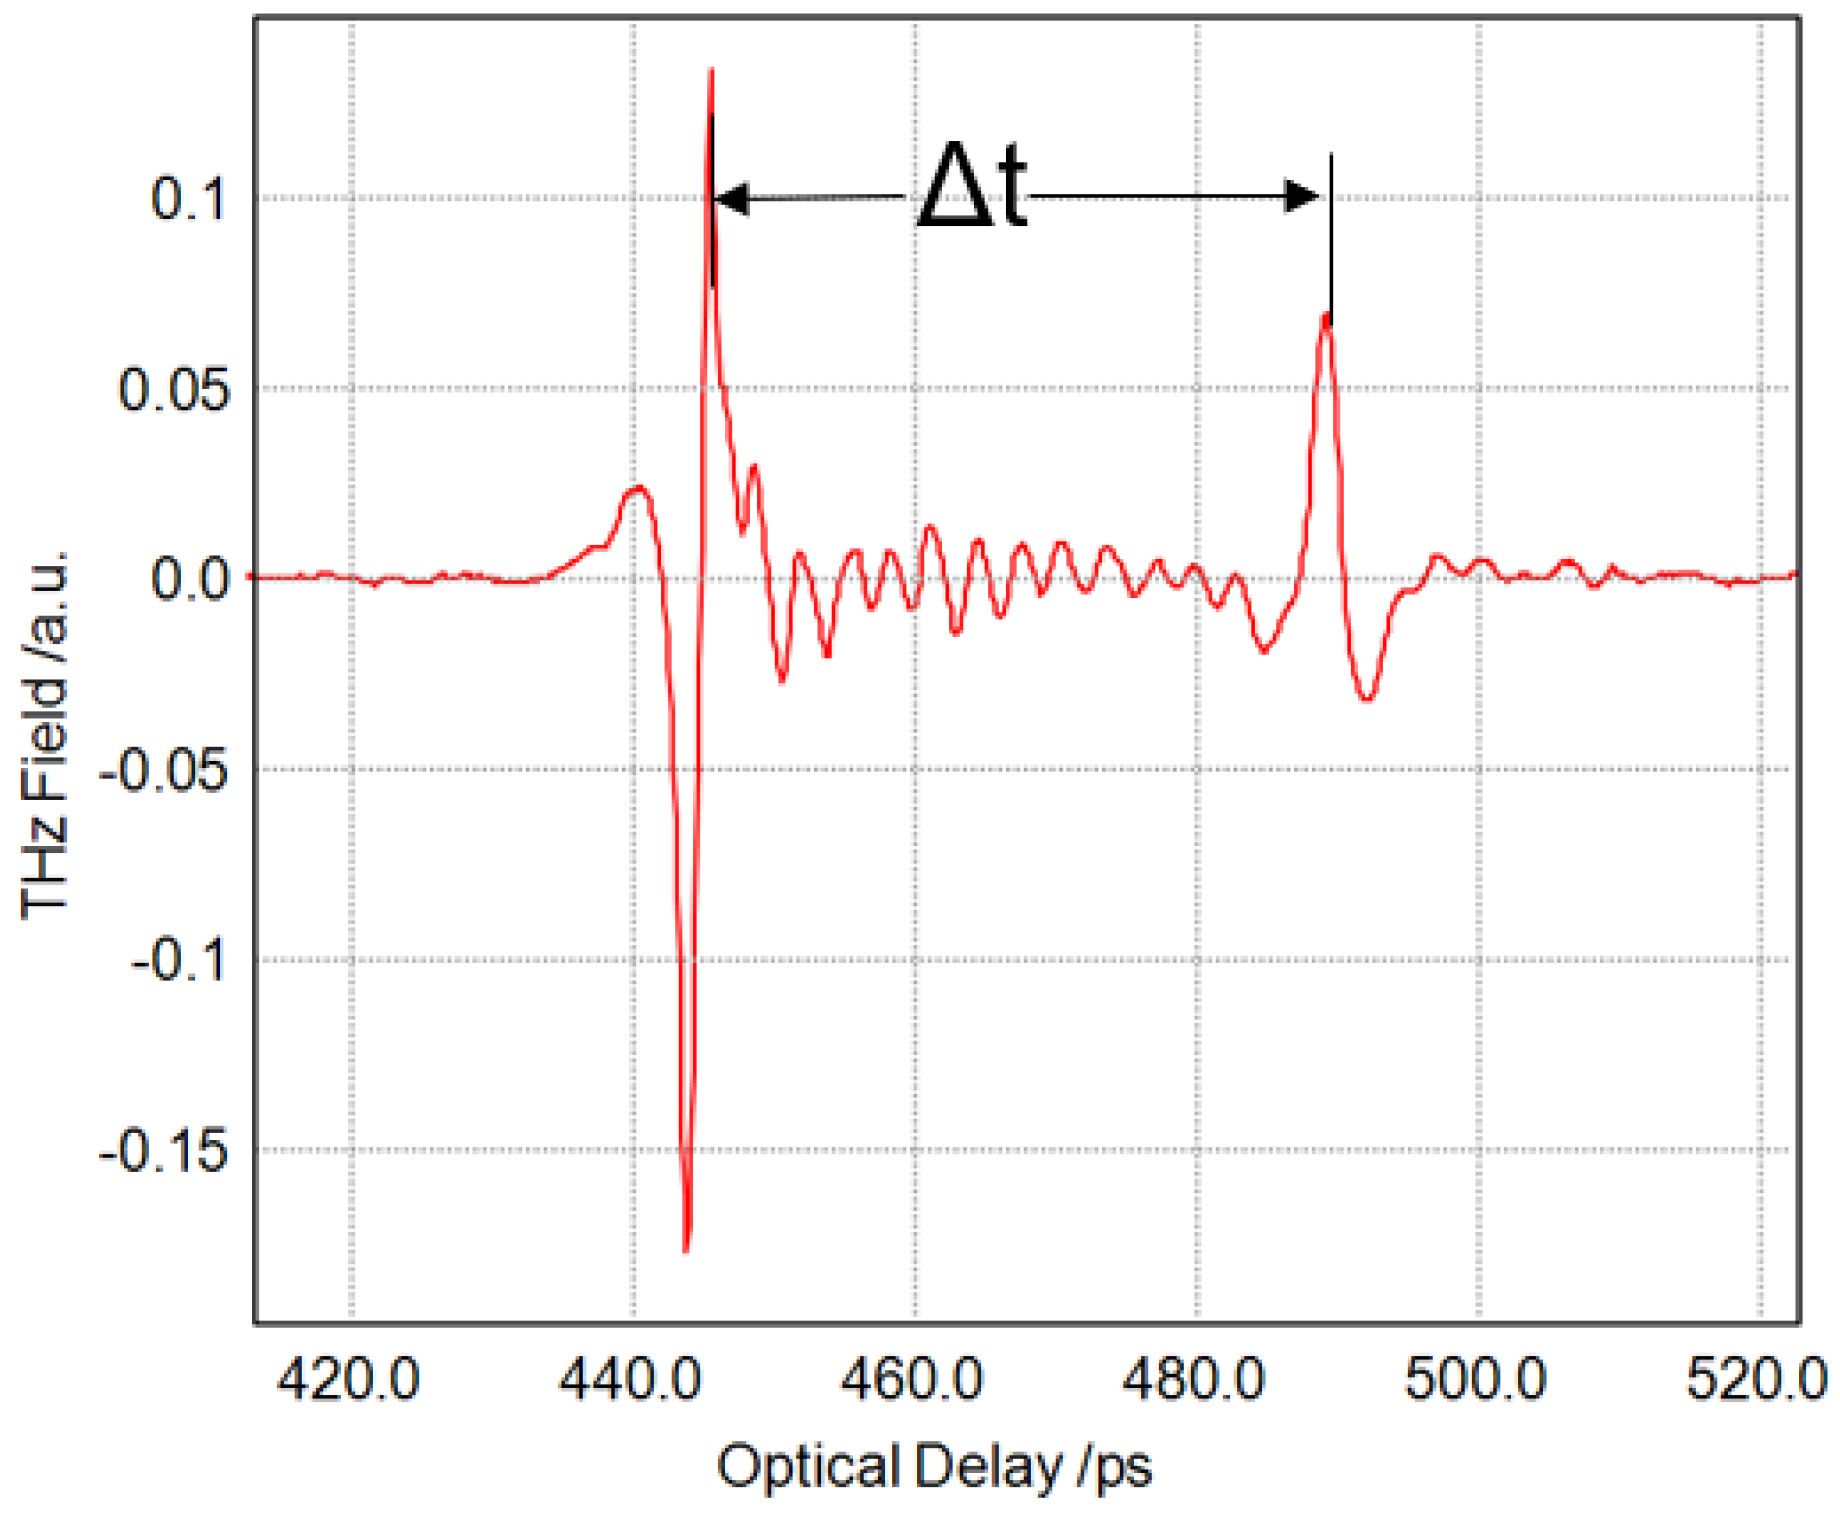
| Sample No. | Delay Time (Δt, ps) | Resonance Frequency (Δf) | T-ray Measure ment (mm) | Reference Thickness (mm) | Others |
|---|---|---|---|---|---|
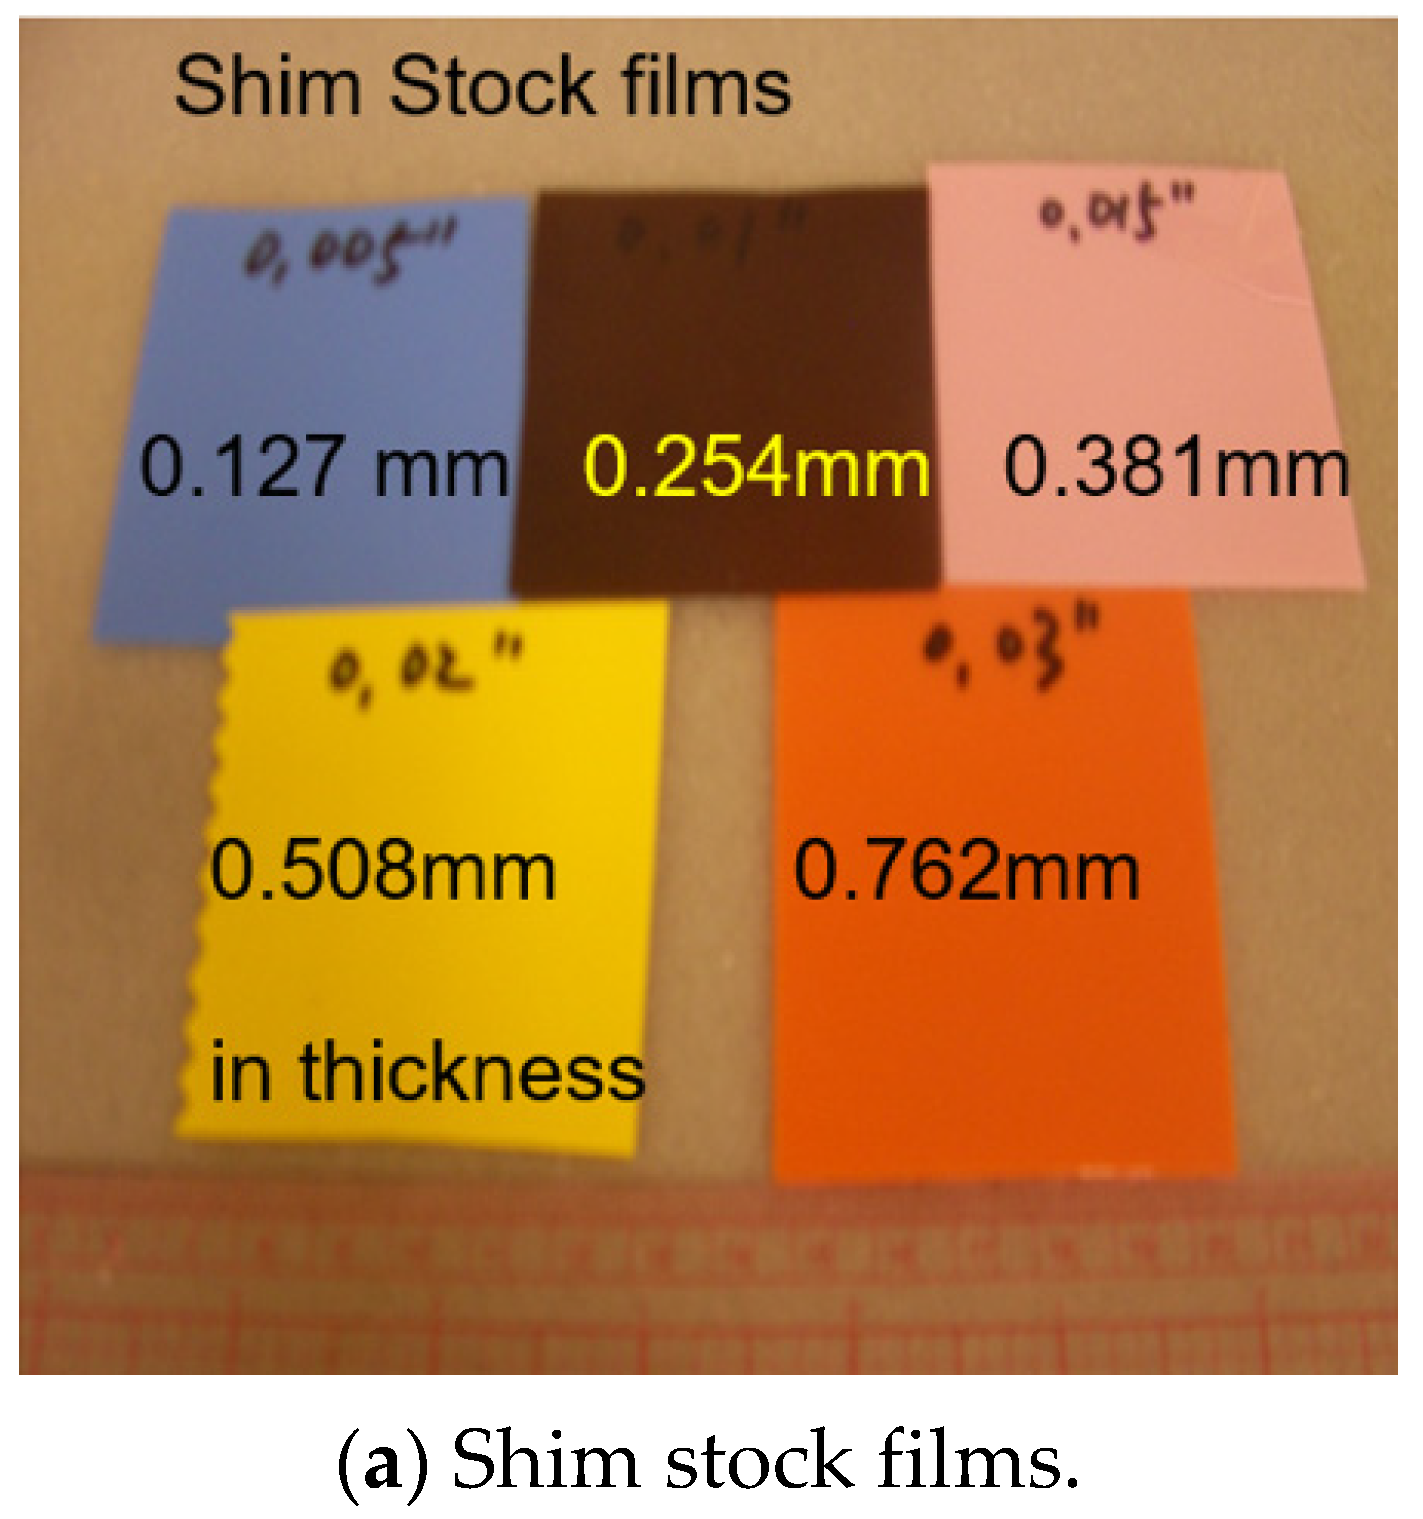
| 1 | 1.322 | 0.750 | 0.137 | 0.127 | Shim stock Co., Ltd. (Edenvale, South Africa) |
| 2 | 2.551 | 0.392 | 0.250 | 0.254 | |
| 3 | 3.846 | 0.260 | 0.396 | 0.381 | |
| 4 | 5.881 | 0.170 | 0.539 | 0.508 | |
| 5 | 8.600 | 0.115 | 0.789 | 0.762 |
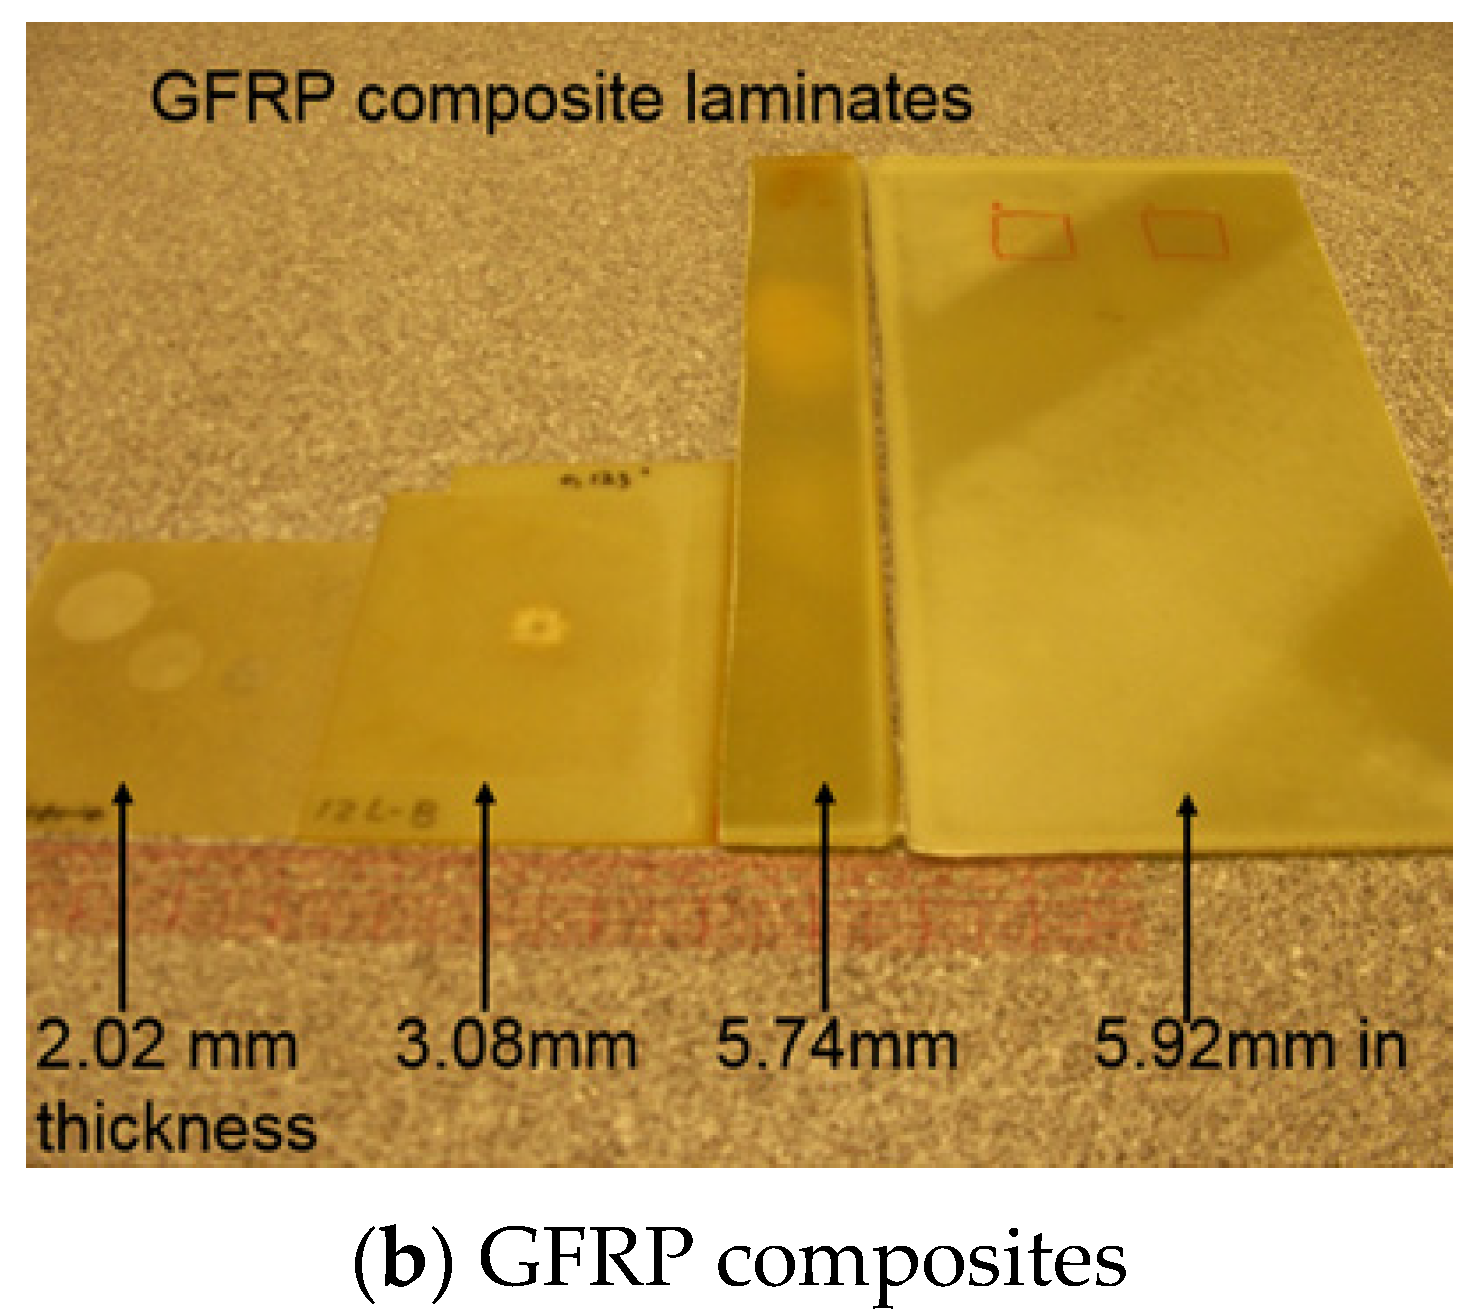
| Sample No. | Delay Time (Δt, ps) | Resonance Frequency (Δf) | T-ray Measurement (mm) | Reference Thickness (mm) | Others |
|---|---|---|---|---|---|
| 1 | 24.480 | 0.041 | 2.000 | 2.020 | Shim Stock Co., Ltd. |
| 2 | 50.000 | 0.020 | 3.180 | 3.080 | |
| 3 | 75.130 | 0.013 | 5.600 | 5.740 | |
| 4 | 83.30 | 0.012 | 5.920 | 5.920 |
Publisher’s Note: MDPI stays neutral with regard to jurisdictional claims in published maps and institutional affiliations. |
© 2021 by the authors. Licensee MDPI, Basel, Switzerland. This article is an open access article distributed under the terms and conditions of the Creative Commons Attribution (CC BY) license (https://creativecommons.org/licenses/by/4.0/).
Share and Cite
Im, K.-H.; Kim, S.-K.; Cho, Y.-T.; Woo, Y.-D.; Chiou, C.-P. THz-TDS Techniques of Thickness Measurements in Thin Shim Stock Films and Composite Materials. Appl. Sci. 2021, 11, 8889. https://doi.org/10.3390/app11198889
Im K-H, Kim S-K, Cho Y-T, Woo Y-D, Chiou C-P. THz-TDS Techniques of Thickness Measurements in Thin Shim Stock Films and Composite Materials. Applied Sciences. 2021; 11(19):8889. https://doi.org/10.3390/app11198889
Chicago/Turabian StyleIm, Kwang-Hee, Sun-Kyu Kim, Young-Tae Cho, Yong-Deuck Woo, and Chien-Ping Chiou. 2021. "THz-TDS Techniques of Thickness Measurements in Thin Shim Stock Films and Composite Materials" Applied Sciences 11, no. 19: 8889. https://doi.org/10.3390/app11198889
APA StyleIm, K.-H., Kim, S.-K., Cho, Y.-T., Woo, Y.-D., & Chiou, C.-P. (2021). THz-TDS Techniques of Thickness Measurements in Thin Shim Stock Films and Composite Materials. Applied Sciences, 11(19), 8889. https://doi.org/10.3390/app11198889