1. Introduction
Welding residual stresses can have a crucial influence on the crack resistance of a steel component under service load. It was found that phase transformations during the cooling of the weld seam can have a significant influence on the residual stresses around the weld seam. Therefore, it is advantageous to control such phase transformations during cooling to minimize residual stresses and consequently improve the crack resistance of the welds [
1]. Compressive residual stresses can thereby have a positive influence on crack prevention. A unique possibility of generating compressive residual stresses already during the welding procedure is offered by so-called low transformation temperature (LTT) filler wires [
2,
3,
4]. Compared to conventional filler wires, these materials show lower phase transformation temperatures, which can work against the cooling-specific contraction. In consequence, distinct compressive residual stresses can be observed within the weld and adjacent areas.
The use of neutrons allows for examining samples with thicknesses in the cm-range, e.g., for measuring residual stresses around weld seams by neutron diffraction [
5,
6], or for visualizing grain orientations by tomographic neutron diffraction imaging [
7,
8]. Another imaging technique based on diffraction contrast is neutron Bragg-edge imaging (NBEI). This technique allows the acquisition of monochromatic images at distinct wavelengths. Depending on the crystalline structure of the measured material, sudden transmission intensity changes, so-called Bragg edges, occur at wavelength positions λ equal to twice the lattice plane distances d
hkl in polycrystalline samples, as stated by Bragg’s law (Equation (1)), considering the transmission geometry with θ = 90°. Hence, taking radiographic images before and after a Bragg edge achieves a contrast, which relates to the crystallographic properties:
NBEI was already used by our team for visualizing the γ-austenite to α’-martensite phase transformation, where a super martensitic stainless steel sample was heated until complete austenitization and was subsequently cooled down to room temperature. The phase transformation process was visualized by acquiring the transmission images of a specific wavelength with a temporal resolution of 30 s and a spatial resolution of 100 µm [
9].
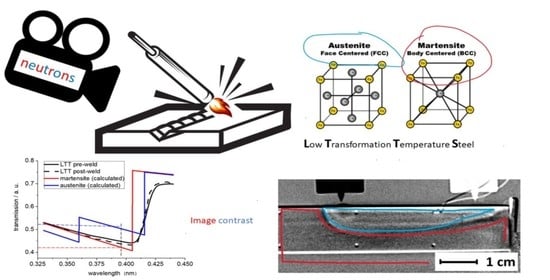
In the present study, the aim was to film for the first time in situ the phase transformation of an LTT steel induced by bead-on-plate GTAW. Therefore, we used neutron imaging to visualize the sample remelting during the welding process using specific neutron wavelengths to two-dimensionally visualize the phase transformations in the samples. Additionally, some weldments were filmed using a polychromatic neutron beam.
2. Materials and Methods
The experiments were carried out at the Cold Neutron RADiography 2 (CONRAD 2) instrument located at the research reactor BER II of the Helmholtz-Zentrum Berlin für Materialien und Energie [
10]. The imaging set-up consists of the sample holder system and the welding torch located approx. 10 cm in front of a 200 µm thick
6LiF:ZnS scintillator. The scintillator converts the transmitted neutrons into visible light and a mirror reflects the visible light image of the sample out of the neutron beam and towards a high-sensitive CCD camera with magnifying optics. A double-crystal monochromator allows the adjustment of the neutron wavelength in the range between 0.2 nm and 0.6 nm with a resolution of Δλ/λ ≈ 3%. More technical information regarding the CONRAD 2 instrument can be found elsewhere [
11].
The material used was LTT martensitic steel. The sample sheets were made by build-up welding using LTT steel wire and subsequent machining to achieve plates of the required dimensions. The sample dimensions in length, width, height are 100 mm, 5 mm, 13 mm, where the width of 5 mm was the penetration length for the neutrons.
The microstructure consists mainly of cellular martensite in rows because of the build-up welding process. The primary solidification state of the LTT steel was austenitic. Micrographs showed that some retained austenite can be found as a fine network in the microstructure due to segregation effects of Ni and Cr. The martensite transformation temperature for this LTT steel upon cooling is M
s ≈ 250 °C and the transformation is finalized at around M
f ≈ 80 °C. The chemical composition of the LTT steel is given in
Table 1. The composition was measured by spark emission spectroscopy with a relative measurement error of Δc/c ≈ 10%.
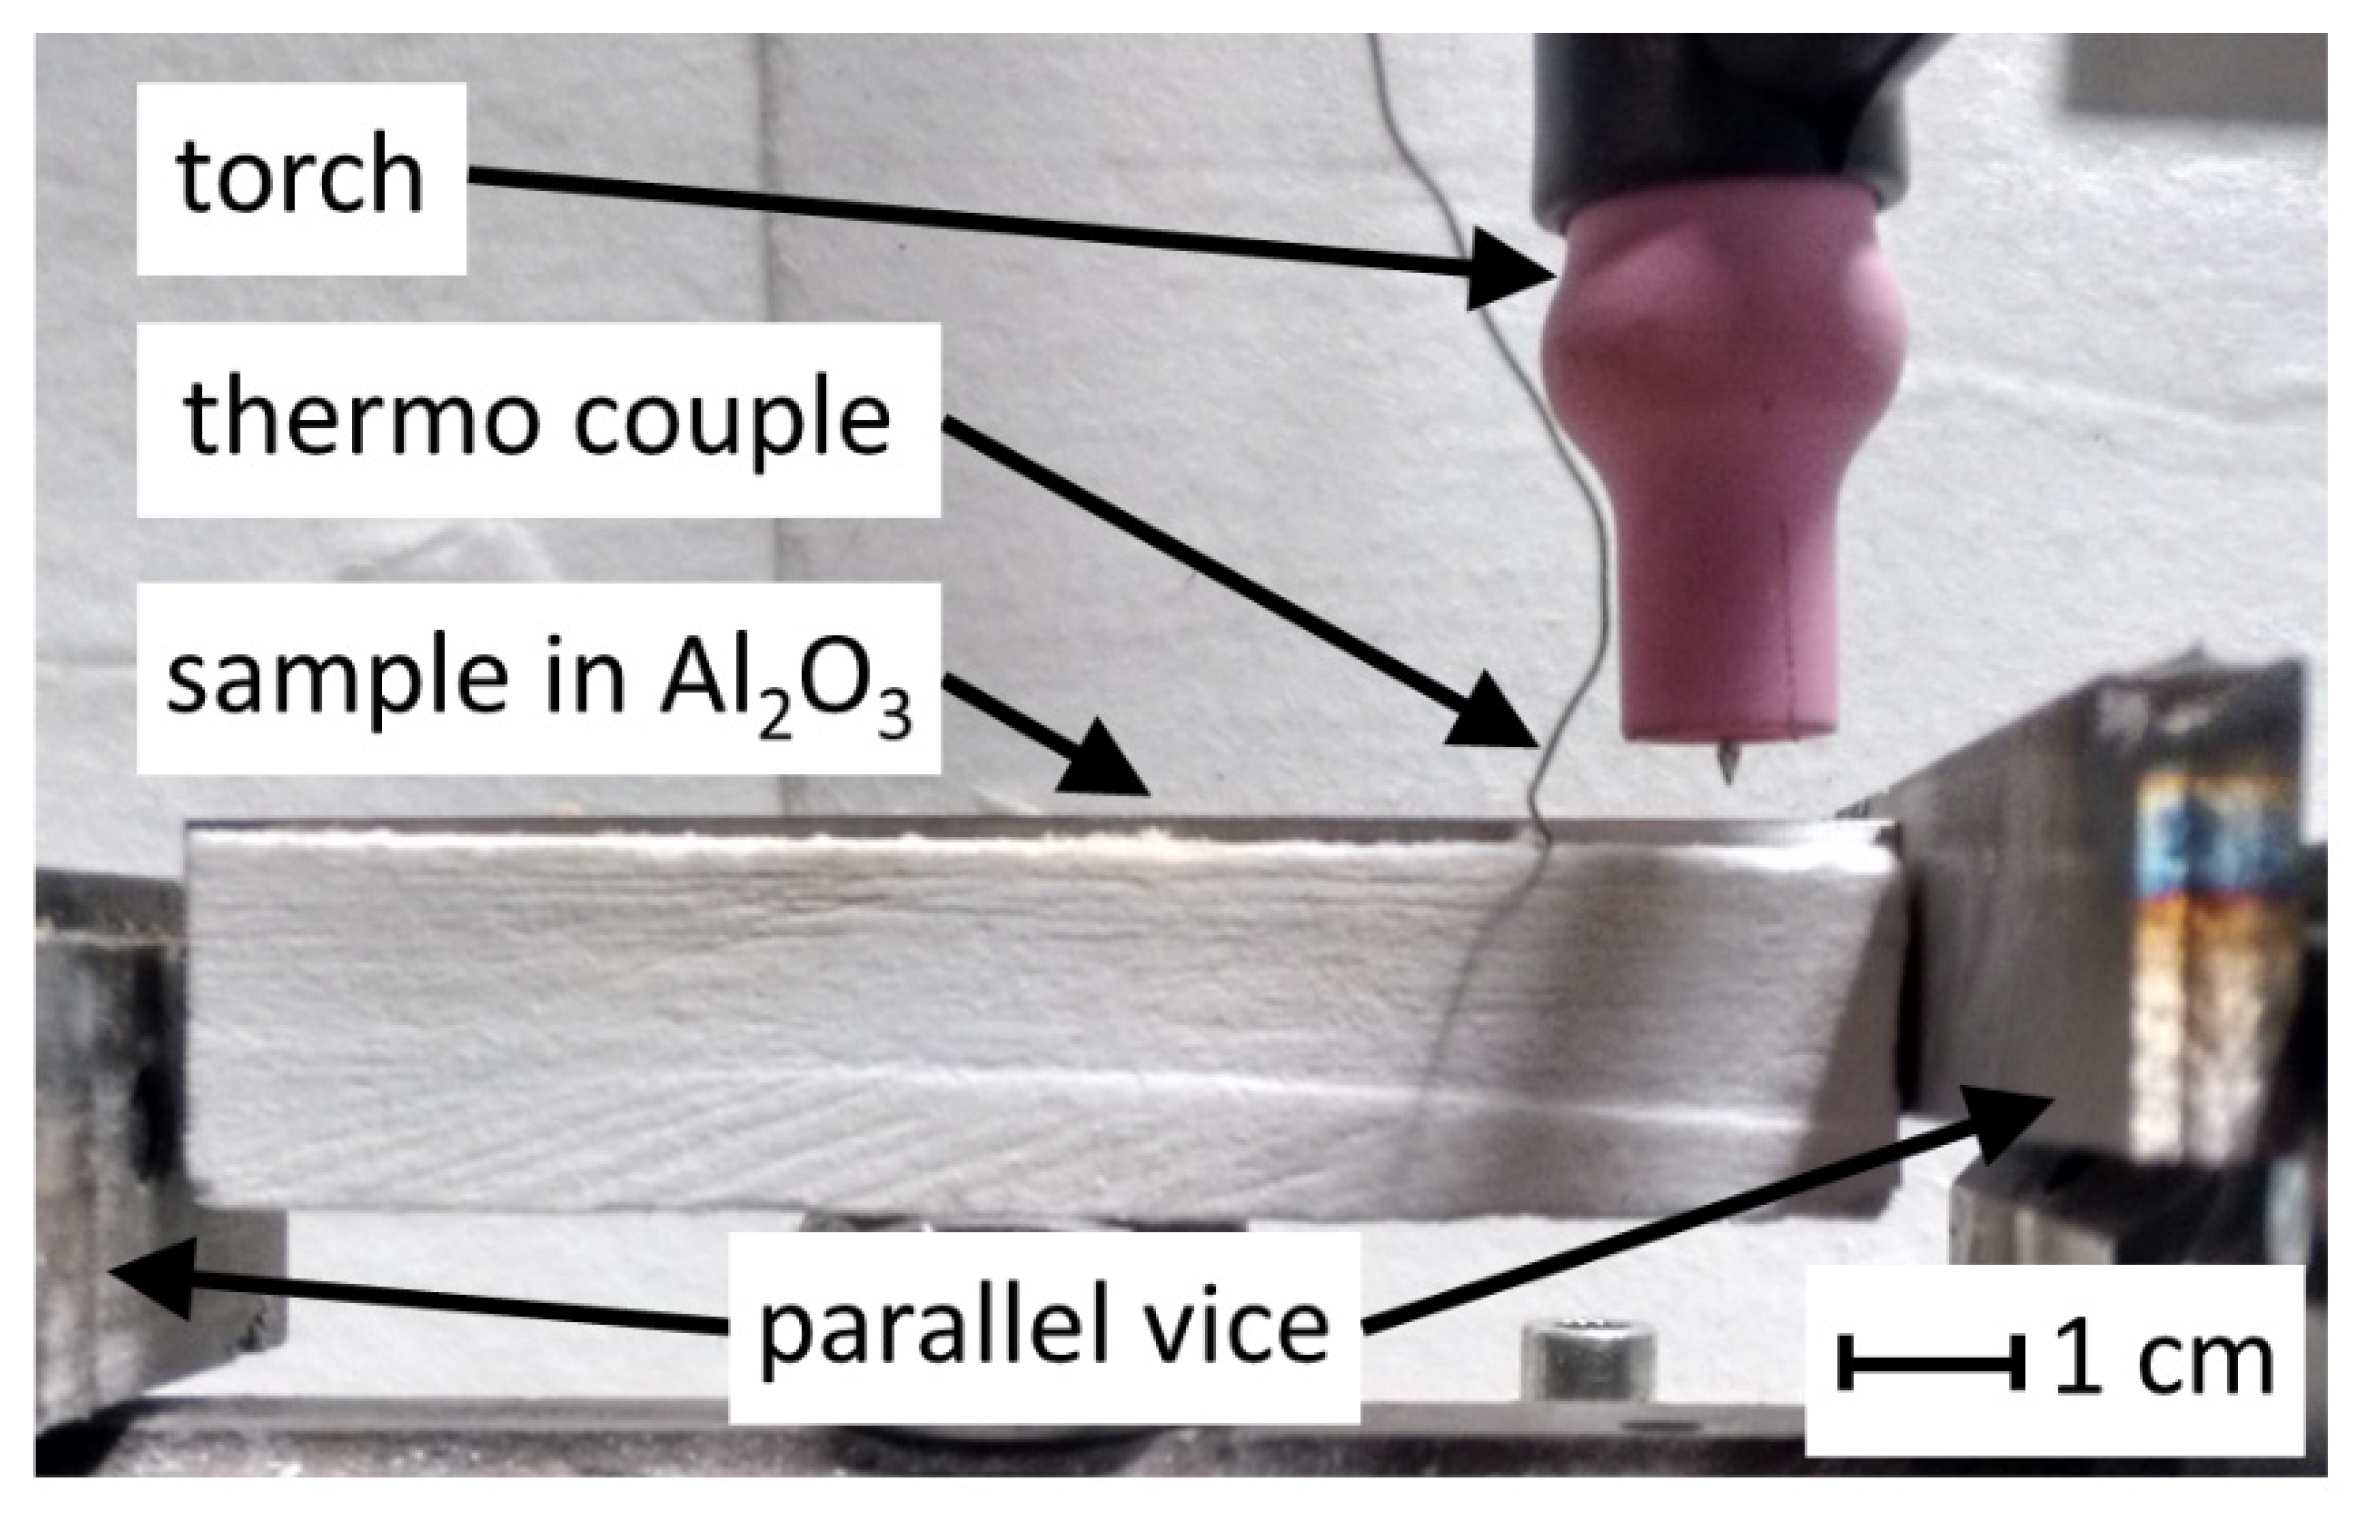
A type K thermocouple covered by Inconel™ sheathing was positioned in the sample side 2 mm below the surface and 20 mm behind the starting point of welding (see
Figure 1). The temperature was monitored during the complete welding process.
The scintillator in the background is also protected against weld spatter by alumina felt, which is almost transparent for neutrons. Welding direction is from right to left.
Gas tungsten arc welding (GTAW) was used to perform remote-controlled bead-on-plate welds with argon as a shielding gas. The arc welding power source used was a Castolin CastoTIG 1611 DC. The welding length for each parameter set was 45 mm, which allowed for four weldments per sample (two on each side). The set-up is shown in
Figure 1. The used welding parameters together with the respective imaging parameters are listed in
Table 2. The energy input could be controlled by varying both the welding current and the welding velocity.
The welding experiments were performed twice, each time with a different neutron wavelength as shown in
Table 2. To obtain good contrast between the austenitic and martensitic crystallographic phases, a neutron wavelength of λ = 0.395 nm was used. This wavelength has been defined by performing a wavelength scan using the original set-up.
Although the monochromatic imaging allowed the recording of the phase transformation step by step, the needed exposure time of t = 2 s to gain a reasonable signal-to-noise ratio allowed only for a few frames per weldment. To prolong the cooling state and thus gain more images during the phase transformation of austenite to martensite, the cooling rate was reduced by thermal isolation of the samples. For comparison, some weldments were also filmed using a polychromatic beam that allowed the recording of images continuously with an exposure time of t = 0.5 s.
In the preprocessing step of the image analysis, the acquired images were normalized by background and flat-field corrections, which is standard procedure in quantitative X-ray and neutron radiography [
12]. In order to eliminate the attenuation of the ceramic insulation and to further enhance the contrast inside the sample, each image series was normalized by dividing a complete series by its first image. Thus, a transmission value of “1” means a fully transparent sample, whereas “0” means no transmission of neutrons through the sample. The very short exposure times of 0.5 s for the polychromatic images led to the very low signal-to-noise ratio of the data. This ratio could be further improved by applying a sliding median filter using a set of three images for each welding experiment image series.
3. Results
3.1. Ex Situ Monochromatic Imaging
The result of NBEI wavelength scans prior to and after welding with a current of 60A at a welding speed of 5 cm/min is shown in
Figure 2.
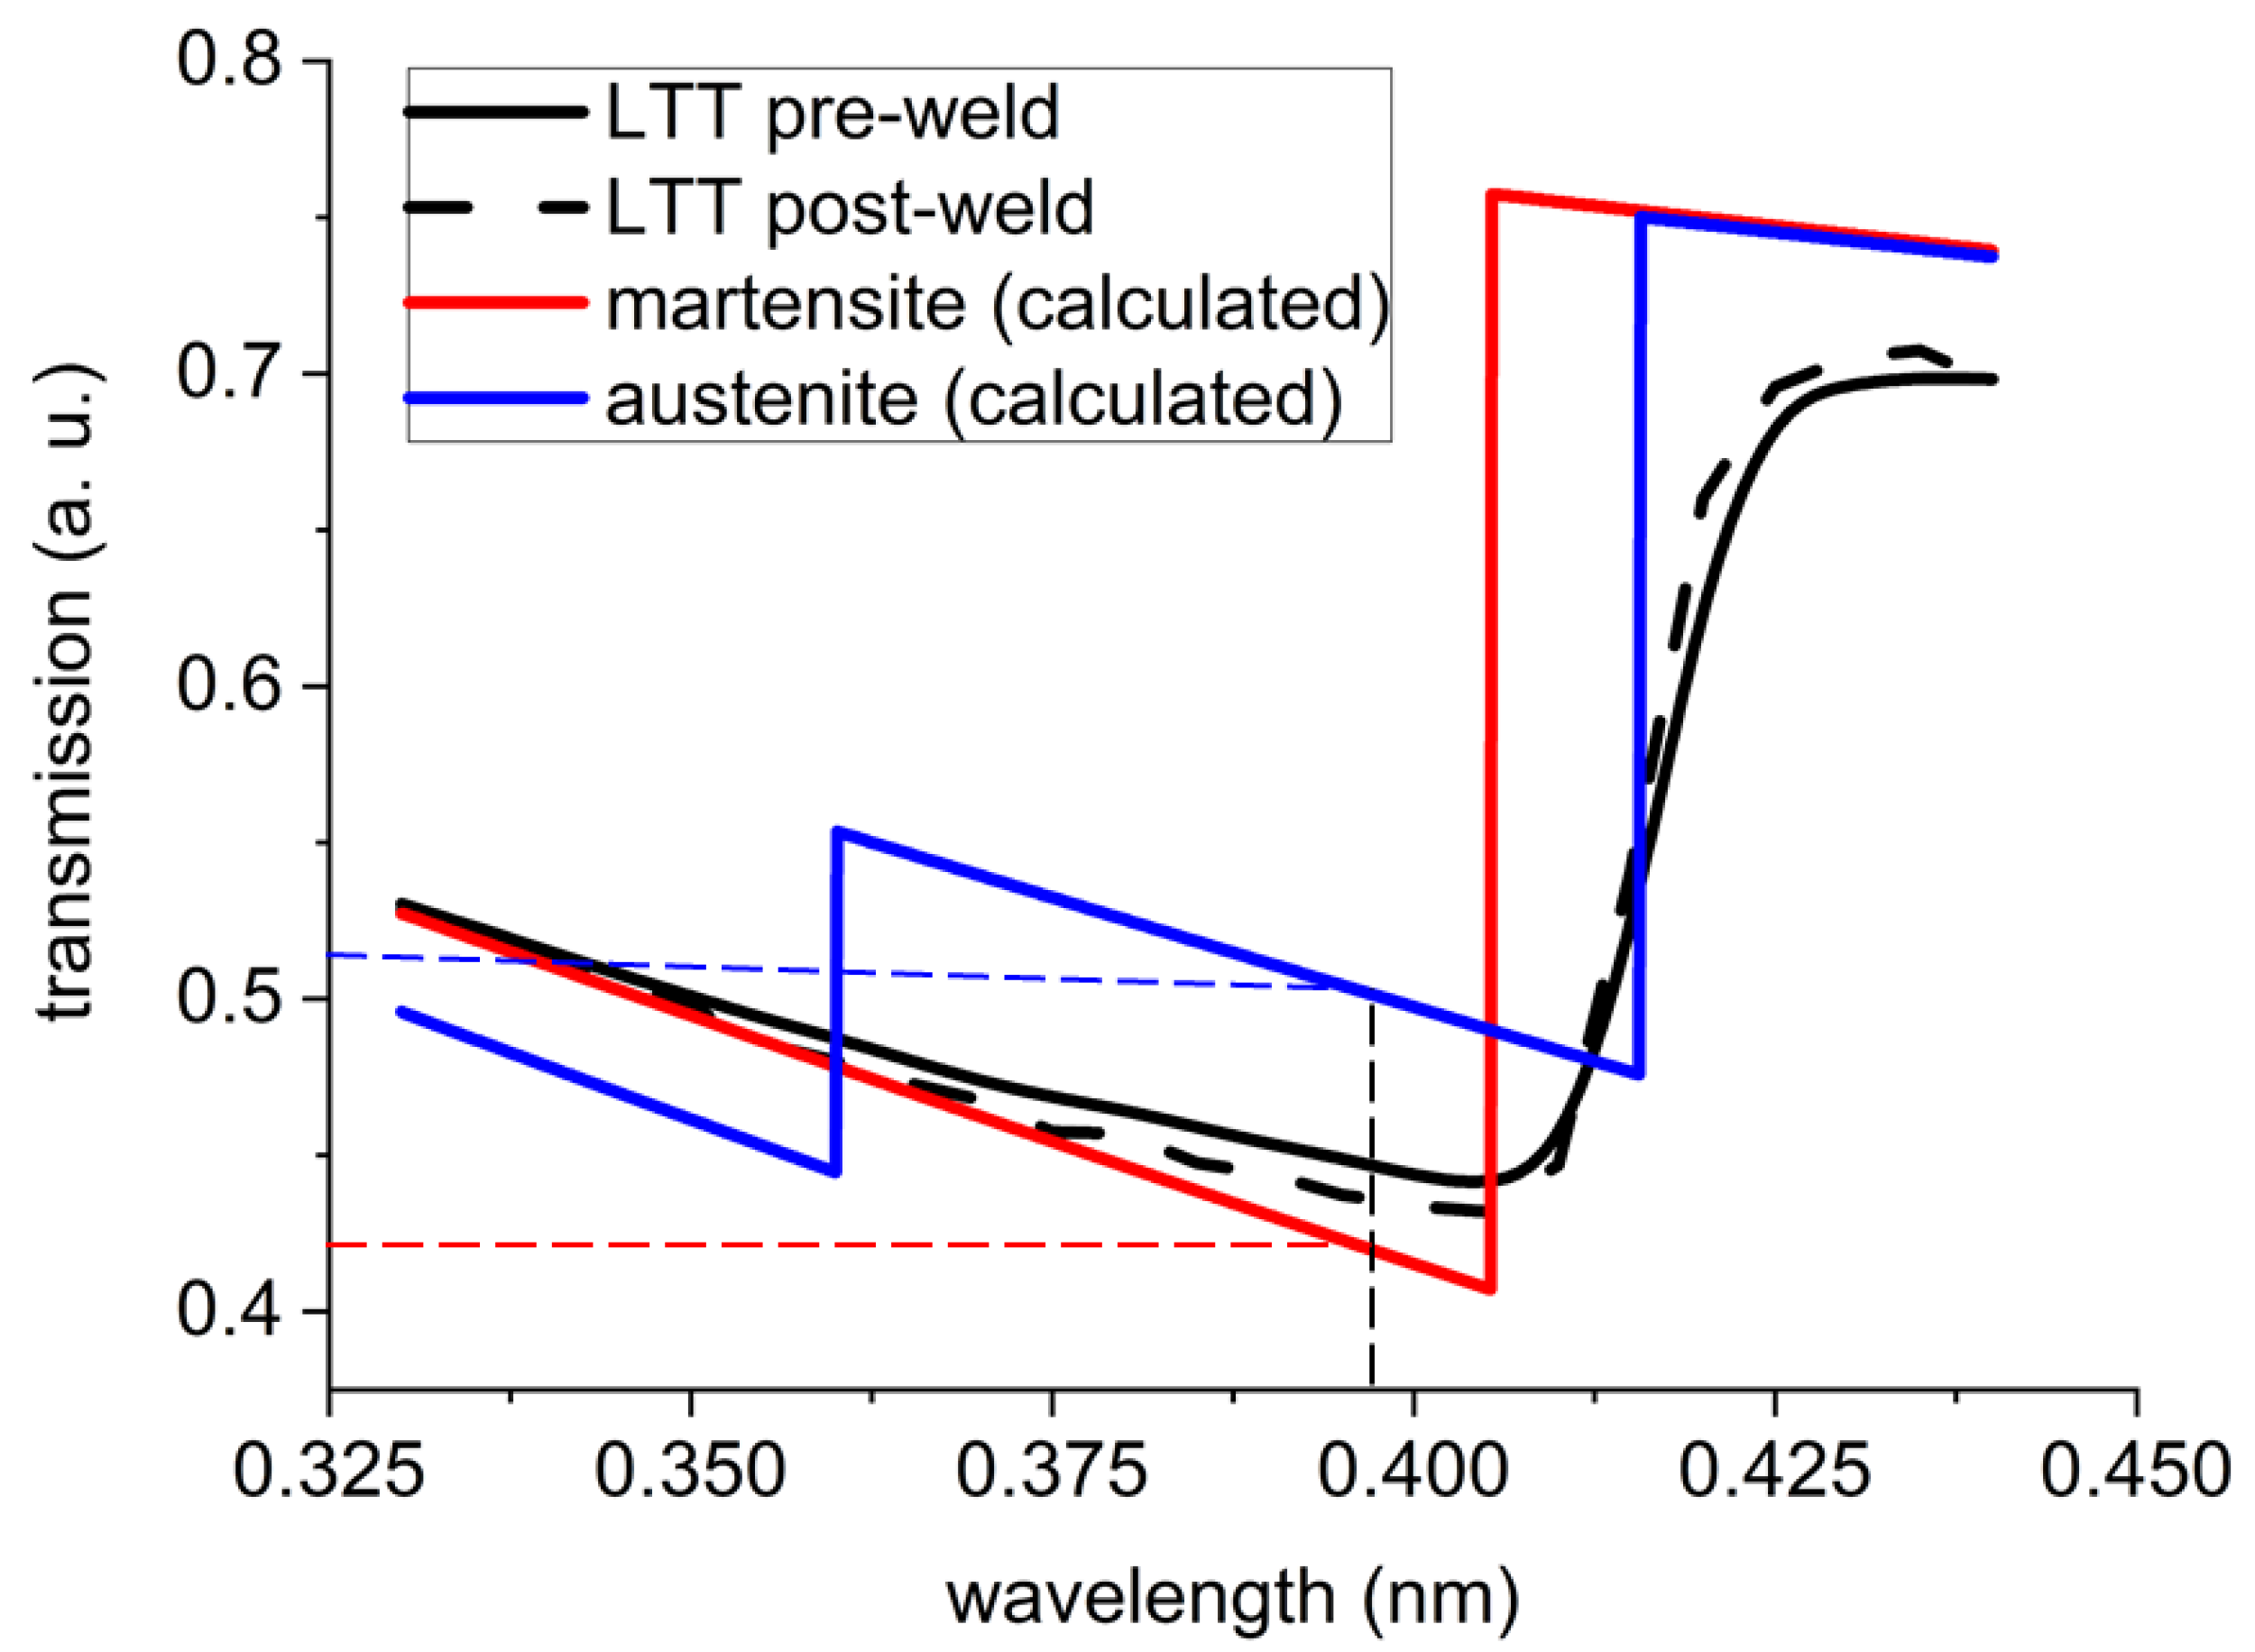
The almost identical black curves measured before and after the welding clearly show that the sample transformed back after welding into martensite. This finding is further supported by the missing austenite Bragg edge at around 0.36 nm in both cases. Additionally, retained austenite could not be detected at grain boundaries by light microscopy in micrographs of the welded samples. This clearly indicates that only a very small volume portion of retained austenite, if any, remains in the sample.
The shift of both measured curves towards higher wavelengths with respect to the calculated martensite Bragg edge at λ ≈ 0.405 nm by about Δλ ≈ 0.012 nm can be related to a slight miscalibration of the setup because there is experimental evidence from experiments of other groups using other materials but the same imaging set-up for such a systematic wavelength shift [
14].
3.2. In Situ Monochromatic Imaging
As shown in
Figure 2, martensite and austenite have different attenuation coefficients in the wavelength interval between approx. 0.36 nm and 0.405 nm just below the Bragg-edge wavelengths of both phases. Although the difference of both attenuation coefficients is not as large as for the coefficients between both Bragg edges, a wavelength in this interval is used for monochromatic imaging due to the abovementioned limits of the experimental wavelength resolution. Thus, we present here the result of monochromatic imaging during GTAW at 0.395 nm for the visualization of the phase transformations. For comparison, we additionally measured after the Bragg edge at 0.44 nm using the same welding and imaging parameter.
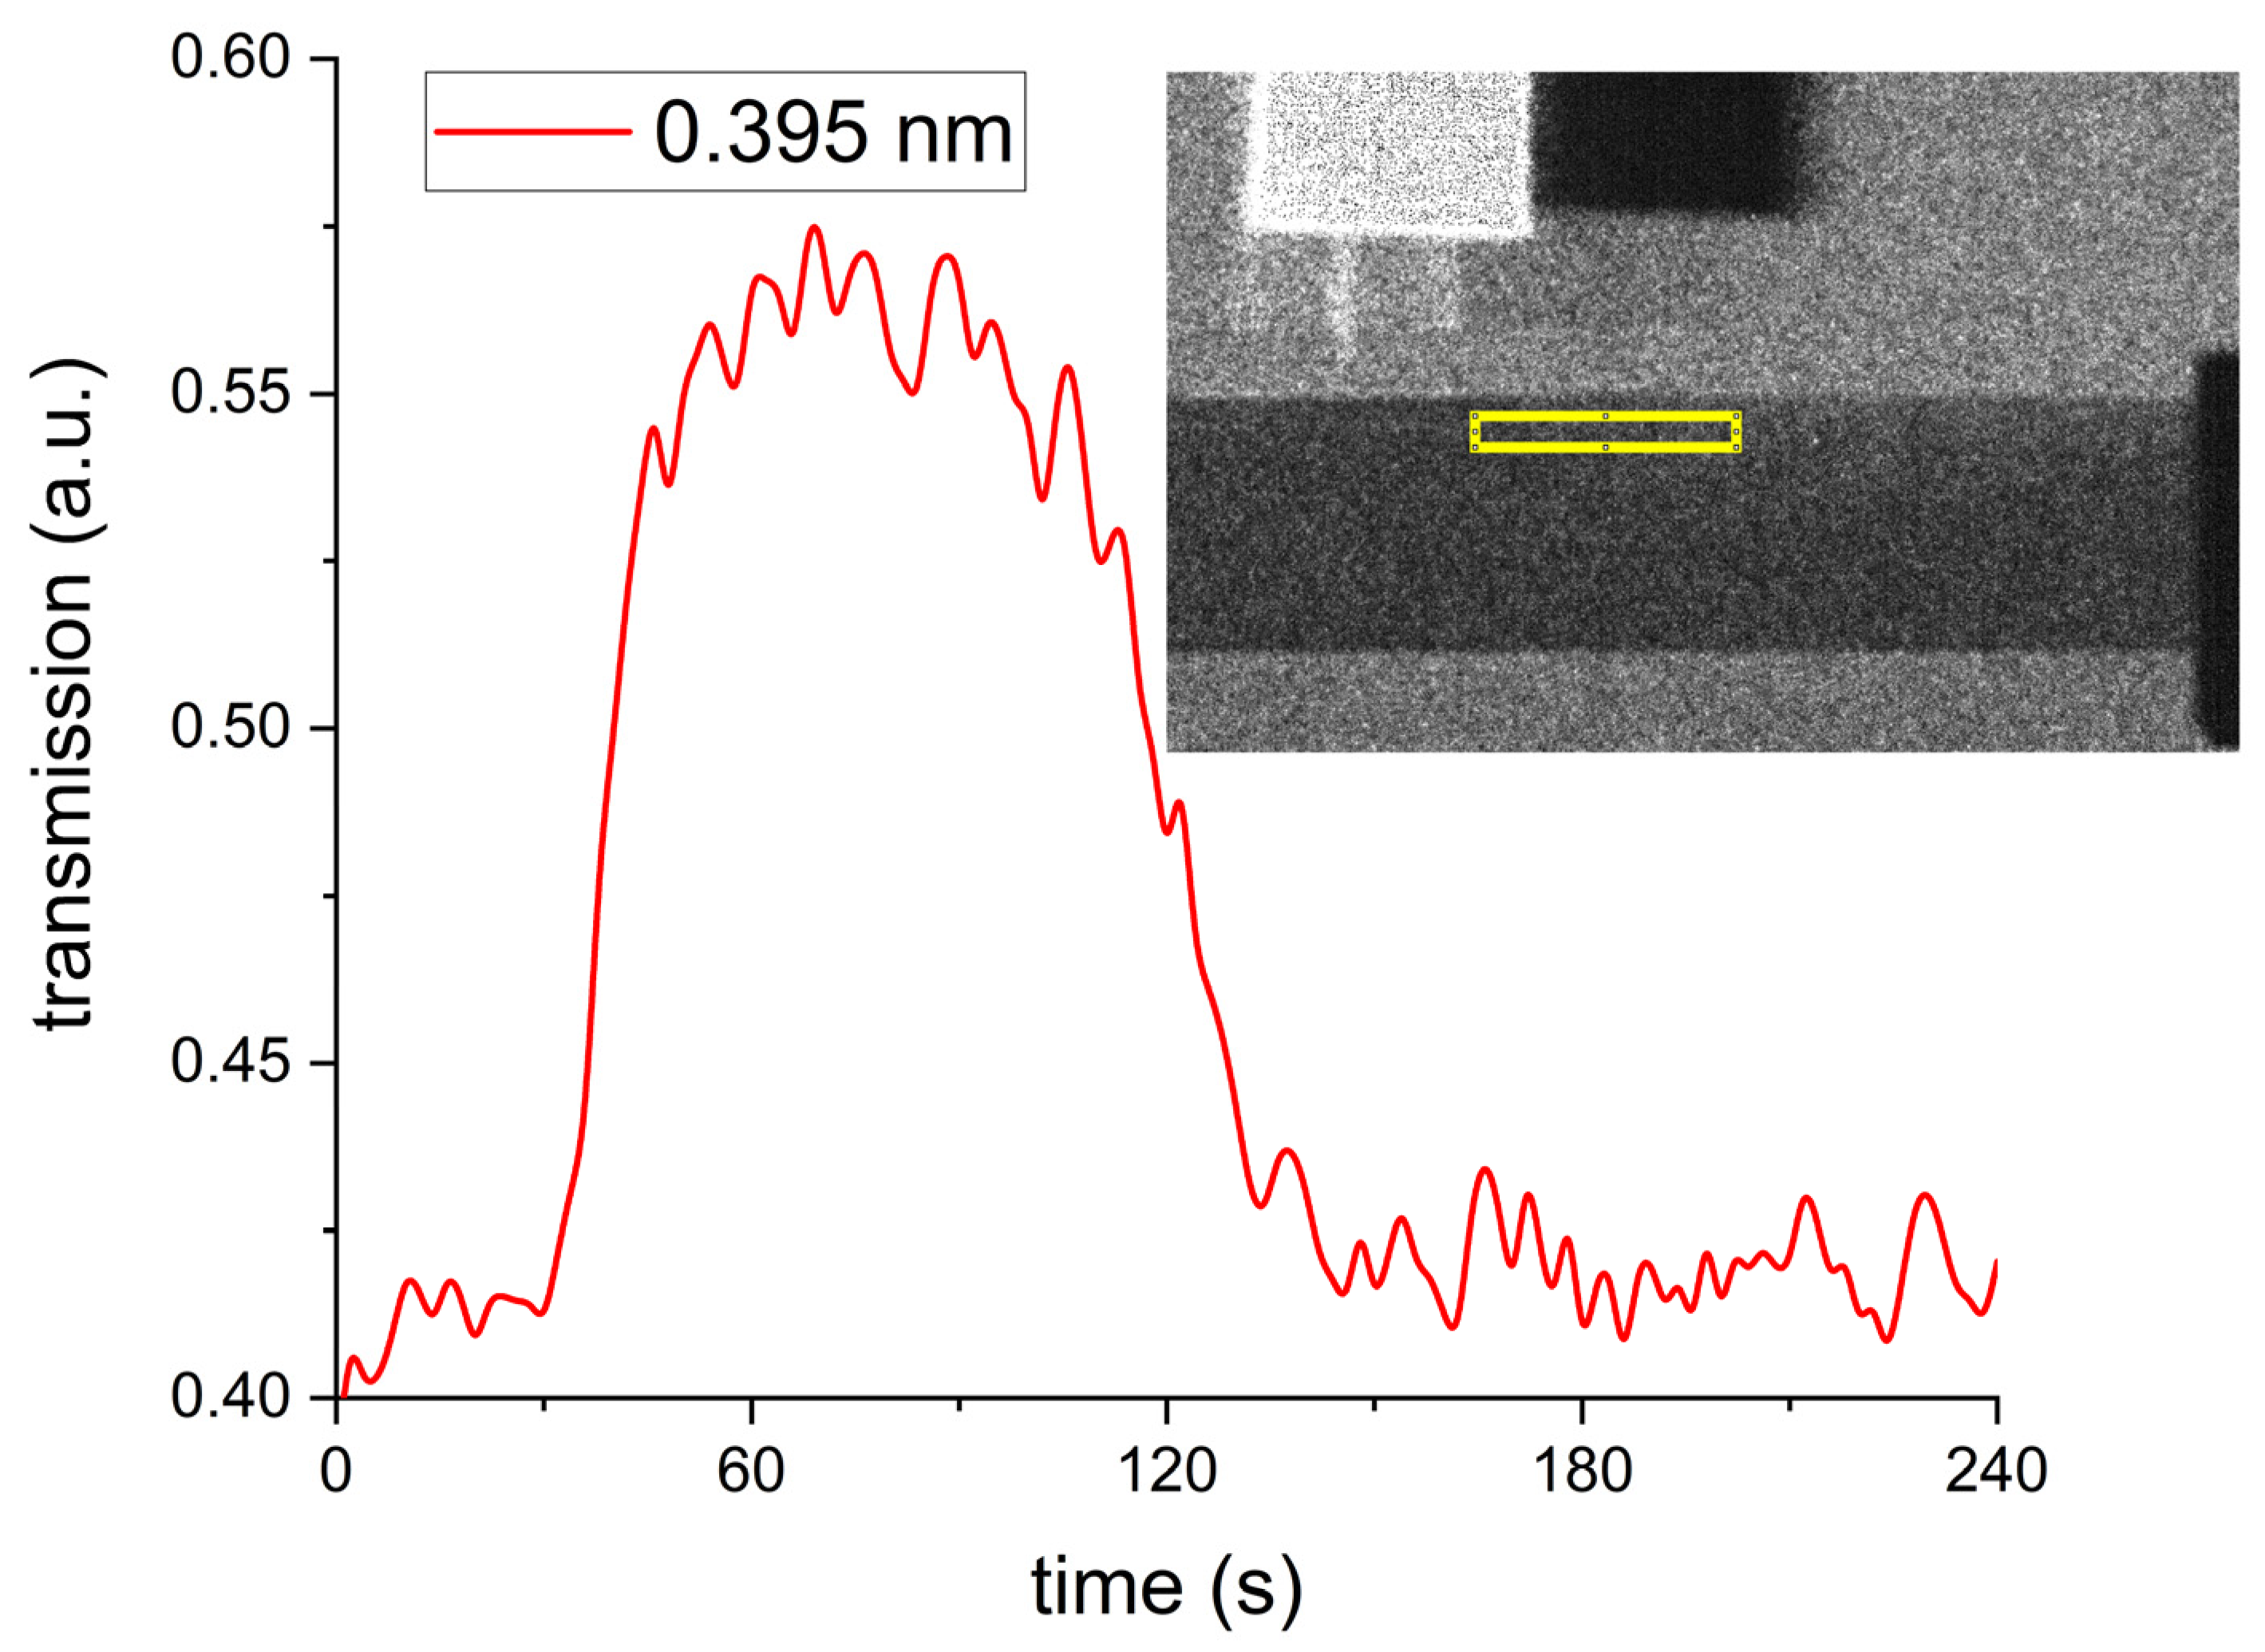
Figure 3 shows the mean value of the transmitted intensity approx. 1 mm underneath the sample top surface as a function of time detected in the rectangular yellow Region-of-Interest (ROI). The welding current was 80A, the welding velocity was 10 cm/min, and images were acquired every 2 s with an exposure time of 2 s. The transmission intensity increases drastically as soon as the torch passes by the ROI from approx. 0.42 a.u. to more than 0.56 a.u., i.e., by approx. 60%, and decreases slightly slower back to 0.42 a.u. at t ≈ 150 s. This behavior can be even quantified using the theoretical data presented in
Figure 2, where for a neutron wavelength of 0.395 nm the transmission for the martensitic phase is 0.42 a.u. and for the martensitic phase is 0.51 a.u. Thus, this transmission change can be attributed to the transformation from martensite to austenite, where the transmission decrease is due to the almost complete re-transformation to martensite upon cooling. The asymmetry of the transmission curve is due to the different heat fluxes during heating and cooling. Whereas the heat input from the electric welding arc fosters a very high heating rate, the heat flow upon cooling is somewhat slower and limited by the thermal isolation of the sample material. The slope of the transmission curve implies that the martensite reformation is finished within 1–1.5 min.
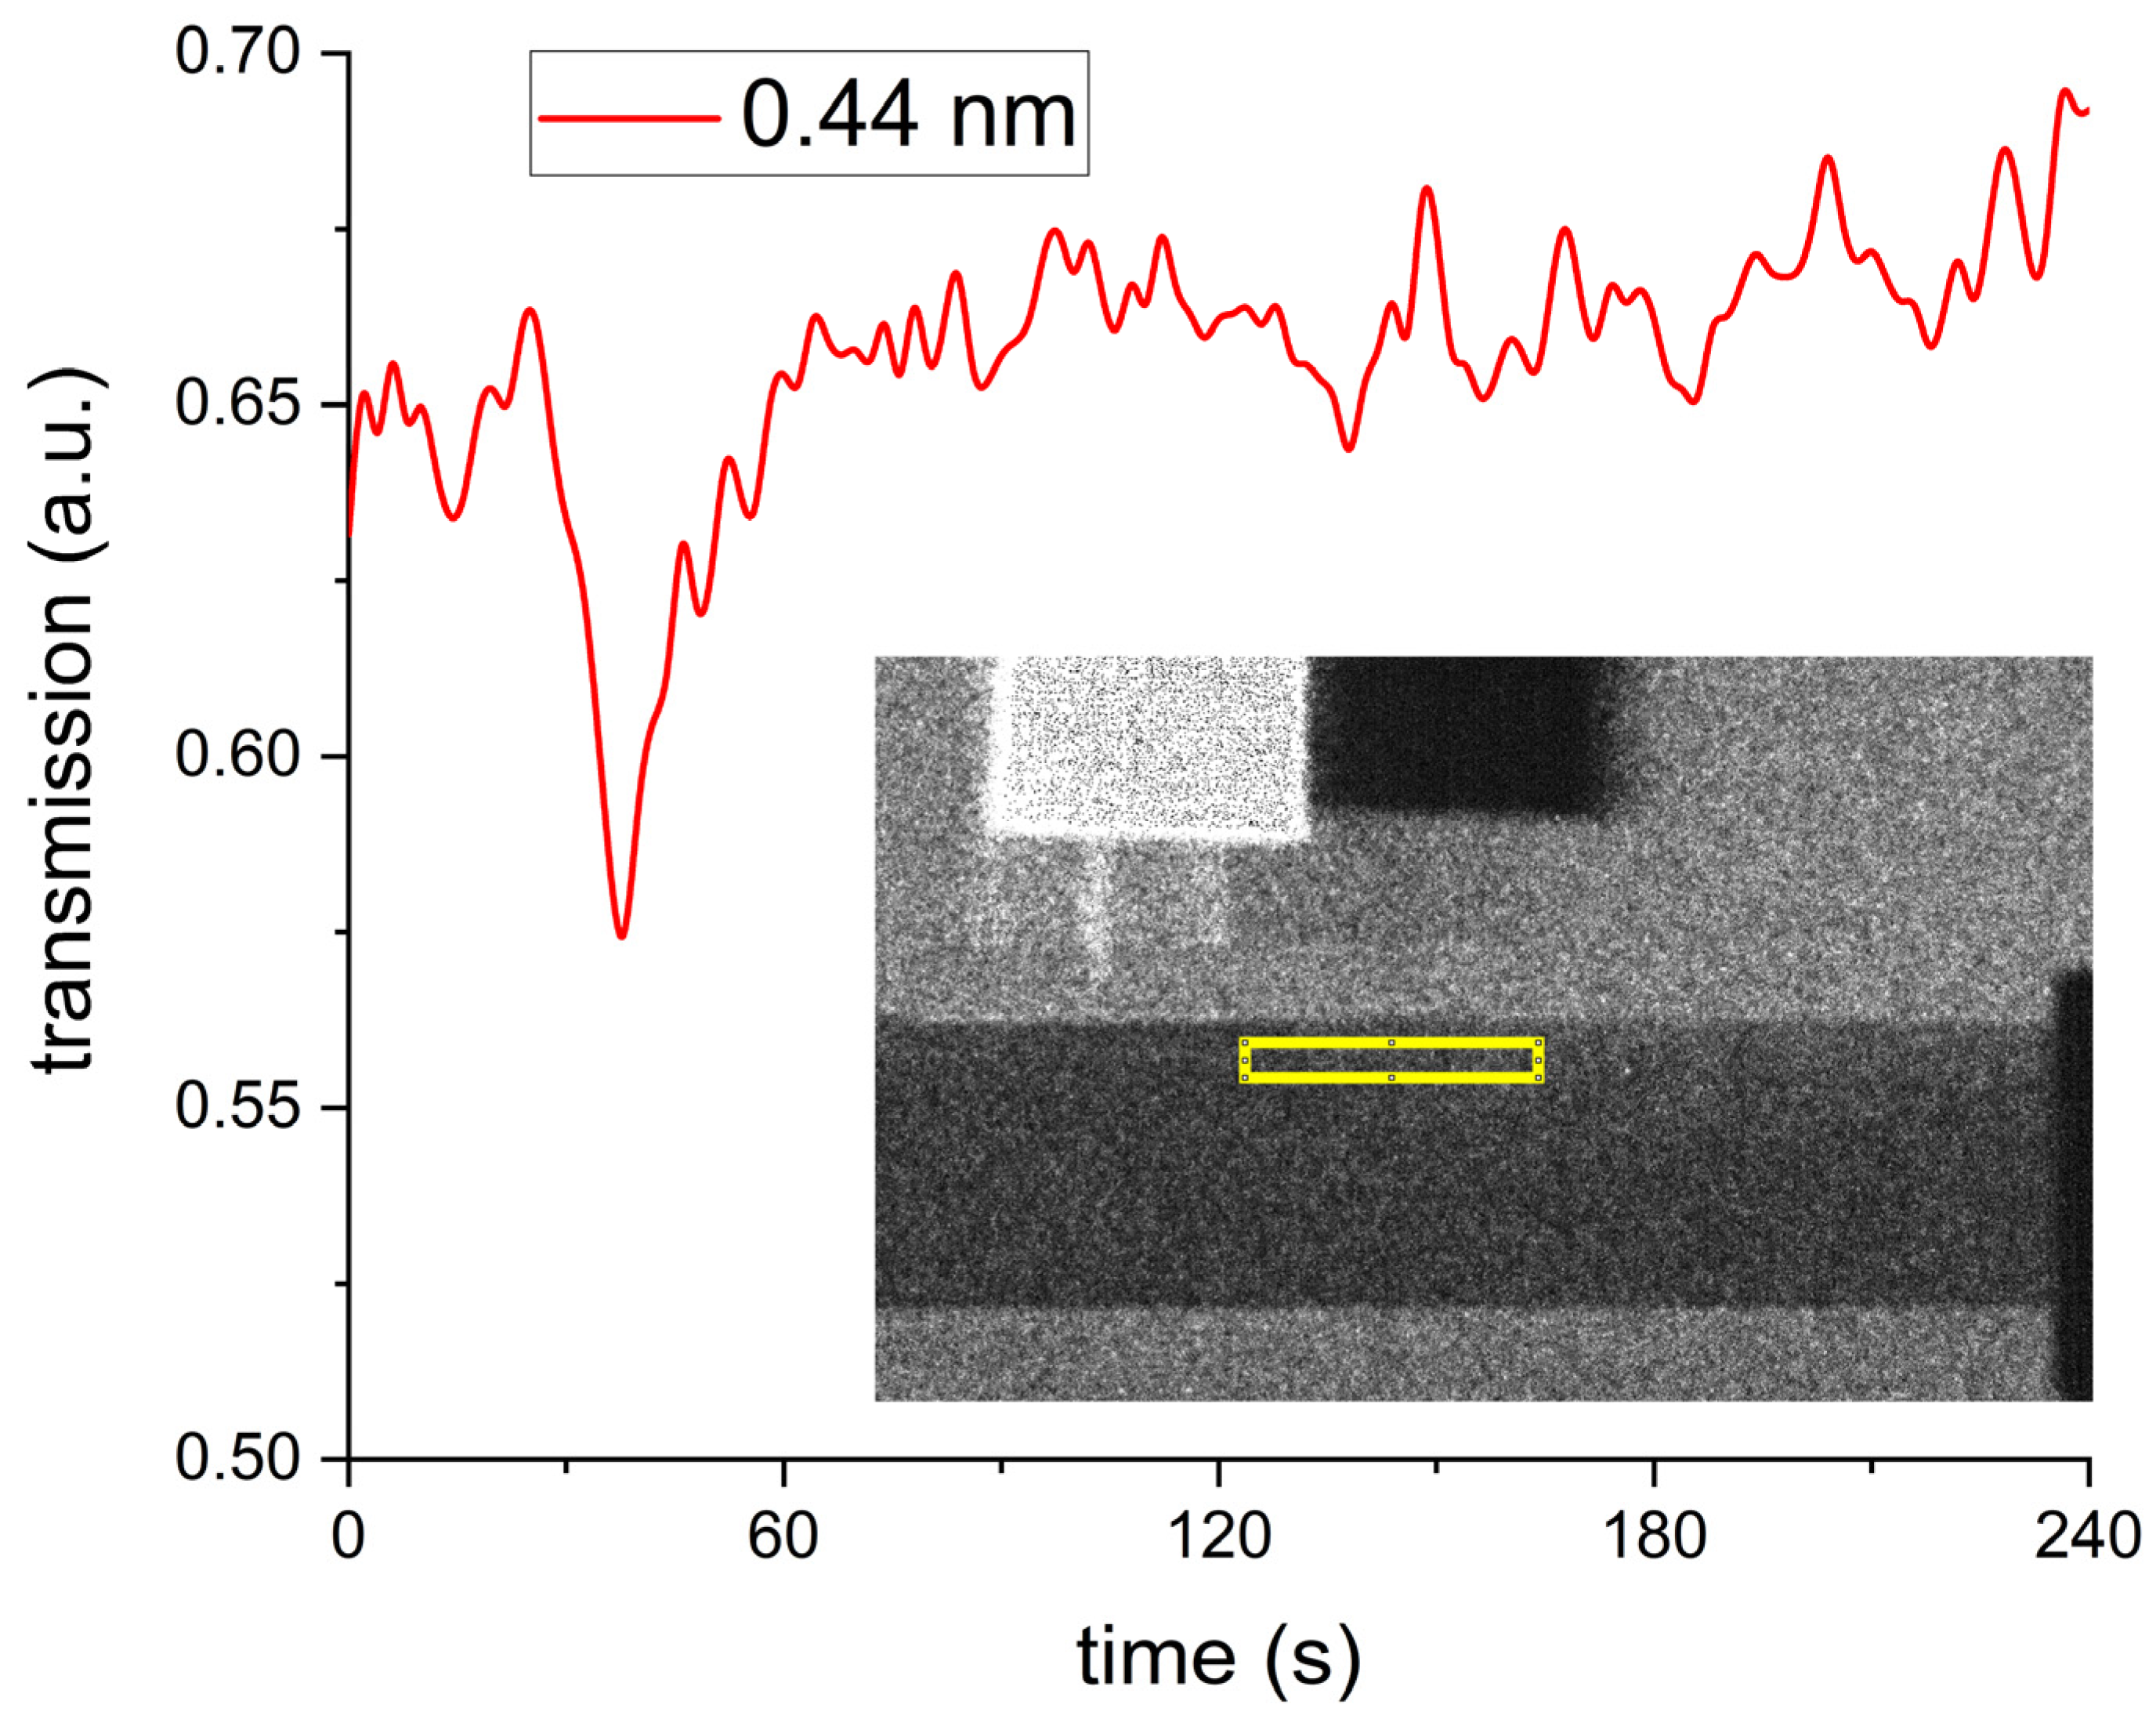
For checking purposes, an additional in situ imaging experiment using the same welding and imaging parameters was performed at a wavelength of 0.44 nm. Since this wavelength is larger than the Bragg-edge wavelengths of both lattice types, we expected that the transmitted intensity remains constant. The result is shown in
Figure 4. Indeed, we observed an intensity drop of approx. 15% during passing by of the ROI by the welding arc. Subsequently, the measured intensity increases exponentially within approx. 30 s and reaches the initial transmission of approx. 0.66 a.u., which correlates well with the transmission for the martensitic phase in
Figure 2.
A possible explanation of the observed drop in the transmitted neutron intensity is the so-called Debye–Waller factor [
15,
16]. The Debye–Waller factor describes the scattering of neutrons at an oscillating lattice. The immense heat input by the traveling welding arc melts the material at the surface and excites massive lattice oscillations in the subjacent crystalline material. Since the ROI is located 1 mm underneath the surface, most of the material measured should be solid during analysis. These massive lattice oscillations can influence the scattering cross section for neutrons. This effect of lattice oscillations is commonly considered when using neutron scattering techniques. Until now, this effect was not considered explicitly for neutron imaging. Whether neutrons are scattered with increasing temperature depends on the scattering mechanism. Whereas the elastic neutron cross section decreases with increasing temperature, the inelastic neutron cross section increases. Coherent inelastic scattering, however, has the most significant effect and deflects more neutrons at elevated temperatures [
17]. Thus, the overall transmitted intensity starts decreasing at high temperatures.
3.3. Polychromatic Imaging
The CONRAD beamline provides a cold neutron spectrum, which has a maximum intensity peak at around 0.25 nm [
18]. This resulting high neutron flux allows us to observe the martensite–austenite phase transformation with very short exposure times and provides a much better signal-to-noise ratio, i.e., a much better image contrast compared to monochromatic imaging.
The same welding parameters as for the abovementioned measurements with monochromatic neutrons were used for the polychromatic imaging experiment. The exposure time could be as low as 0.5 s, allowing a four times higher image acquisition rate.
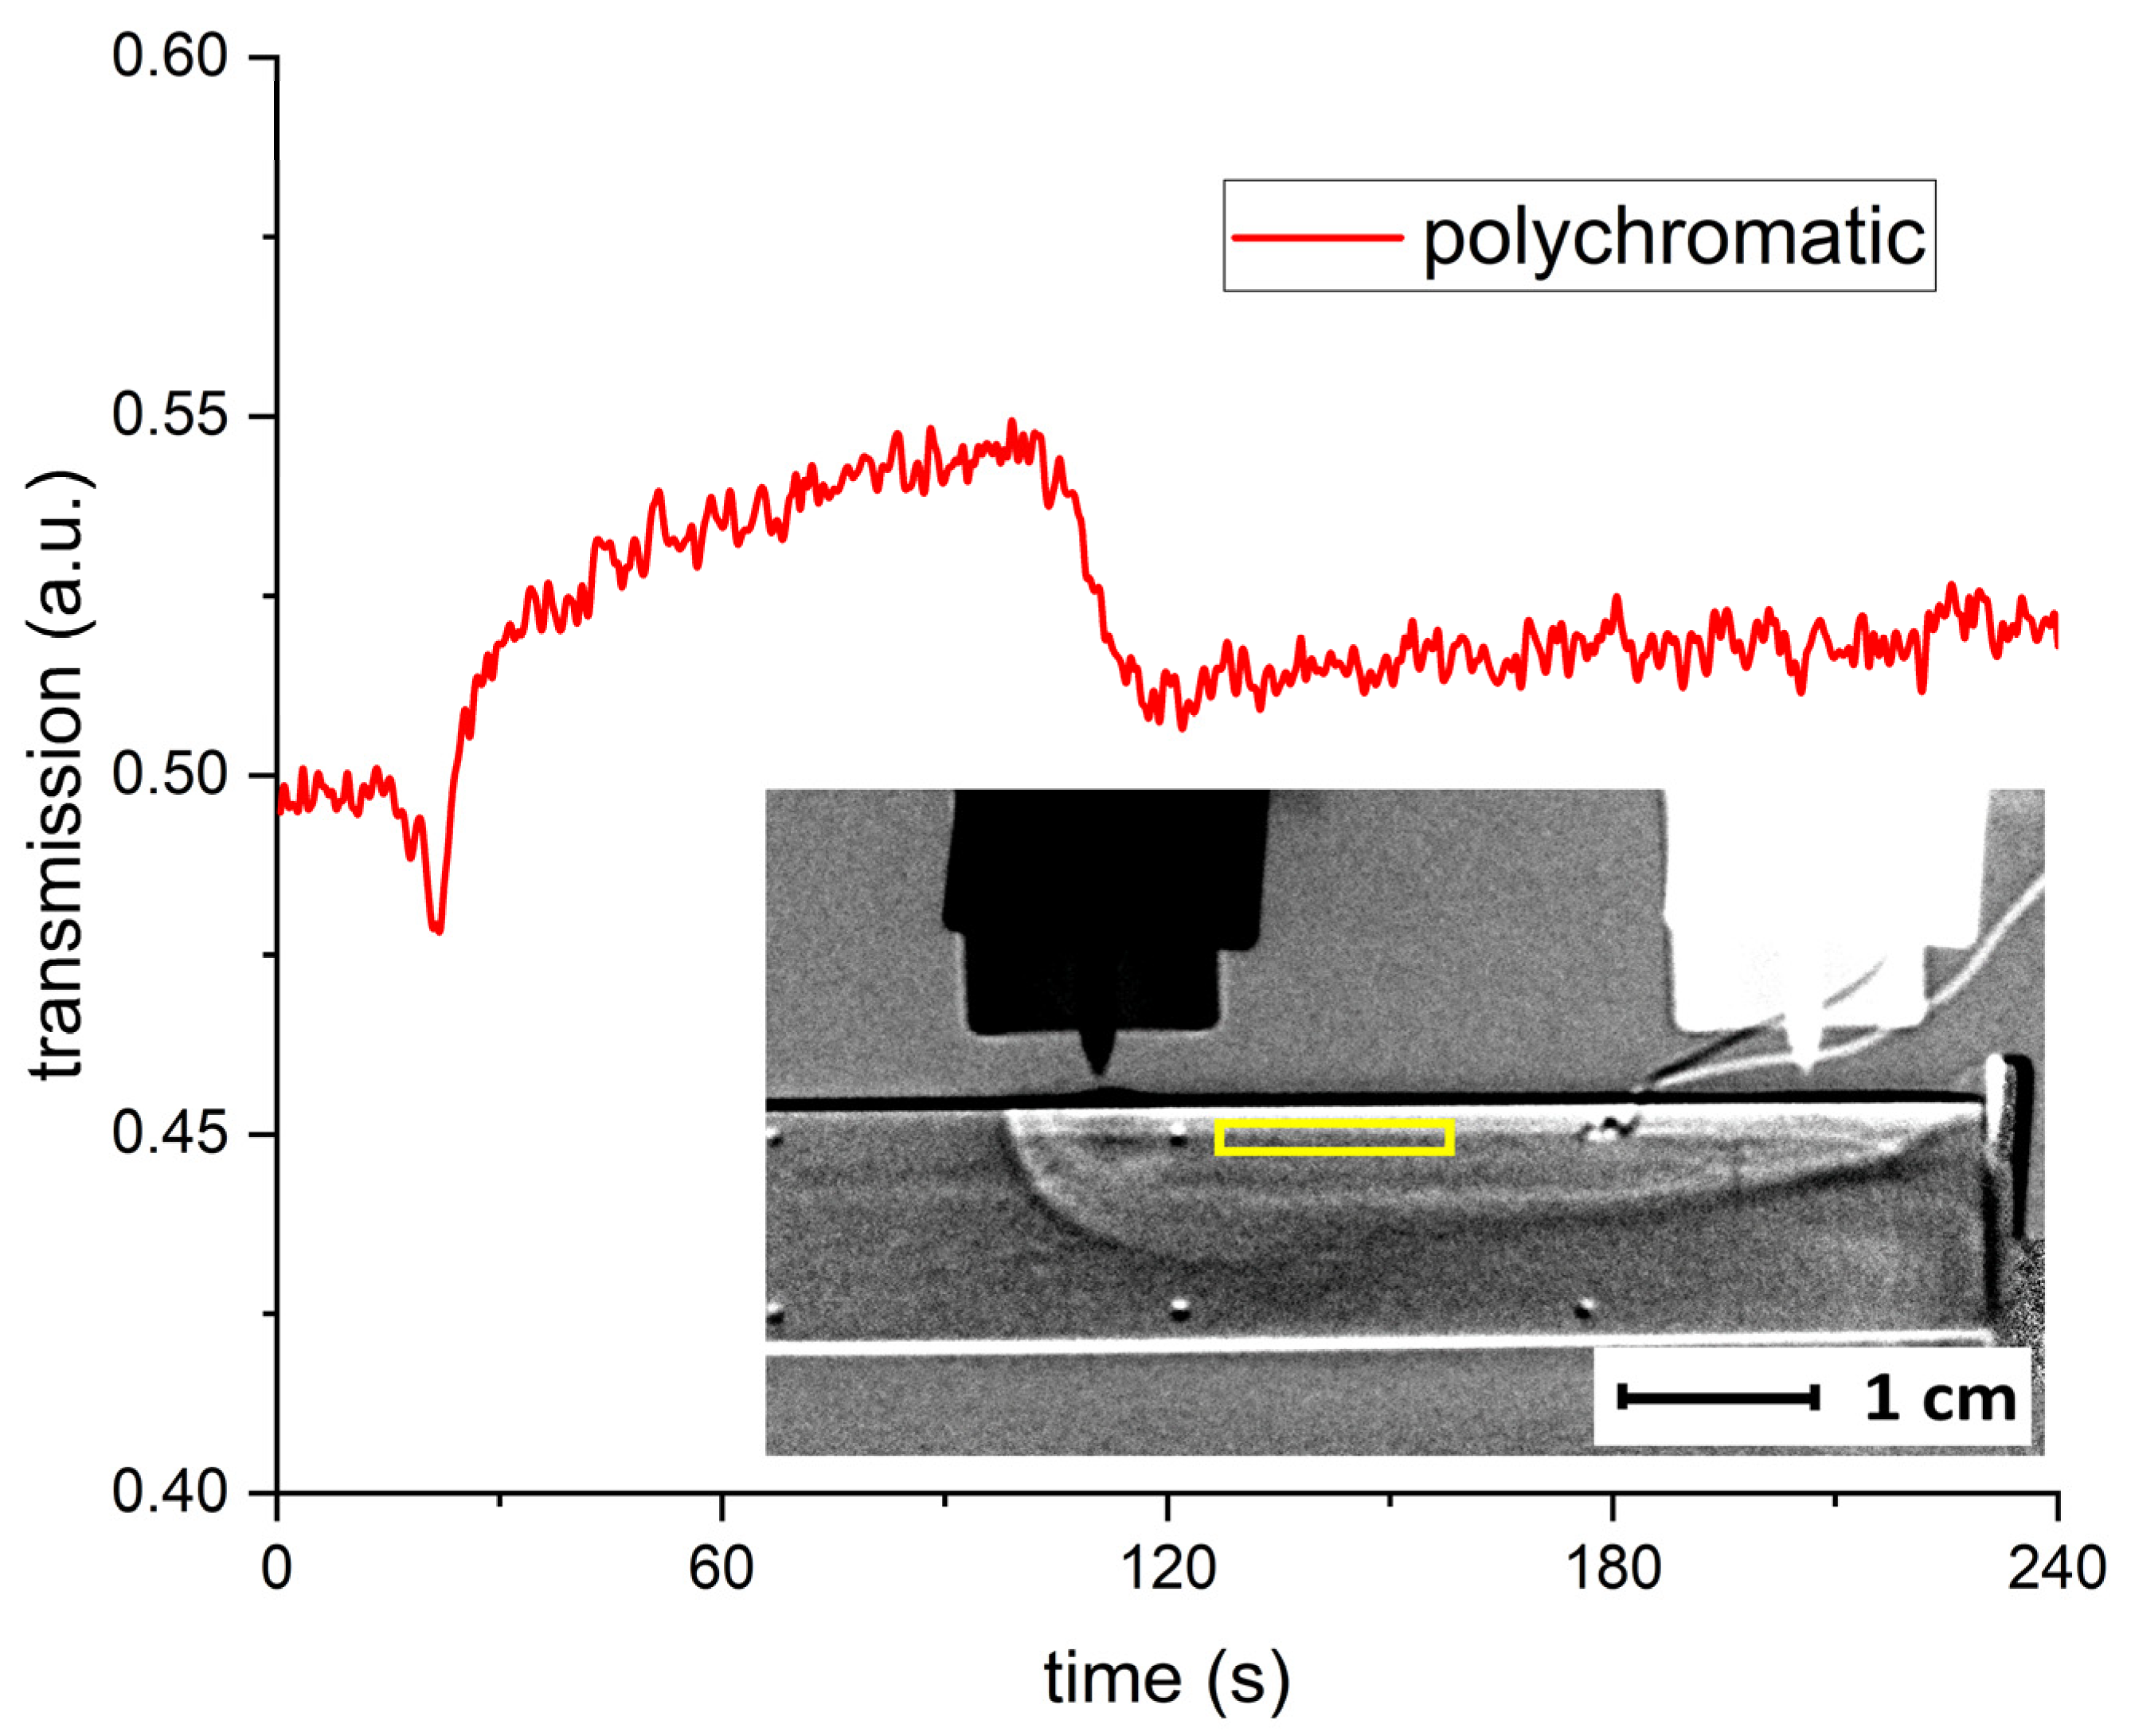
Figure 5 shows the transmitted intensity for an equal ROI as used for monochromatic imaging. A sheathed type K thermocouple, inserted in a bore hole close to the welded surface, allowed the measurement of the temperature.
The intensity dip of approx. 4% relatively at t ≈ 25 s can be attributed again to the increasing sample temperature due to the traveling welding torch and the associated change of the Debye–Waller factor. The following intensity increase starting at t > 30 s is due to the change in transmission because of the evolving austenitic phase. The austenitic phase re-transforms to martensite between t ≈ 102 s and t ≈ 120 s, resulting in a drop in the transmitted neutron intensity by around 7%.
Again, the welding nozzle can be seen twice due to the normalization of all images by dividing all images by the first image. The starting position is to the right (white nozzle), whereas the final position is to the left (black nozzle). The thermocouple was inserted in the upper right hole and had also moved slightly during welding, showing its initial position (white wire) in all images. The bright and dark streaks at the bottom and the top of the sample were also caused by the image normalization. The thermal expansion bended the sample upwards, and dividing all images by the image of the cold sample at t = 0 results in such streaks at the sample edges.
The bright area in the upper part of the sample is the austenitic phase in the heat-affected zone (HAZ), which is still present, and which is in the process of re-transformation from austenite to martensite. The peak temperature reading, when the torch is passing by the inserted thermocouple, is larger than 1200 °C. Measurements with type K thermocouples above such temperatures are not possible. The temperature reading dropped down to around 600 °C by the end of the welding. Another 2.5 min later the Ms temperature is reached, and it takes another 7.5 min to reach Mf.
The increasing vertical dimension of the HAZ from the right to the left is due to the heat accumulation during welding. Additionally, after stopping the torch movement, the electric arc burns for another two seconds, introducing even more energy at this position. The heat protection of both sides of the metal plate restricts the heat dissipation mainly in the two dimensions perpendicular to the neutron flight direction, shaping the temperature profile in the sample.
4. Discussion
Neutron Bragg-edge imaging allows us to film phase changes during the welding of martensitic steel and to film the spatial spread of the heat-affected zone during gas tungsten arc welding. The use of a polychromatic beam results in a four times higher temporal resolution and in an order of magnitude higher signal-to-noise ratio. This leads to a significantly better image quality than for monochromatic imaging. Further, imaging with a polychromatic beam allows us to film the spreading of the heat-affected zone that corresponds to the moving welding torch. The use of monochromatic neutrons allows for phase-specific imaging, but neutron scattering by thermally induced lattice vibrations may influence the image quality.
In this investigation, the lattice vibrations at high temperatures disturbed the monochromatic imaging. From this, it follows that it should, in principle, be possible to measure the temperature of a sample by energy-selective neutron radiography [
19] using the temperature dependence of the Debye–Waller factor. A prerequisite for such measurements is the knowledge of these temperature dependence data for all involved crystallographic phases. However, systematic studies of the temperature dependence of such data are not known to the authors up to now.
Generally, NBEI is a useful tool to study in situ phase changes in metals. This might help in clarifying material-related problems, e.g., in components that show strain-induced phase transformations [
20] during service. For selected cases, NBEI is a useful non-destructive testing method that might help in damage prevention and damage handling.


