
Applicability of Infrared Thermography for the Detection of Phase Transitions in Metal Alloys


Abstract
:1. Introduction
2. Materials and Methods
2.1. Materials
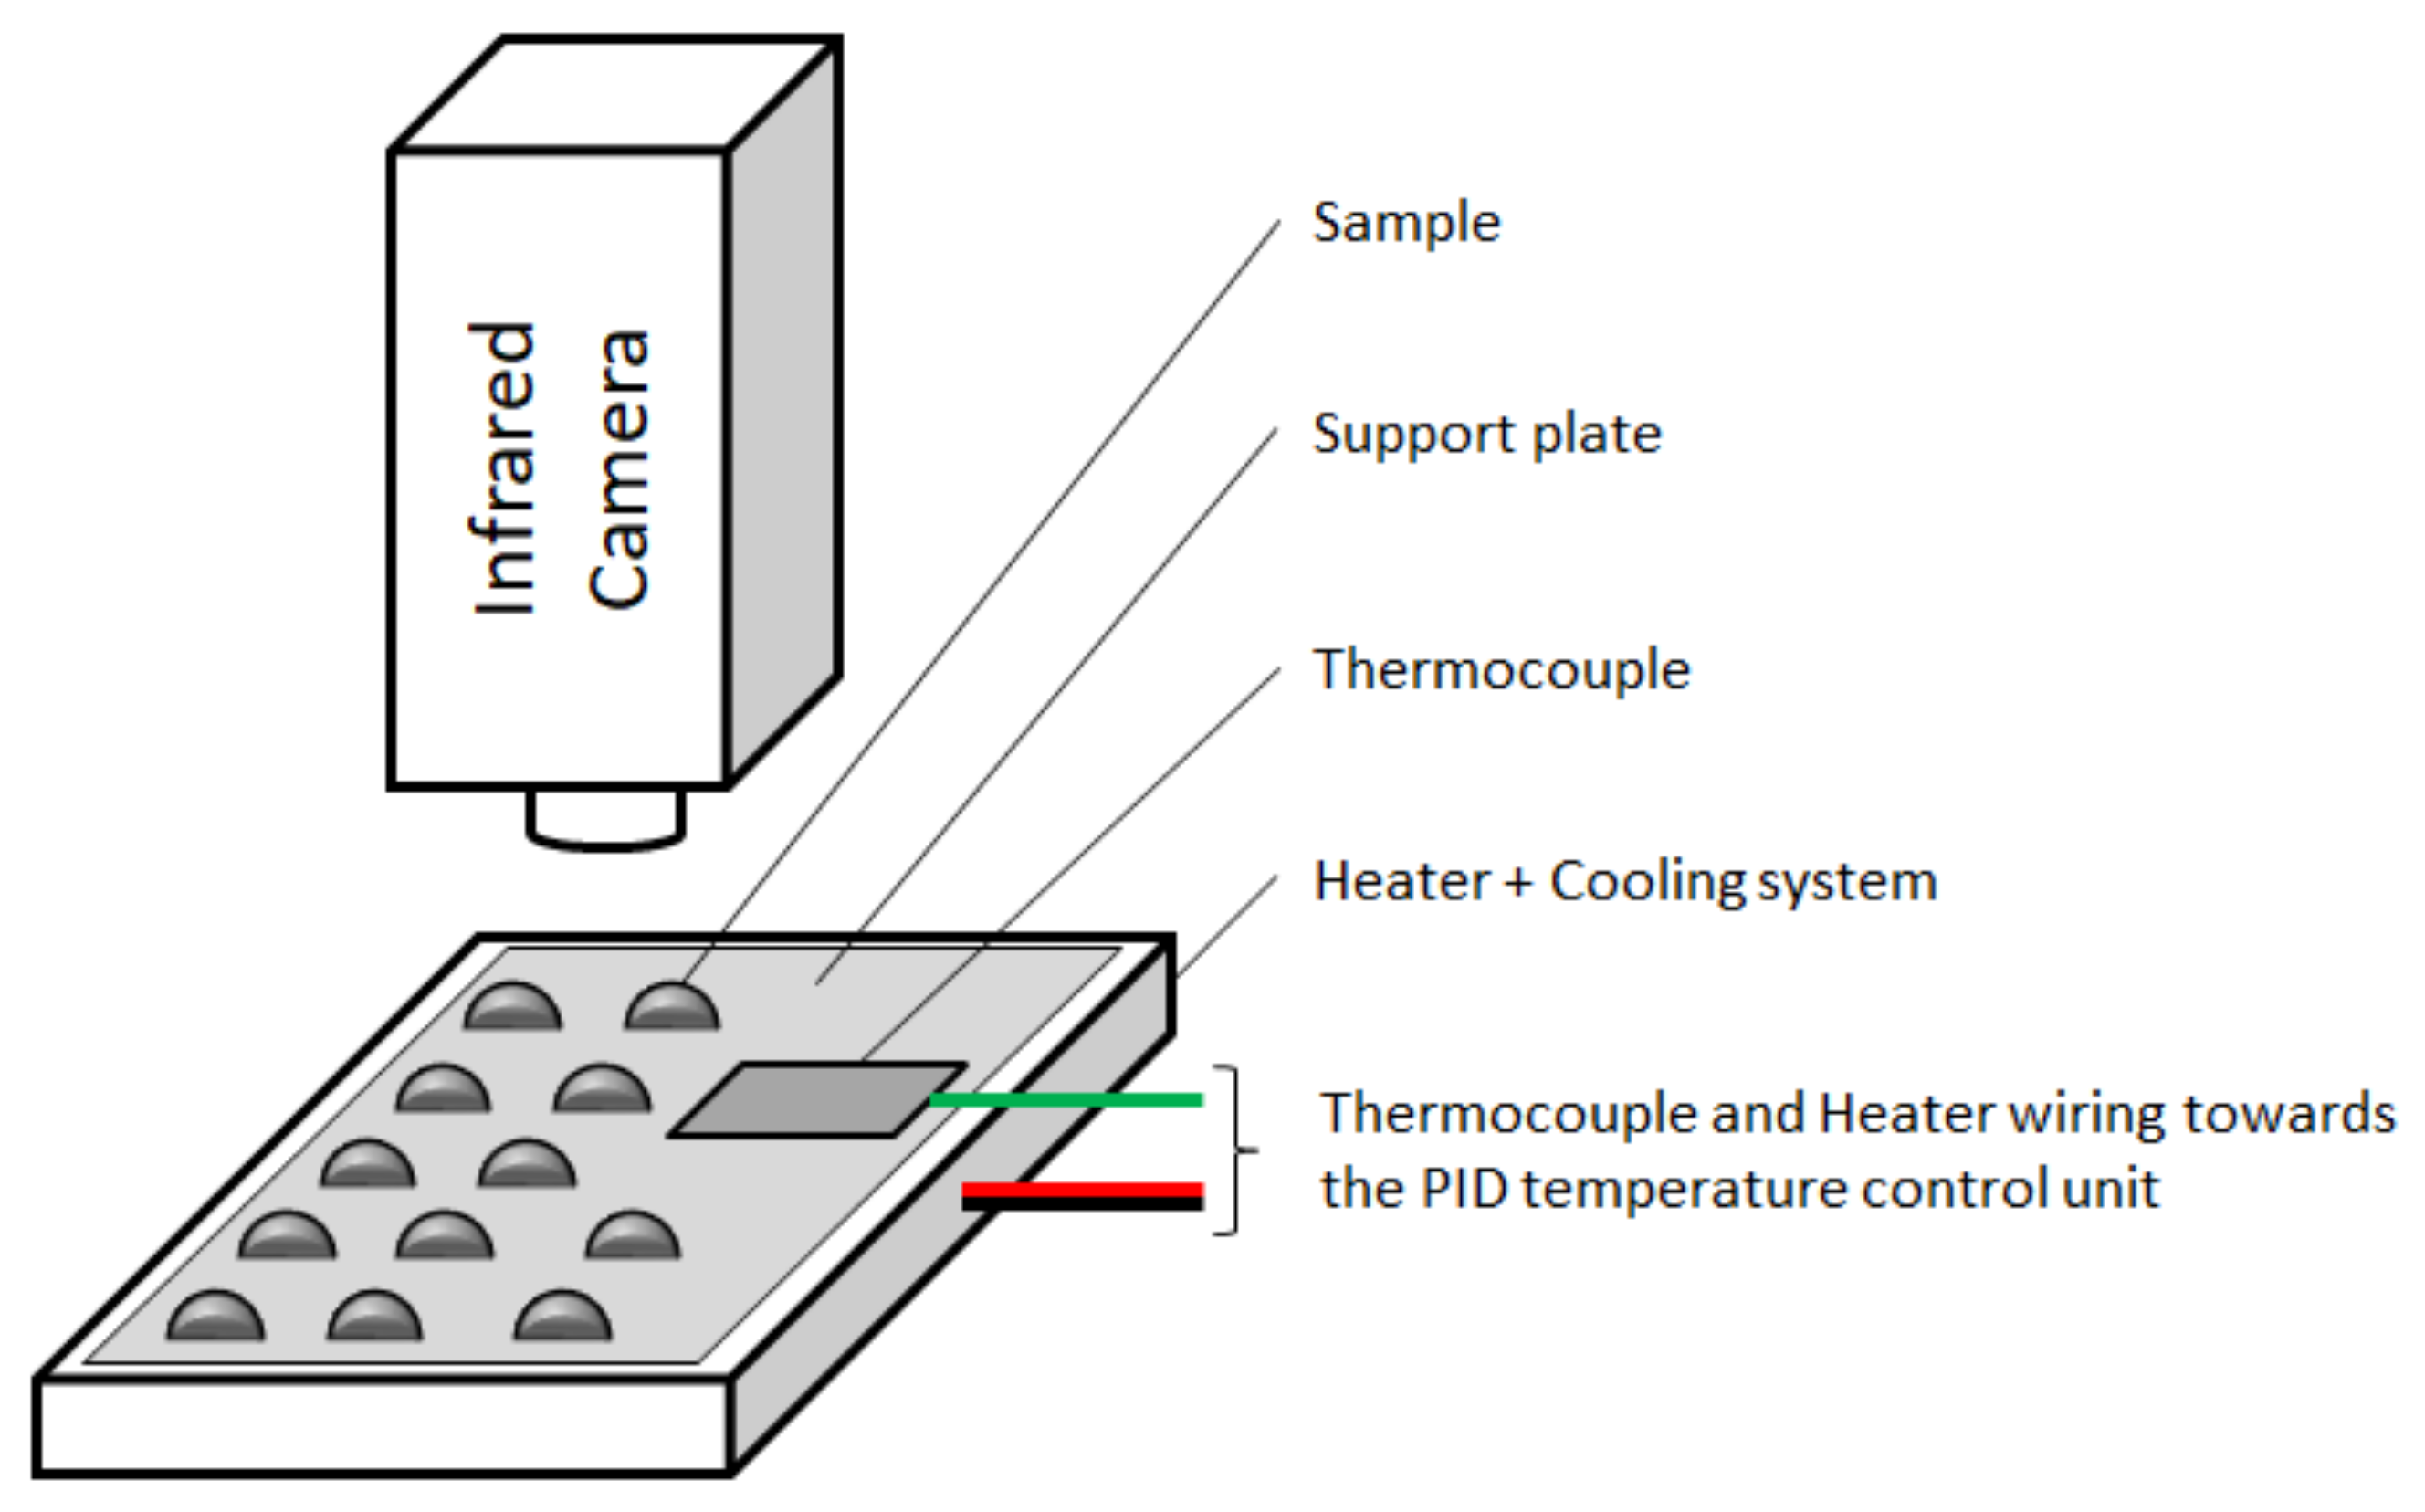
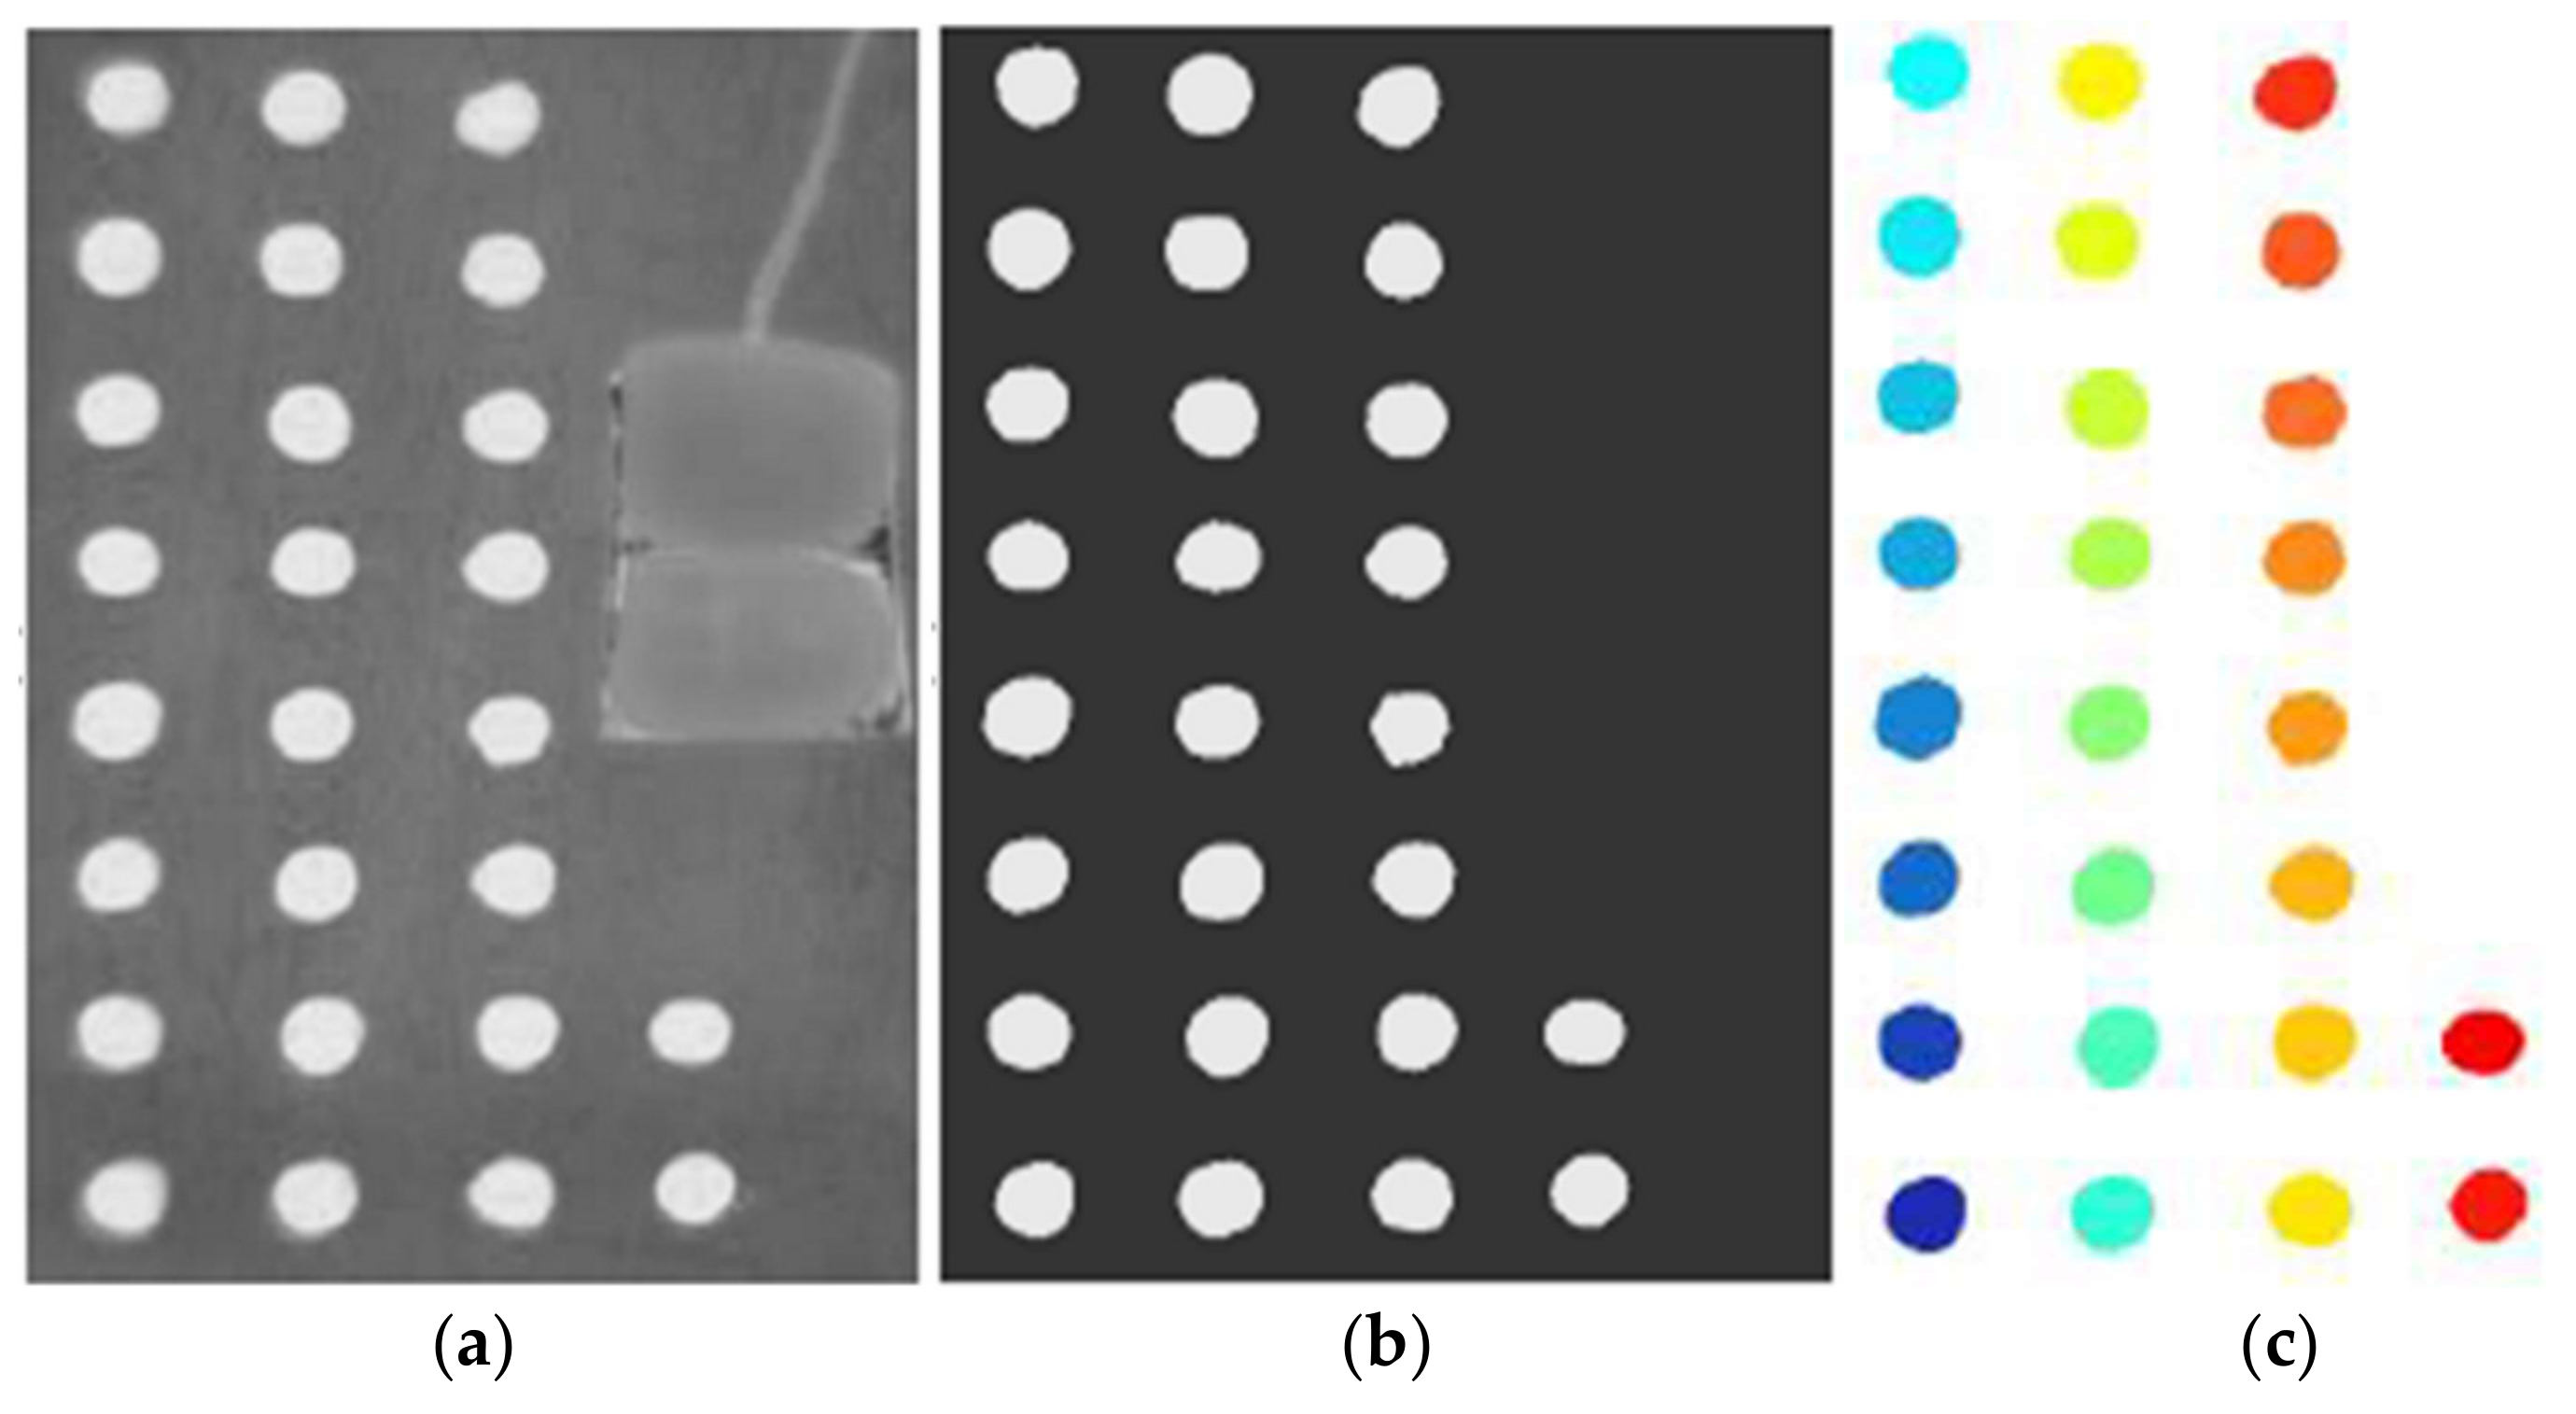
2.2. IRT Method
2.3. DSC Validation
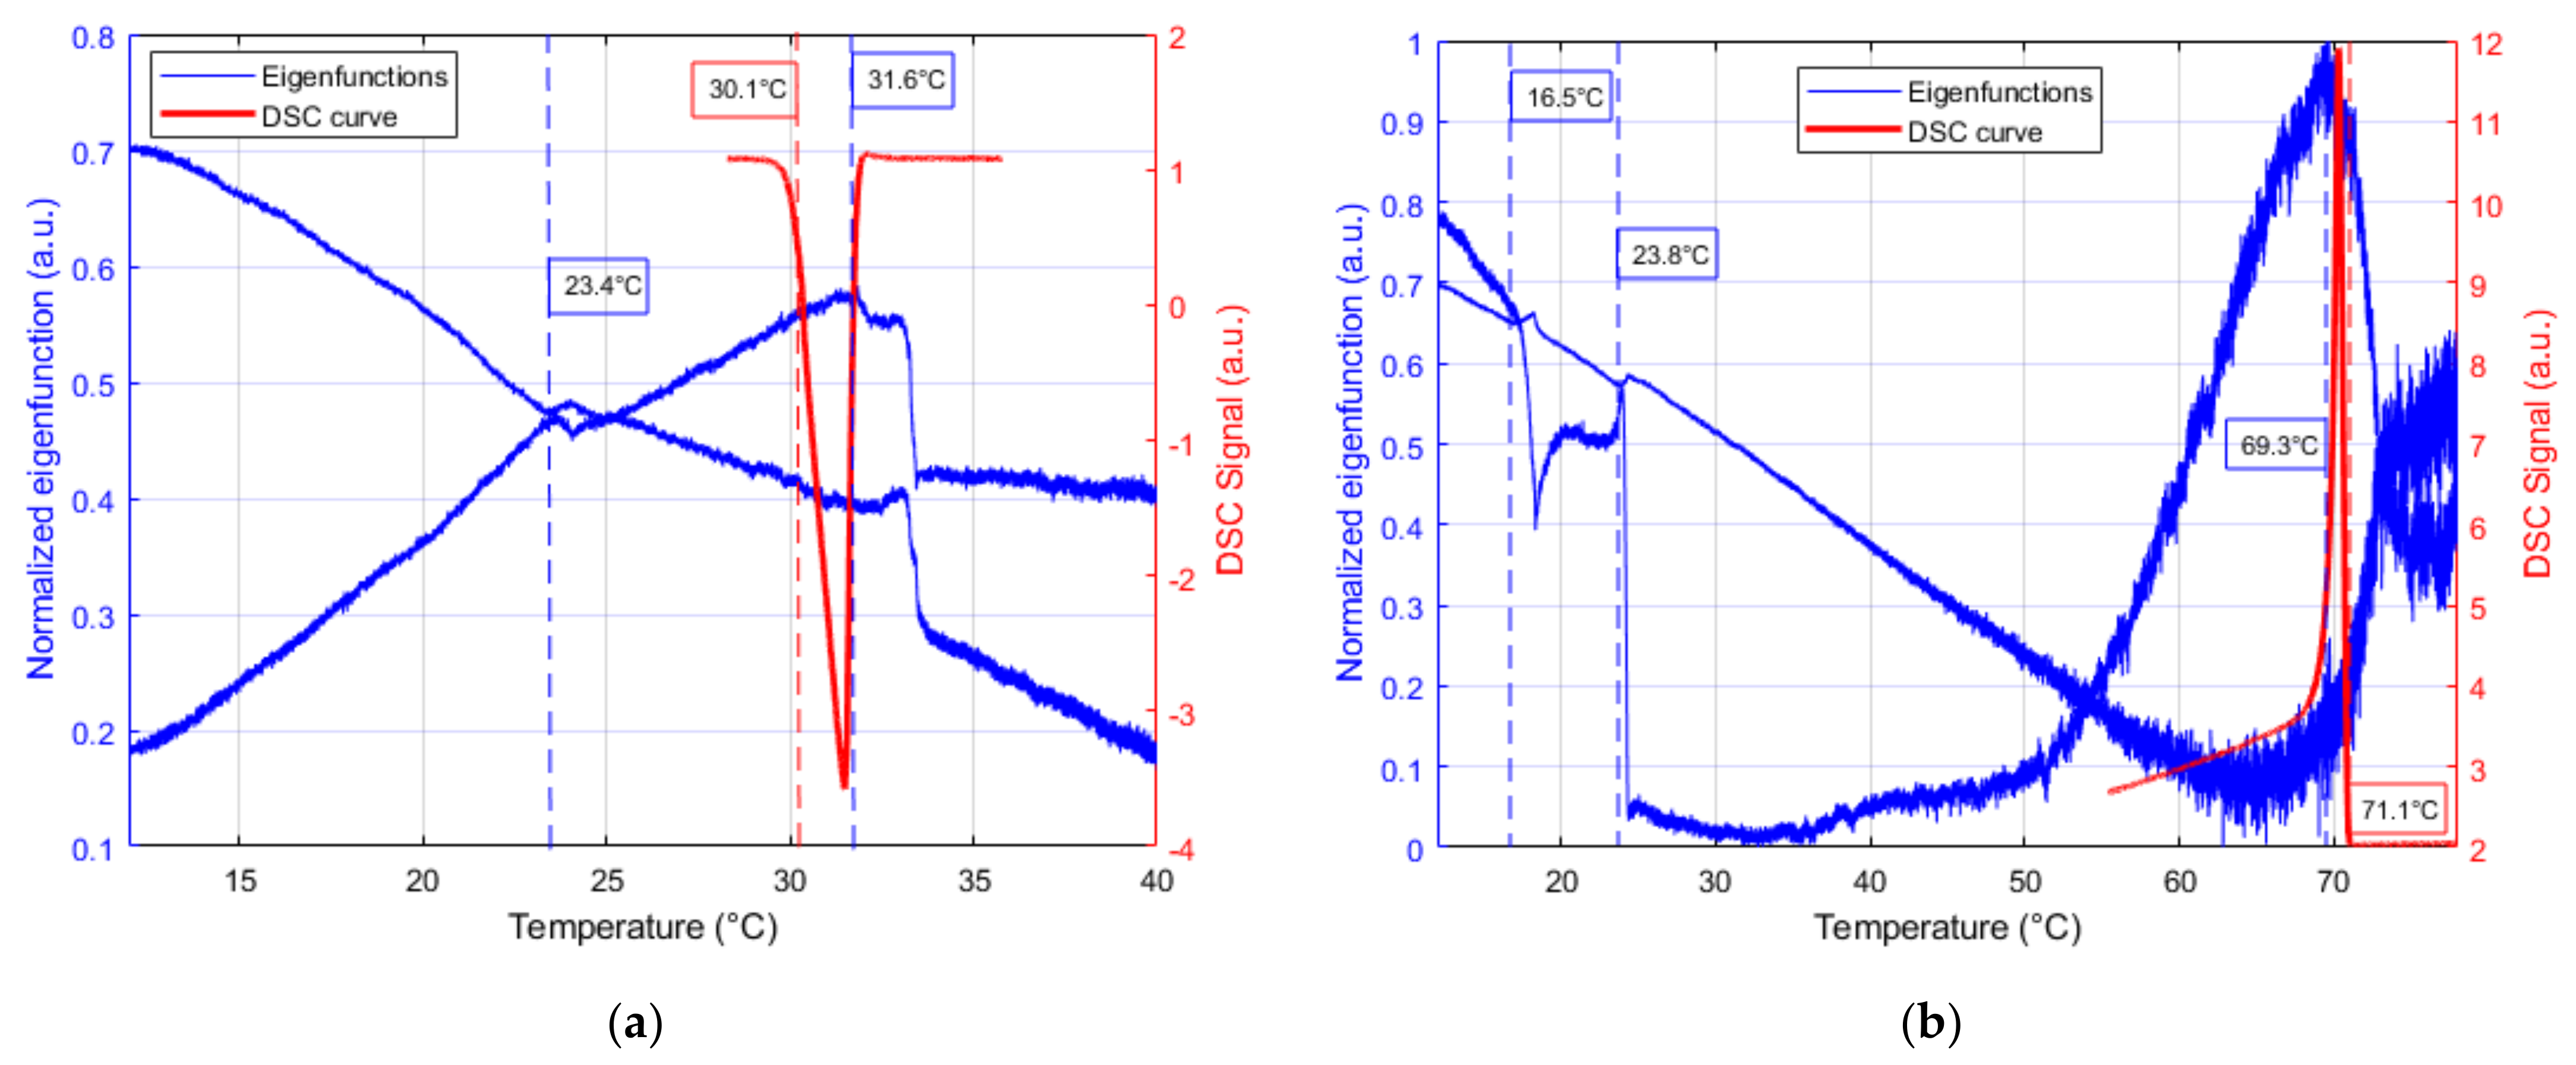
3. Results & Discussion
4. Conclusions
Author Contributions
Funding
Institutional Review Board Statement
Informed Consent Statement
Data Availability Statement
Acknowledgments
Conflicts of Interest
References
- Zalba, B.; Marín, J.M.; Cabeza, L.F.; Mehling, H. Review on Thermal Energy Storage with Phase Change: Materials, Heat Transfer Analysis and Applications. Appl. Therm. Eng. 2003, 23, 251–283. [Google Scholar] [CrossRef]
- Höhne, G.W.H.; Hemminger, W.; Flammersheim, H.-J. Differential Scanning Calorimetry: An Introduction for Practitioners; Springer: Berlin/Heidelberg, Germany, 1996; ISBN 978-3-662-03302-9. [Google Scholar]
- Sarge, S.M.; Höhne, G.; Hemminger, W. Calorimetry: Fundamentals, Instrumentation and Applications; Wiley-VCH Ltd.: Hoboken, NJ, USA, 2014; ISBN 978-3-527-64936-5. [Google Scholar]
- Sarge, S.M.; Höhne, G.; Hemminger, W. (Eds.) Methods of Calorimetry. In Calorimetry; John Wiley & Sons, Ltd.: Hoboken, NJ, USA, 2014; pp. 9–18. ISBN 978-3-527-64936-5. [Google Scholar]
- Lewis, R.N.A.H.; McElhaney, R.N. Fourier Transform Infrared Spectroscopy in the Study of Lipid Phase Transitions in Model and Biological Membranes: Practical Considerations. Methods Mol. Biol. 2007, 400, 207–226. [Google Scholar] [CrossRef] [PubMed]
- Zheng, W.; Kaiser, R.I. An Infrared Spectroscopy Study of the Phase Transition in Solid Ammonia. Chem. Phys. Lett. 2007, 440, 229–234. [Google Scholar] [CrossRef]
- Campbell, F.C. Phase Diagrams: Understanding the Basics; ASM International: Novelty, OH, USA, 2012; ISBN 978-1-61503-986-9. [Google Scholar]
- Palomo Del Barrio, E.; Cadoret, R.; Daranlot, J.; Achchaq, F. Infrared Thermography Method for Fast Estimation of Phase Diagrams. Thermochim. Acta 2016, 625, 9–19. [Google Scholar] [CrossRef]
- Duquesne, M.; Mailhé, C.; Ruiz-Onofre, K.; Achchaq, F. Biosourced Organic Materials for Latent Heat Storage: An Economic and Eco-Friendly Alternative. Energy 2019, 188, 116067. [Google Scholar] [CrossRef]
- Mailhé, C.; Duquesne, M.; Palomo del Barrio, E.; Azaiez, M.; Achchaq, F. Phase Diagrams of Fatty Acids as Biosourced Phase Change Materials for Thermal Energy Storage. Appl. Sci. 2019, 9, 1067. [Google Scholar] [CrossRef] [Green Version]
- Mailhé, C.; Duquesne, M. A Fast and Low-Cost Dynamic Calorimetric Method for Phase Diagram Estimation of Binary Systems. J. Anal. Calorim 2020, 143, 587–598. [Google Scholar] [CrossRef]
- Kattner, U.R. The Calphad method and its role in material and process development. Tecnol. Met. Mater Min. 2016, 13, 3–15. [Google Scholar] [CrossRef] [PubMed]
- Carter, G.C. Applications of Phase Diagrams in Metallurgy and Ceramics: Proceedings of a Workshop Held at the National Bureau of Standards, Gaithersburg, Maryland, January 10–12, 1977; U.S. Department of Commerce, National Bureau of Standards: Gaithersburg, MD, USA, 1978.
- Yang, Y.; Bewlay, B.P.; Chen, S.; Chang, Y.A. Application of Phase Diagram Calculations to Development of New Ultra-High Temperature Structural Materials. Trans. Nonferrous Met. Soc. China 2007, 17, 1396–1404. [Google Scholar] [CrossRef]
- Dubost, B. Industrial Applications and Determination of Equilibrium Phase Diagrams for Light Alloys. Progress and Prospects. Rev. Met. Paris 1993, 90, 195–210. [Google Scholar] [CrossRef]
- Palomo Del Barrio, E.; Cadoret, R.; Daranlot, J.; Achchaq, F. New Sugar Alcohols Mixtures for Long-Term Thermal Energy Storage Applications at Temperatures between 70 °C and 100 °C. Sol. Energy Mater. Sol. Cells 2016, 155, 454–468. [Google Scholar] [CrossRef]
- Anderson, T.J.; Ansara, I. The Ga-In (Gallium-Indium) System. JPE 1991, 12, 64–72. [Google Scholar] [CrossRef]
- Deprettere, E.F. SVD and Signal Processing. Algorithms, Applications and Architectures; Elsevier: Amsterdam, The Netherlands, 1988. [Google Scholar]
- Boettinger, W.J.; Kattner, U.R.; Moon, K.-W.; Perepezko, J. NIST Recommended Practice Guide: DTA and Heat-Flux DSC Measurements of Alloy Melting and Freezing|NIST. In Methods for Phase Diagram Determination; Elsevier: Amsterdam, The Netherlands, 2006. [Google Scholar]

| Metals | Acronym | CAS Number | Supplier | Purity 1 (%) | Melting Temperature 1 (°C) |
|---|---|---|---|---|---|
| Gallium | Ga | 7440-55-3 | Setaram | >99.999% | 29.8 |
| Indium | In | 7440-74-6 | Setaram | >99.995% | 156.6 |
Publisher’s Note: MDPI stays neutral with regard to jurisdictional claims in published maps and institutional affiliations. |
© 2021 by the authors. Licensee MDPI, Basel, Switzerland. This article is an open access article distributed under the terms and conditions of the Creative Commons Attribution (CC BY) license (https://creativecommons.org/licenses/by/4.0/).
Share and Cite
Mailhé, C.; Godin, A.; Veillère, A.; Duquesne, M. Applicability of Infrared Thermography for the Detection of Phase Transitions in Metal Alloys. Appl. Sci. 2021, 11, 8885. https://doi.org/10.3390/app11198885
Mailhé C, Godin A, Veillère A, Duquesne M. Applicability of Infrared Thermography for the Detection of Phase Transitions in Metal Alloys. Applied Sciences. 2021; 11(19):8885. https://doi.org/10.3390/app11198885
Chicago/Turabian StyleMailhé, Clément, Alexandre Godin, Amélie Veillère, and Marie Duquesne. 2021. "Applicability of Infrared Thermography for the Detection of Phase Transitions in Metal Alloys" Applied Sciences 11, no. 19: 8885. https://doi.org/10.3390/app11198885
APA StyleMailhé, C., Godin, A., Veillère, A., & Duquesne, M. (2021). Applicability of Infrared Thermography for the Detection of Phase Transitions in Metal Alloys. Applied Sciences, 11(19), 8885. https://doi.org/10.3390/app11198885