1. Introduction
Satellite laser ranging (SLR) is one of the high-precision fundamental space-geodetic technology to define the International Terrestrial Reference Frame (ITRF), which is important for the research on space exploration, environmental monitoring, urban construction, and other great topic studies. With the rapid development of the instruments in the terrestrial observation, the state-of-the-art SLR system can achieve sub-millimeter precision and obtain tens of thousands of annual observation passes [
1,
2,
3].
Kilohertz SLR system offers new possibilities for SLR data pre-processing algorithms. In 1984, normal point algorithm was first proposed [
4], and now it has developed to be the standard pre-processing algorithm of international laser ranging service (ILRS) [
5]. With the identification of satellite signature effect, the waveform of return signal is not assumed to be Gaussian distribution. On that basis, some corrections to the Normal point algorithm were proposed to satisfy the scientific demands for the Global Geodetic Observing System (GGOS) of mm precision ranging. In 1994, Neubert et al. first pointed out that the reflected signal is deformed and spread with a long tail in temporal distribution due to a satellite signature effect [
6]. Then, Thomas Varghese et al. proved these results by simulation and laboratory tests [
7]. Subsequently, Krzysztof Sosnica et al. confirmed that a satellite signature effect could introduce the variations of mean SLR residuals of up to 15 mm [
8]. In order to reduce the satellite signature effect on the SLR precision, Kirchner et al. found a stable leading-edge level of the range residual distribution of AJISAI as a reference line to select the observation points [
9], which improved the stability of normal points from 7.9 ± 1.0 mm to 5.2 mm ± 0.2 mm. In 2008, Kucharski and Kirchner modified the definition of the leading edge to the 10% of the nearest range residuals to further reduce the RMS of normal points [
10]. In 2017, Wilkinson used Gaussian function to fit the front-only of SLR residual distribution and eliminated the desultory points based on the leading-edge-half-maximum (LEHM) method [
11]. In most previous research, the satellite signature effect on ranging precision is regarded as a long-term statistical result of observations; the range error brought by the transient variation of return signal waveforms for different satellite orientation are always neglected. Thus, the instability of observational data for a short observation period caused by satellite signature effect did not have to be considered in the pre-processing algorithm, which would affect the final selection of the original observations for normal points and hinder the improvement of the range precision.
In this paper, the conventional data processing for SLR system is simulated based on the revised model of satellite signature effect, which takes the structural and distribution characteristics of corner reflectors into account. A new clipping method is proposed and applied for SLR data processing of Changchun SLR station, by considering the systematic errors introduced by the variation of return signal in time for each observation. This paper enriches the theoretical models of SLR systematic errors and provides a valuable reference to minimize the influence of satellite signature effect on the SLR production.
2. Simulation and Analysis of Normal Point Algorithm
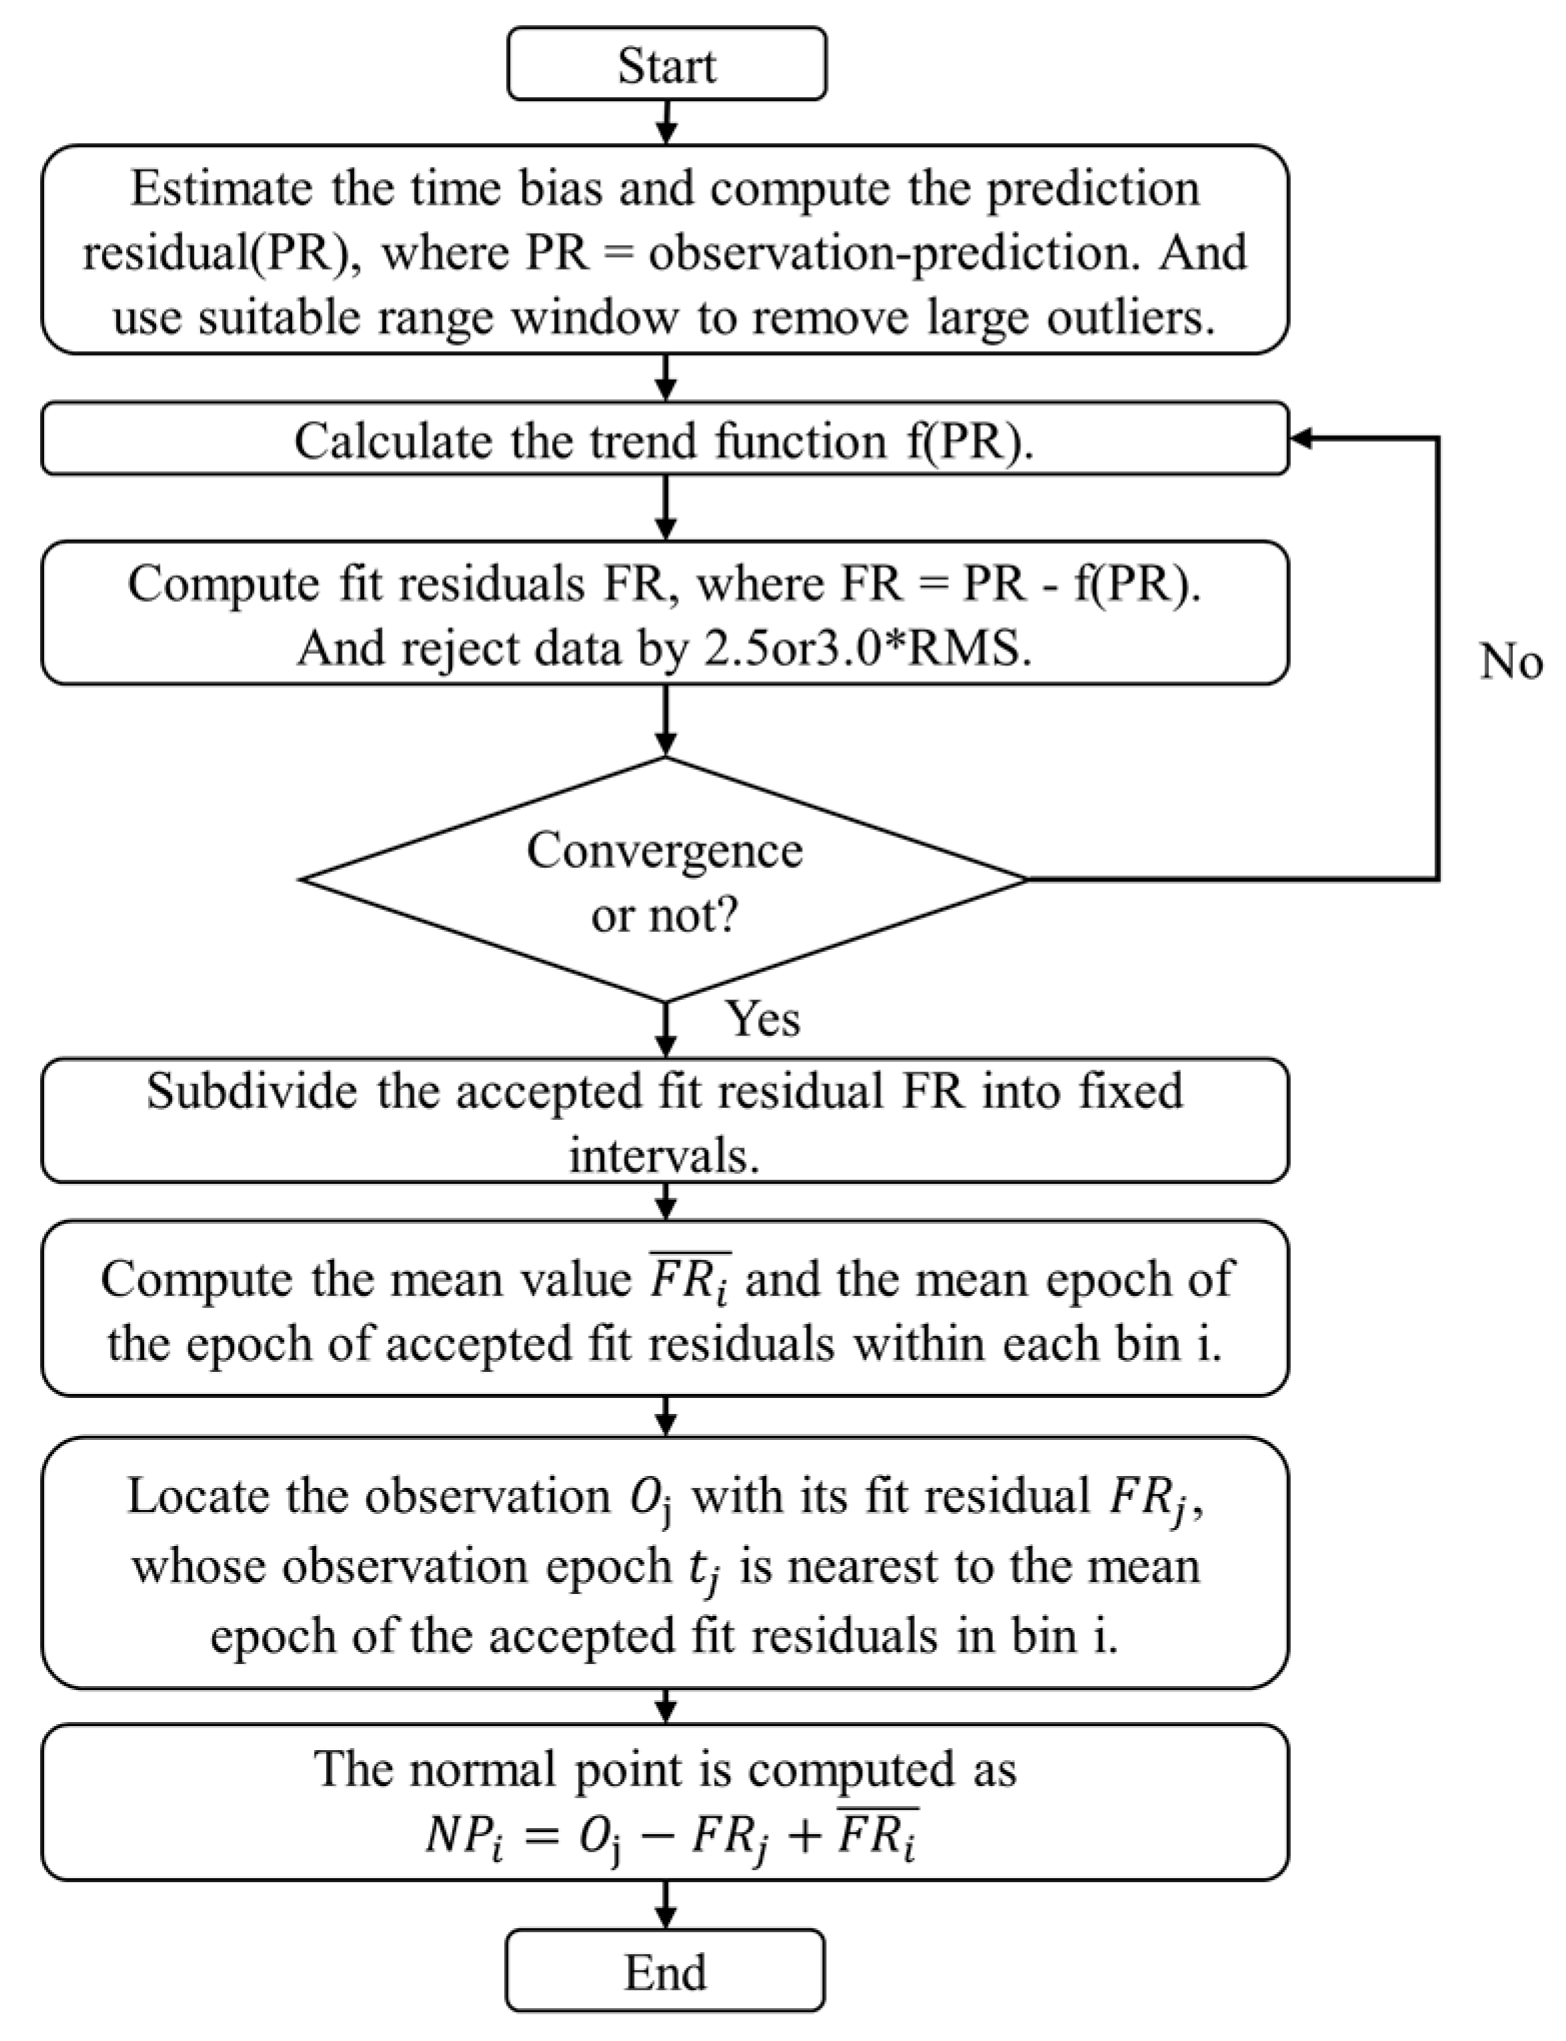
A normal point algorithm is the common method widely used in many SLR stations. As one of the cores of this algorithm, data denoising is an important guarantee for the generation of normal points.
Figure 1 illustrates the diagram of the normal point algorithm. The selection criteria of effective returns are based on the assumption that the return signal has an approximately Gaussian distribution [
12]. However, it is clearly contrary to reality because the waveform is significantly spread and deformed in time due to the satellite signature effect [
13]. So, we simulate the reflected pulse before the analysis of the data processing for SLR system.
In previous research, the return signal was calculated to be a convolution of an incident laser pulse and a satellite response [
14,
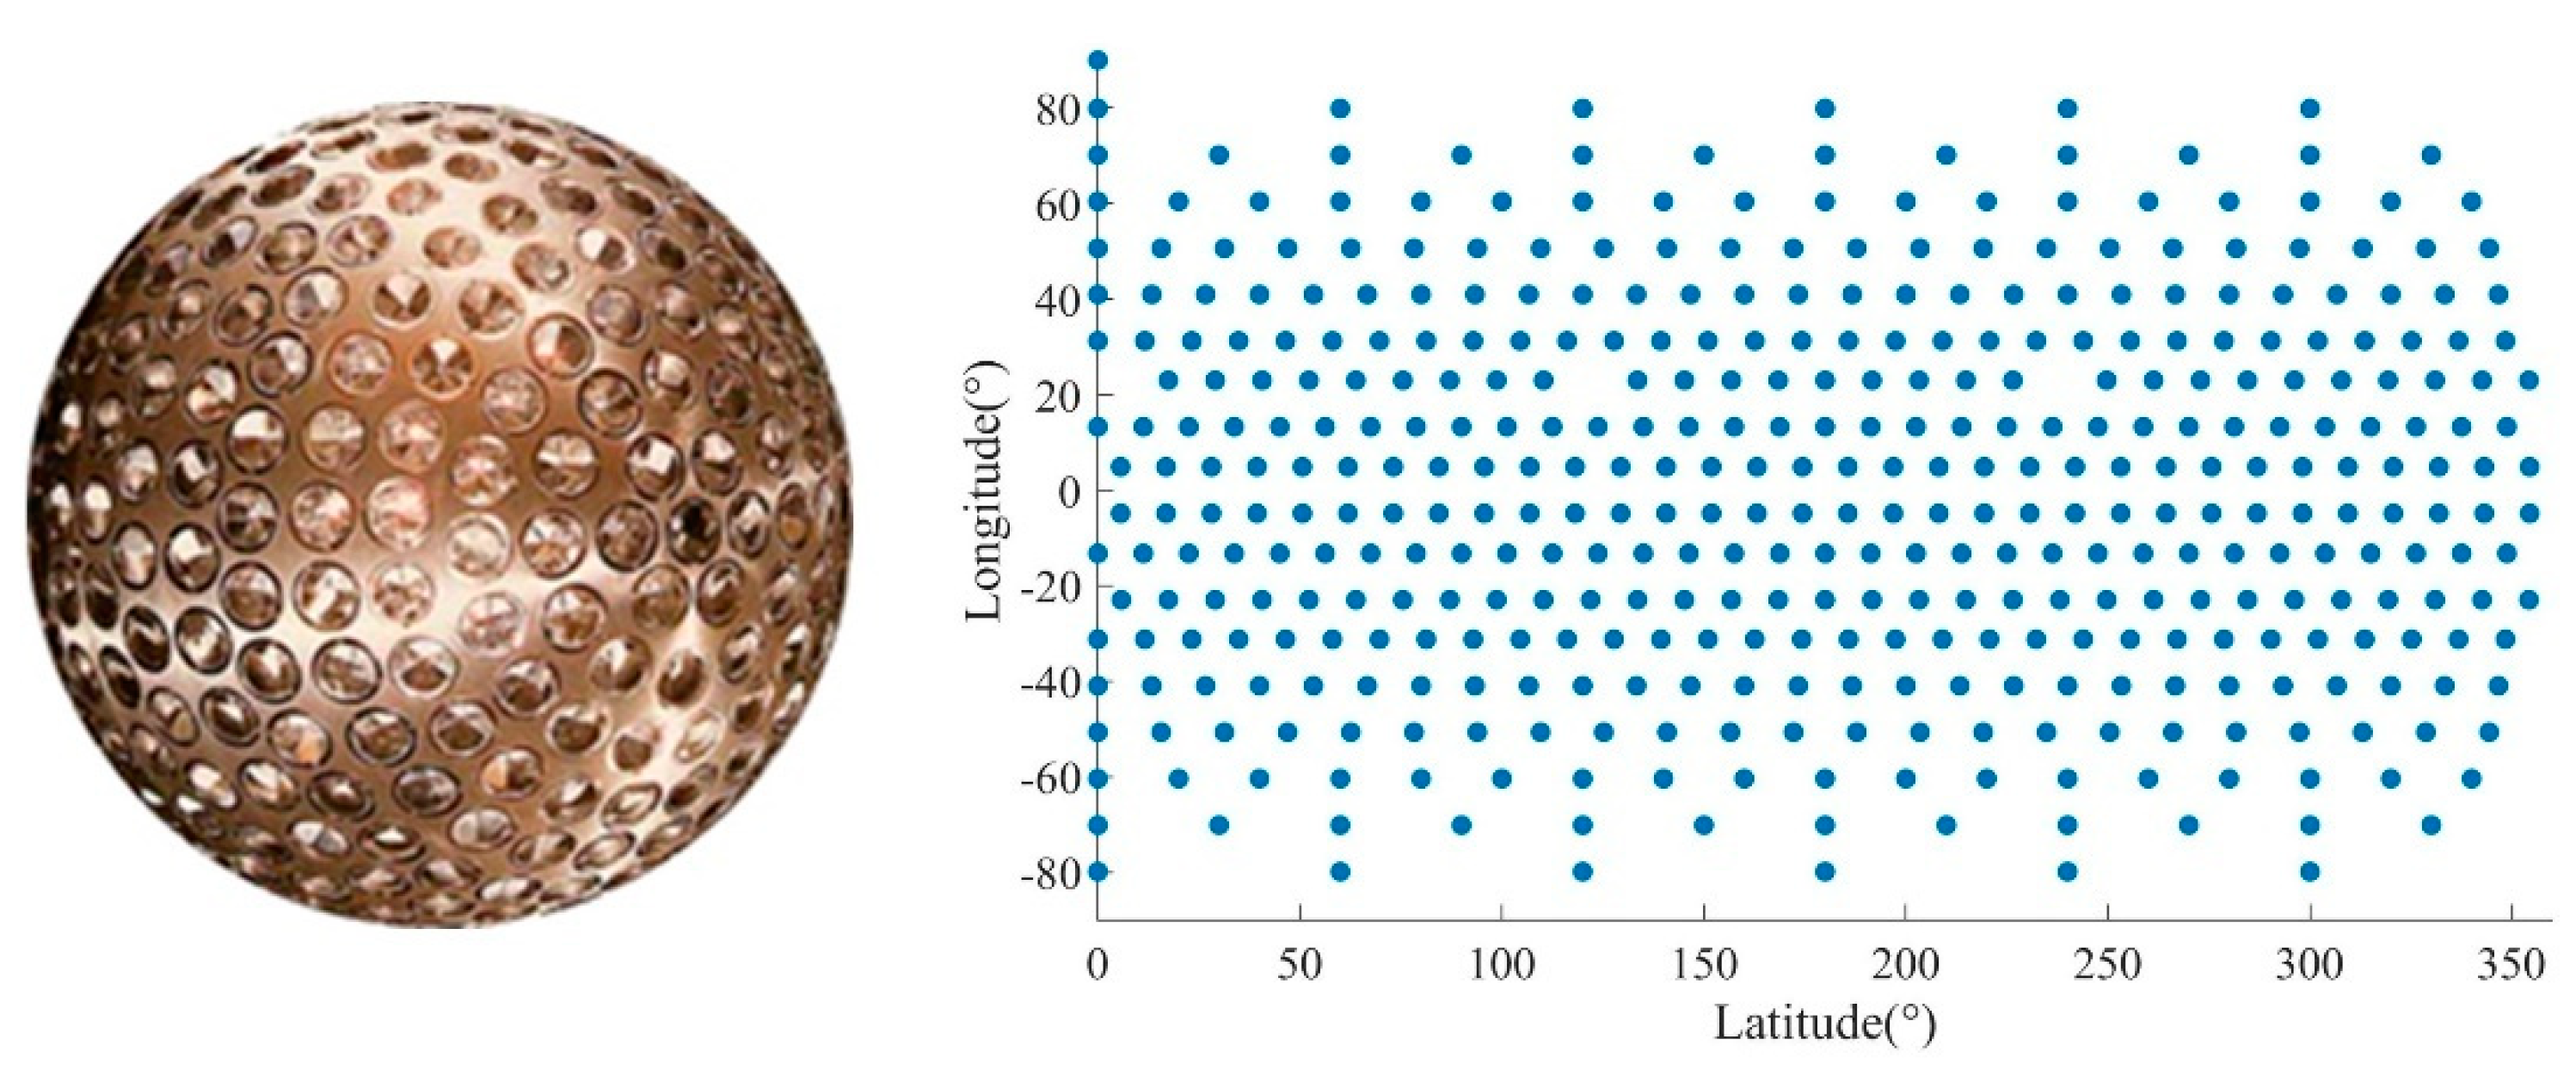
15]. The satellite was always regarded as a spherical observation target, which was supposed to be covered with the homogeneously distributed retroreflectors. However, the disposition and property of each retroreflector is different due to the technical limitations and demands. In this paper, we take LAser GEOdynamics Satellite-1 (LAGEOS-1) as an example to probe into the satellite signature effect on the ranging precision.
LAGEOS-1 was launched in 1976. The large mass and a stable relatively medium orbit makes it to be an ideal target for Changchun station to achieve single-photon (or few photon) detection. The distribution of retroreflector over LAGEOS-1 is indicated in
Figure 2 [
16].
It is obviously seen that the retroreflectors are not homogeneously distributed over the LAGEOS-1 surface. The disposition of retroreflectors at both ends are scattered while the middle is dense. The different corresponding delay for each retroreflector magnifies the distortion of the optical signal reflected by LAGEOS. Neglecting the atmospheric scattering and far-field diffraction, the reflection efficiency of a single retroreflector
can be modelled by effective reflection area
and reflectance
:
The effective reflection area
is a function of the laser incidence angle
, which can be expressed as [
17]:
The retroreflectors of the LAGEOS-1 have no reflective coating on the back face. This causes the reflectance
to be related to incidence angle
and azimuth angle
. This paper uses reflectance data from Arnold’s research [
18]. The relative time delay
of each retroreflector can be written as [
14]:
where
is the refraction index of a retroreflector,
is the radius from the satellite center to the surface of retroreflector,
is the distance from the vertex to front face.
According to the description of Retroreflector array structure of LAGEOS in Arnold’s research [
18], the function of incidence angle
and azimuth angle
can be expressed by the laser incidence vector direction
:
is the direction vector of a retroreflector which is related with its arrangement, is the setting angle of a retroreflector, and is the pole direction.
The changing polarization effect and inference between each return signals are ignored. The energy density of a single retroreflector
is calculated as:
represents the incident laser beam energy density, which has a distribution of a standard Gaussian shape. The total energy density of returned pulse is written as:
The value of is 0.425 × full width at half maximum (FWHM), and is the number of the retroreflectors contributing to the reflection.
For convenience of calculation, the background noise is neglected. The probability density function
of SLR data distribution can be modeled as a convolution of system error function
, return pulse function
, and single-photon avalanche diode (SPAD) time jitter
[
19,
20]:
For the convenience of calculation, the error distribution
,
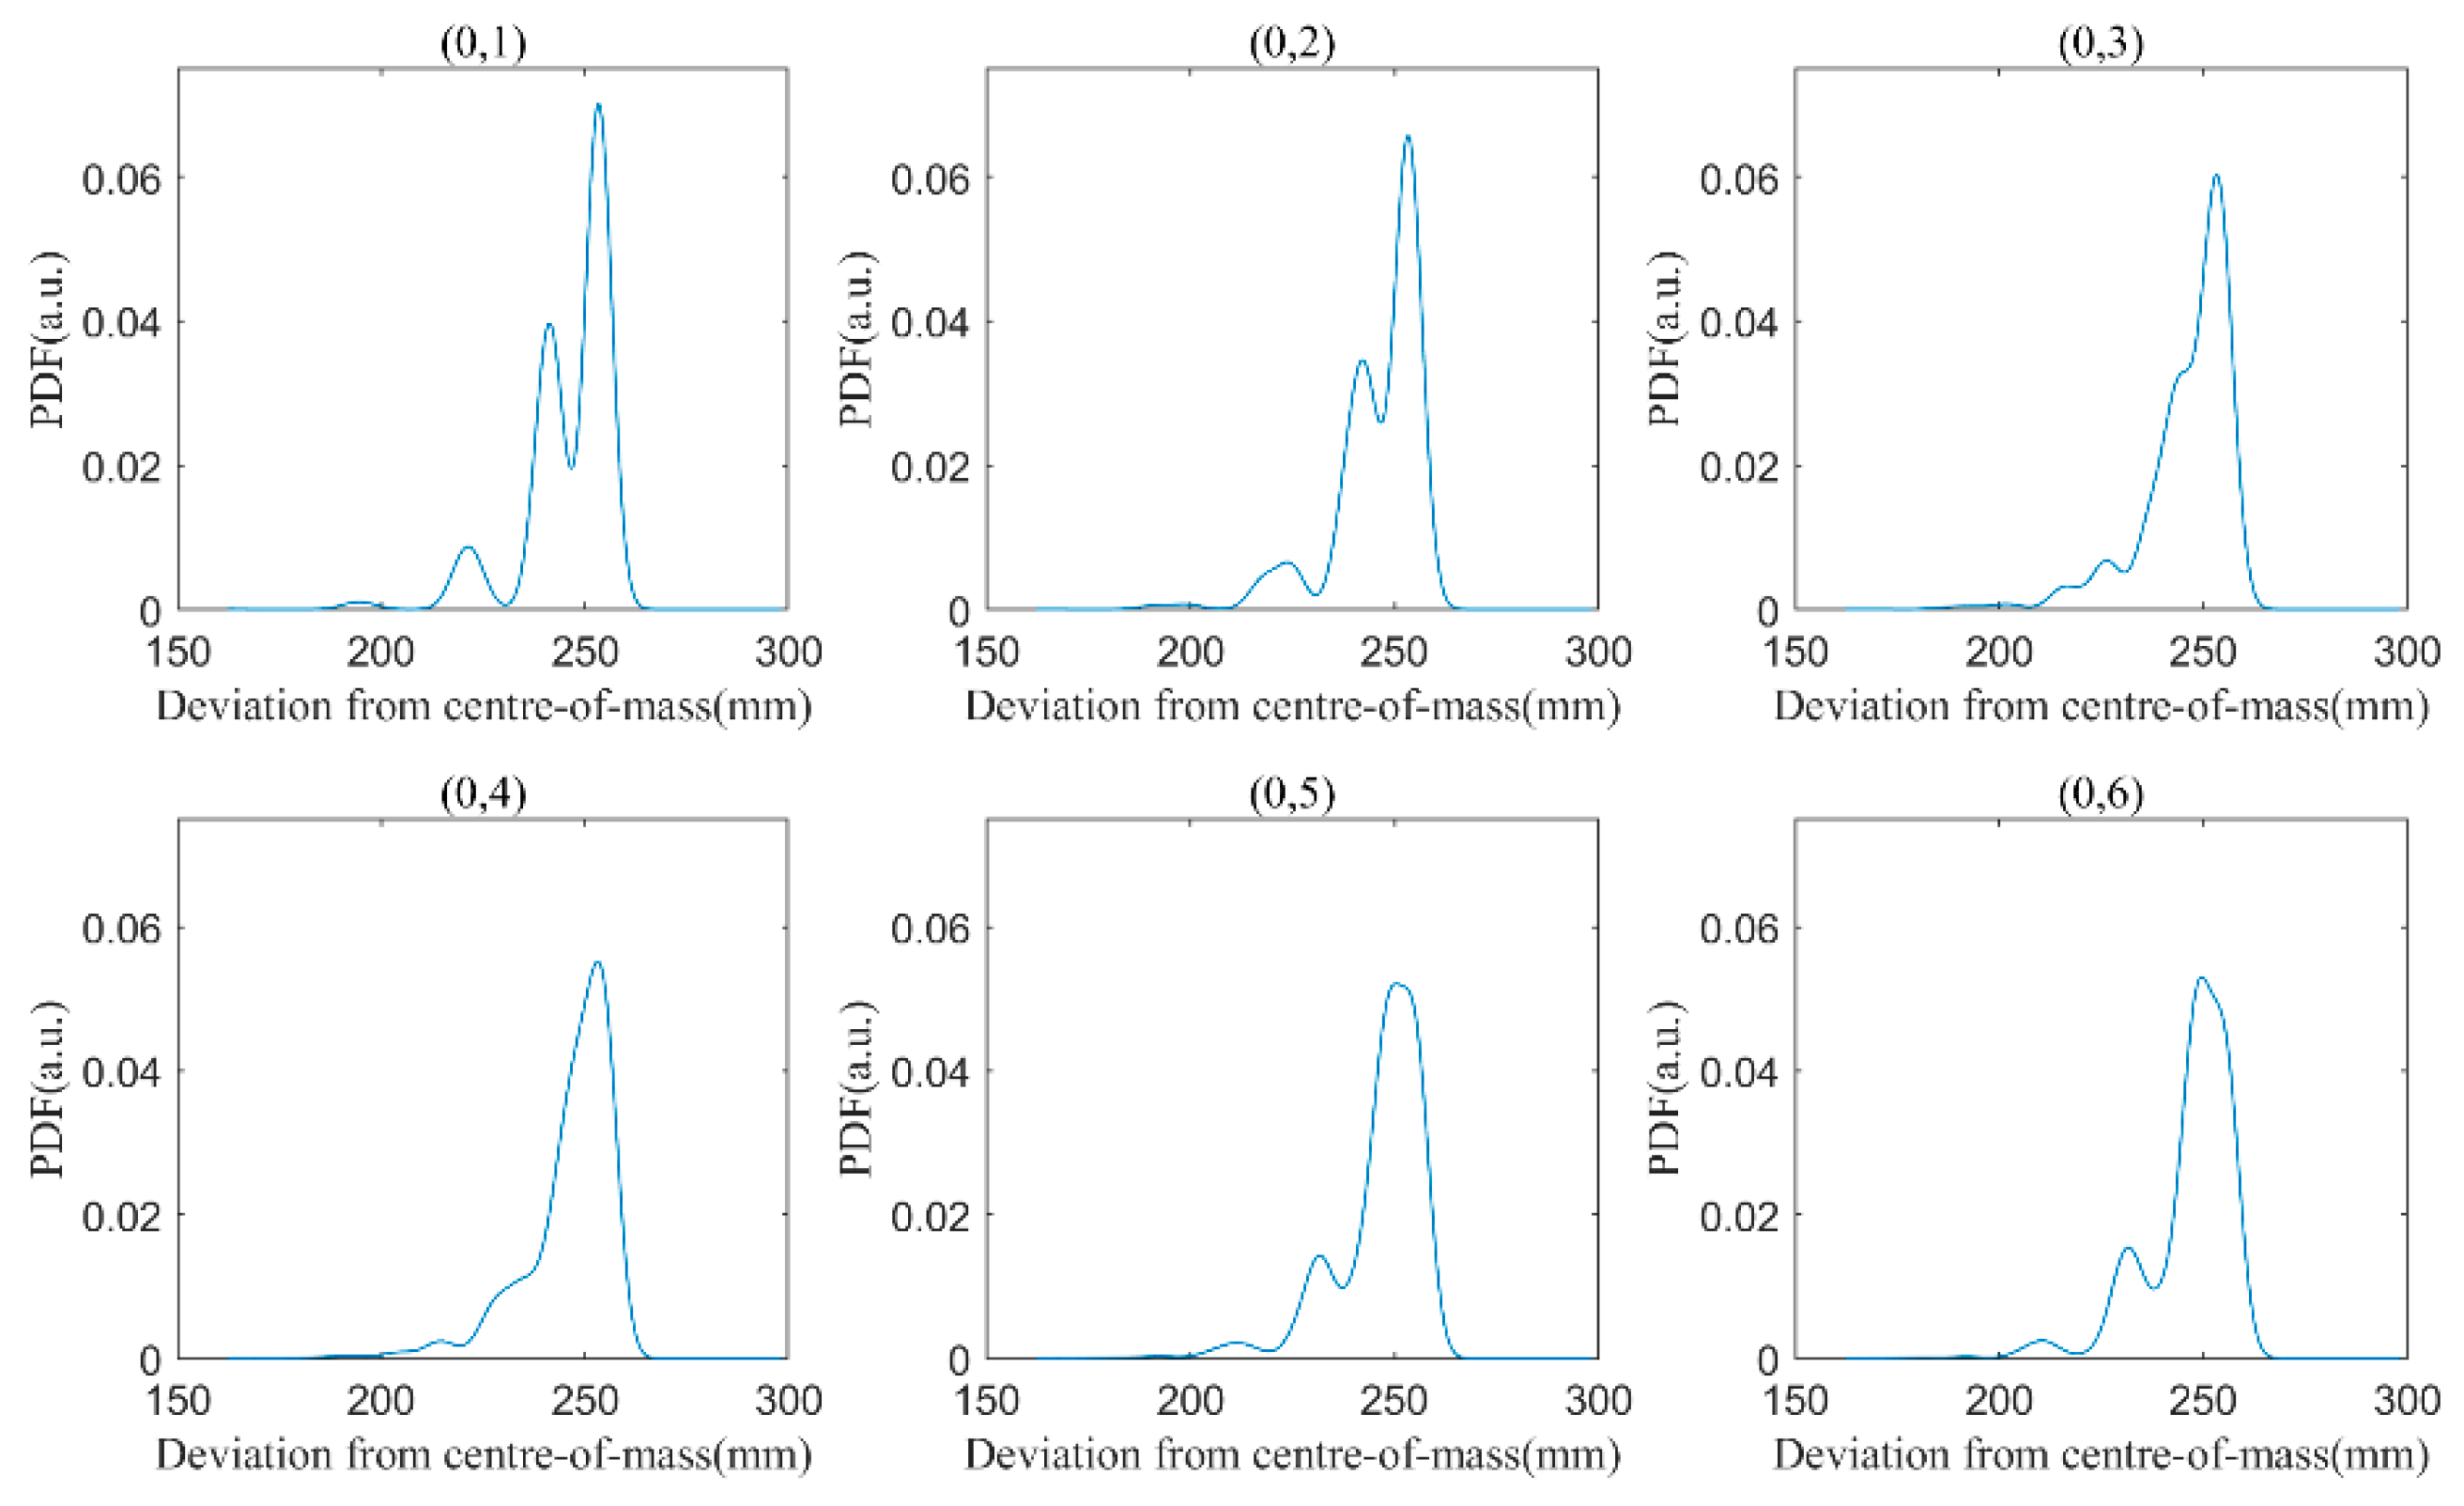
is simplified to Gaussian distribution. The waveform of a reflected pulse for different incident angles are simulated by the parameters of Changchun station, and parts of them are plotted in
Figure 3. It can be seen that the return pulse has evolved from a standard Gaussian shape to be an asymmetric distribution. The reflected intensity will change when the incident laser pulse glides across the surface of LAGEOS-1. At some specific direction, the temporal shape of the return signal even presents multi-peaks and skewed with a long tail.
According to the prediction provided by NASA GSFC SLR Mission Contractor, the relative rotation velocity between LAGEOS-1 and Changchun station is about 1.4–4.7 deg per second and the arc length of one observation for Changchun station is about 10–20 min. This means that the incident angle of laser pulse for one observation can be regarded as a constant and the corresponding waveform of reflected signal is stable. However, for several weeks or even several months, the long-term residual histogram of LAGEOS-1 is always considered as a superposition of each obtained observation datum from all the incident directions, which will indicate the comprehensive influence of satellite signature effect on the statistical characteristics of observation data.
On this basis, we first simulate the reflected signal for 2594 directions, then follow the steps in the normal point algorithm (see in
Figure 1 to set the acceptance level for normal points. Finally, we sum up the pre-processed results to obtain the long-term fit residuals distribution, in order to complete the simulation of the pre-processing for the SLR system.
In this simulation, the polynomial fitting and the generation of fit residuals is simplified without considering other error sources. It can be expressed as:
where
is the distribution of fit residuals. The rejection of 2.5 × RMS is written as:
is the standard deviation of . Then, Equations (9) and (10) are iterated until the process converges to obtain the residual histogram processed by normal point algorithm.
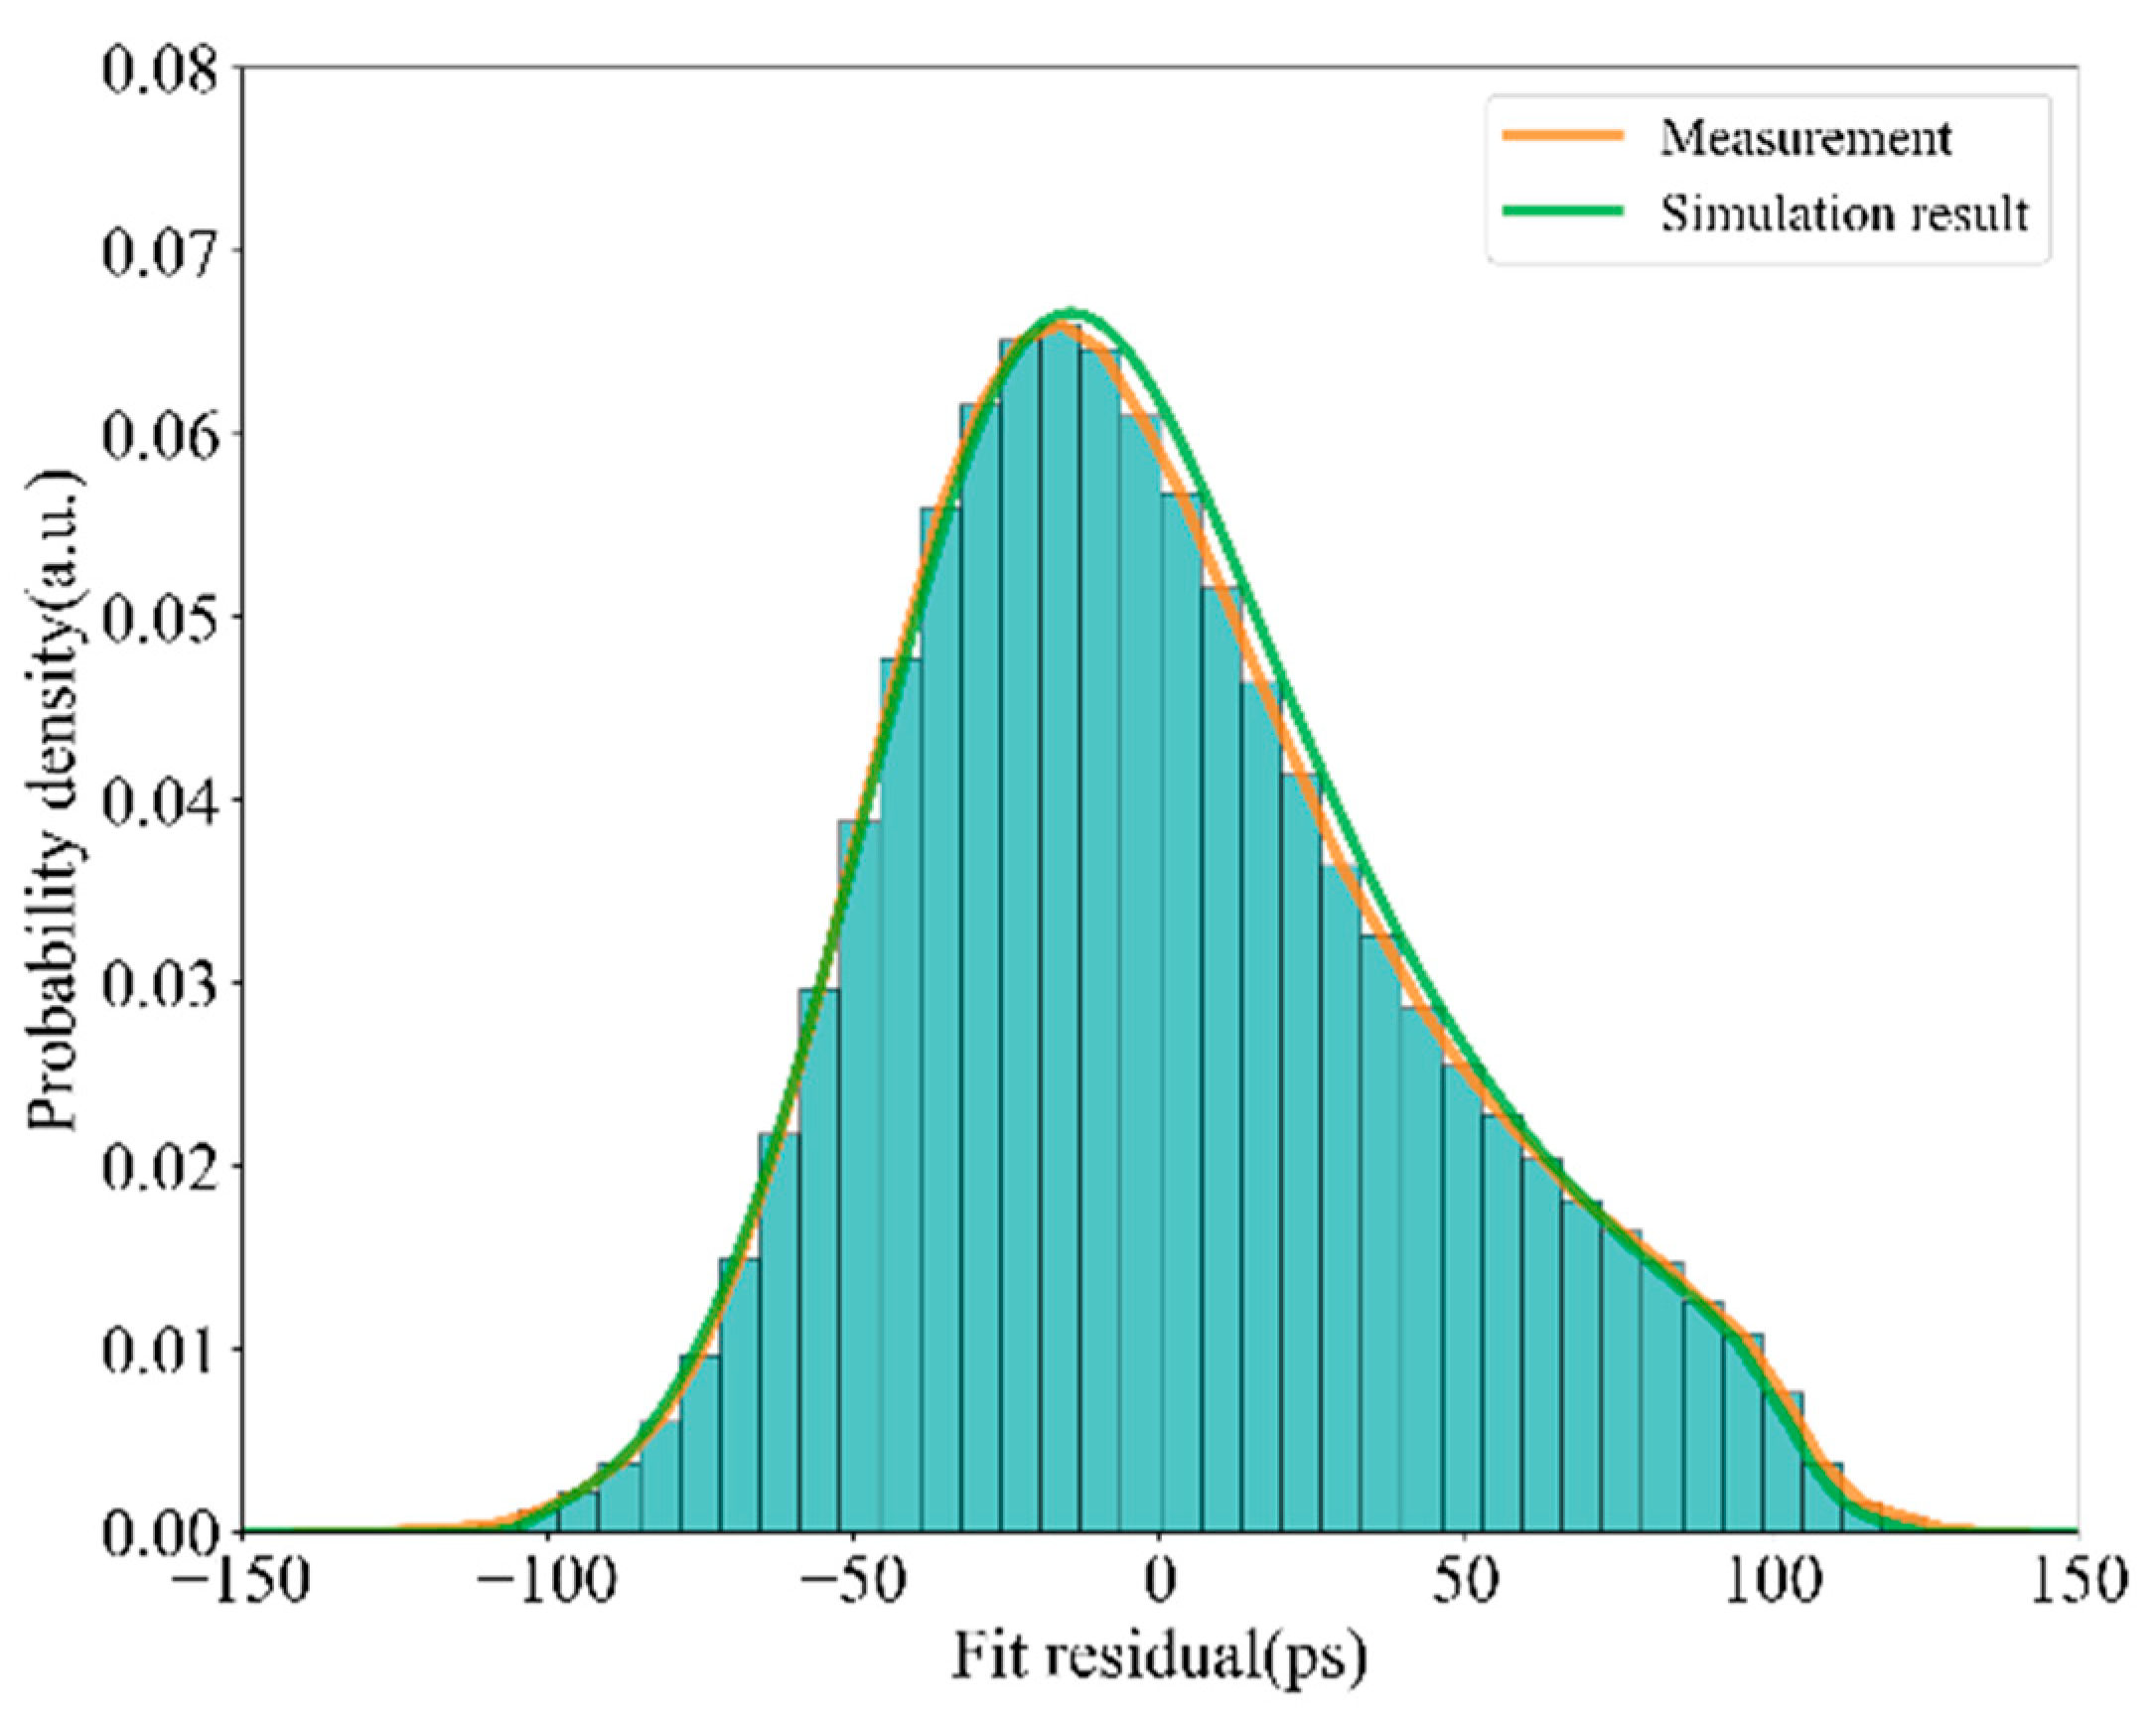
To verify the effectiveness of the above simulation, we compare the numerical simulation result with the observation data provided by Changchun station (see in
Figure 4). The Pearson correlation coefficient of these two long-term full rate residual profiles is calculated to be 0.98, which means the simulation based on the revised satellite signature effect can accurately reflect the long-term distribution of the returned signal.
3. New Clipping Algorithm Based on Satellite Signature Effect
The long tail and obvious noise points of the return signal can be eliminated effectively by a normal point algorithm, but there remains some distortion at the front and back edge (see
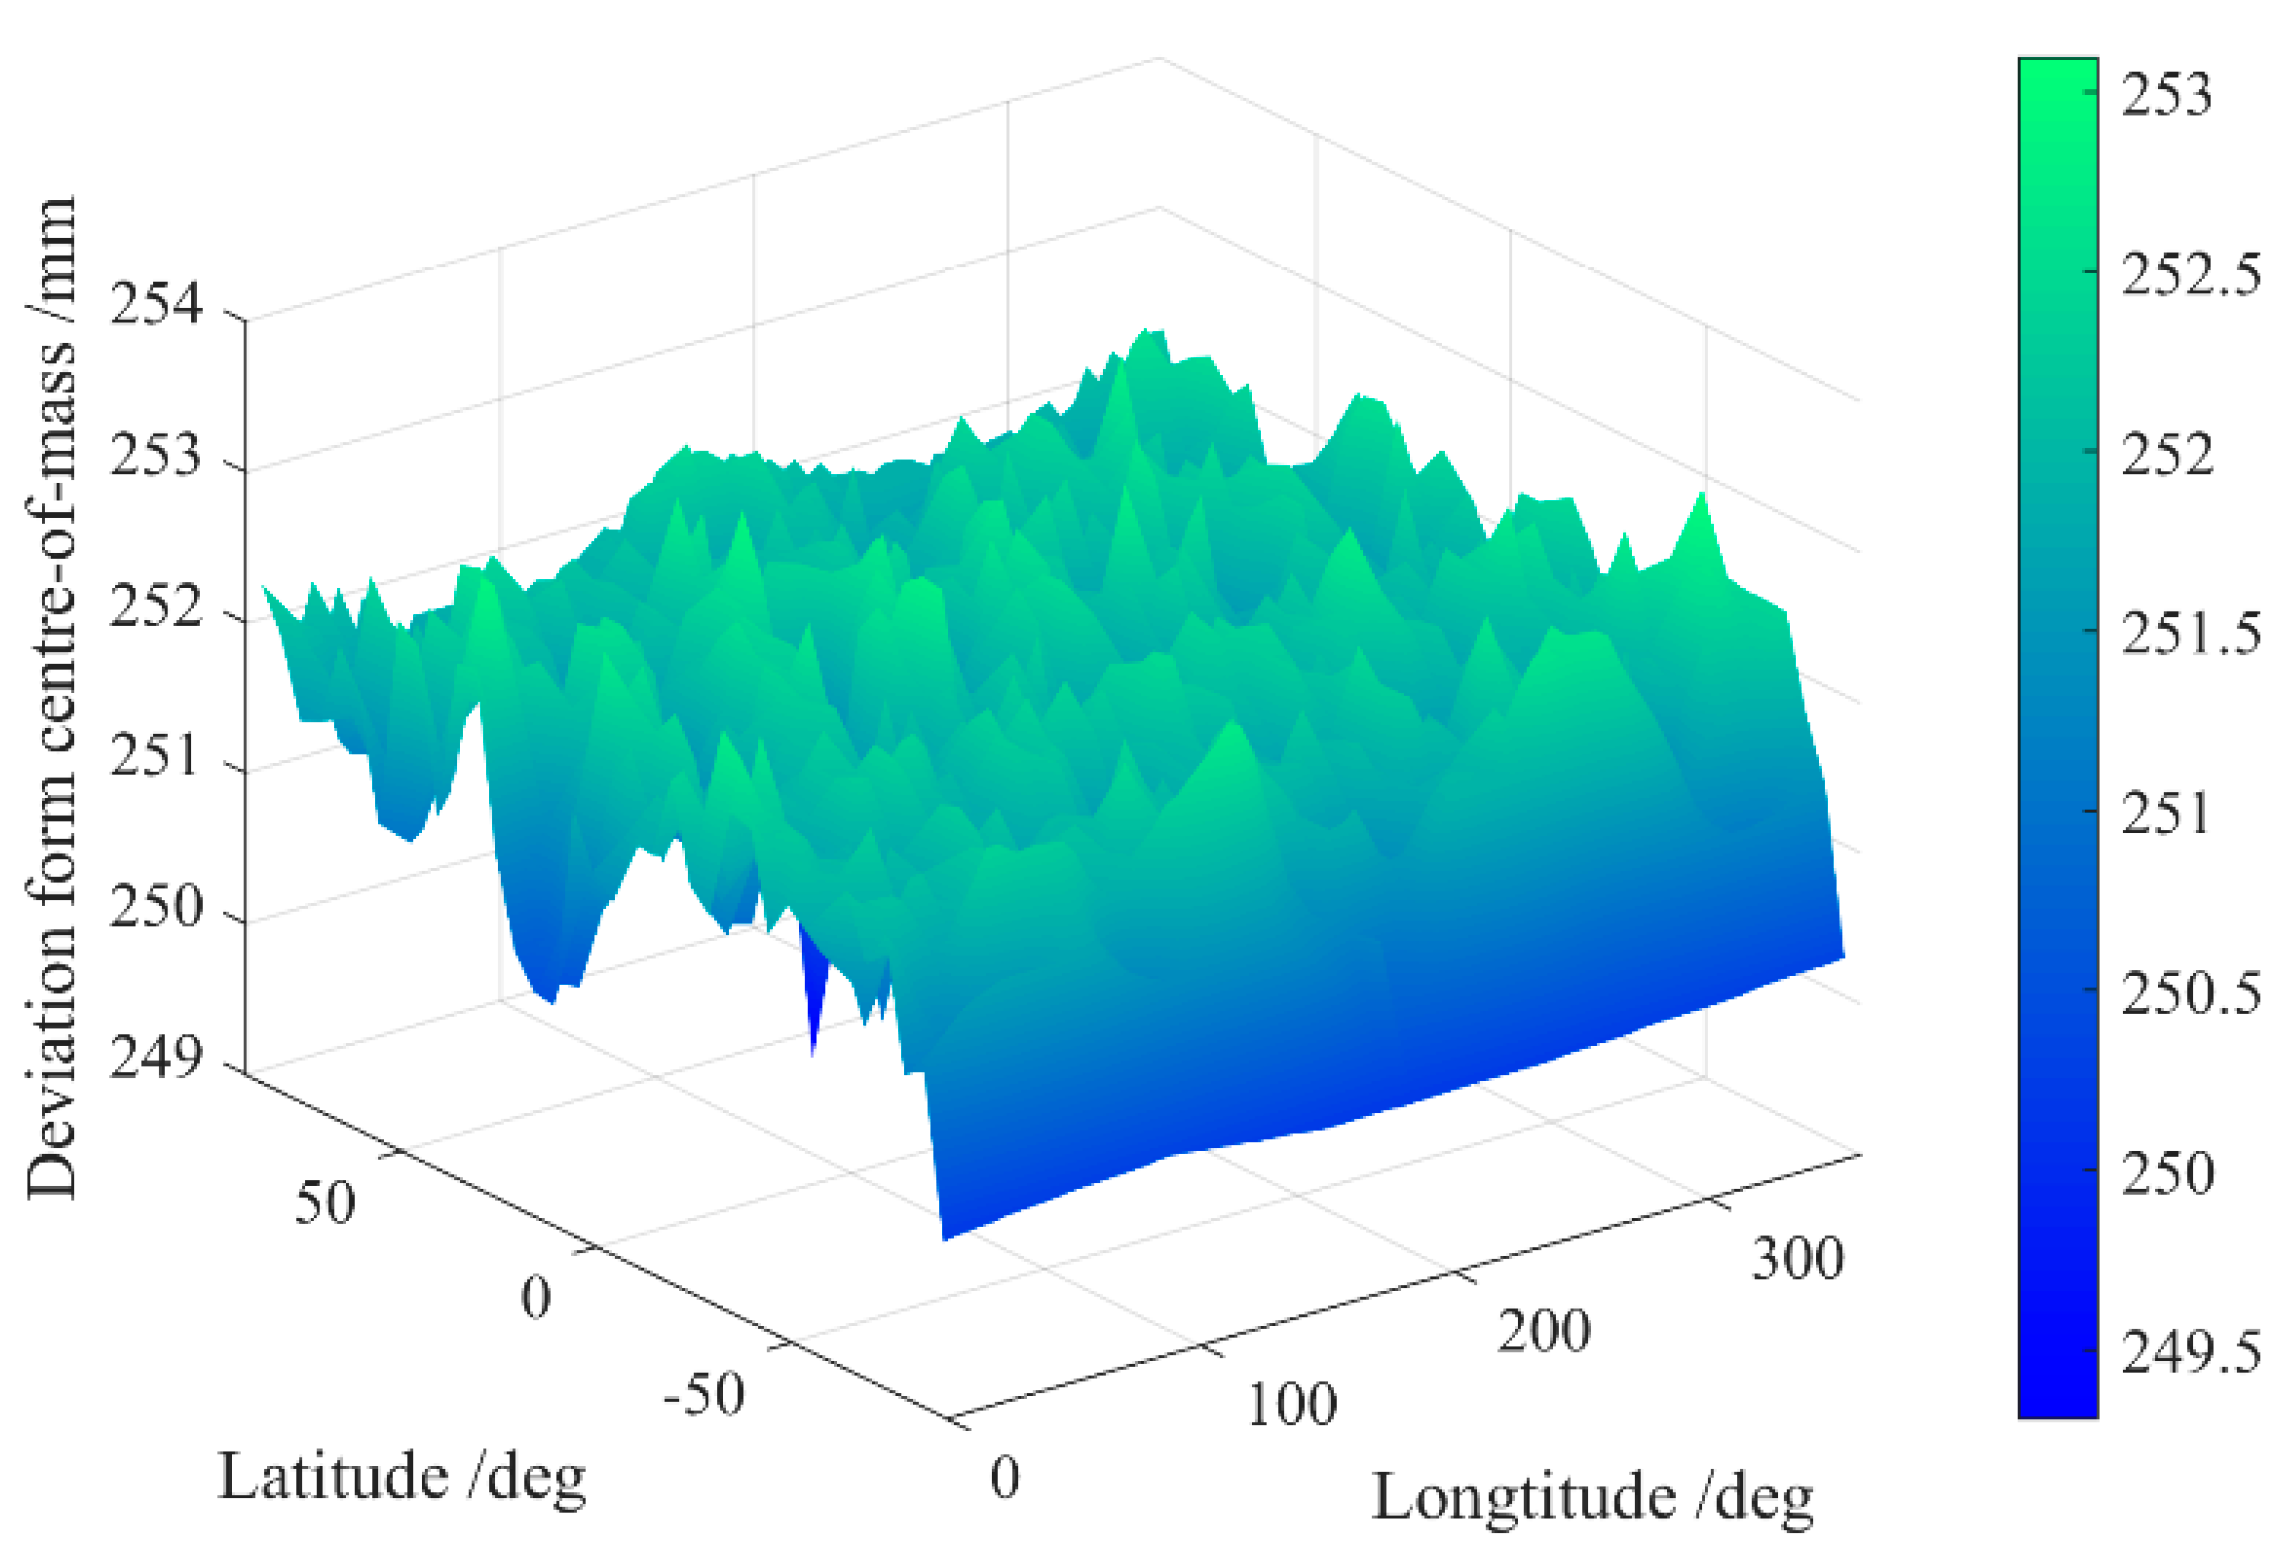
Figure 5). We calculate the center of mass (CoM) of the pre-processed echo signal for different incident angles and find that it is not constant or stable when the observation data are processed by normal point algorithm.
Figure 5 plots the variation of the CoM of the reflected signal from different incident laser direction. The RMS of mean value is 0.48 mm and the difference between the maximum and minimum can reach up to be 3.79 mm. These results illustrate that a normal point algorithm can reduce the long-term effect of satellite signature on reflected signal but not erase the instability of SLR data distribution introduced by the variation of satellite signature effect for each observation.
The main factors causing this phenomenon is that the observation arcs for each observation is different and the relative rotation velocity of LAGEOS-1 to the terrestrial station is variable. When the observation period is very short or the relative position of the satellite moves slightly, the waveform for each observation will not change greatly and the center of the fit residuals will not be far from the average value. However, when the observation period is too long or the observation is interrupted by clouds or other shelters, the polynomial fitting in normal point algorithm cannot describe the fluctuation of the reflected waveforms, and the mean value of fit residuals in fixed bin will not be stable anymore.
In order to further minimize the short-term satellite signature effect and improve the stability of the observation data, a new clipping method is proposed for SLR data processing. First, we use the mean value of the long-term fit residuals distribution instead of the leading edge as the fixed reference point for normal points. This is because the return pulse intensity for each observation in Changchun station is unstable, which makes the identification of the leading edge difficult. So, we rewrite the Equation (10) as:
where
r is the distance between the clipping location from the reference point. Based on the Equations (9) and (11), the distribution of fit residuals and the corresponding CoM are calculated at different acceptance levels by adjusting the value of
r.
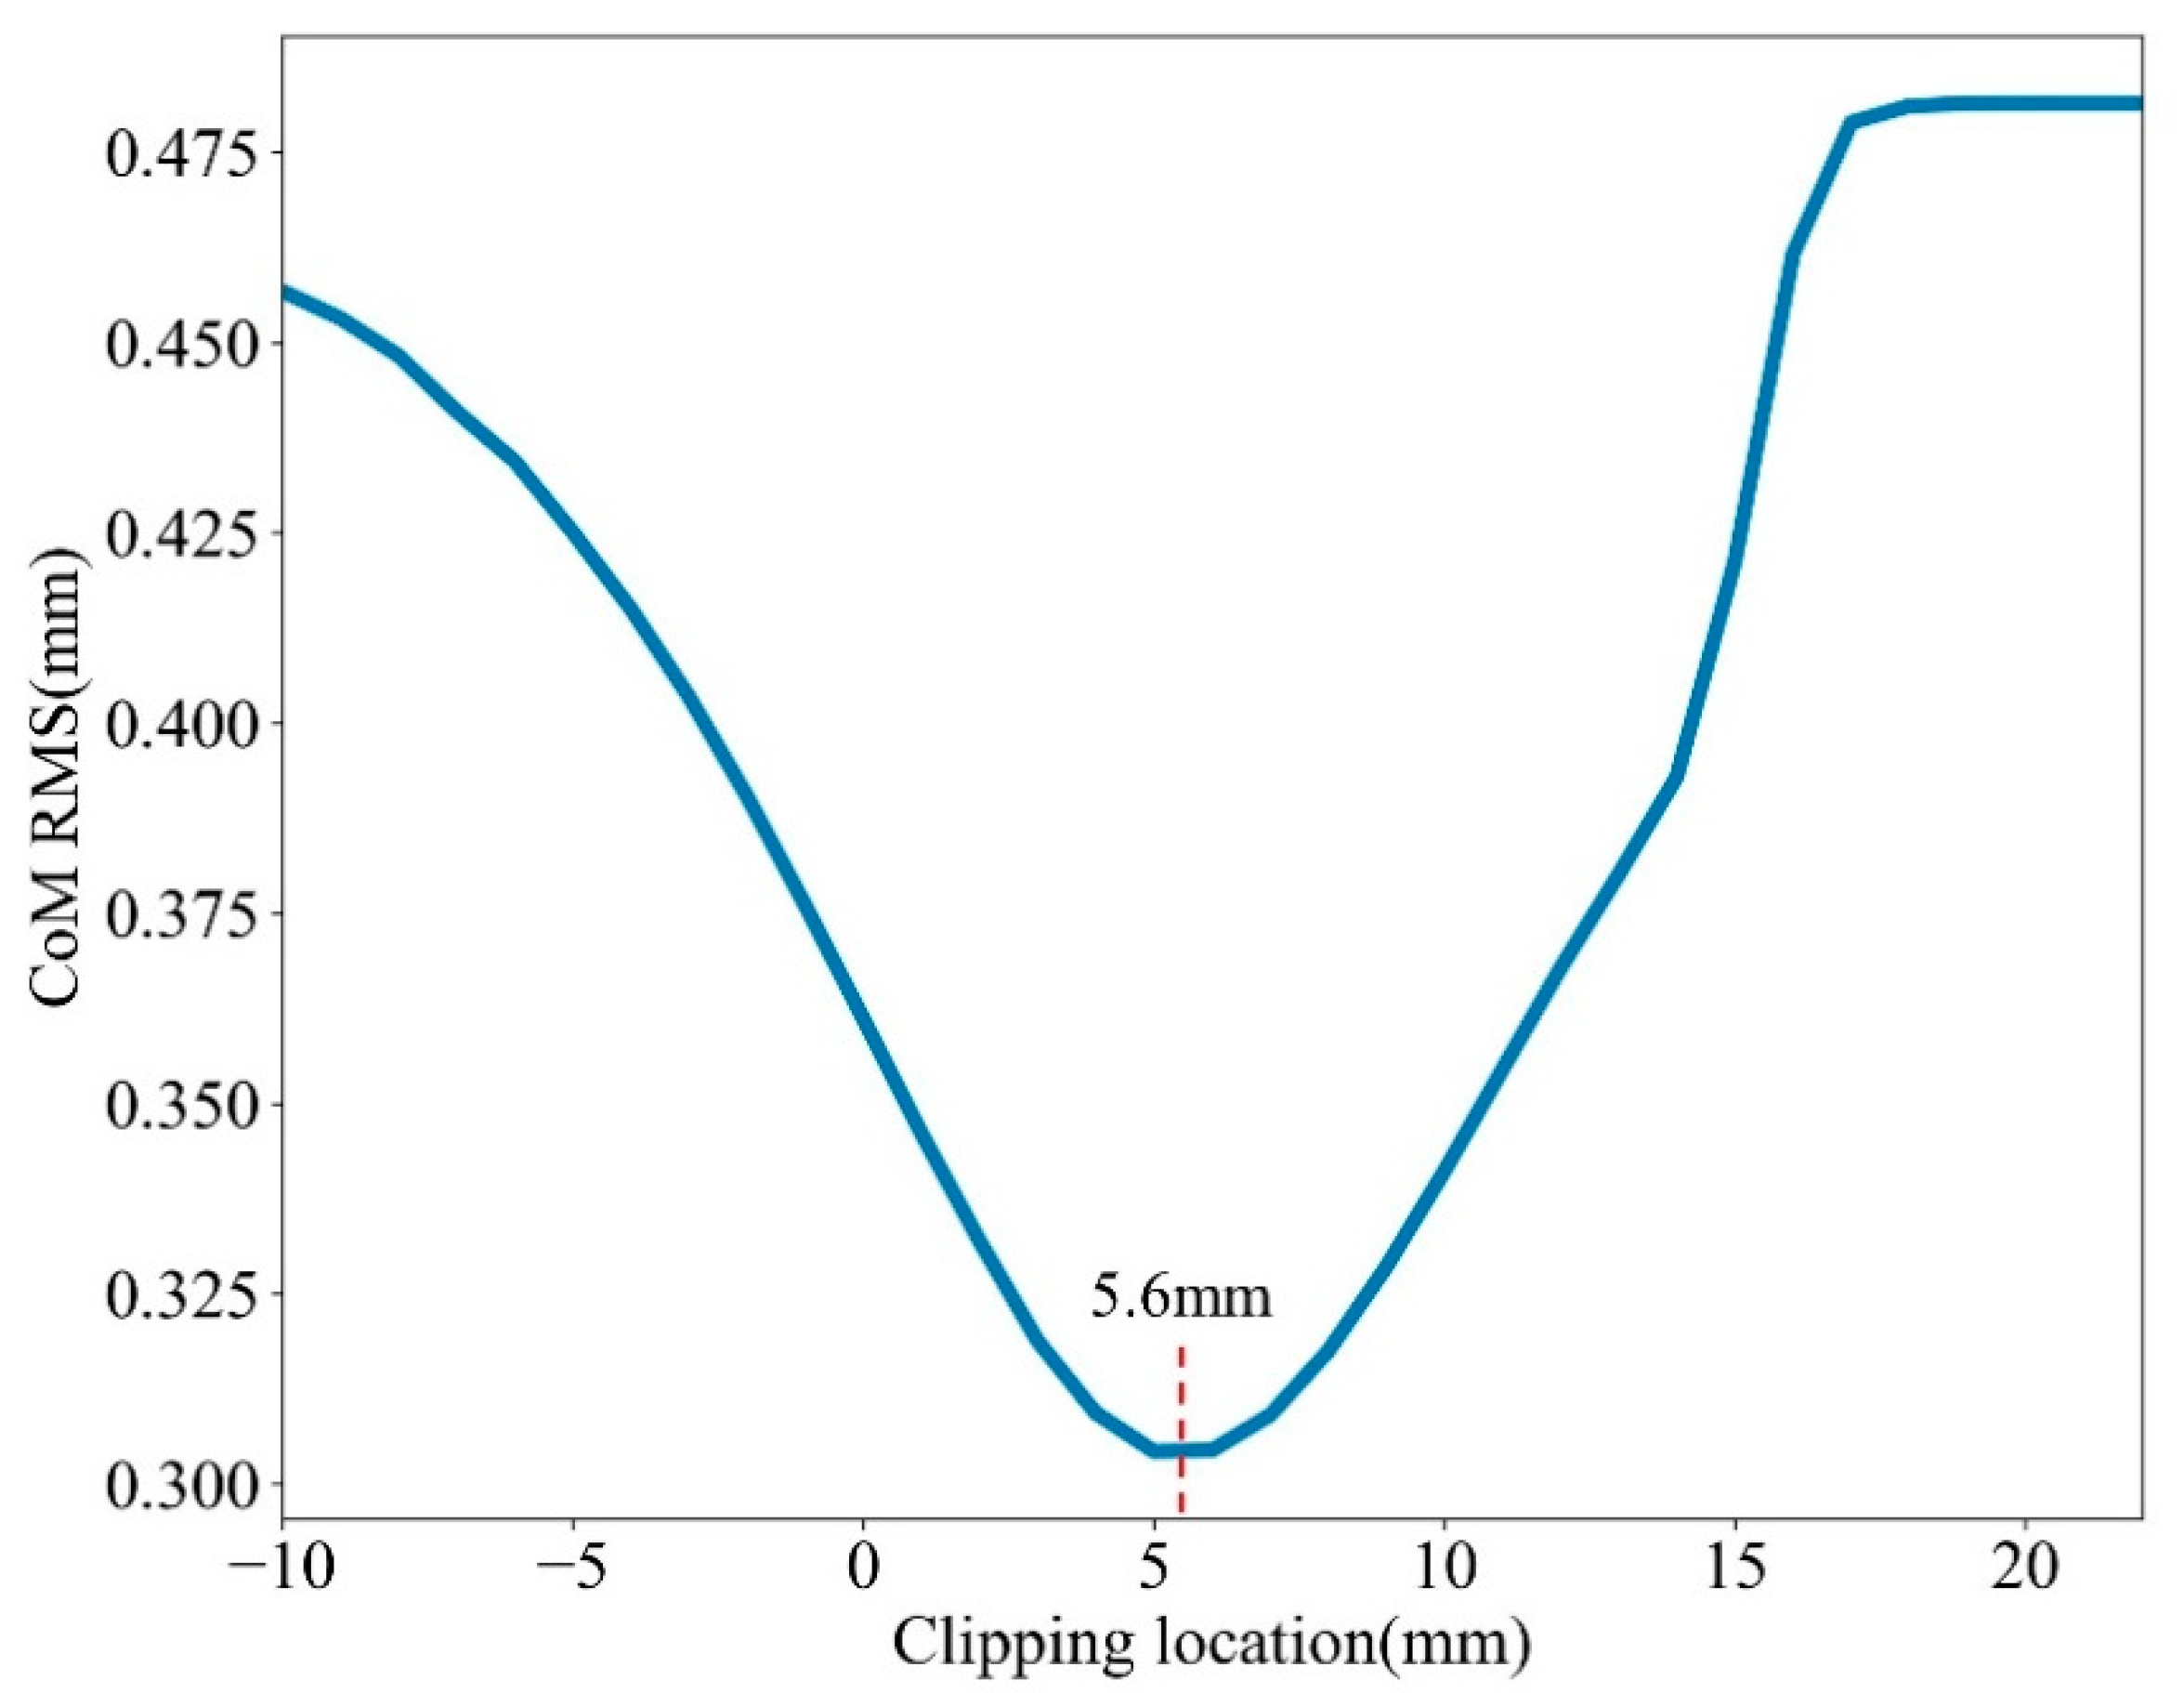
Figure 6 shows the relationship between clipping location and mean value RMS of CoM. Due to the distortion at the front and back edge of the fit residuals distribution, the curve of mean value RMS presents to be concave. We define the minimum (5.6 mm) in the curve as the clipping location in the new method to reduce the system error introduced by the variation of satellite signature effect for short-time and obtain the best stability of observation data.
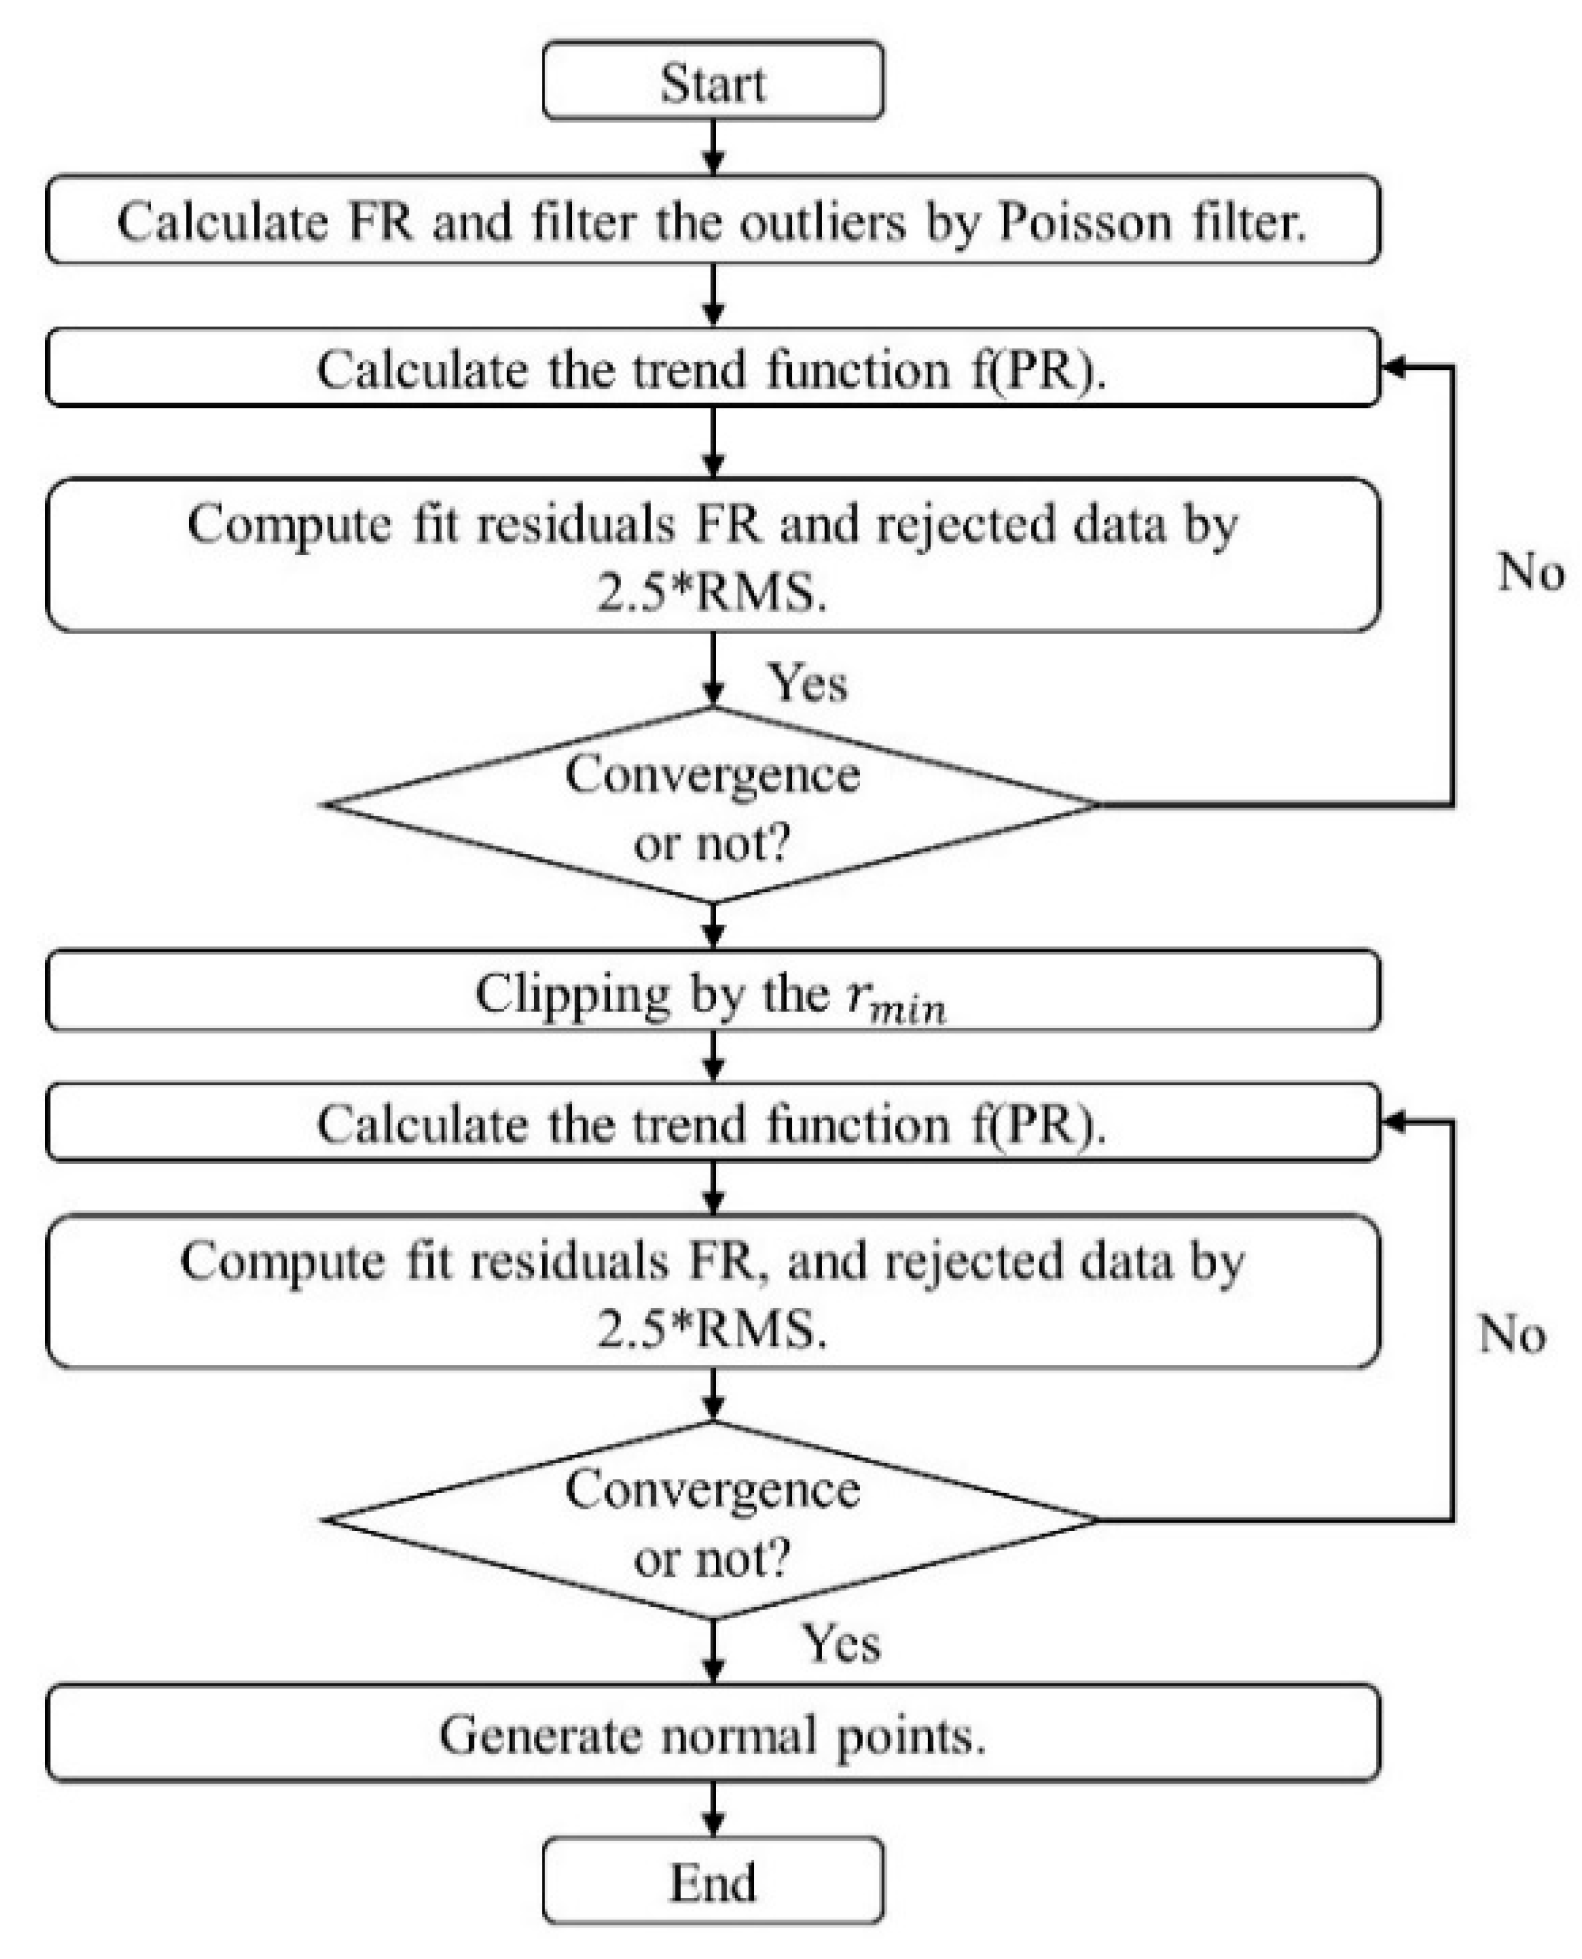
The flow chart of the clipping method is indicated in
Figure 7. The new algorithm differs from the conventional SLR data processing in two main respects. First, Poisson filter is used to extract more valid observation data to ensure the reflected waveform to be close to the theoretical result [
21]. Second, the normal points are generated based on the range residuals which lay between the fixed reference point and the clipping location. In addition, the rejection by 2.5 × RMS is repeated again after clipping the tail data to reduce the noise of the leading edge and makes the results more concentrated and stable.
4. Results and Discussion
The clipping method is applied for the observation data provided by Changchun station.
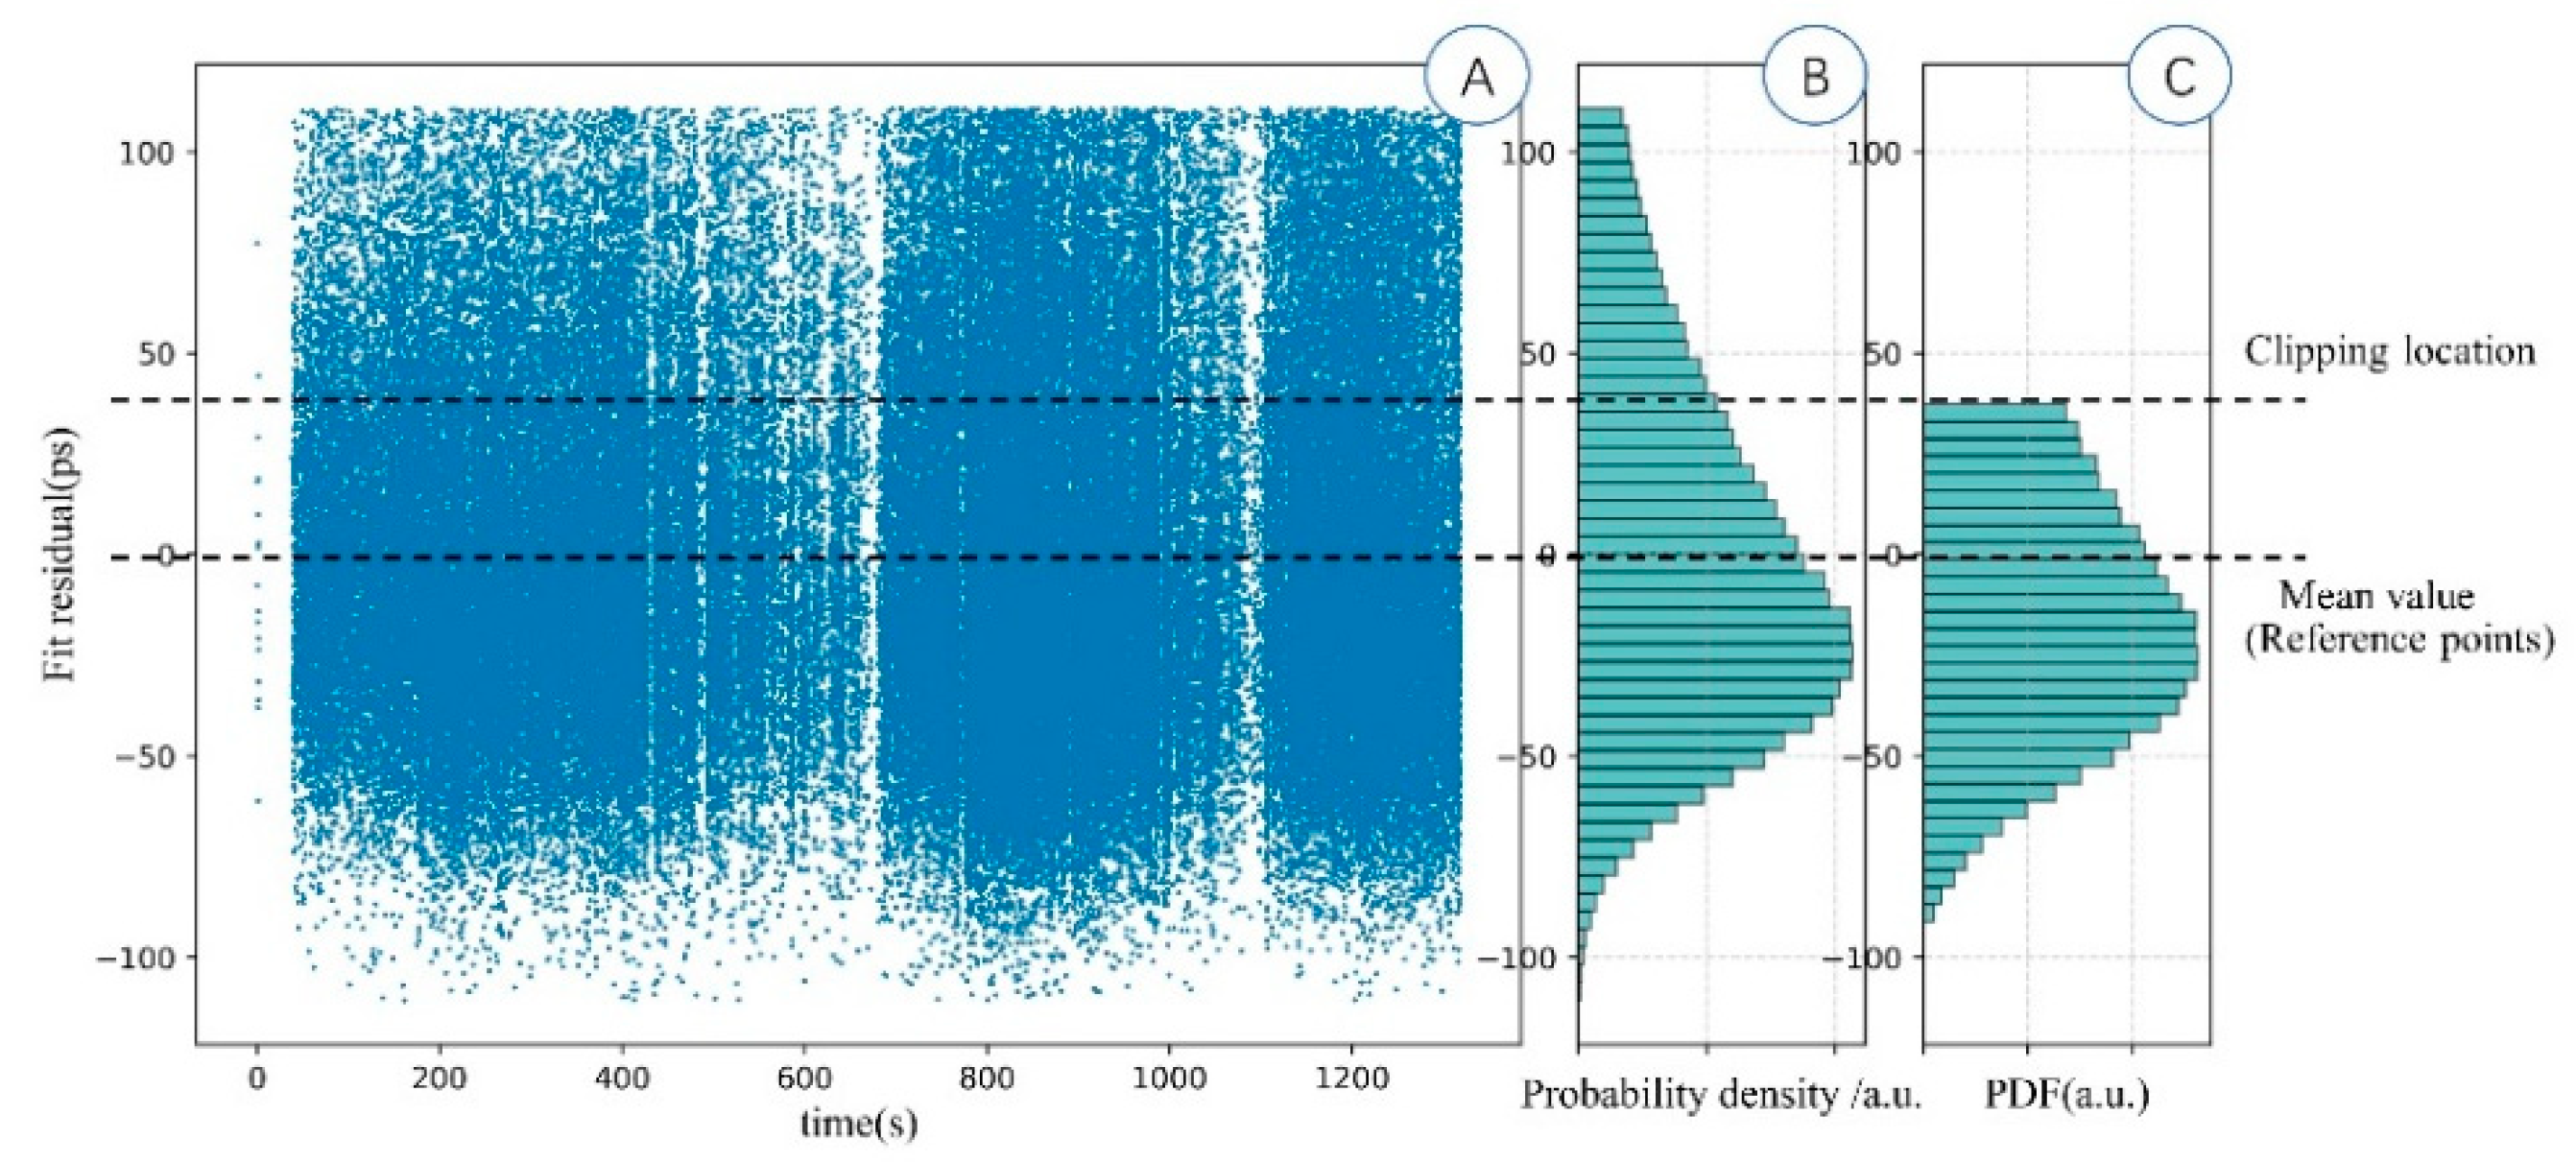
Figure 8 shows the main data processing of the clipping method for LAGEOS-1 observation points for January 2021.
Figure 8A presents the distribution of range residual accepted by Poisson filter and rejection of 2.5 × RMS. It is obviously seen the density distribution of fit residual is not homogeneous. The leading-edge density for a fixed bin is variable but the mean value of the long-term range residual is stable, which is in agreement with the previous theoretical results.
Figure 8B is the histogram of the preliminary processed range residual distribution. Due to the application of the Poisson filter in the clipping method, larger numbers of ranging data are maintained, which increase from 108,864 to 140,534, and the tail of residual distribution is almost preserved, which is closer to the simulated distribution.
Figure 8C demonstrates the distribution of the selected range signals lay between the reference point and clipping point. The result shows the distribution of fit residuals proceeded by the more centralized clipping method, while both the unstable leading edge and distorted tail of observation data were dramatically reduced.
Table 1 shows the average statistical results of LAGEOS-1 produced by these two different SLR data pre-processing methods. Compared to a normal point algorithm, the property of observation data is obviously improved. The RMS per NP of LAGEOS-1 obtained by the clipping method is reduced from 62.90 ± 9.9 mm to 56.07 ± 4.69 mm, and the stability of RMS is improved by 53%. Meanwhile, the stability of skewness and Kurtosis for LAGEOS-1 are also improved in different degrees.
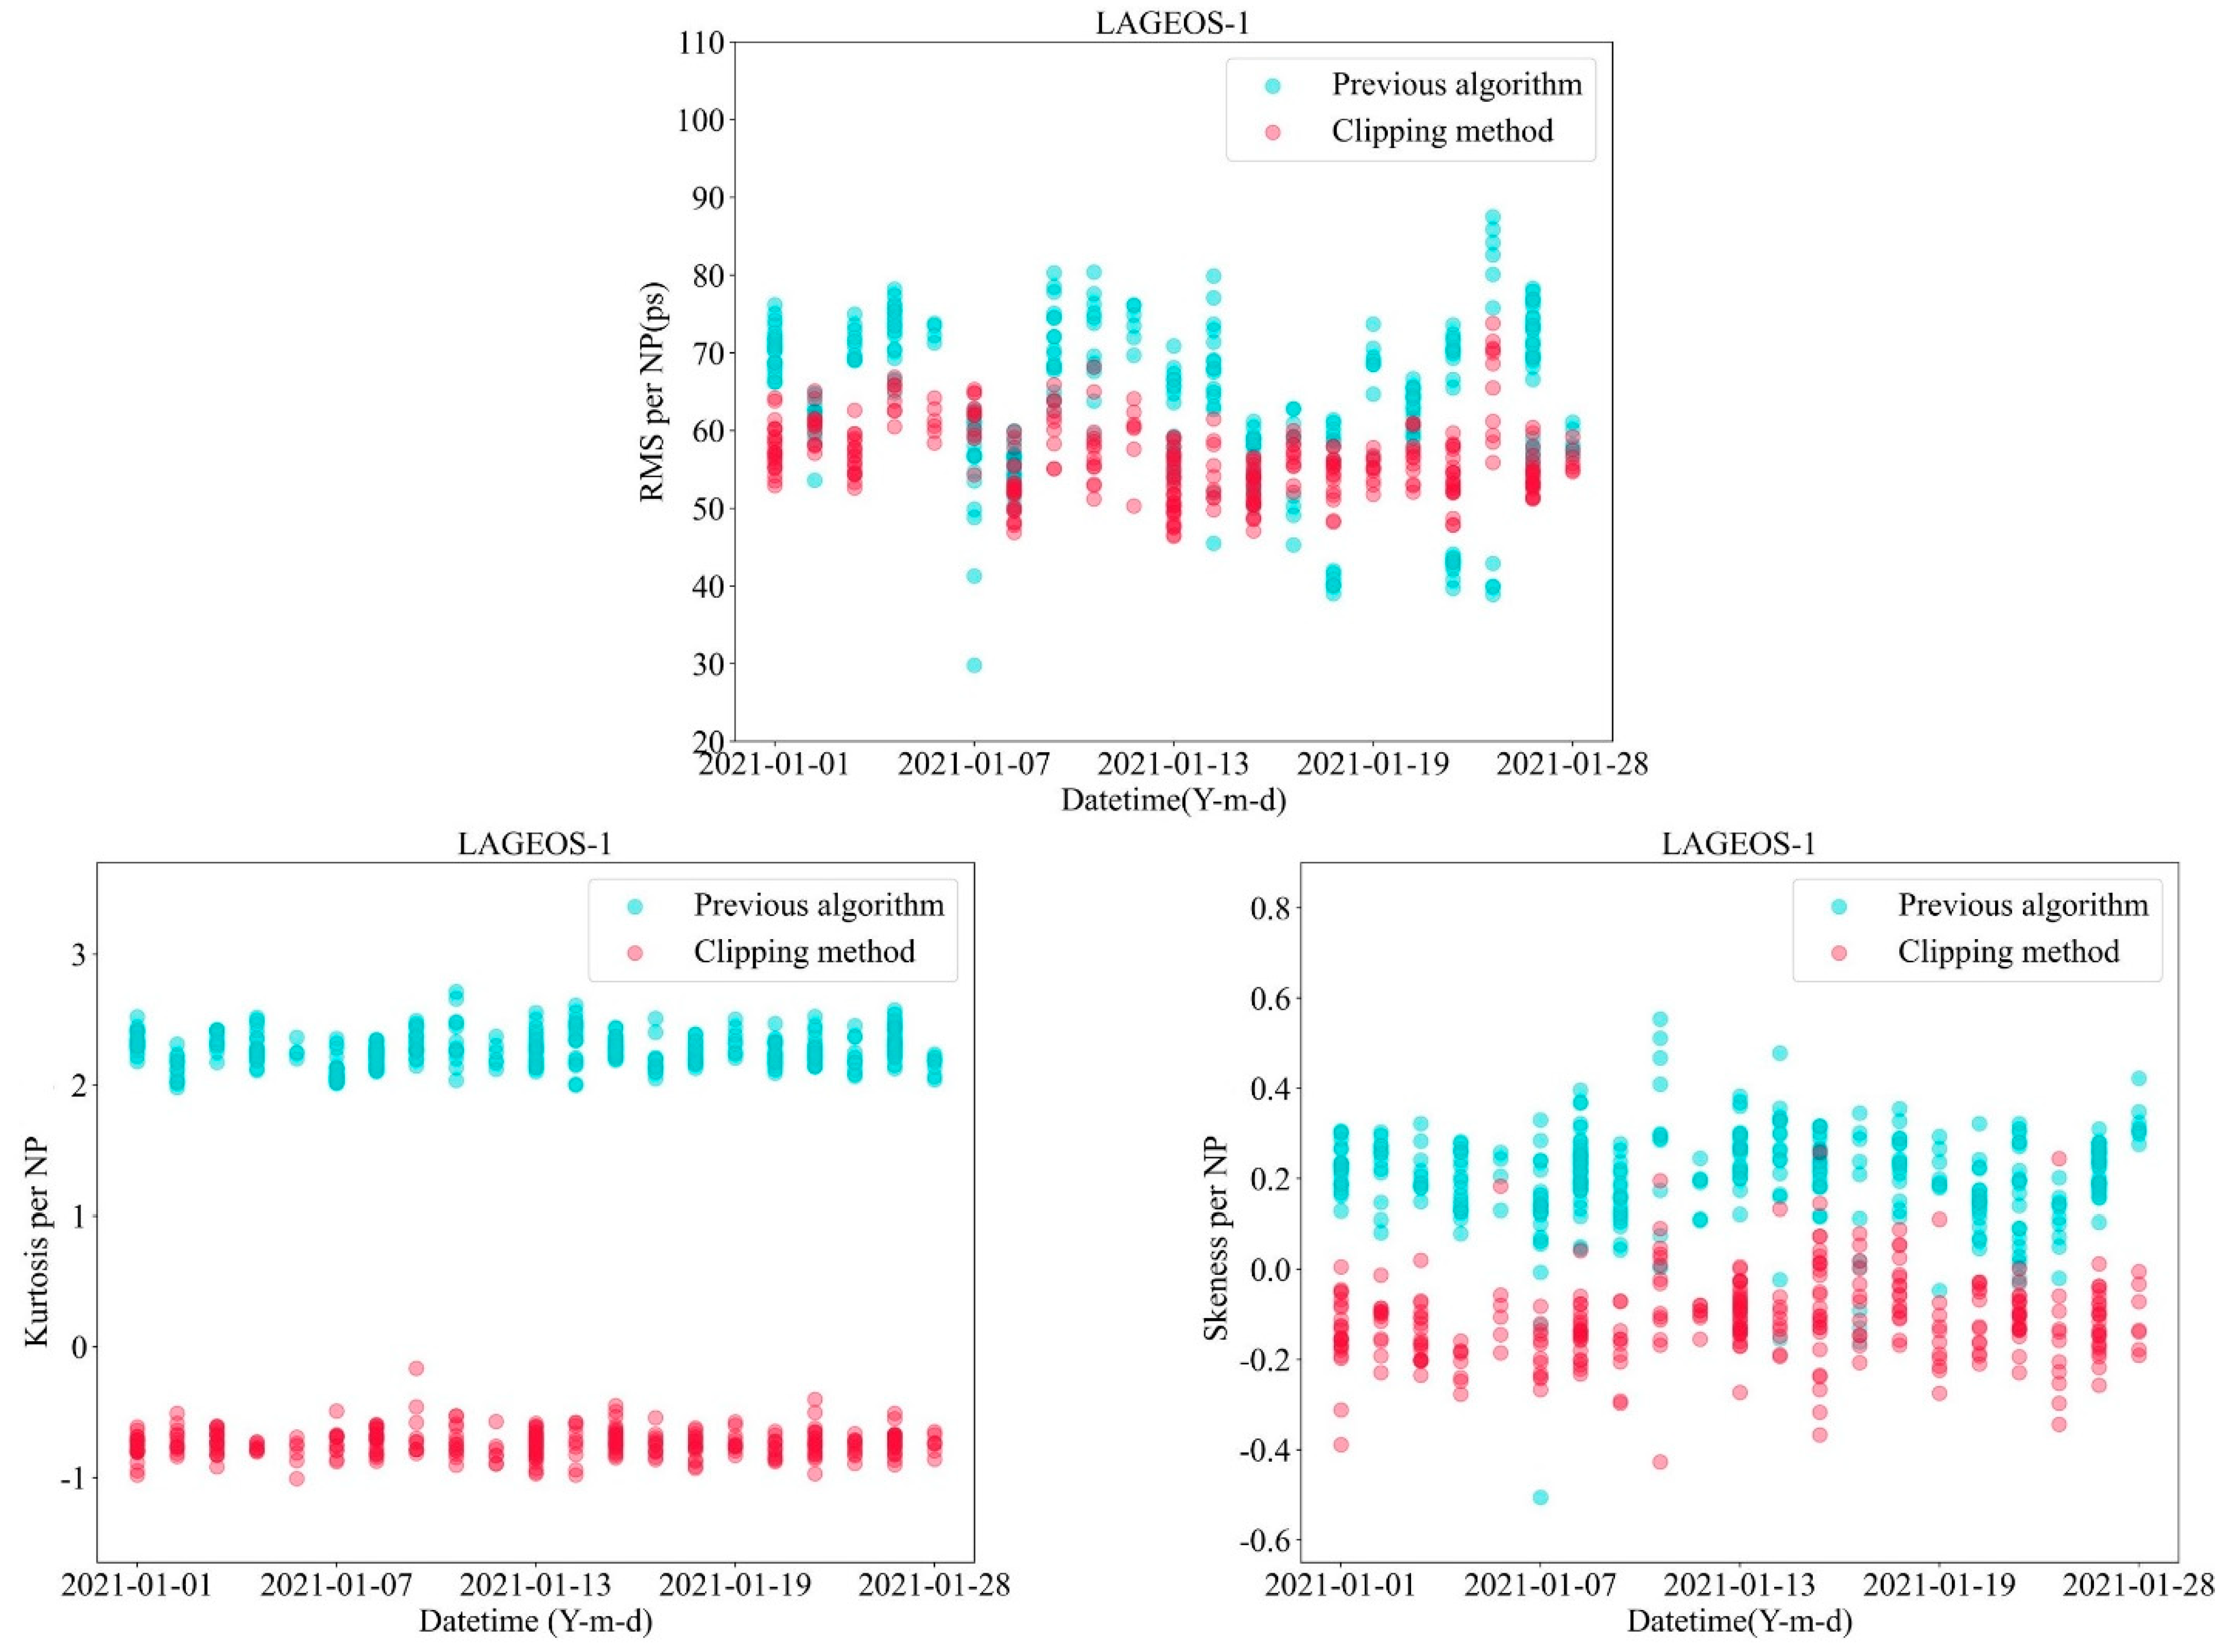
In order to verify the validity and applicability, we analyze the LAGEOS-1 observation data of different months with these two pre-processing methods. The calculated results of RMS, skewness, and kurtosis per normal point are illustrated in
Figure 9. It is seen that the RMS per normal point (NP) obtained by the clipping method has decreased significantly and become more concentrated, while the skewness and kurtosis are also obviously reduced. Compared to the normal point algorithm, LAGEOS-1 observation data processed by the clipping method has higher precision and better stability and reliability, which indicates that the clipping method can not only eliminate the long-term but also reduce the short-term satellite signature effect from raw ranging data files.
5. Conclusions
Scientific demands of millimeter precision ranging give aggressive performance requirement to the pre-processing data algorithms for SLR system. We simulate the satellite signature effect removal process of normal point algorithm based on a revised model of satellite response, which fully takes the structural and distribution characteristics of corner reflectors into account. The simulated results show that the waveform of return signal processed by a normal point algorithm is improved by the reduction in long tail, but there remains some distortion at the front and back edge. The distribution of return signal for each observation is not stable, and the difference between the maximum and minimum of CoM for fit residuals can reach up to 3.79 mm. This means that a normal point algorithm can reduce the effect of long-term satellite signatures on observation data but cannot eliminate the systematical errors introduced by the variation of satellite signature effect for each observation.
On this basis, a new clipping method is proposed and applied for SLR data processing of Changchun SLR station. We adopt Poisson filter and rejection of 2.5 × RMS to reduce noise points but retain the most of returned waveform. Defining clipping location as 5.6 mm away from the mean value of the long-term fit residuals is important to select the effective returns for normal points. The experimental results illustrate that, compared to normal point algorithm, the RMS per NP for LAGEOS-1 processed by the new clipping method is reduced from 62.90 ± 9.9 mm to 56.07 ± 4.69 mm, and the stability of observation data is improved 53%. Both the stability of skewness and Kurtosis for LAGEOS-1 also improved. It is concluded that the clipping method can minimize both long-term and short-term satellite signature effect and improve the ranging precision and stability of SLR observation data. This study improves the satellite signature effect model. In this paper, the fluctuation of CoM value caused by satellite signature effect is simulated for the first time. By simulating the effectiveness of different clipping location, the pre-processing algorithm is successfully improved and achieved good results. This paper provides a reference for other stations to build their own data processing algorithm and further enriches the theory of system errors for SLR systems.


