Abstract
To investigate the influences of discrete fiber strips on the mechanical properties of reinforced sand, a series of direct shear tests were conducted. A method to strictly control the initial orientation of fiber strips in specimen preparation was developed. Under the same normal pressure, the peak strength of sand specimens was proportional to the fiber content and was inversely proportional to the fiber initial orientation angle. The influences of initial fiber orientation on peak strength may depend on the stress mobilization in fibers. When the fiber strips distributed at a certain orientation angle were subjected to tensile stress in shearing, they could play an effective role in the peak strength gain of sand and vice versa. Due to the restriction of fibers on the volume dilation of sand specimens, the residual strength of reinforced sand also increased. However, the initial stiffness of reinforced sand was smaller than that of pure sand, which may be related to the precompression of flexible fiber strips and the density inhomogeneity of specimens induced in the specimen preparation process. In addition, the ductility of sand specimens was improved by the introduction of fiber strips, intuitively reflected by the increase in displacement failure. This may also be attributed to the restriction of fiber strips on the deformation of sand specimens.
1. Introduction
Reinforced soil is widely used in the field of geotechnical engineering [1,2,3,4]. As a type of discontinuous granular material, the tensile strength of soil is almost negligible. Through the introduction of fiber materials, which provide tensile resistance, the mechanical properties of soil can be improved significantly. On one hand, fibers can increase the strength of soil; on the other hand, they can decrease the deformation of geotechnical structures. Compared with continuous reinforced materials such as geogrids and geotextiles, discrete fiber materials such as fiber strips may be more flexible and convenient for application in some situations. In addition, some fiber strips can be made using reclaimed materials, which is environmentally friendly [5,6].
Fiber content and orientation are important factors that influence the engineering performance of reinforced soil. [7,8] found that the reinforcement effects of fibers increased with fiber content within a certain range. Many researchers conducted experimental and theoretical studies regarding the mechanical properties of reinforced soil with different main directions of fiber distribution [9,10,11], generally reporting that the influence of fiber orientation on the reinforcement effects on soil depends on the stress mobilization in fibers. In addition, other factors related to fibers, such as aspect ratio, stiffness, and surface friction properties, can also affect the reinforcement efficiency [7,12].
In this study, a series of direct shear tests of sand specimens reinforced with cotton fiber strips were conducted. A method to strictly control the initial orientation of flexible fiber strips was developed in the process of specimen preparation. Based on the test results, the influences of fiber content and orientation on the mechanical properties of sand specimens, including strength, initial stiffness, and ductility, were discussed. This study with controlled variables can be helpful to understand the strengthening mechanisms of fibers in reinforced sand, although the situations in practice are much more complicated than the tests.
2. Test Arrangement
Extensive series of direct shear tests were performed on sand specimens reinforced with cotton fiber strips to investigate their mechanical characteristics. The sand tested was Fujian standard sand, whose mechanical and physical properties are presented in Table 1. The range of particle size was from 0.1 to 1 mm. The specimens were 30 mm in thickness and 60 mm in diameter. The fibers used in this study were commercially purchased woven strip cotton flexible fibers with a thickness <0.5 mm and width of 10 mm. The strip fibers had a high tensile strength (usually greater than 50 MPa) and negligible compressive strength and flexural stiffness. The length of fiber strips was selected as 30 mm, which was equal to the thickness of the sand specimens.

Table 1.
Physical properties of Fujian standard sand.
To investigate the influence of initial orientation and content of fiber strips on the mechanical responses of sand specimens, they were selected as controlled variables in the direct shear tests. The initial orientation angel of fiber relative to the shear plane was the angle i shown in Figure 1. In this study, the initial orientation angles of 60°, 90°, and 120° were selected. Note that a new method to place the fiber strips was developed to maintain the flexible fiber strips at a predetermined orientation angle during the process of specimen preparation. As shown in Figure 2a, some plexiglass plates with orientated slots were manufactured, and some needles were inserted into the slots. The fiber strips were placed on the needles; thus, their orientation angles were determined by the slots. During the specimen preparation, plexiglass plates were first placed into the shear box (see Figure 2b). Then, the sand was introduced using a funnel and densified in layers using a steel sharp wire to rearrange the sand particles into a high packing order, along with small hammer blows to further increase the sand density. More attention was paid to the sand around the fibers to avoid the obvious influences of layered densification on the fibers. When the sand was filled close to the top of fiber strips, the plates and needles were slowly lifted. The fibers remained in the sand since the friction along the needle–fiber interface was negligible in comparison to that along the fiber–sand interface (see Figure 2c). In this method, the fibers in the sand specimens were distributed according to the angle of slots, i.e., the predetermined orientations. To prepare the reinforced specimens with initial fiber orientations of 90° and 60°/120°, plexiglass plates with the slots at 90° and 60° relative to the horizontal direction were needed in this study. The average fiber content included in a reinforced sand specimen was defined as a percentage weight of fibers with respect to the dry unit weight of sand. In this study, unreinforced sand (fiber content = 0%) and reinforced sand with fiber contents of 0.04%, 0.2%, and 0.4% were selected for testing. Note that, for each combination of controlled variables, three identical sand specimens were tested, and the average results were analyzed to ensure that the conclusions drawn in this study had statistical significance.
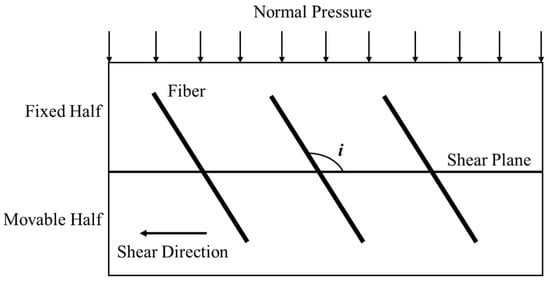
Figure 1.
Schematic diagram of direct shear test and orientation angle.
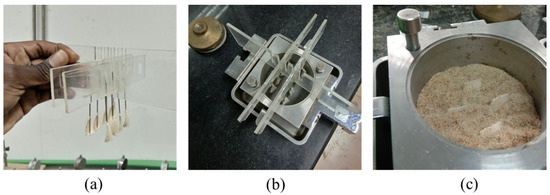
Figure 2.
Preparation of reinforced sand specimens: (a,b) angle positioning of fibers in specimens, and (c) layered filling of sand.
The relative density Dr of sand could reach 80% in this study, indicating that the tested sand specimens were typical dense sand. The normal pressures of the direct shear tests were 100, 200, 400, and 800 kPa. The shearing rate was set as 0.25 mm/min. The direct shear tests were ended when the horizontal shear displacements were larger than or equal to 4 mm. At this strain level, the shear stresses of most specimens reached steady values (i.e., residual strength of dense sand).
3. Results and Discussions
Shear stress–displacement responses of sand specimens in the direct shear tests under the normal pressures of 100 and 400 kPa are presented in Figure 3. Because the tested sand was typical dense sand, most specimens exhibited softening behaviors after peak points. To intuitively illustrate the influences of fiber strips on the mechanical behaviors of sand specimens, the results of direct shear tests were further analyzed from the aspects of strength, stiffness, and ductility.
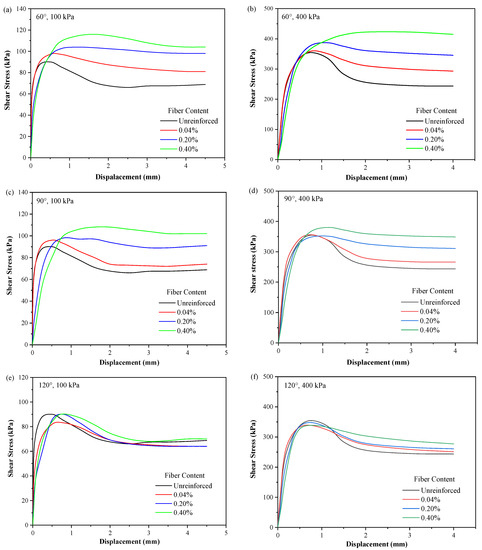
Figure 3.
Shear stress–displacement responses of sand specimens in direct shear tests under normal pressure of 100 kPa initially oriented at (a) 60°, (c) 90°, and (e) 120° and under normal pressure of 400 kPa initially oriented at (b) 60°, (d) 90°, and (f) 120°.
3.1. Peak Strength
The peak strength of sand is the maximum shear stress reached during the shearing process, which is an important feature to measure its mechanical performance. To reflect the influences of fiber strips on the peak strength of sand, the peak strength ratios, defined as the ratio of peak shear stress of reinforced sand to that of unreinforced sand [13], were calculated and are listed in Table 2. According to its definition, a peak strength ratio larger than 1.0 meant that the fiber strips provided an enhancement effect on the peak strength of sand, whereby a larger peak strength ratio led to a larger enhancement effect of fiber strips.
Table 2.
Peak strength ratio of reinforced sand obtained from direct shear tests.
As can be observed from Table 2, for the specimens sheared at the same normal pressure and fiber content, the peak strength ratios decreased with the initial orientation angle. For most specimens, the fiber strips initially orientated at 60° and 90° increased the peak strength of sand, as indicated by the peak strength ratios greater than 1.0. The effects of fibers initially orientated at 60° were more significant. In contrast, the fiber strips initially orientated at 120° did not improve and, in some cases, even weakened the sand, as indicated by the peak strength ratios smaller than or equal to 1.0. Similar results were also obtained by [12,14]. As mentioned in Section 1, the influence of initial orientation angle of fiber on sand strength may be explained by the stress mobilization in fibers. As measured by [15], the direction of the principle tensile strains in a dense sand specimen was close to 60° relative to the shear direction. Therefore, the tensile stress in fiber strips initially orientated at 60° in this study could be mobilized most effectively; and the most obvious reinforcement effects were observed. For the fibers initially oriented at 90°, because the normal strain in the oblique plane vertical to the fibers was still in the tensile direction, they still provided a reinforcement effect. However, when the fibers were rotated to an angle such that the compressive strain was more dominant on the corresponding oblique plane, such as in the case of the 120° initial orientation, they had a negative effective reinforcement effect because they were in compression. In this situation, the fibers could even reduce the peak strength of sand because the compressed fibers could reduce the density of nearby sand.
For the sand specimens with fiber strips of same initial orientation angle, their peak strength ratios increased with the increase in fiber content. This is consistent with the common perception. When the fiber content and initial orientation angle were the same, the peak strength ratios decreased with the increase in normal pressure. According to the Mohr–Coulomb strength criteria of granular materials, the strength of pure sand increases proportionally with the increase in normal pressure. However, the decrease in peak strength ratios indicated that the strength increments induced by the fiber strips did not increase proportionately with normal pressure. This phenomenon is further discussed below by considering the shear strength envelopes of sand specimens obtained from peak strength data.
As shown in Figure 4, with the exception of sand specimens with a fiber content of 0.04% and fiber initially orientated at 120°, the strength envelopes of other specimens were all lifted by introducing fiber strips. In the range of 100–200 kPa, the slopes of strength envelopes of reinforced sand were larger than those of unreinforced sand, indicating that the strength increments induced by fibers had a positive correlation with normal pressure. However, in the range of 200–400 kPa, the strength envelopes of reinforced sand were almost parallel to those of unreinforced sand. In other words, the strength increments induced by fibers tended to be constant with the increase in normal pressure. Increasing the peak strength of unreinforced sand with a constant fiber-induced strength increment led to a decreasing peak strength ratio with the increase in normal pressure, as shown in Table 2.
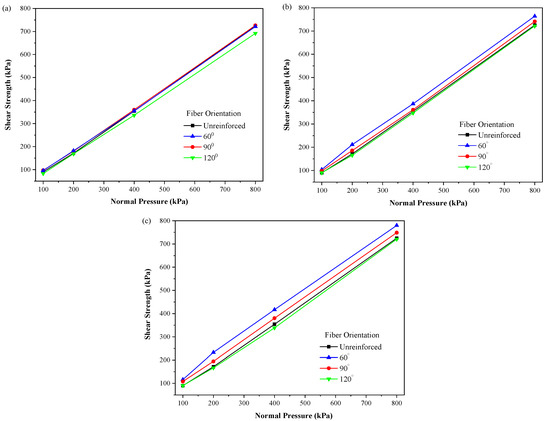
Figure 4.
Shear strength envelope of reinforced sand with fiber contents of (a) 0.04%, (b) 0.2%, and (c) 0.4%.
Similar phenomena were observed from different tests by other researchers [4,12,16,17,18]. It is generally believed that these phenomena are related to the different failure modes of fibers. When the normal pressure was relatively low, the pullout failure was predominant, and the frictional resistance was proportional to normal pressure. With the increase in normal pressure, the yield and break failure of fibers gradually played the dominant role; hence, the strength increments tended to be irrelevant to the normal pressure. The threshold of normal pressure that divides the two failure modes is known as the critical confining stress. Nevertheless, obvious breakage of fiber strips was not observed in the direct shear tests of this study, indicating that the current test results cannot be well explained using the above analysis. The exact reasons why the fiber-induced strength increment did not continuously increase with normal pressure in pullout failure mode is not entirely clear due to the lack of more evidence and further research. It is inferred that the interactions between fiber strips and sand particles inhibited the continuous increase in frictional resistance under high normal pressures. According to the mechanisms of frictional resistance generation, one possible reason was that the stress orthogonal to the fiber surface, which was transferred from the sand matrix, did not increase proportionately with the increase in normal pressure subjected to the top of sand specimens, influenced by the interactions between fibers and sand particles.
3.2. Residual Strength
The shear stress reaches a steady value after the peak strength point in the direct shear tests of dense sand, which is known as residual strength. As illustrated in Figure 3, fiber strips obviously increased the residual strength of dense sand in this study. The residual strength of sand specimens was selected as the shear stress at the displacement of 4 mm (i.e., the maximum shear displacements of some specimens). The ratios of residual to peak strength were calculated and are plotted in Figure 5. The residual strength is a valuable parameter for evaluating the engineering performance of soil because high residual strength helps to avoid the continuous failure of soil after a short period of high load. This, in turn, is helpful in the serviceability design of structures.
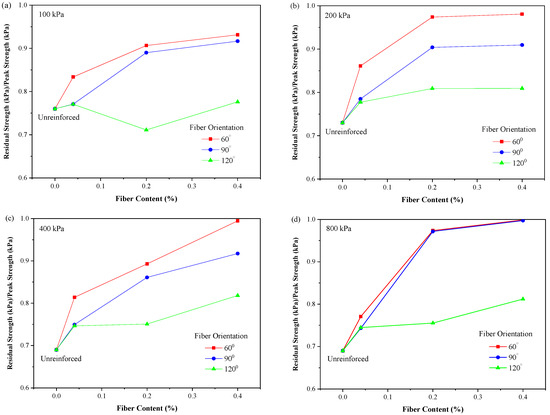
Figure 5.
The ratio of residual to peak strength of sand specimens under normal pressures of (a) 100, (b) 200, (c) 400, and (d) 800 kPa.
As shown in Figure 5, the ratios of residual to peak strength had a positive correlation with fiber content. Similar to the change rule of peak strength, the fiber strips initially orientated at 60° had the most obvious effect on the increase in residual strength, and the fibers initially orientated at 90° had relatively weaker but still obvious effects. Note that the fiber strips initially orientated at 120° slightly increased the residual strength of dense sand, although it did not help to increase the peak strength. This indicated that the increase in residual strength may not only be related to stress mobilization in fiber strips, as mentioned above.
The softening of dense sand is closely related to its volume dilation characteristic. When the stress ratio reaches a characteristic state stress ratio, the volume of dense sand changes from contraction to dilation during the shearing process, and then softening occurs. The increase in the residual strength led by the introduction of fiber strips may be attributed to the restraint effect of fibers on sand dilation. The volume change of sand in direct shear tests can be observed from the vertical displacement of the top surface of the specimen. The top vertical displacement of the sand specimens with fibers initially orientated at 60° under normal pressures of 400 and 800 kPa are presented in Figure 6. The positive values denote downward displacement and volume contraction, and vice versa. Typical dense sand usually exhibits volume contraction and then dilation during the shearing process. As illustrated in Figure 6, with the increase in fiber content, the volume contraction of reinforced sand was enhanced, and the dilation was inhibited. This reflected the restriction of fiber strips on the movement among sand particles, which was caused by the interaction between fibers and the sand matrix. Under the effects of deformation restriction, the softening behaviors of reinforced sand specimens were limited, and then the residual strength increased.
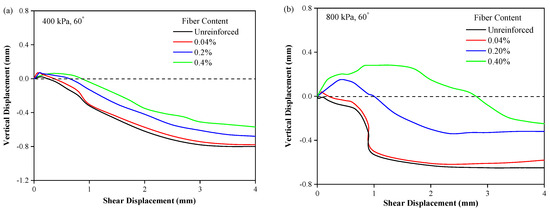
Figure 6.
Vertical displacement of sand specimens with fibers initially orientated at 60° under normal pressures of (a) 400 and (b) 800 kPa.
3.3. Initial Stiffness and Ductility
Stiffness and ductility are important mechanical properties in the constitutive behaviors of sand. Stiffness reflects the deformation resistance of soil under external loads. Since soil is a type of discontinuous granular material, its stiffness is related to the stress level. In this section, the tangent stiffness of sand specimens at the displacement of 0.1 mm was calculated, which can be regarded as the initial stiffness. The data points of initial stiffness of sand specimens under normal pressure of 200 kPa are plotted in Figure 7. It was found that a fiber content of 0.04% did not obviously influence the initial stiffness of sand specimens. For the sand specimens with a higher fiber content (0.2% and 0.4%), the initial stiffness decreased with the increase in initial orientation angle, which was consistent with the change rule of peak strength mentioned above. However, there was a negative correlation between the initial stiffness and fiber content, and the influences of fiber content on the initial stiffness were obviously larger than those of fiber orientation. Two possible reasons may have contributed to this. First, the density of the sand close to fibers may have been slightly lower than that of the sand far away from fibers due to the high difficulty of compaction in specimen preparation. The initial stiffness may have been sensitive to the density inhomogeneity of specimens. Ref. [7] proposed another possible reason for the stiffness loss. Upon application of the vertical normal pressure, the fiber strips may be pre-compressed because of their low stiffness modulus. In this situation, at the beginning of the shearing process, sufficient shear distortion has to occur to overcome the pre-compression of fibers. As a result, the initial stiffness of reinforced sand specimens may be lower than that of unreinforced sand specimens of the same density.
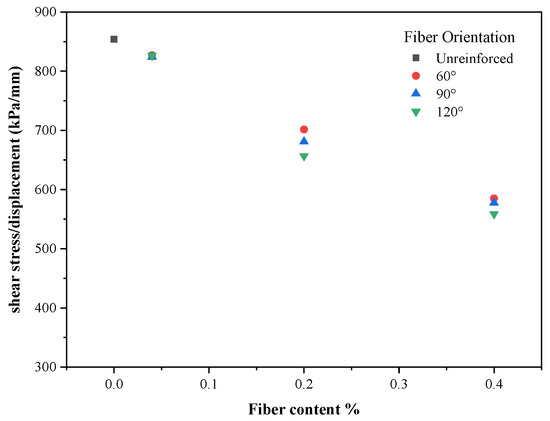
Figure 7.
Initial stiffness of sand specimens under normal pressure of 200 kPa.
Ductility reflects the deformation that can be sustained by soil from yield to a failure state. To intuitively illustrate the influences of fiber strips on sand ductility in this study, the failure displacements of the sand specimens, i.e., the displacement of the peak strength point, are shown in Figure 8 versus the fiber content. It can be observed that the failure displacement increased with fiber content, indicating that the introduction of fiber strips could improve the ductility of dense sand in this study. For the sand specimens with the same fiber content, the fibers initially orientated at 60° provided the largest ductility increments while the fibers initially orientated at 120° provided the smallest. Fiber strips may influence the ductility of dense sand via the same mechanism as residual strength. As discussed above, fibers can restrain the movement among sand particles and then reduce the volume dilation. Therefore, compared with unreinforced sand, the reinforced sand specimens may need larger macroscopic displacement in the direct shear tests for the degree of microscopic deformation of their internal structures to reach the failure degree.
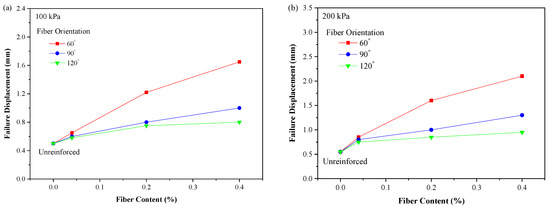
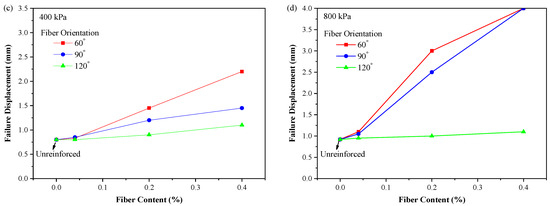
Figure 8.
Failure displacement versus fiber content of sand specimens under normal pressures of (a) 100, (b) 200, (c) 400, and (d) 800 kPa.
4. Conclusions
A series of direct shear tests were conducted on dense sand specimens reinforced with cotton fiber strips. The initial orientation angle and content of fibers were controlled variables in the tests to investigate their influences on the mechanical behaviors of sand. The following conclusions could be drawn:
(1) The peak strength of sand specimens increased upon the introduction of fiber strips. The increments of peak strength increased with fiber content and decreased with initial orientation angle. The influence of the initial orientation of fiber strips on the peak strength of sand depended on the stress mobilization in fiber strips during the shearing process.
(2) The residual strength of sand specimens increased following the introduction of fiber strips, which may be attributed to the restriction of fibers on the volume dilation of sand. The increments of residual strength also increased with fiber content and decreased with initial orientation angle.
(3) Fiber strips had negative effects on the initial stiffness of sand specimens, which may have resulted from the precompression of flexible fiber strips and the possible density inhomogeneity of specimens, which was difficult to completely avoid during the specimen preparation process.
(4) The ductility of sand specimens was improved by the introduction of fiber strips, as reflected by the increase in failure displacement. This may have also been related to the restriction caused by fibers on the deformation of sand specimens.
Author Contributions
C.C.N.—test running and data collection; H.K.—research design, data analysis, and funding acquisition; P.M.—data analysis and writing of the paper; Y.C.—article modification; S.Z.—participation in tests. All authors have read and agreed to the published version of the manuscript.
Funding
This research was funded by the National Key R&D Program of China, grant No. 2019YFC1806000.
Institutional Review Board Statement
Not applicable.
Informed Consent Statement
Not applicable.
Data Availability Statement
Not applicable.
Conflicts of Interest
The authors declared no conflicts of interest.
References
- Ahmad, F.; Bateni, F.; Azmi, M. Performance evaluation of silty sand reinforced with fibres. Geotext. Geomembr. 2010, 28, 93–99. [Google Scholar] [CrossRef]
- Benjamim, C.V.S.; Bueno, B.S.; Zornberg, J.G. Field monitoring evaluation of geotextile-reinforced soil-retaining walls. Geosynth. Int. 2007, 14, 100–118. [Google Scholar] [CrossRef] [Green Version]
- Chen, R.; Xu, Z.Z.; Chen, Y.M.; Ling, D.S.; Zhu, B. Field Tests on Pile-Supported Embankments over Soft Ground. J. Geotech. Geoenviron. Eng. 2010, 136, 777–785. [Google Scholar] [CrossRef]
- Zornberg, J.G. Discrete framework for limit equilibrium analysis of fibre-reinforced soil. Géotechnique 2004, 52, 593–604. [Google Scholar] [CrossRef]
- Benson, C.H.; Khire, M.V. Reinforcing Sand with Strips of Reclaimed High-Density Polyethylene. J. Geotech. Eng. 1994, 120, 838–855. [Google Scholar] [CrossRef]
- Dutta, R.K.; Venkatappa Rao, G. Engineering properties of sand reinforced with strips from waste plastic. In Proceedings of the International Conference on Geotechnical Engineering, Sharjah, United Arab Emirates, 3–6 October 2004; pp. 186–193. [Google Scholar]
- Michalowski, R.L.; Čermák, J. Triaxial compression of sand reinforced with fibers. J. Geotech. Geoenviron. Eng. 2003, 129, 125–136. [Google Scholar] [CrossRef]
- Jiang, H.; Cai, Y.; Liu, J. Engineering Properties of Soils Reinforced by Short Discrete Polypropylene Fiber. J. Mater. Civ. Eng. 2010, 22, 1315–1322. [Google Scholar] [CrossRef]
- Diambra, A.; Russell, A.; Ibraim, E.; Wood, D.M. Determination of fibre orientation distribution in reinforced sands. Géotechnique 2007, 57, 623–628. [Google Scholar] [CrossRef]
- Bray, J.D.; Zekkos, D.; Kavazanjian, E.; Athanasopoulos, G.A.; Riemer, M.F. Shear Strength of Municipal Solid Waste. J. Geotech. Geoenviron. Eng. 2009, 135, 709–722. [Google Scholar] [CrossRef] [Green Version]
- Ibraim, E.; Diambra, A.; Russell, A.; Wood, D.M. Assessment of laboratory sample preparation for fibre reinforced sands. Geotext. Geomembr. 2012, 34, 69–79. [Google Scholar] [CrossRef]
- Gray, D.H.; Ohashi, H. Mechanics of Fiber Reinforcement in Sand. J. Geotech. Eng. 1983, 109, 335–353. [Google Scholar] [CrossRef]
- Noorzad, R.; Zarinkolaei, S.T.G. Comparison of mechanical properties of fiber-reinforced sand under triaxial compression and direct shear. Open Geosci. 2015, 7, 547–558. [Google Scholar] [CrossRef]
- Benziane, M.M.; Della, N.; Denine, S.; Sert, S.; Nouri, S. Effect of randomly distributed polypropylene fiber reinforcement on the shear behavior of sandy soil. Stud. Geotech. Mech. 2019, 41, 151–159. [Google Scholar] [CrossRef] [Green Version]
- Jewell, R.A.; Wroth, C.P. Direct shear tests on reinforced sand. Géotechnique 1987, 37, 53–68. [Google Scholar] [CrossRef]
- Consoli, N.C.; Heineck, K.S.; Casagrande, M.D.T.; Coop, M.R. Shear Strength Behavior of Fiber-Reinforced Sand Considering Triaxial Tests under Distinct Stress Paths. J. Geotech. Geoenviron. Eng. 2007, 133, 1466–1469. [Google Scholar] [CrossRef]
- Gao, Z.; Zhao, J. Evaluation on Failure of Fiber-Reinforced Sand. J. Geotech. Geoenviron. Eng. 2013, 139, 95–106. [Google Scholar] [CrossRef]
- Micha1owski, R.L. Limit analysis with anisotropic fibrereinforced soil. Géotechnique 2008, 58, 489–501. [Google Scholar] [CrossRef]
Publisher’s Note: MDPI stays neutral with regard to jurisdictional claims in published maps and institutional affiliations. |
© 2021 by the authors. Licensee MDPI, Basel, Switzerland. This article is an open access article distributed under the terms and conditions of the Creative Commons Attribution (CC BY) license (https://creativecommons.org/licenses/by/4.0/).