Article

DEM-FDM Coupled Numerical Study on the Reinforcement of Biaxial and Triaxial Geogrid Using Pullout Test

1
Power China Zhongnan Engineer Corporation Limited, Changsha 410014, China
2
School of Civil Engineering and Architecture, Wuhan University of Technology, Wuhan 430070, China
*
Author to whom correspondence should be addressed.
Appl. Sci. 2021, 11(19), 9001; https://doi.org/10.3390/app11199001
Submission received: 31 August 2021 / Revised: 21 September 2021 / Accepted: 22 September 2021 / Published: 27 September 2021
(This article belongs to the Special Issue Advances in Geosynthetics)

Abstract

:
The key to modeling the interlocking of geogrid-reinforced ballast is considering both the continuous deformation characteristics of the geogrid and the discontinuity of the ballast particles. For this purpose, pullout tests using biaxial and triaxial geogrids were simulated using the coupled discrete element method (DEM) and finite difference method (FDM). In this coupled model, two real-shaped geogrid models with square and triangular apertures were established using the solid element in FLAC3D. Meanwhile, simplified shaped clumps were used to represent the ballast using PFC3D. The calibration test simulation showed that the accurately formed geogrid model can reproduce the deformation and strength characteristics of a geogrid. The pullout simulation results show that the DEM-FDM method can well predict the relationship between pullout force and displacement, which is more accurate than the DEM method. For ballast particles of 40 mm in size, both the experiment and simulation results showed that the triaxial geogrid of 75 mm is better than the 65-mm biaxial geogrid. In addition, the DEM-FDM method can study the interaction mechanism between the particles and the geogrid from a microscopic view, and also reveal the similar deformation behavior of the geogrid in the pullout process. Therefore, the DEM-FDM coupled method can not only investigate the interlocking mechanism between the ballast and particles but can also provide a great method for evaluating the performance of different types of geogrids.

1. Introduction

In recent decades, as a kind of geosynthetic, geogrids are mainly used to strengthen and improve the overall performance of foundations, roads, and slopes [1,2,3,4,5]. In previous studies, theoretical analysis, experimental research, and numerical simulation have been used to study the mechanical properties of reinforced soil systems subjected to pullout forces. Although the load-displacement response of the geogrid can be tracked through a pullout test, the micro-mechanism of the interaction between the soil and the geogrid material is difficult to study [6]. In recent years, numerical methods have been widely used to study the mechanical properties and pullout characteristics of geogrids.
Continuous mechanical methods, including the finite element method (FEM) and the finite difference method (FDM), have been used as numerical simulation tools to study the interaction between geogrids and soil [7,8,9,10,11,12]. However, the geometric structure of the geogrid is usually oversimplified, expressed as a truss structure in two-dimensional simulations and as a shell element in three-dimensional simulations. In the three-dimensional problem, modeling the geogrid as a continuous shell element has been proven to reasonably simulate the overall response of the geogrid system. However, using this simplified geogrid model, it is difficult to distinguish between the contributions of friction resistance and bearing resistance to the overall pullout resistance of the reinforcement system [11]. In addition, due to the discontinuity of ballast particles, the FEM or FDM methods have difficulty simulating the interaction between the geogrid and ballast.
In contrast with the above continuous element methods, the discrete element method has been frequently used to study the interaction between geogrids and soil [13,14,15,16]. The geogrid has been modeled using a set of bonded particles to form the geogrid’s true shape and the surrounding soil particles have been modeled using clumps or balls. Through analyzing the contact between the particles and the bonded particles in the geogrid, the discrete element method can well simulate the interaction between the geogrid and the surrounding soil. Although the microscopic parameters of geogrids composed of bonded particles can be obtained through a series of index calibration tests [17,18], it is difficult to intuitively show stress-strain characteristics similar to those of a real geogrid, which makes it difficult to capture the real deformation characteristics of the geogrid in pullout simulations. To combine the advantages of these continuous and discontinuous methods, the discrete/continuous coupled numerical method can be used to simulate the interaction between the geogrid and the surrounding soil. Tran et al. [19,20] developed a 3D finite-discrete element framework to model the interaction between a geogrid and soil under pullout conditions. In addition to simulating the pullout testing of a geogrid, this framework was also used to simulate the reinforcement of the foundation by the geogrid [21].
In this paper, the DEM-FDM coupled method was used to model the pullout test, taking into account both continuous and discontinuous elements. Using the coupled method, the ballast particles can be modeled using irregularly shaped clumps in PFC3D, and the biaxial and triaxial geogrids can be modeled using the continuous element in FLAC3D. The above method can not only effectively simulate the interaction between the geogrid and the surrounding soil, it can also conveniently study the deformation behavior of the geogrid. Compared with the experimental data, the numerical simulation results show that the coupled method can not only better predict the development of pullout force but can also be used to study the detailed response of the geogrid and surrounding ballast. This numerical method provides new insights into geogrid interlocking behavior and the optimization of the geogrid reinforcement effect.

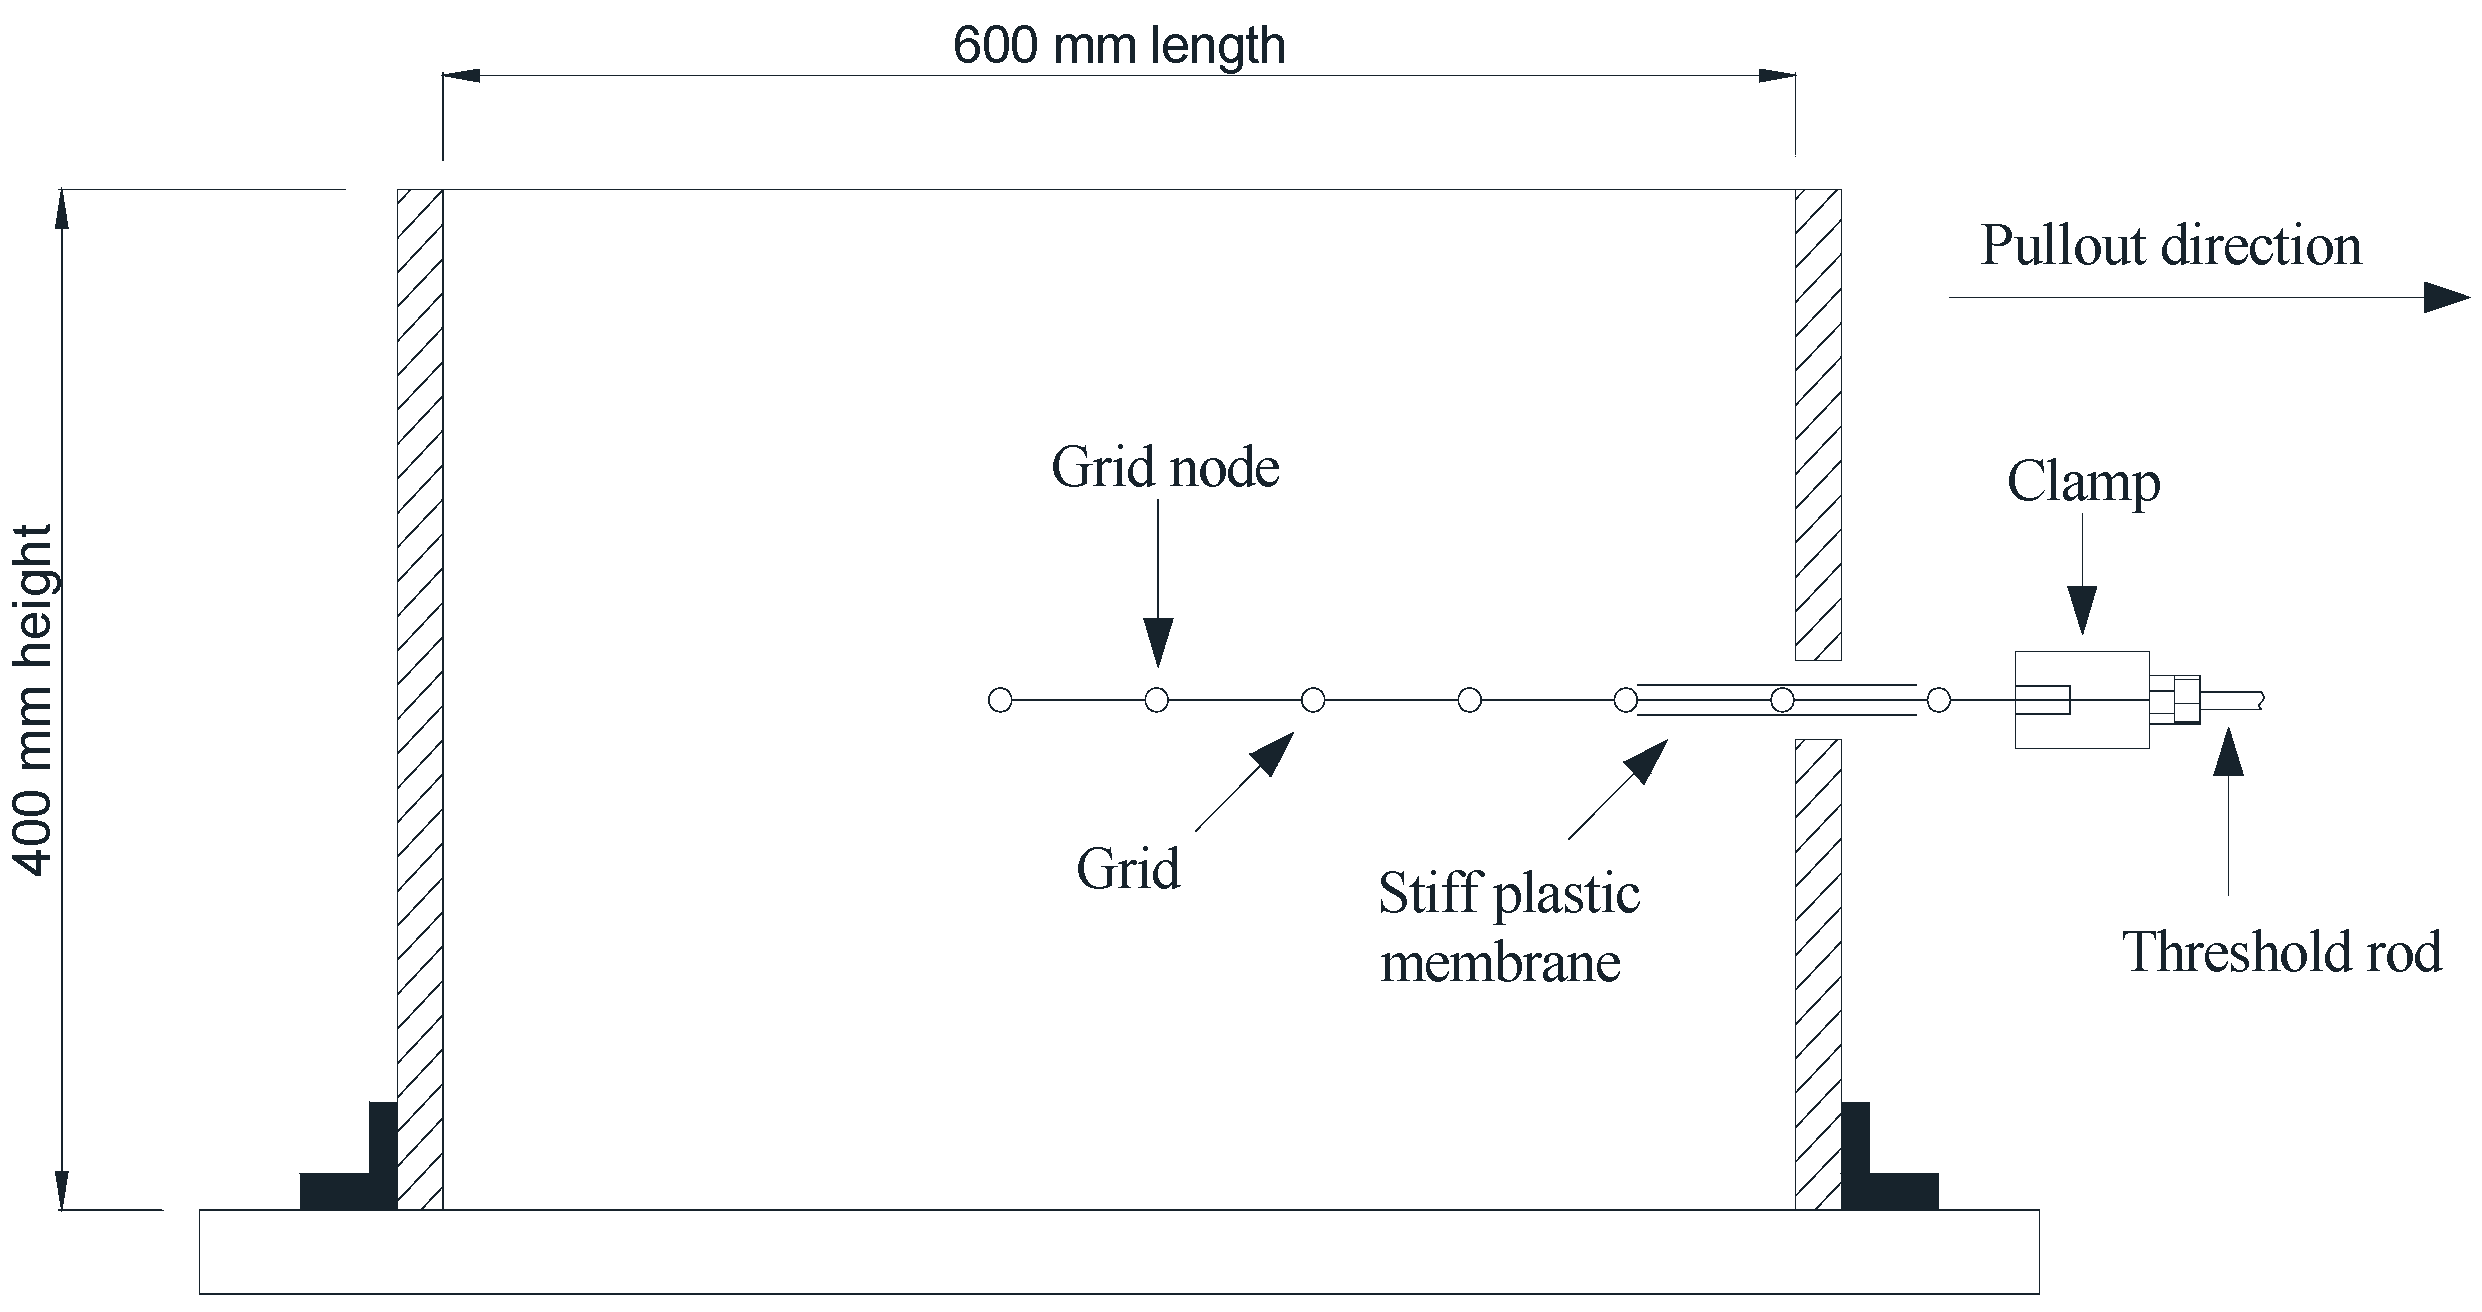
2. Experimental Pullout Test

The pullout interaction mechanisms between particles and geogrid reinforcements are more complex than those between particles and sheet reinforcements. This is because the pullout resistance of geogrids includes two main components: the passive resistance that develops against the transverse ribs and the interface shear resistance that takes place along the longitudinal ribs and also, but to a lesser extent, along transverse ribs. Although the interface shear component can be quantified using parameters obtained from direct shear tests, the passive resistance can only be evaluated using a pullout test.
The factors affecting pullout behavior, such as the stiffness of the loading plate, the distance between the first transverse ribs and the front wall, the shape of the geogrid specimen (the number of ribs and the transverse direction), geogrid length, external clamping, wall friction, surcharge load and pullout velocity, were described by Alagiyawanna et al. [22], Moraci and Piergiorgio [23] and Palmeira [24]. Palmeira and Milligan [25] found that the internal friction angle between the soil and the reinforcement may be seriously overestimated because there is friction on the internal front wall of the box in small-scale tests. Therefore, these authors suggested lubricating the front face of the test box and increasing the scale of the test. Therefore, a large box measuring 400 mm width × 600 mm length × 400 mm height was used in our pullout tests, which is four times larger than the typical small box, as shown in Figure 1. The test box was filled with 140 kg graded ballast with a mean size (D50) of 40 mm and a coefficient of uniformity (Cu) of 1.4, whereas the initial density was approximately 1458 kg/m3. The geogrid layer was placed at the middle depth of the box and extended out of the box through the slot on the right side of the box. A thin plastic membrane was placed on both sides of the geogrid near the slot to prevent the geogrid from generating additional resistance between the geogrid junction and the slot. The pullout force was measured and analysed to evaluate the interlocking of the geogrid-ballast system. A higher pullout force represents more effective interlocking between the geogrid and the ballast, from which one can expect the effective prevention of the lateral spread of the ballast on railway tracks. More details on the experimental tests can be found in previous studies [17].

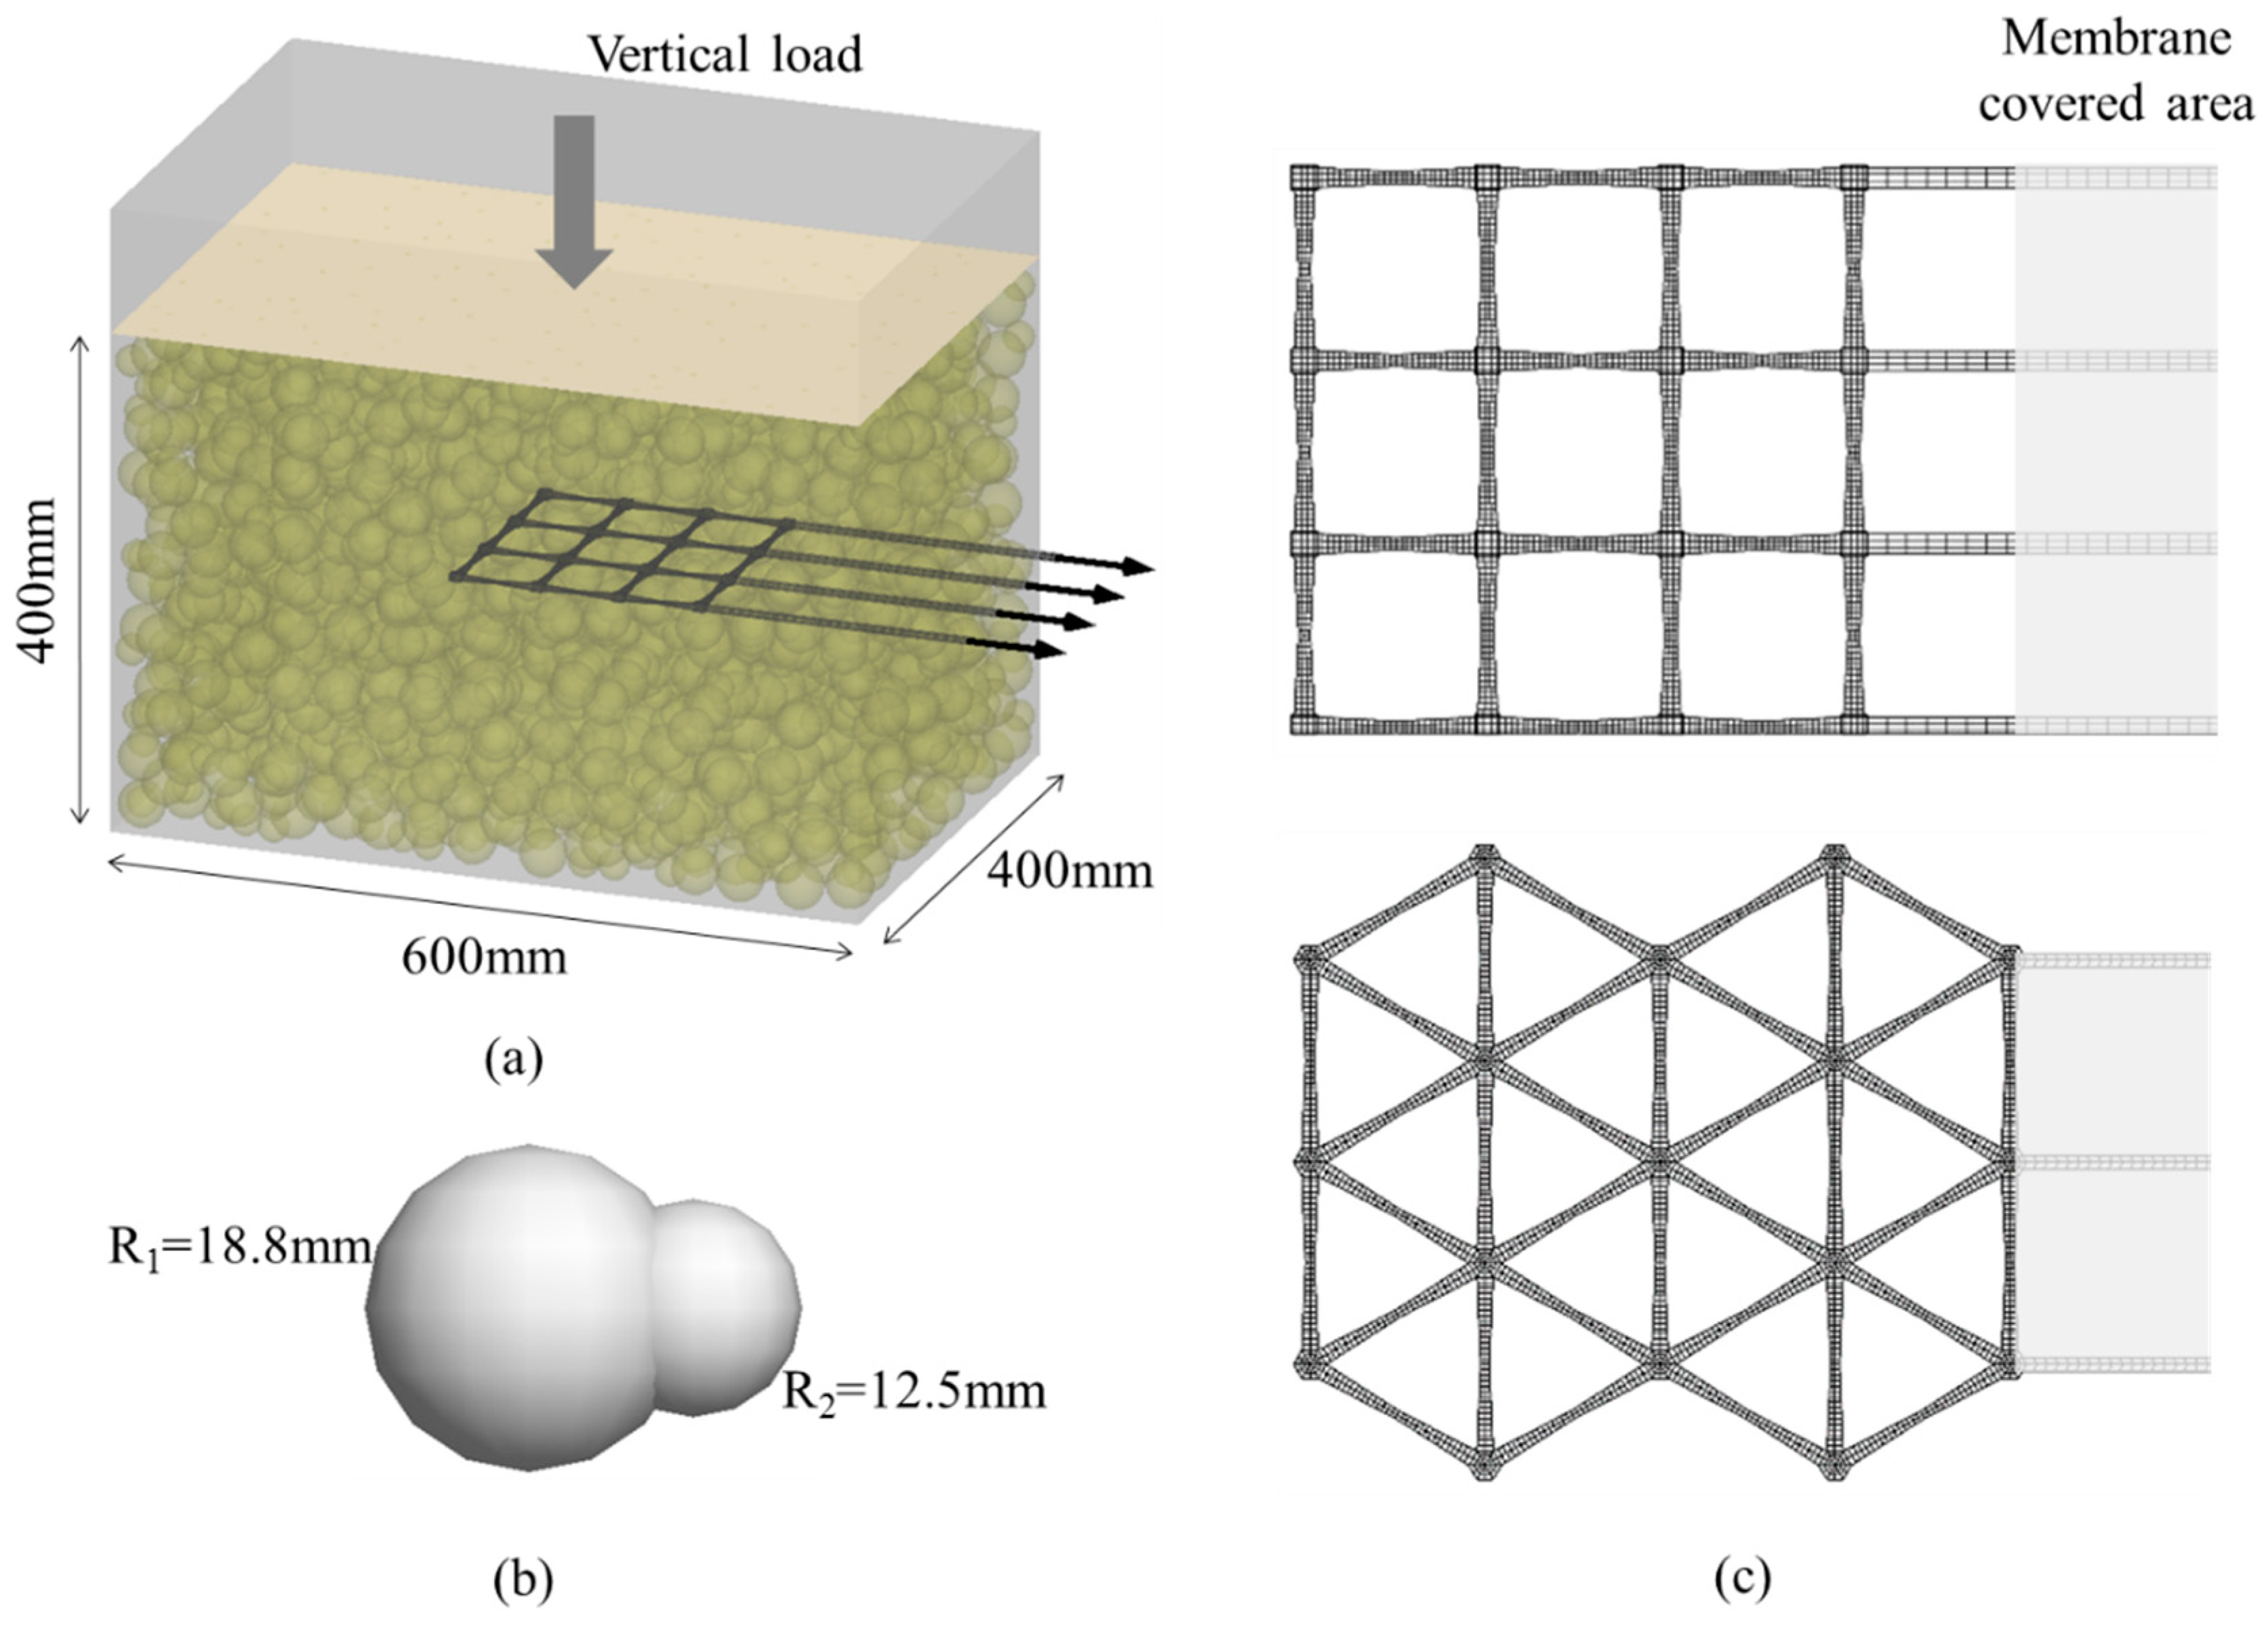
3. DEM-FDM Coupled Modeling of Pullout Test

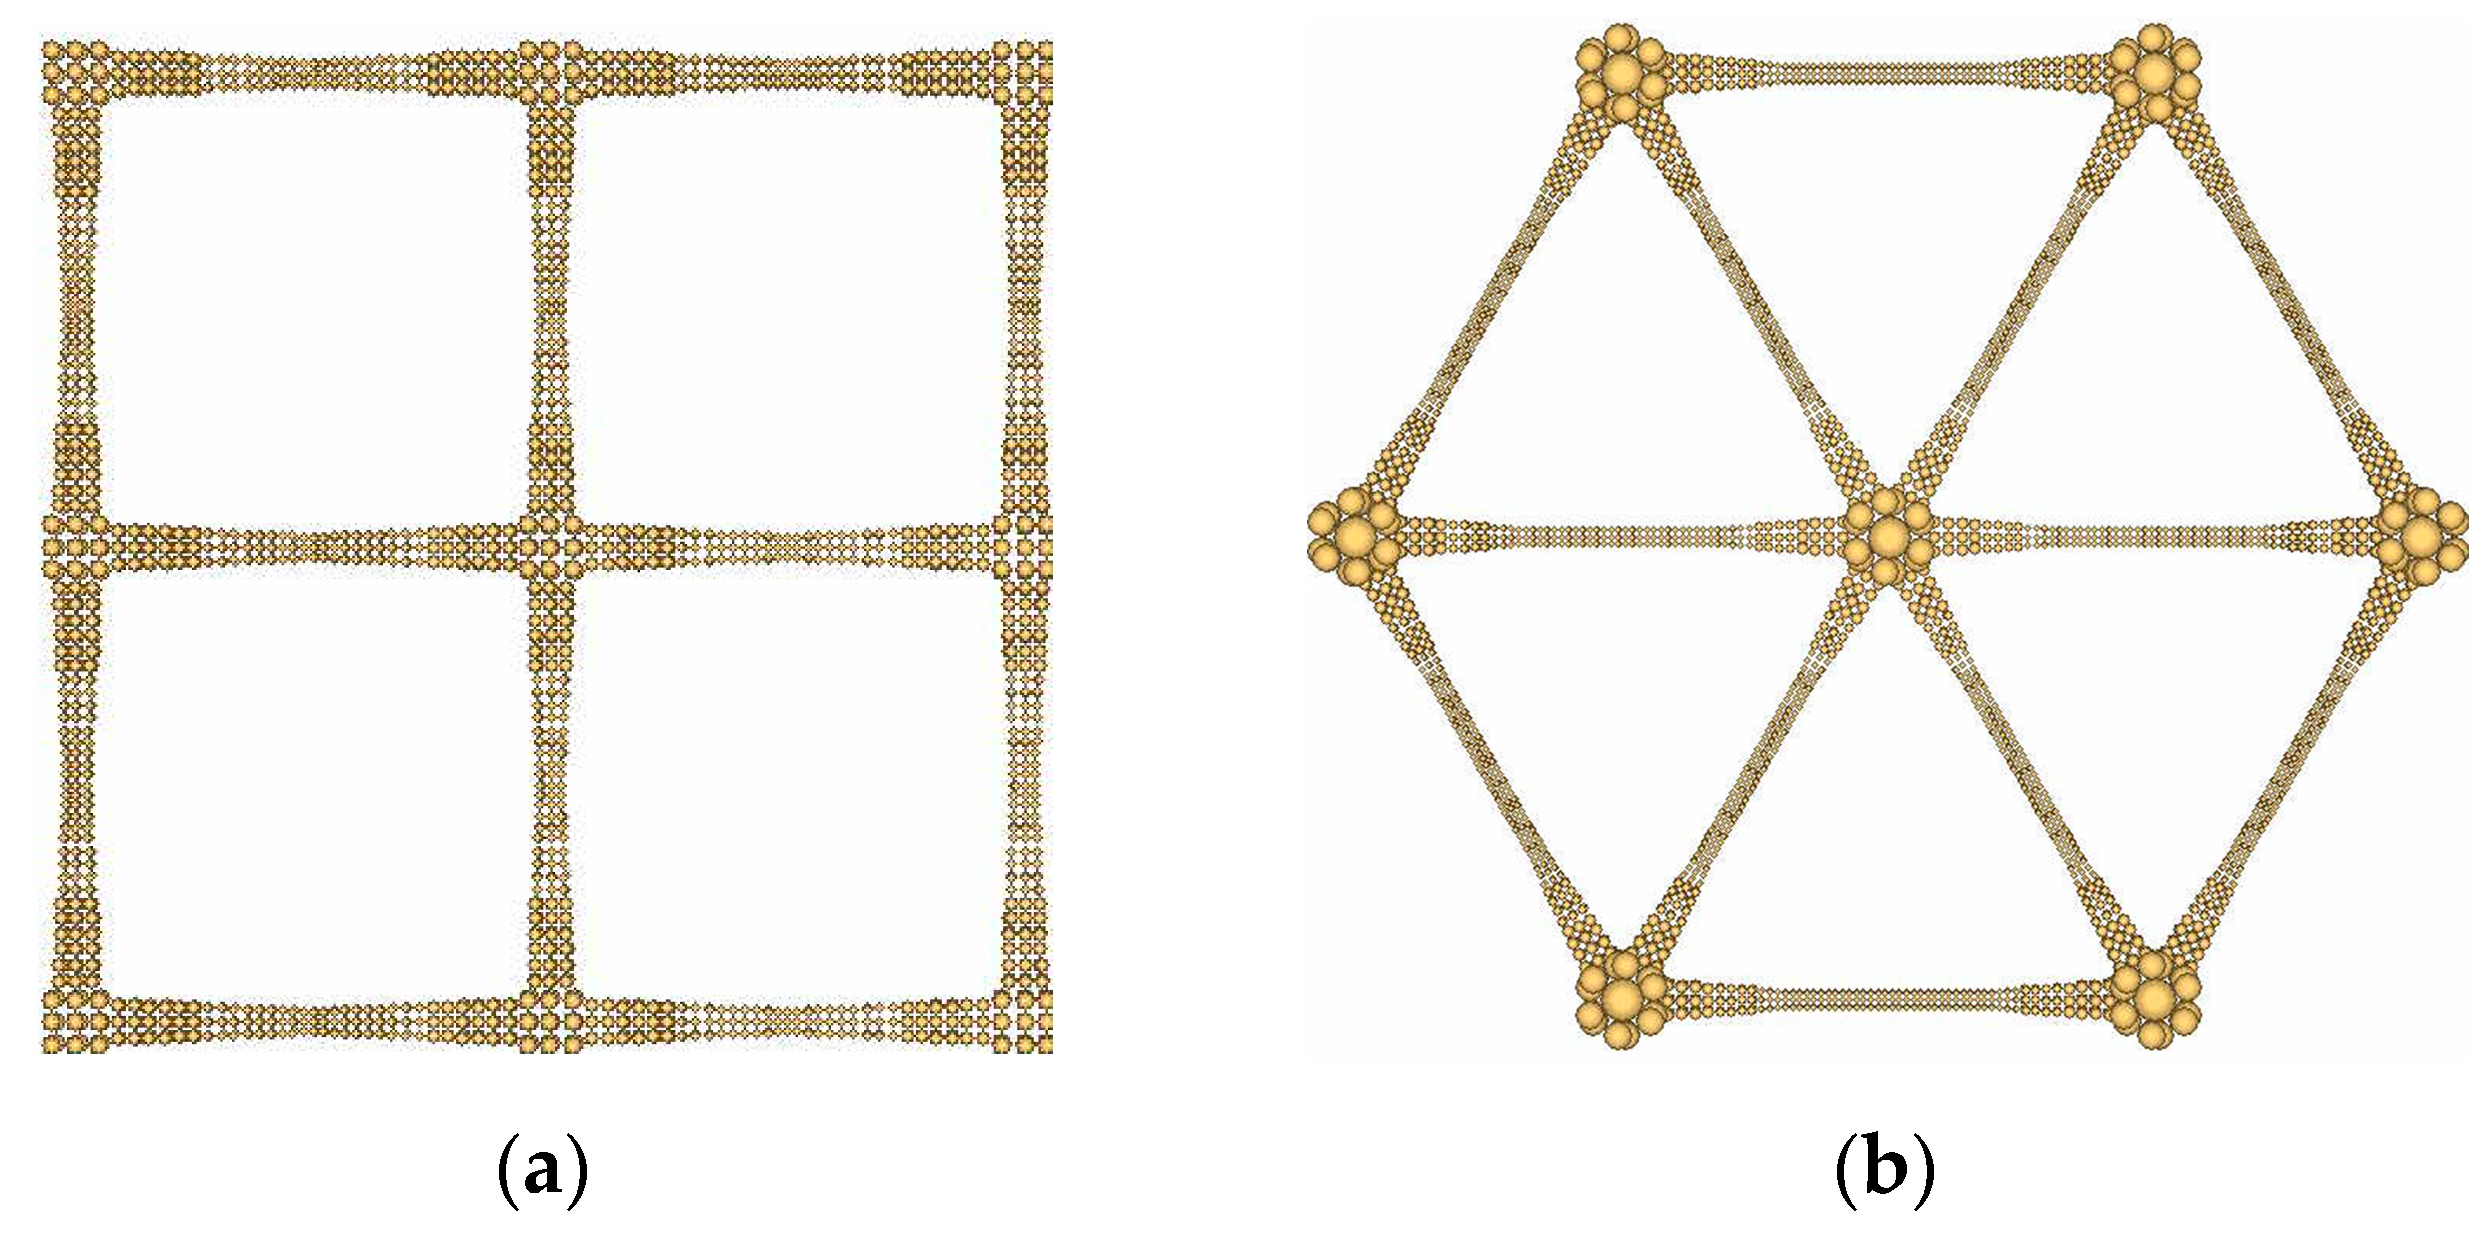
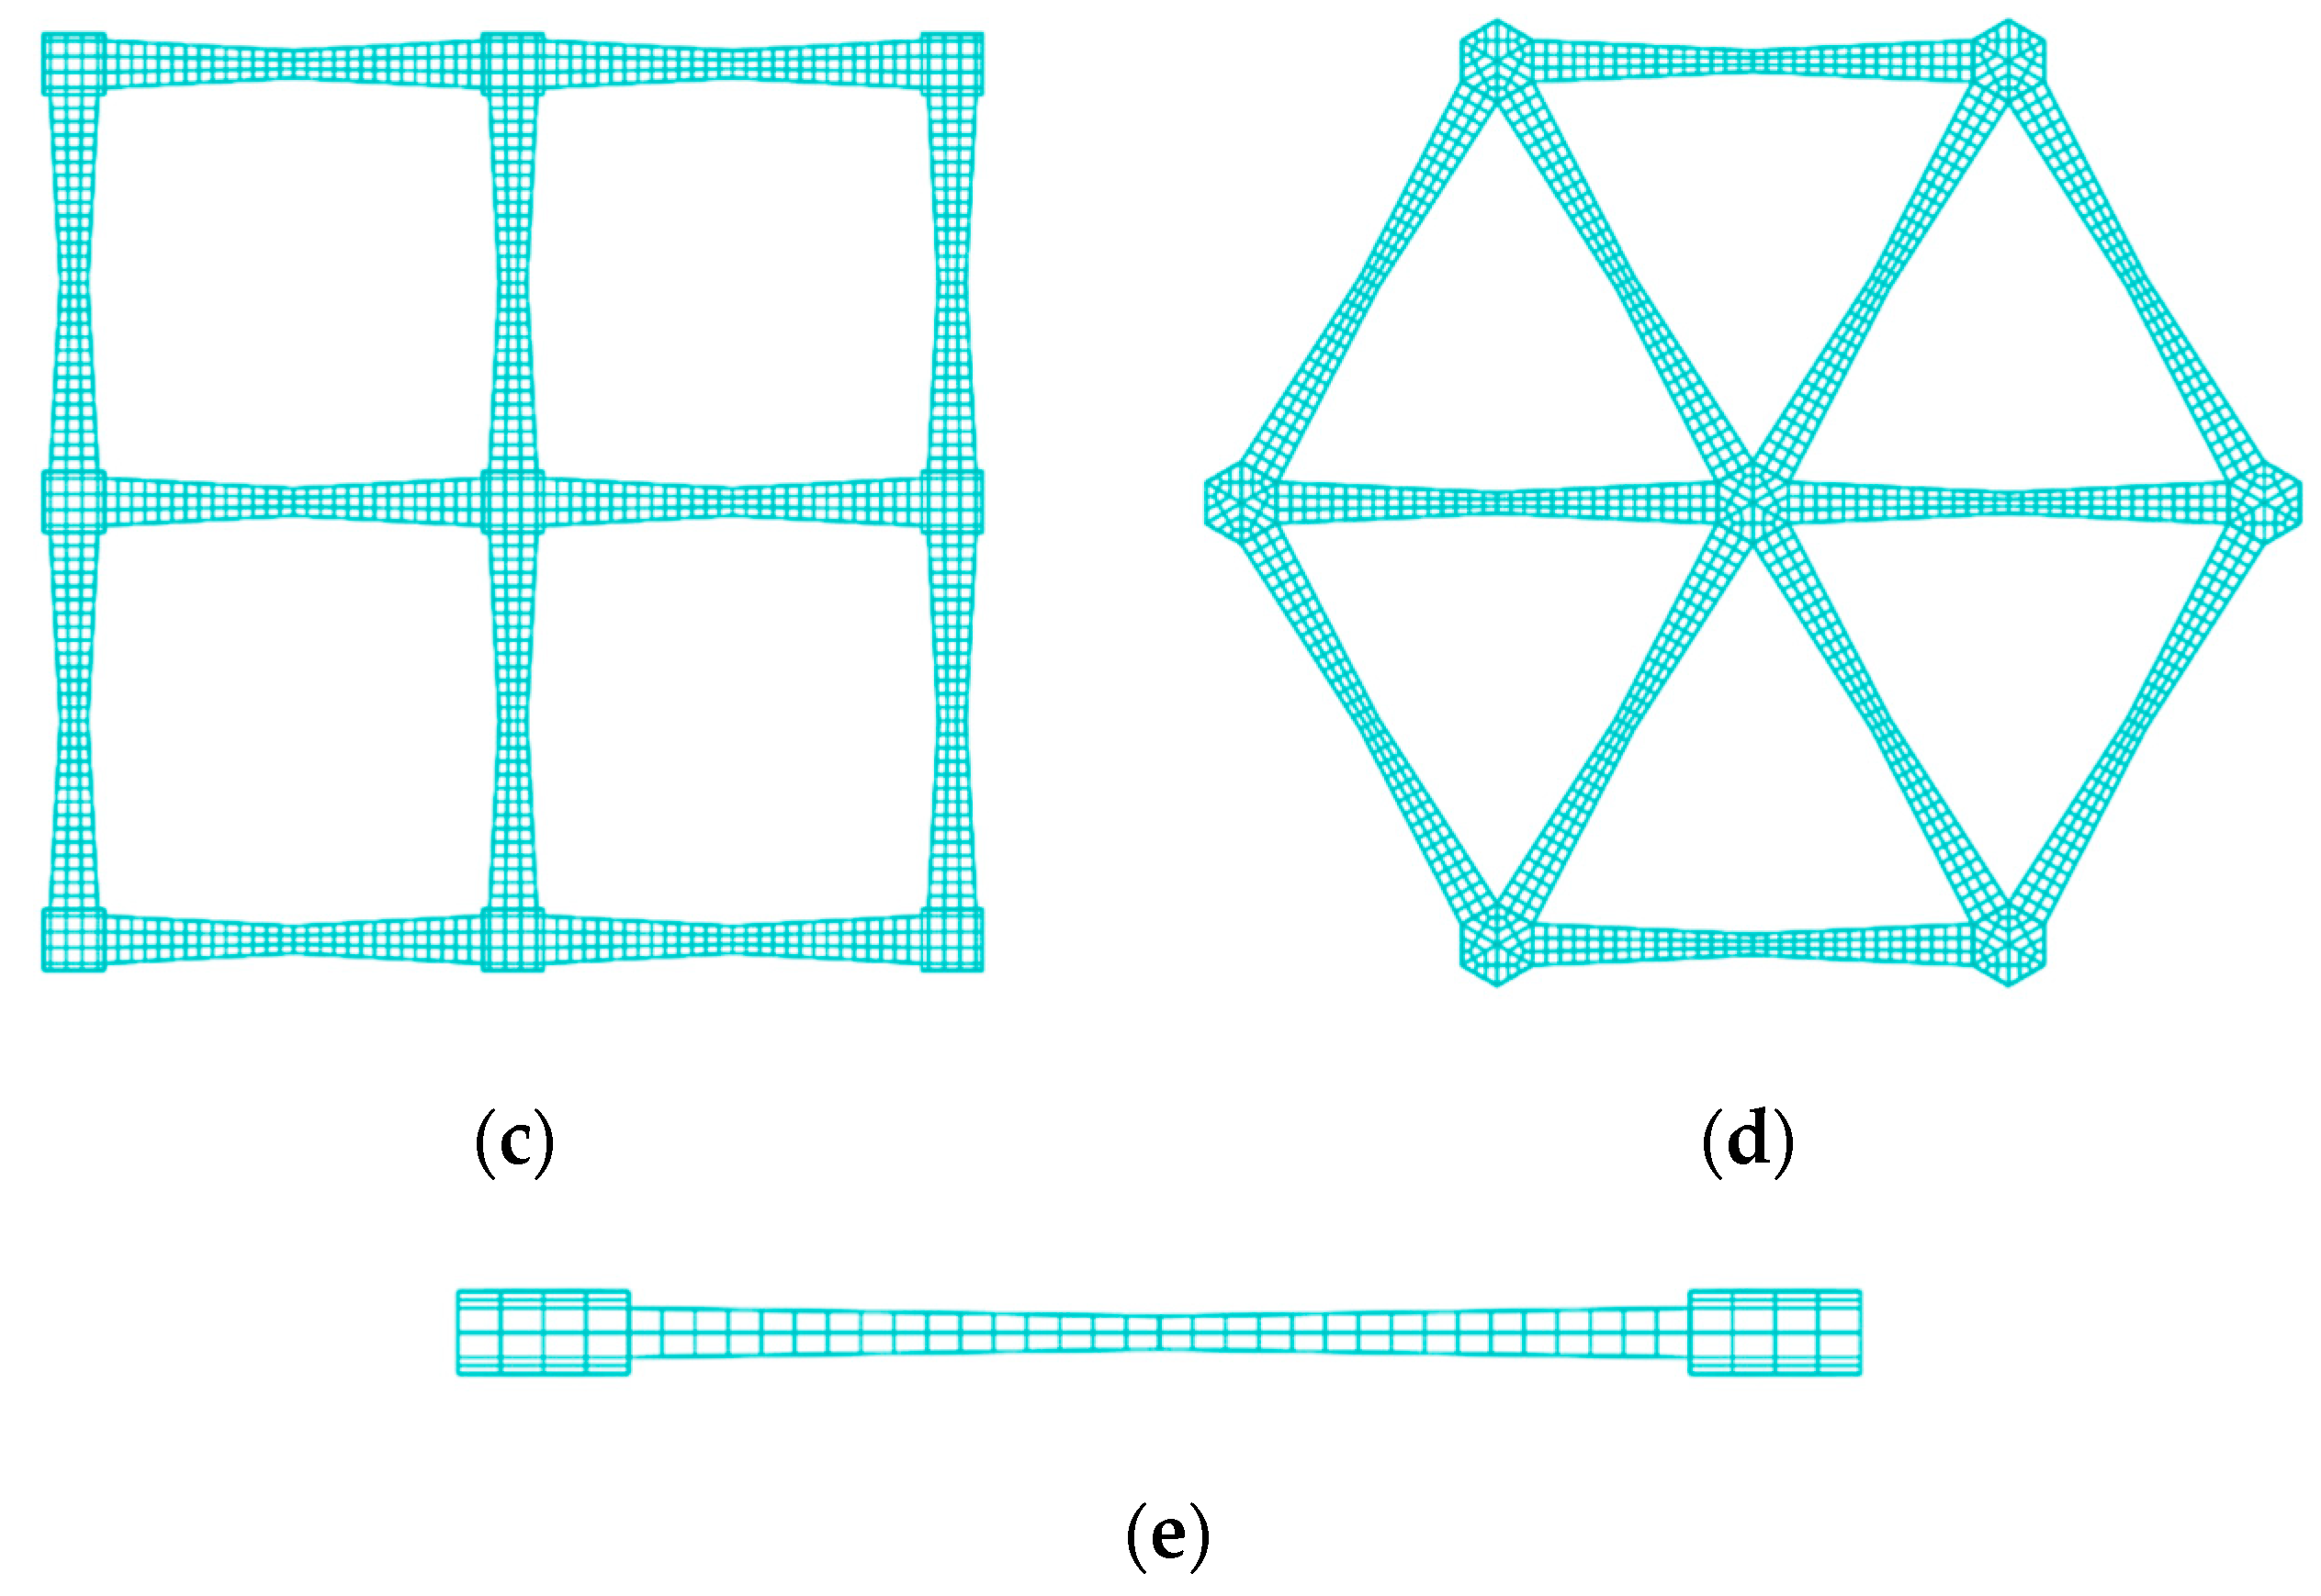
3.1. FDM Biaxial and Triaxial Geogrids Using FLAC3D

Previous DEM studies [18,26,27] have simulated the geogrid with precise geometry using strings of parallel bonded particles in PFC3D. In the authors’ previous study, a two-layer geogrid model with a realistic shape in PFC3D was used to replace a single-layer geogrid, as shown in Figure 2a,b. The performance of the two-layer geogrid was better than that of the geogrid composed of single-layer spheres or a row of spheres. To reflect the thickness change of the geogrid rib, the particle radius from the junction to the centre of the rib continuously decreases slightly. These bonded geogrid models, although very detailed and accurate, were found to be very computationally demanding, and the acquisition of results was found to be slow.
In this study, the precise geometries of the geogrids were modeled using the solid element operation in FLAC3D. Compared with the complex geogrid model with discontinuous elements in PFC3D, the geogrid with continuum elements can reduce computational time and can also be easily generated. Moreover, using the DEM-FDM coupled numerical method, not only can the interaction between geogrids and the surrounding ballast be studied, the strains and stresses of the FDM geogrid model can also be well analysed. Figure 2c,d show the FDM models of biaxial and triaxial geogrids. Firstly, referring to the real geogrid, the geogrid geometric model was created and meshed in FEM software, and then the geogrid mesh file was exported into FLAC3D. Similarly to the generation method of a geogrid in PFC3D, the geogrid model in FLAC3D is also extended by means of some basic components such as ribs and junctions. The whole geogrid model is created through the assembly of the two basic components: ribs and connecting junctions. Both square and triangular geogrids were modeled in the large pullout test simulations. In addition, the buckling characteristics of geogrids are related to the flexural stiffness of the rib, which depends on the material properties and its geometrical properties. As shown in Figure 2e, the geogrid has a rib with a rectangular-shaped cross-section so that the bending stiffness of the geogrid rib along horizontal and vertical planes is different, which makes the deformation characteristics of geogrid more real [17].

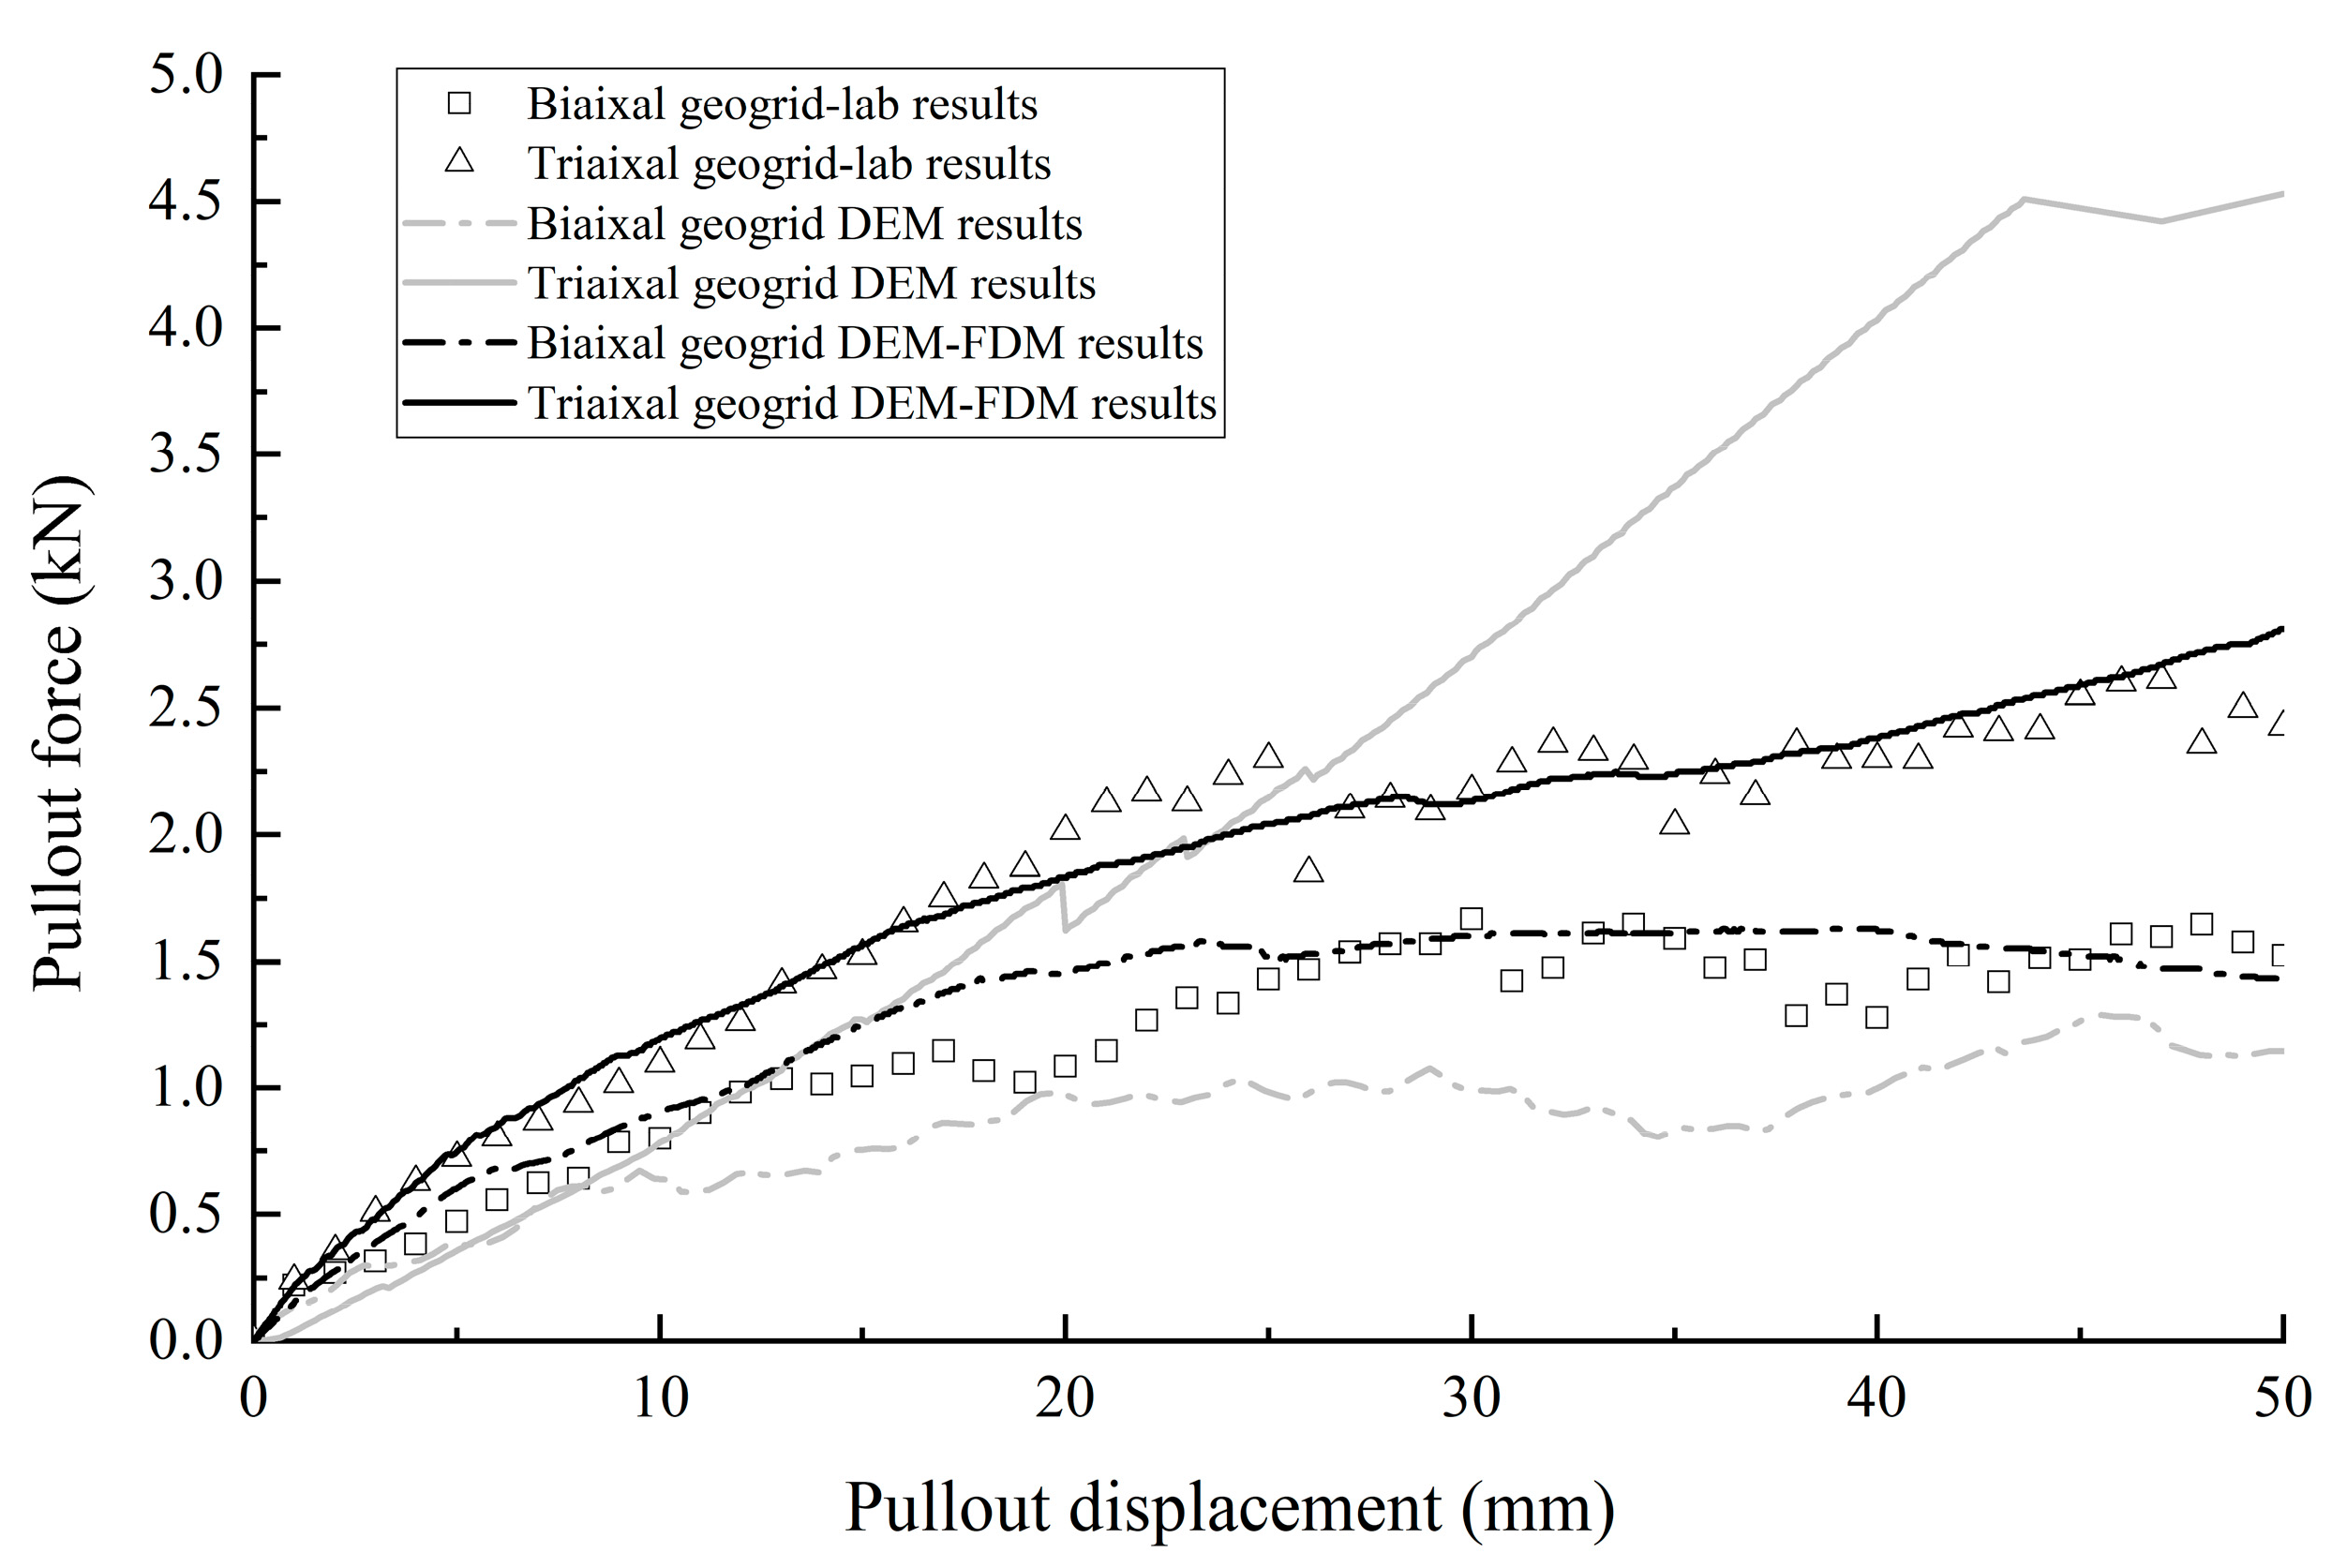
3.2. Calibration of FDM Geogrid Model

In order to obtain quantitatively reliable mechanical behavior, these geogrid models need to be calibrated. In previous DEM studies [14,15,16,17,18], the determination of the values of these parameters was a complex task, considering the stiffness and the friction coefficient f of the spheres constituting the geogrid. Moreover, the parameters of the bonds control the flexibility and strength of the geogrid, and their adjustment requires different experiments, in which each parameter or group of parameters acts independently. However, the mechanical parameters of the FDM geogrid model using FLAC3D are directly related to the polymer material, which can be regarded as a homogeneous elastic-plastic model. To reflect the stress-strain characteristics of the geogrid, the elastic-plastic model is used in the geogrid model, the calibration of which does not present any challenge.
Following previous studies [17,18,26], the single rib tensile test was conducted to calibrate the stiffness and strength of biaxial and triaxial geogrids. For the biaxial geogrid model, the force at failure for a single rib test is 1.37 kN at a failure strain of 10.5% [17]. For the triaxial geogrid model, the force at failure for a single rib extension test is 1.18 kN at a failure strain of 8.9% [28]. Because biaxial and triaxial geogrid models are made of the same polymer materials, the same material parameters are used. However, when using the same numerical parameters, it is difficult to find agreement between the calibration test results and the single rib test results of both biaxial and triaxial geogrids. Figure 3a,b show the differences in rib length and nodes between the two types of geogrids. Even though the data shown in Figure 3c do not seem to match very well with the reported failure force and strain (less than 10%), a better calibration of the grid would not change the general behavior in terms of aggregate-geogrid interlocking. Figure 3 shows the geometries of the calibration test and the calibration results of the geogrid models. The parameters are as follows: Young’s modulus E is 800 MPa, Poisson’s ratio υ is 0.3 and yield strength σ t is 134 MPa.
Apart from the stiffness of the geogrid, geogrid out-of-plane stiffness, or flexural rigidity, is another geogrid property, which can be used to evaluate the out-of-plane deformation of geogrids under their own mass, when these are extended over the edge of a planar surface. Peralta et al. [28] performed a compression test of a geogrid in the laboratory and a DEM compression test of a single-layer geogrid. Although this test is only performed on geogrids for manufacturing quality control purposes, it is a useful qualitative indicator used to assess the geogrid models. When the geogrid specimen was horizontally compressed from both sides, the middle part of the geogrid was arched. However, the DEM geogrid model only deformed in the geogrid plane and no arching occurred out of the plane as shown in Figure 4. On the contrary, the FDM triaxial geogrid model with 54 apertures in this study shows asymmetric buckling under compression, which is similar to the buckling observed experimentally. These comparisons indicate that the mechanical behavior of geogrids can be reproduced using the FDM geogrid model that can transmit forces and moments; therefore, the calibrated set of parameters is acceptable.

3.3. DEM-FDM Coupled Model of Pullout Test

Figure 5 shows the DEM-FDM coupled model of the large box pullout test, which was performed using the combination of PFC6.0 and FLAC6.0. The dimensions of the pullout box and the geogrid size and position are the same as those used in the laboratory. The pullout model mainly contains two parts, an idealized-shape clump in PFC3D to represent the ballast particle and the solid element in FLAC3D to represent the geogrid, of which the mechanical behavior and calibration were described above. In order to compare the pullout performance of the biaxial and triaxial geogrids, the effective reinforcement area of the biaxial geogrid sample (with 12 apertures of 65 mm) and the triaxial geogrid sample (with 20 apertures of 75 mm) were almost the same in laboratory tests and simulations, at 50.7 and 48.7 cm2, respectively, as shown in Figure 5c. This idealized-shape model is expected to offer an irregular shape using the least number of spheres necessary to provide particle interlocking. It has been proven that the simplified two-ball clump approach can provide similar interlocking effects between particles [17]. A more complex shape of particles would increase the computational time but not influence the comparison of the general interlocking behavior of geogrids.
The simulation procedures followed the sample preparation performed in the experiment. First, ballast particles were generated in the lower half of the box and then recycled to equilibrium. Then, two frictionless walls were placed in the middle of the box, and then the geogrid mesh was imported and placed between the above two walls. Because there will be large contact forces at the initial stage of ballast particle generation, two protective walls on both sides of the geogrid were used to protect the geogrid. Next, another portion of the ballast particles were generated in the upper space of the geogrid and cycled until they were balanced. After that, a wall was formed on the upper surface of the ballast to prepare for further surcharge loading. Finally, the protective wall was deleted and the whole sample was cycled to equilibrium. The top surcharge of 0.5 kN was achieved using a static load.
In PFC3D, the size of the non-spherical clump is defined as the equivalent diameter of a sphere with the same volume. The 2-ball clump, as shown in Figure 5b, has the equivalent volume of a sphere of 40-mm dimensions. The specimen contained approximately 1600 two-ball clumps with a mean size D50 of 40 mm and a coefficient of uniformity Cu of 1.0, as shown in Figure 5a. This can be considered satisfactory as ballast is usually reasonable uniformly graded to provide large enough voids to facilitate good drainage. The normal and shear stiffness of the particles were 1.0 × 10⁸ N/m and the stiffnesses of the walls were set at the same values as those of the particles. The clump, wall and geogrid friction coefficients were all set to be 0.6. The density of the ballast particles was 2600 kg/m3. A constant horizontal pullout rate was given to the right-hand node at the end of the geogrid. To avoid any dynamic effects, the pullout rate was gradually increased linearly with time from zero to the final rate at the initial 1-mm displacement. The simulation was terminated when the total pullout displacement reached 50 mm. In the simulation process, the pullout force and pullout displacement were recorded.

4. Results and Discussion

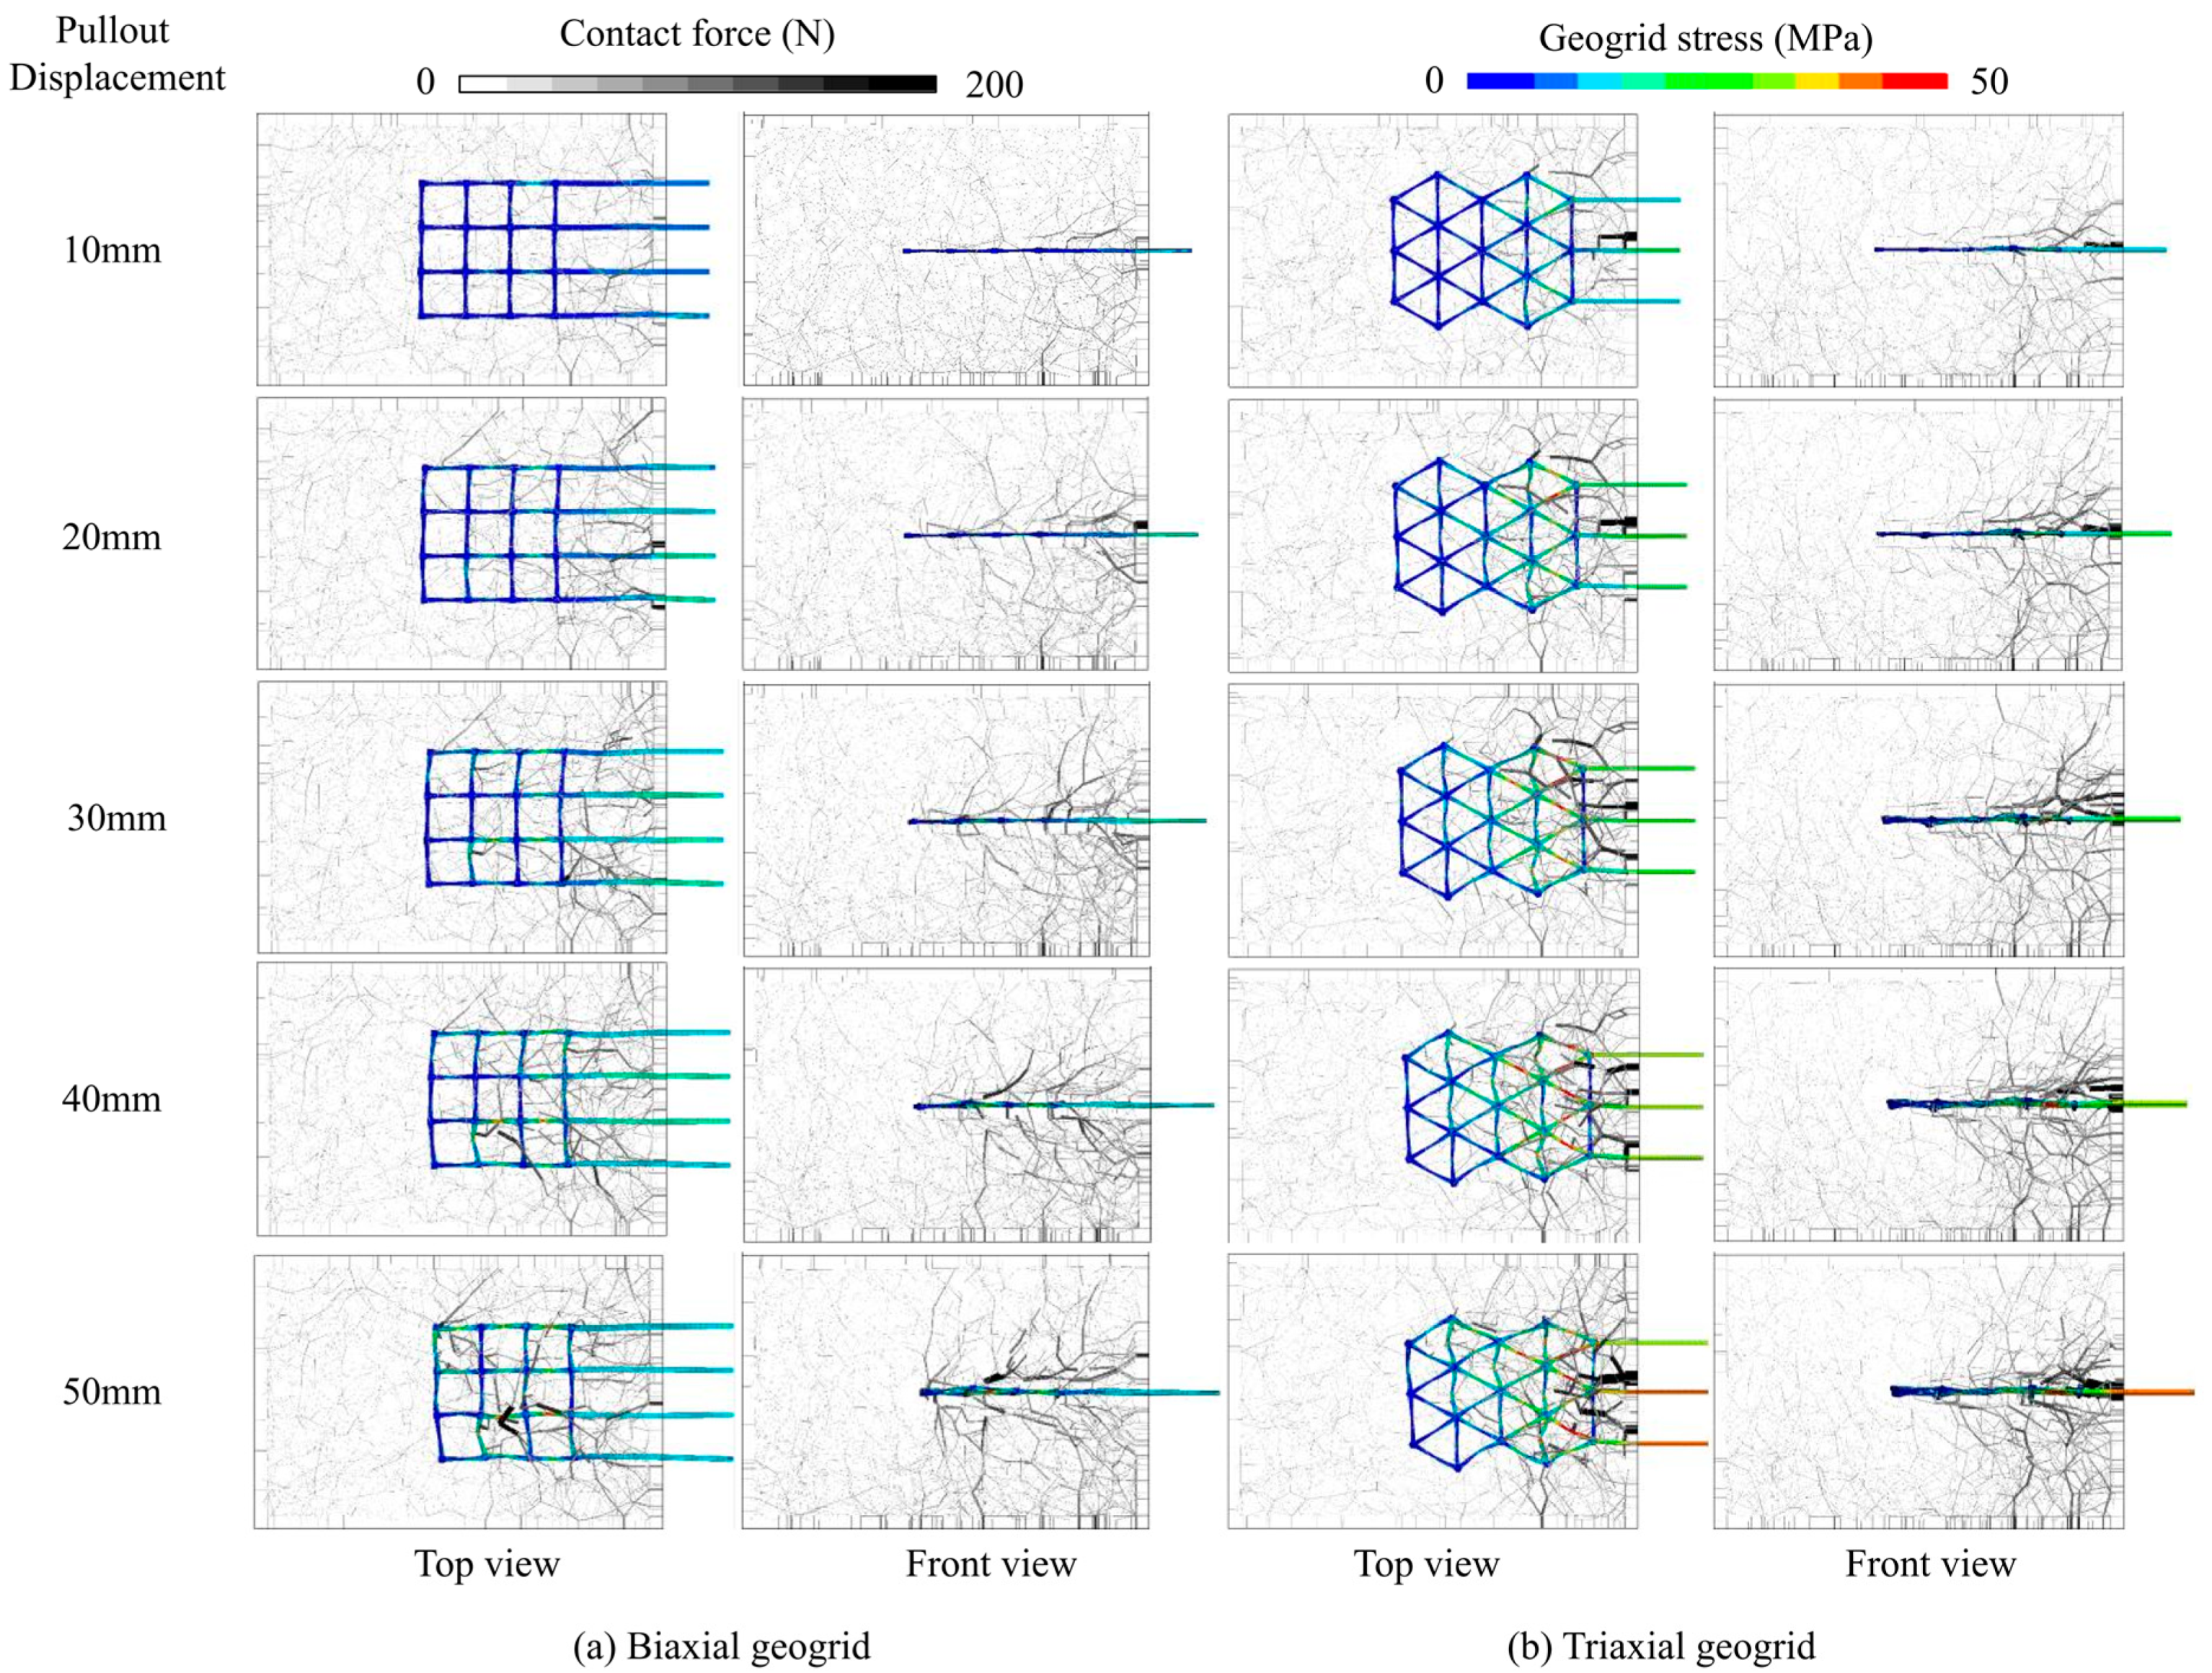
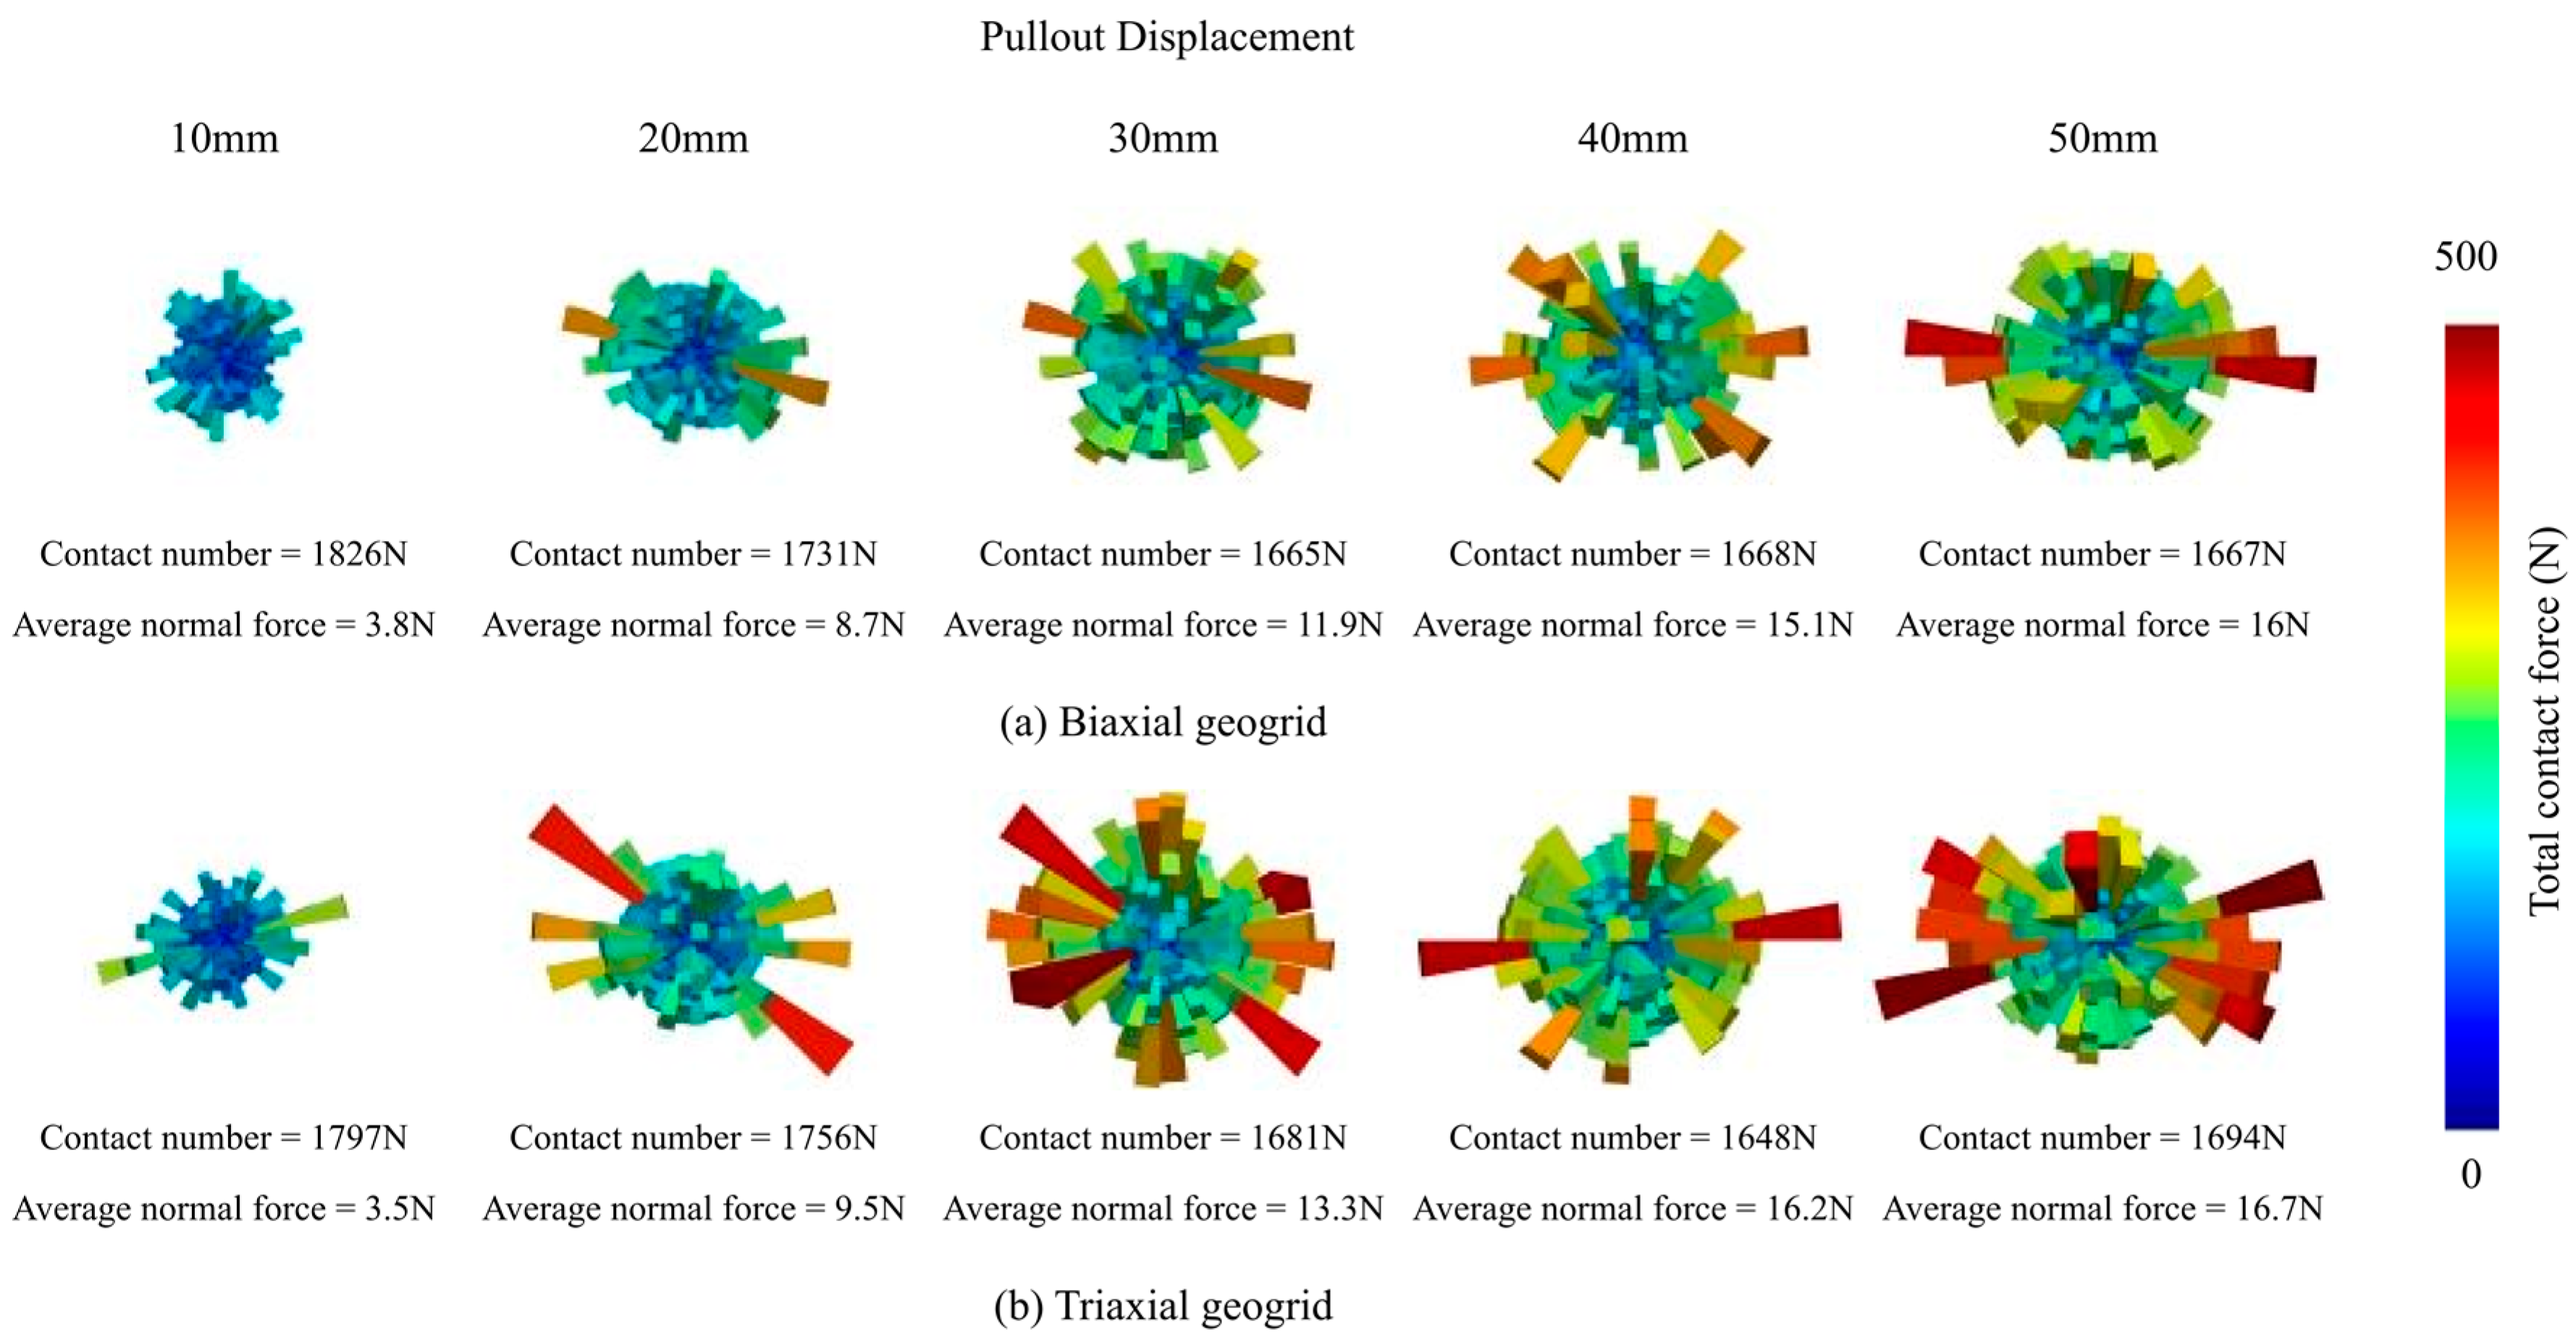
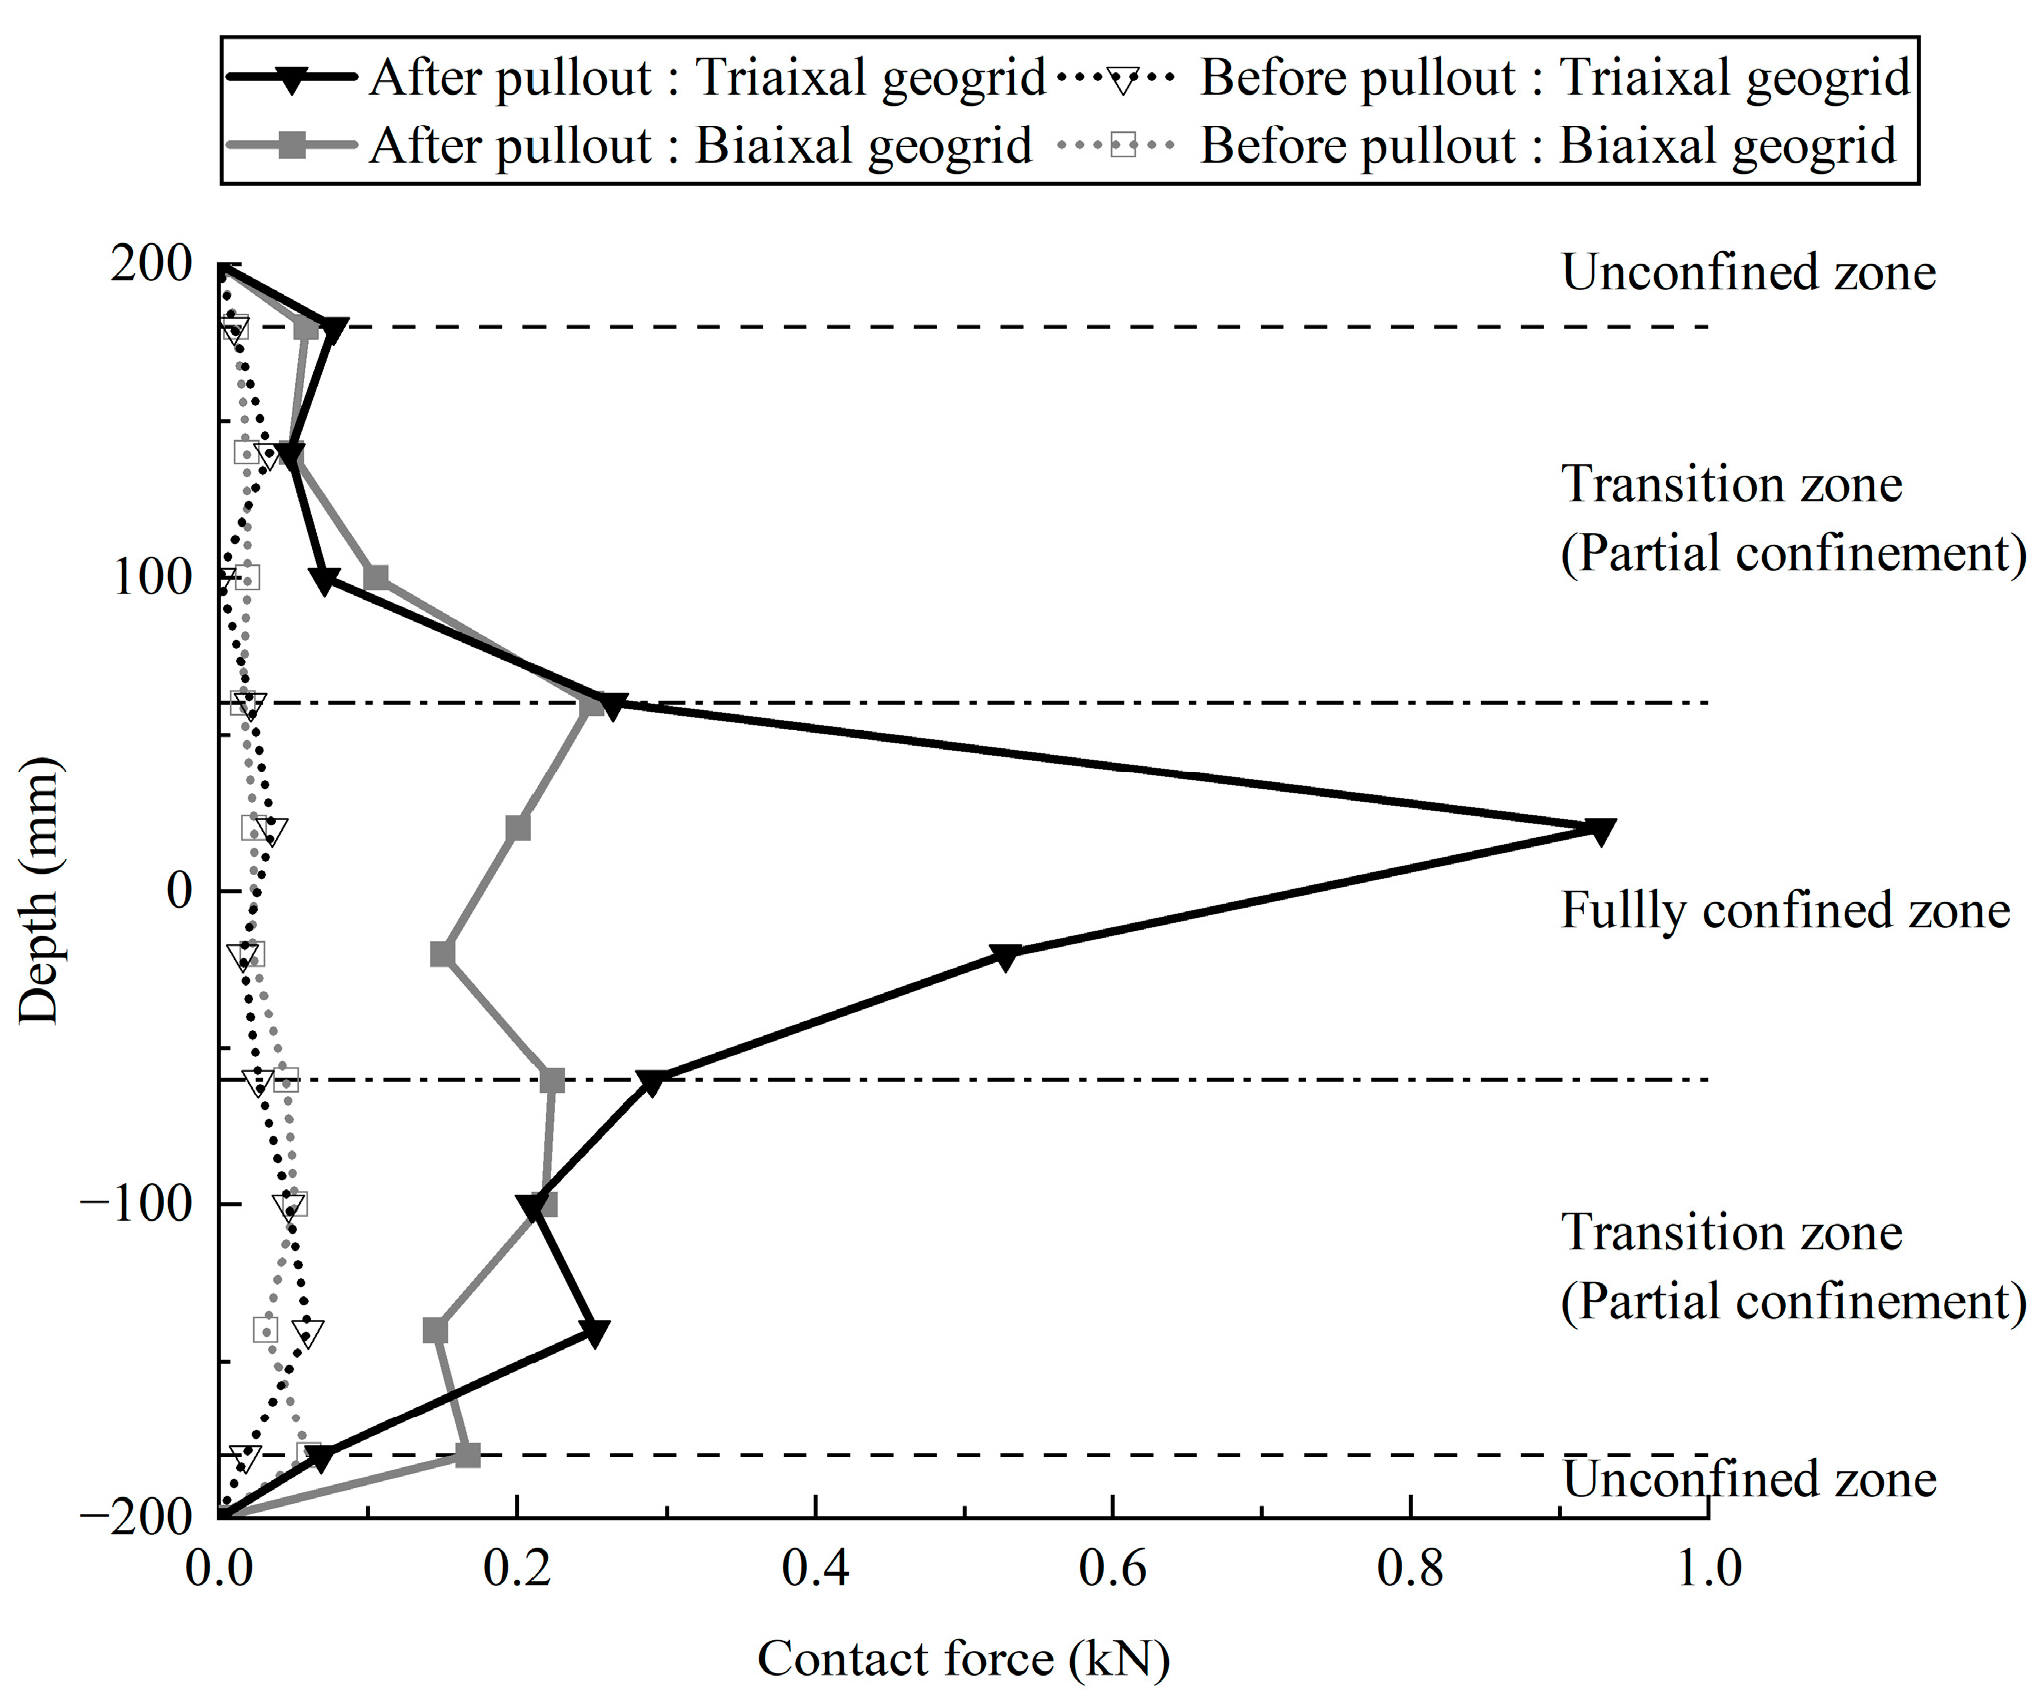
4.1. Interaction Behavior between Particles and the Geogrid

Figure 6 shows the comparison of the pullout force of biaxial and triaxial geogrid samples under 0.5 kN surcharge and compares the DEM results [26] and DEM-FDM results with the experimental results [17]. It clearly shows that the triaxial geogrid with an aperture of 75 mm has better pullout resistance than the biaxial geogrid with an aperture of 65 mm, which is consistent with previous studies. However, it appears that the DEM simulations underestimated the pullout force of the biaxial geogrid after a displacement of approximately 20 mm, and the pullout force of the triaxial geogrid was not predicted well after a displacement of approximately 25 mm. Compared with the DEM results, the DEM-FDM results exhibit higher consistency with the experimental curves, which proves that the DEM-FDM coupled method is better than the DEM method in simulating the pullout behavior of geogrids, especially for the triaxial geogrid.
Comparing the DEM-FDM results and the experimental results, it can be found that the pullout force of the biaxial geogrid reaches the peak after a certain displacement (about 25 mm), and then remains at a stable value. In contrast, the pullout force of the triaxial geogrid increases continuously with the increase of pullout displacement, which indicates that the triaxial geogrid has the potential to increase the pullout force after a 50-mm pullout displacement.
The evolution of the contact forces between the particles and geogrid stress during pulling is shown in Figure 7. Each contact force between particles is represented at the contact point by a gray cylinder in the direction of the force, of which the diameter depends on the value of the force and of which the length is proportional to the distance between their centres. All graphs use the same scale factor. Figure 7 displays the strong contact forces in the vicinity of the biaxial geogrid area, which clearly shows the interlocking effect, which is consistent with previous DEM simulations [26]. It can also be seen that in the pullout process, a stress arch is gradually formed around the geogrid, indicating an interlocking effect between the geogrid and the ballast. Comparing the size and distribution of the force chain, it can be concluded that the force chain formed around the triaxial geogrid seems to be larger at the same pullout displacement, indicating that the triaxial geogrid has a better reinforcement effect than the biaxial geogrid.
Arching around the geogrid at the front of the box is clearly observable in both models, indicating resistance to pulling. Therefore, the corresponding geogrid area suffered stronger stress, especially in the later stage during pullout. By contrast, at the same stage, the simulation with the triaxial geogrid (Figure 7b) shows larger stress than that with the biaxial geogrid (Figure 7a), which can be attributed to the triangular aperture facilitating stronger interlocking than the square aperture.
In order to quantitatively analyse the contact force distribution between particles during pullout, the contact information for the geogrid-reinforced ballast was extracted and analysed, as shown in Figure 8. The sum of all contact forces in each direction interval was measured, and the number and the average value of all contacts were recorded. At the initial stage of the pullout, the contact force vector between ballasts was mainly observed in the vertical direction owing to the self-weight of the ballast and the vertical surcharge. With the progress of the pullout, the horizontal contact force gradually increased and gradually diffused from 0° to 45°. This indicates that the contact force between particles was gradually generated along, above and below the geogrid to produce the extra pullout resistance when the geogrid moved in the horizontal direction. The total contact numbers of these two kinds of geogrid-reinforced sample were similar. However, compared with the biaxial geogrid-reinforced ballast sample, the average contact force of the triaxial geogrid-reinforced sample was larger and more widely distributed at the same pullout displacement, which led to a better reinforcement effect.

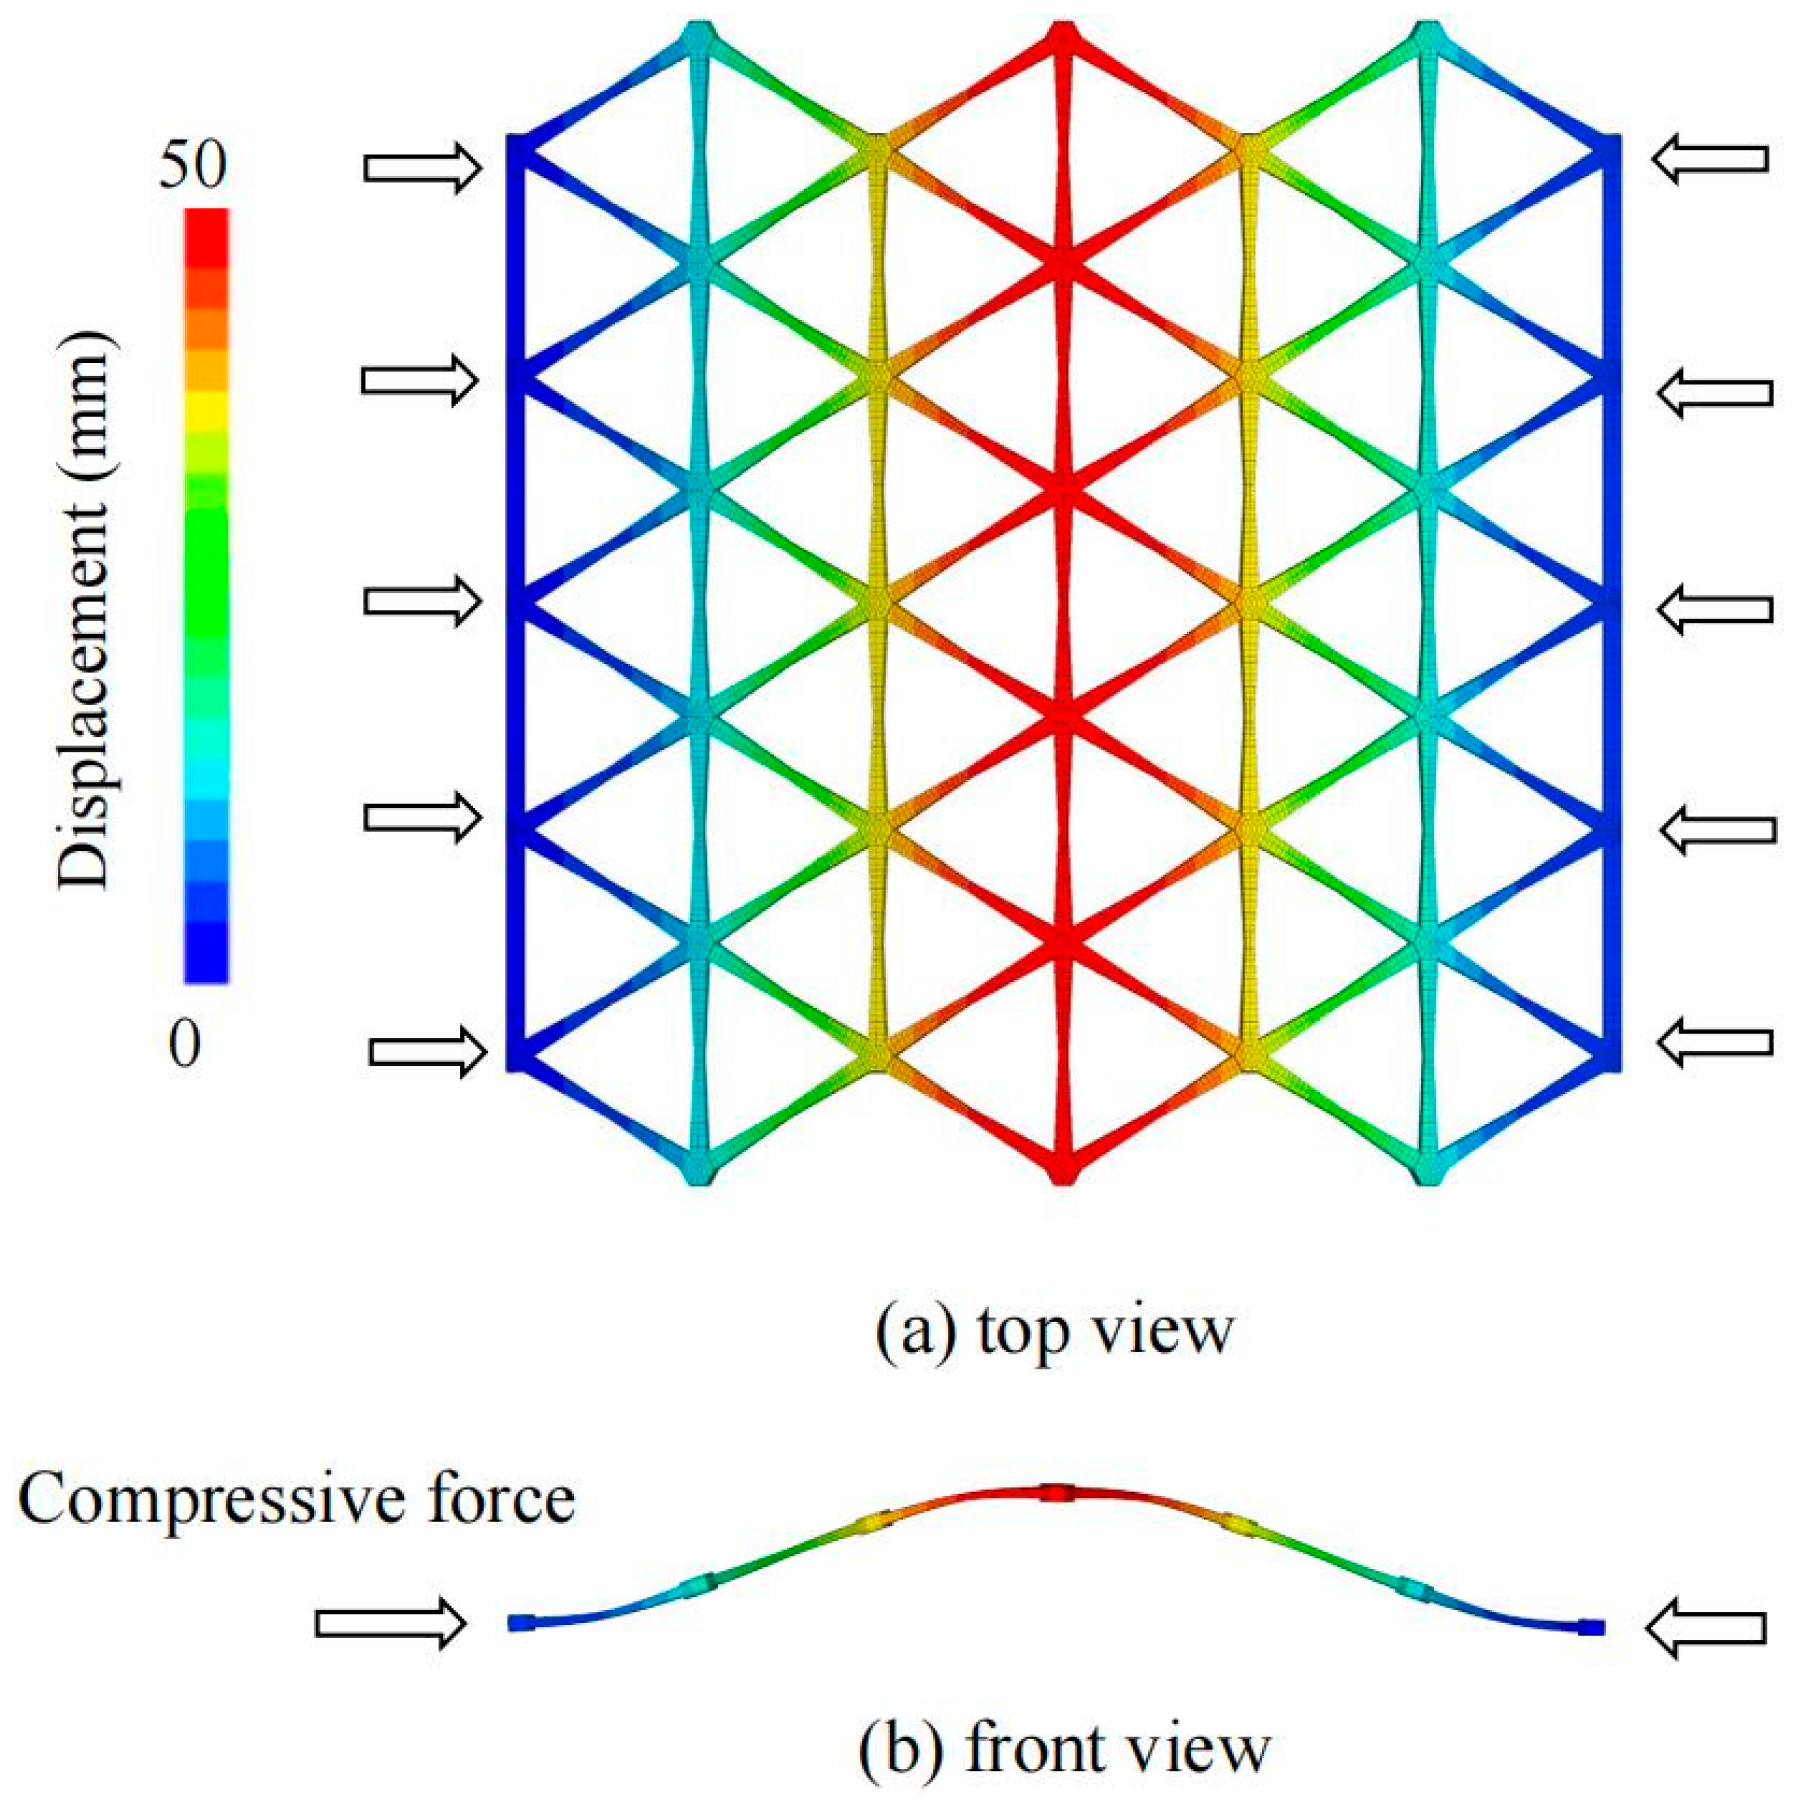
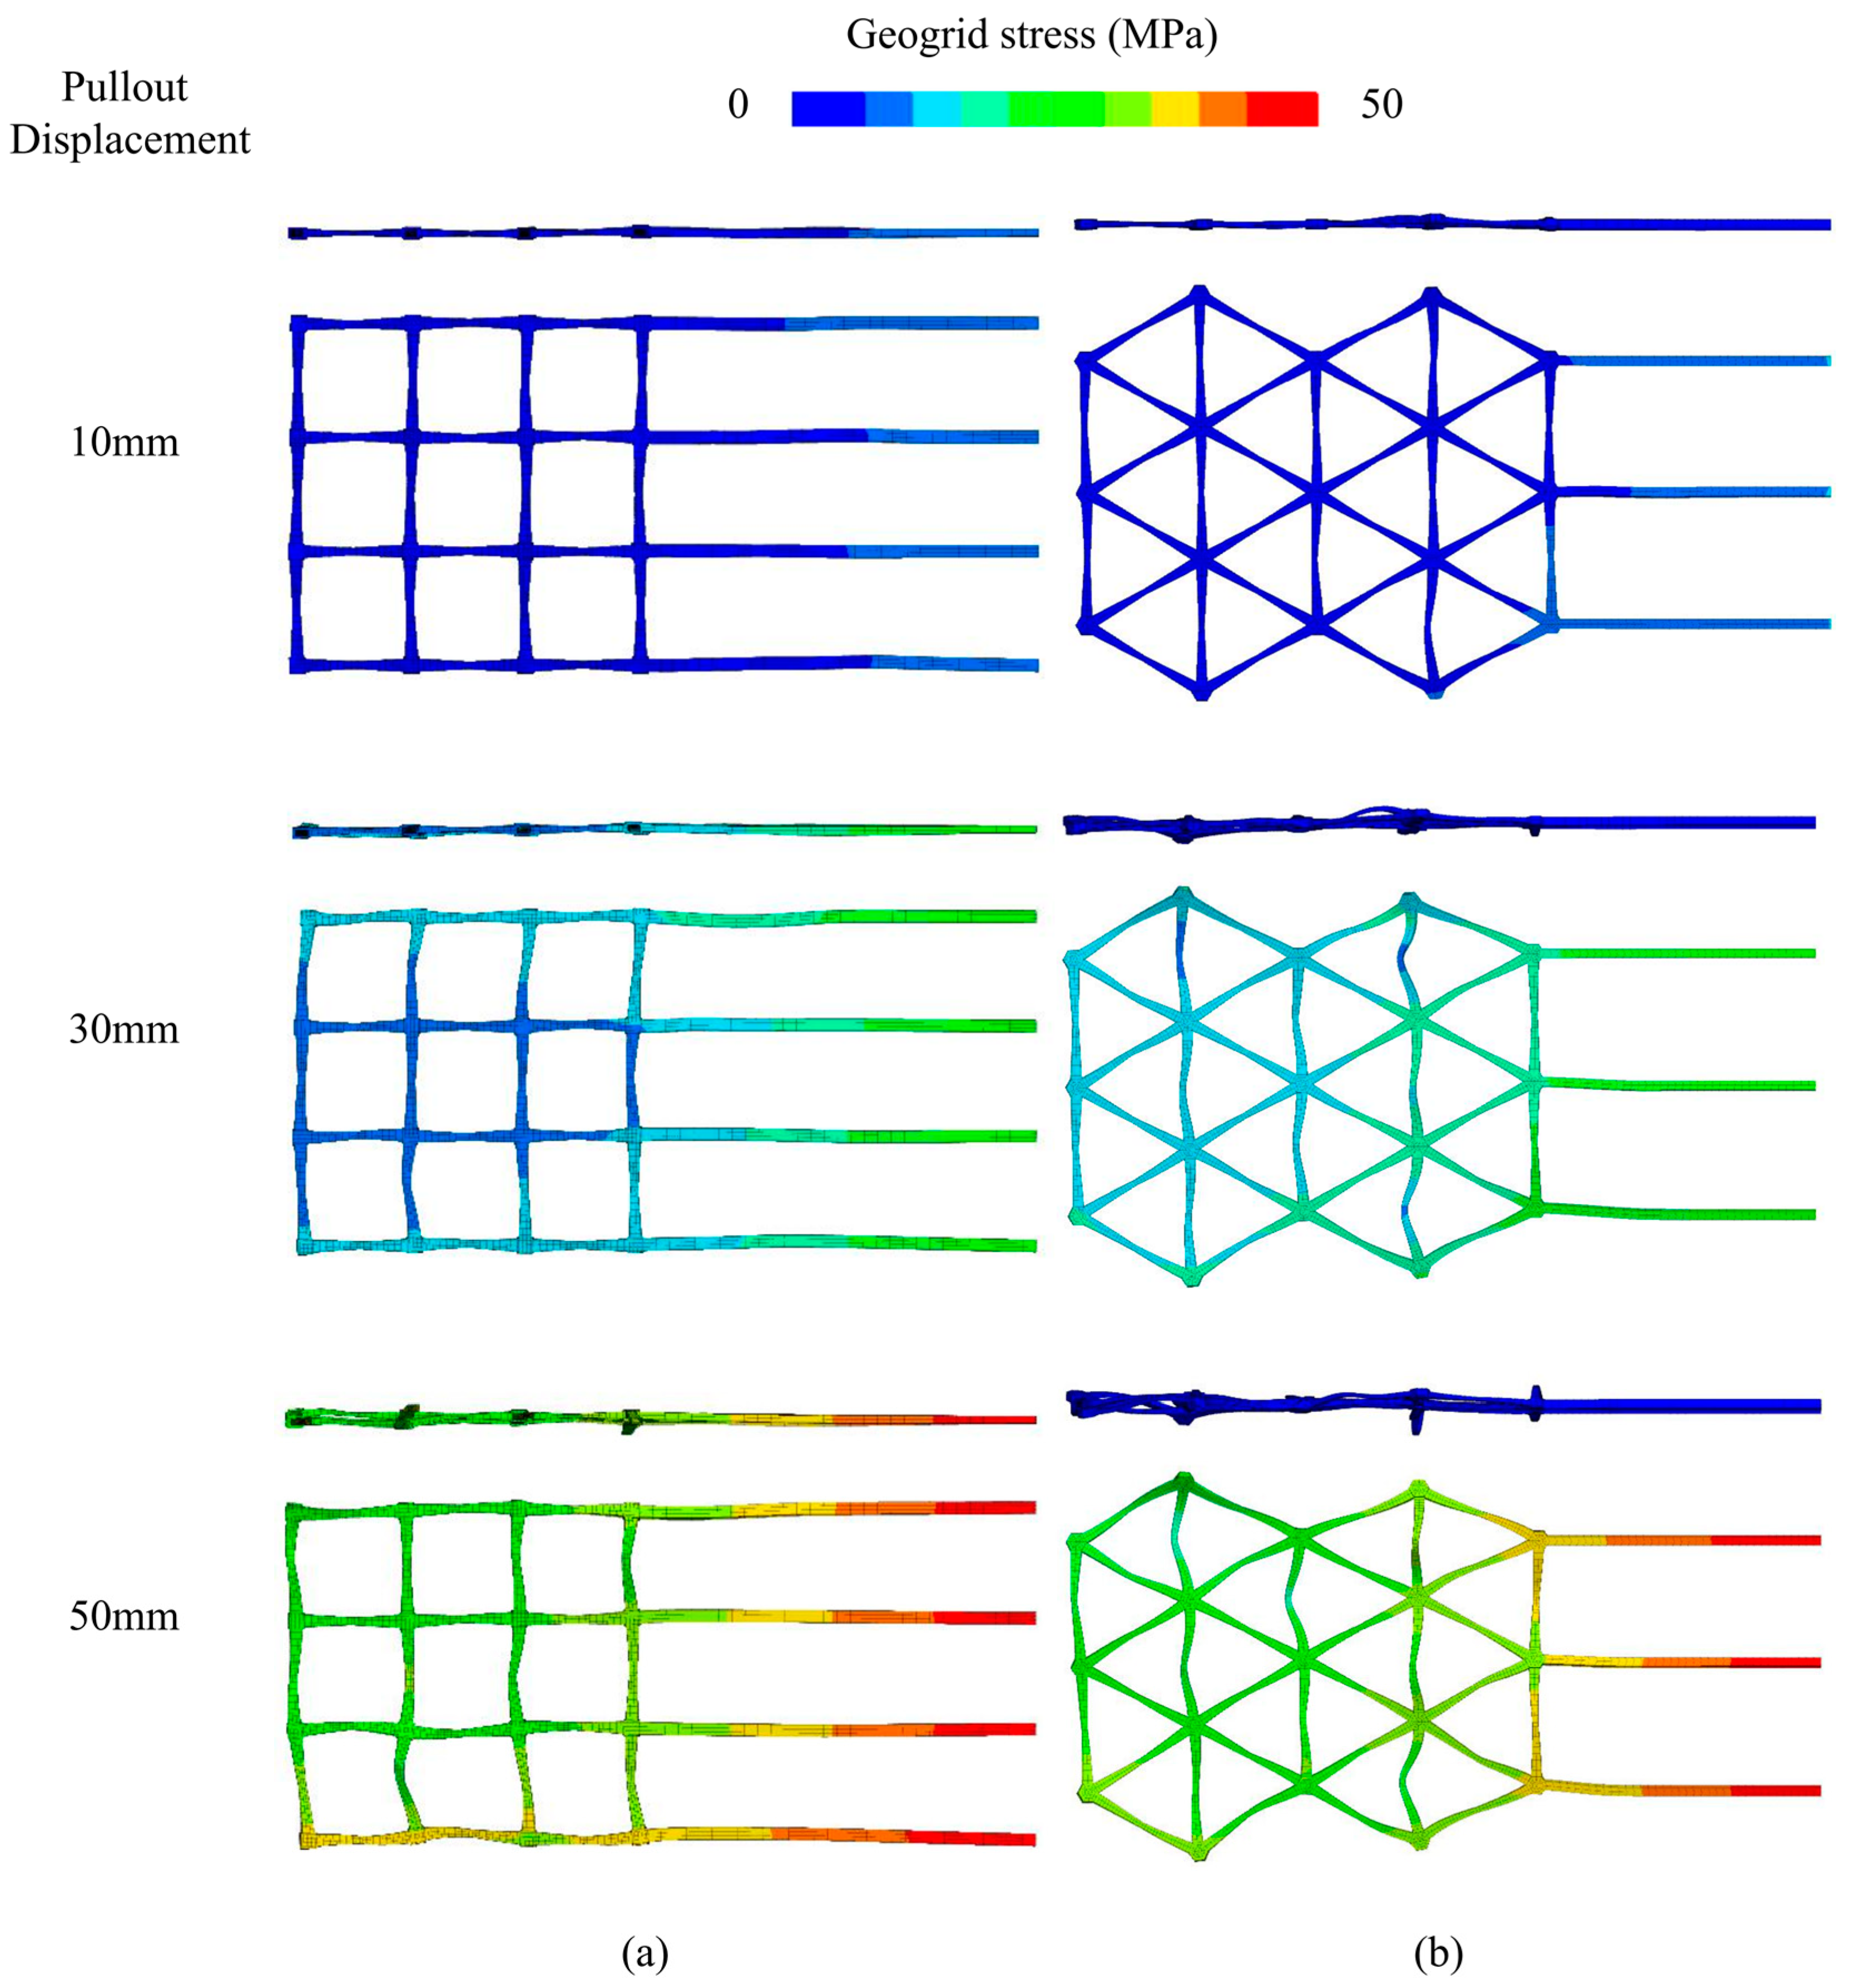
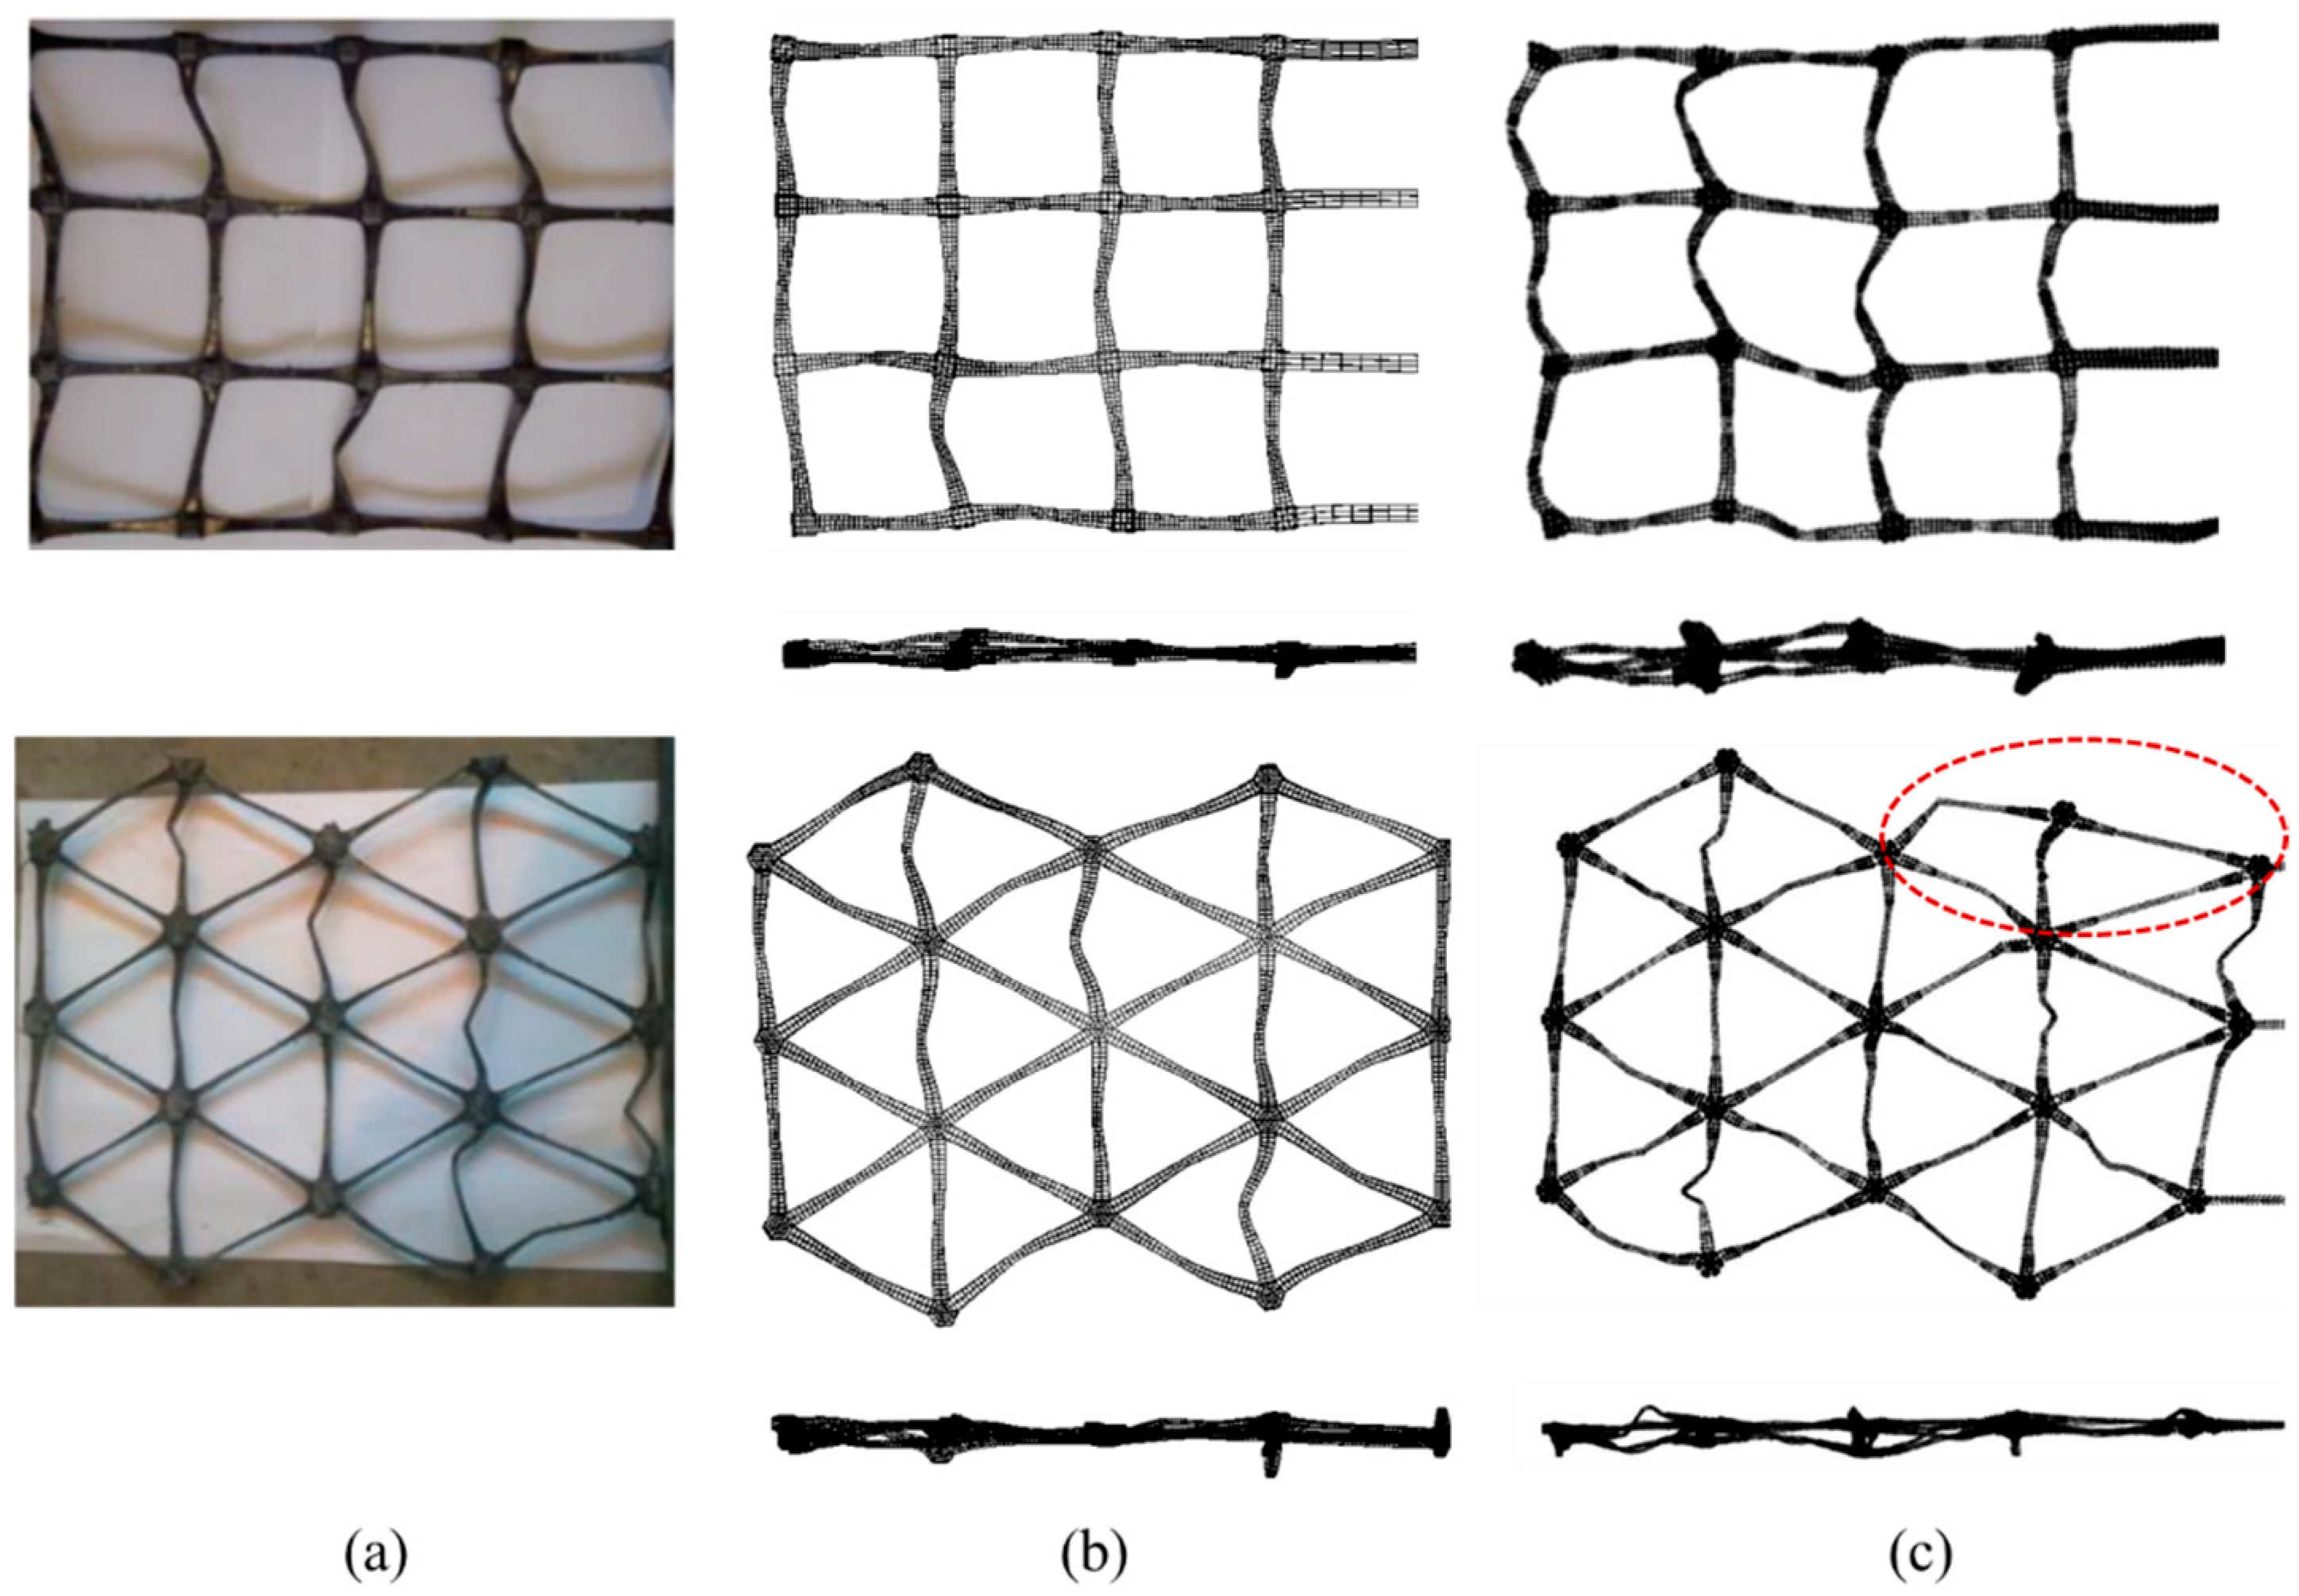
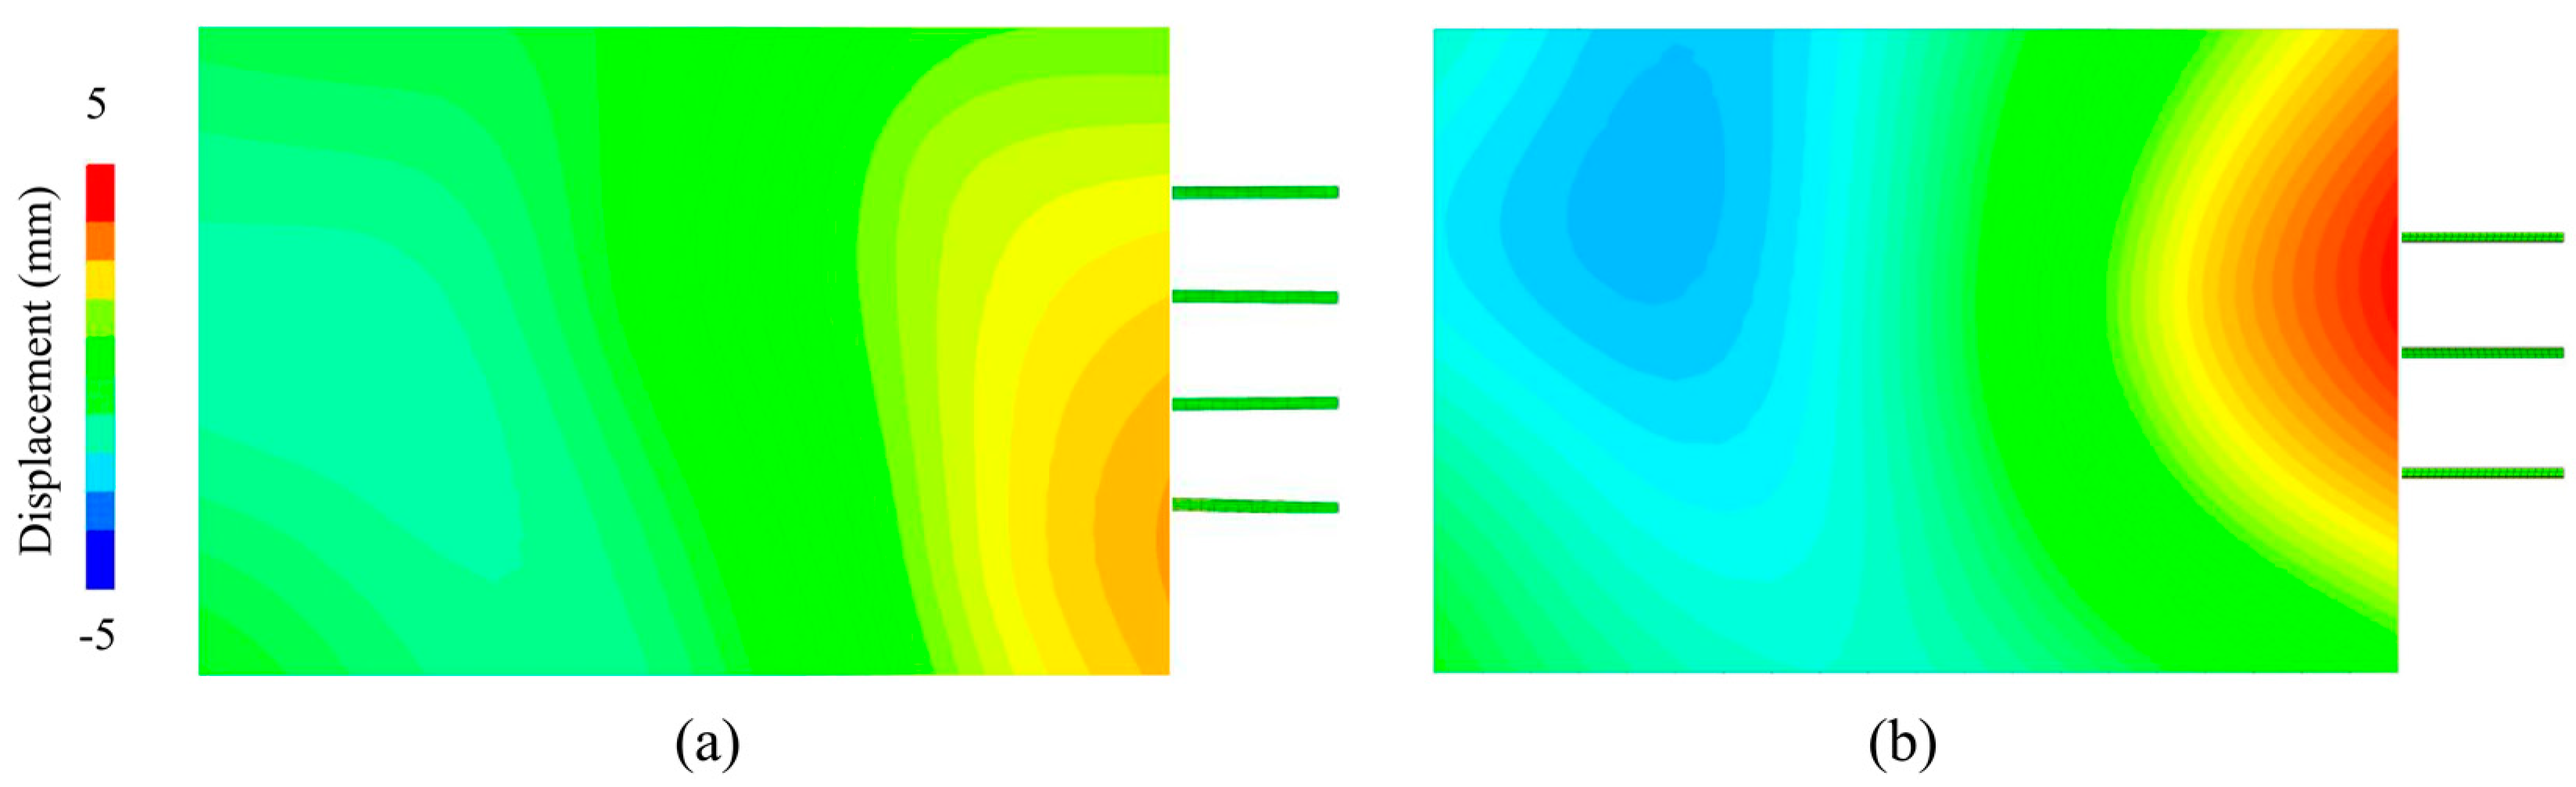
4.2. Geogrid Deformation Behavior of Biaxial and Triaxial Geogrids

The comparison of the biaxial and triaxle geogrid deformation characteristics at different pullout displacements is also shown in Figure 9. For the biaxial geogrid, the longitudinal rib remains straight because it bears the pulling force and is in a tensile state. Meanwhile, transverse ribs have different extents of bending deformation, because the transverse rib bends easily under the extrusion of the ballast. For the triaxial geogrid, the transverse rib has a similar bending deformation, but the inclined rib also has a bending deformation. The deformation pattern of the triaxial geogrid is more complex than that of the biaxial geogrid, which can be attributed to the angle between the inclined rib and the pullout direction being less than 90°. By contrast, the simulation with the triaxial geogrid shows stronger stress and more localized deformation than that with the biaxial geogrid. This observation evidently highlights the better interlocking of the triaxial geogrid.
Figure 10 shows the two types of geogrid deformation in the experimental test, DEM-FDM simulation and DEM simulation [26]. Compared with the real geogrid deformation observed in the laboratory, the geogrid deformation in the DEM simulation was much larger, and the geogrid structure was damaged, as highlighted in the dashed box. Compared with the DEM simulation, the geogrid deformation pattern and degree in the DEM-FDM simulation were closer to the real geogrid deformation, which shows that the DEM-FDM coupled method has much promise in simulating the interaction of the ballast and geogrid. Because the geogrid composed of the solid element in FLAC3D has a more real geometry than the geogrid composed of bonded particles in PFC3D, the FLAC3D geogrid shows more real deformation characteristics.

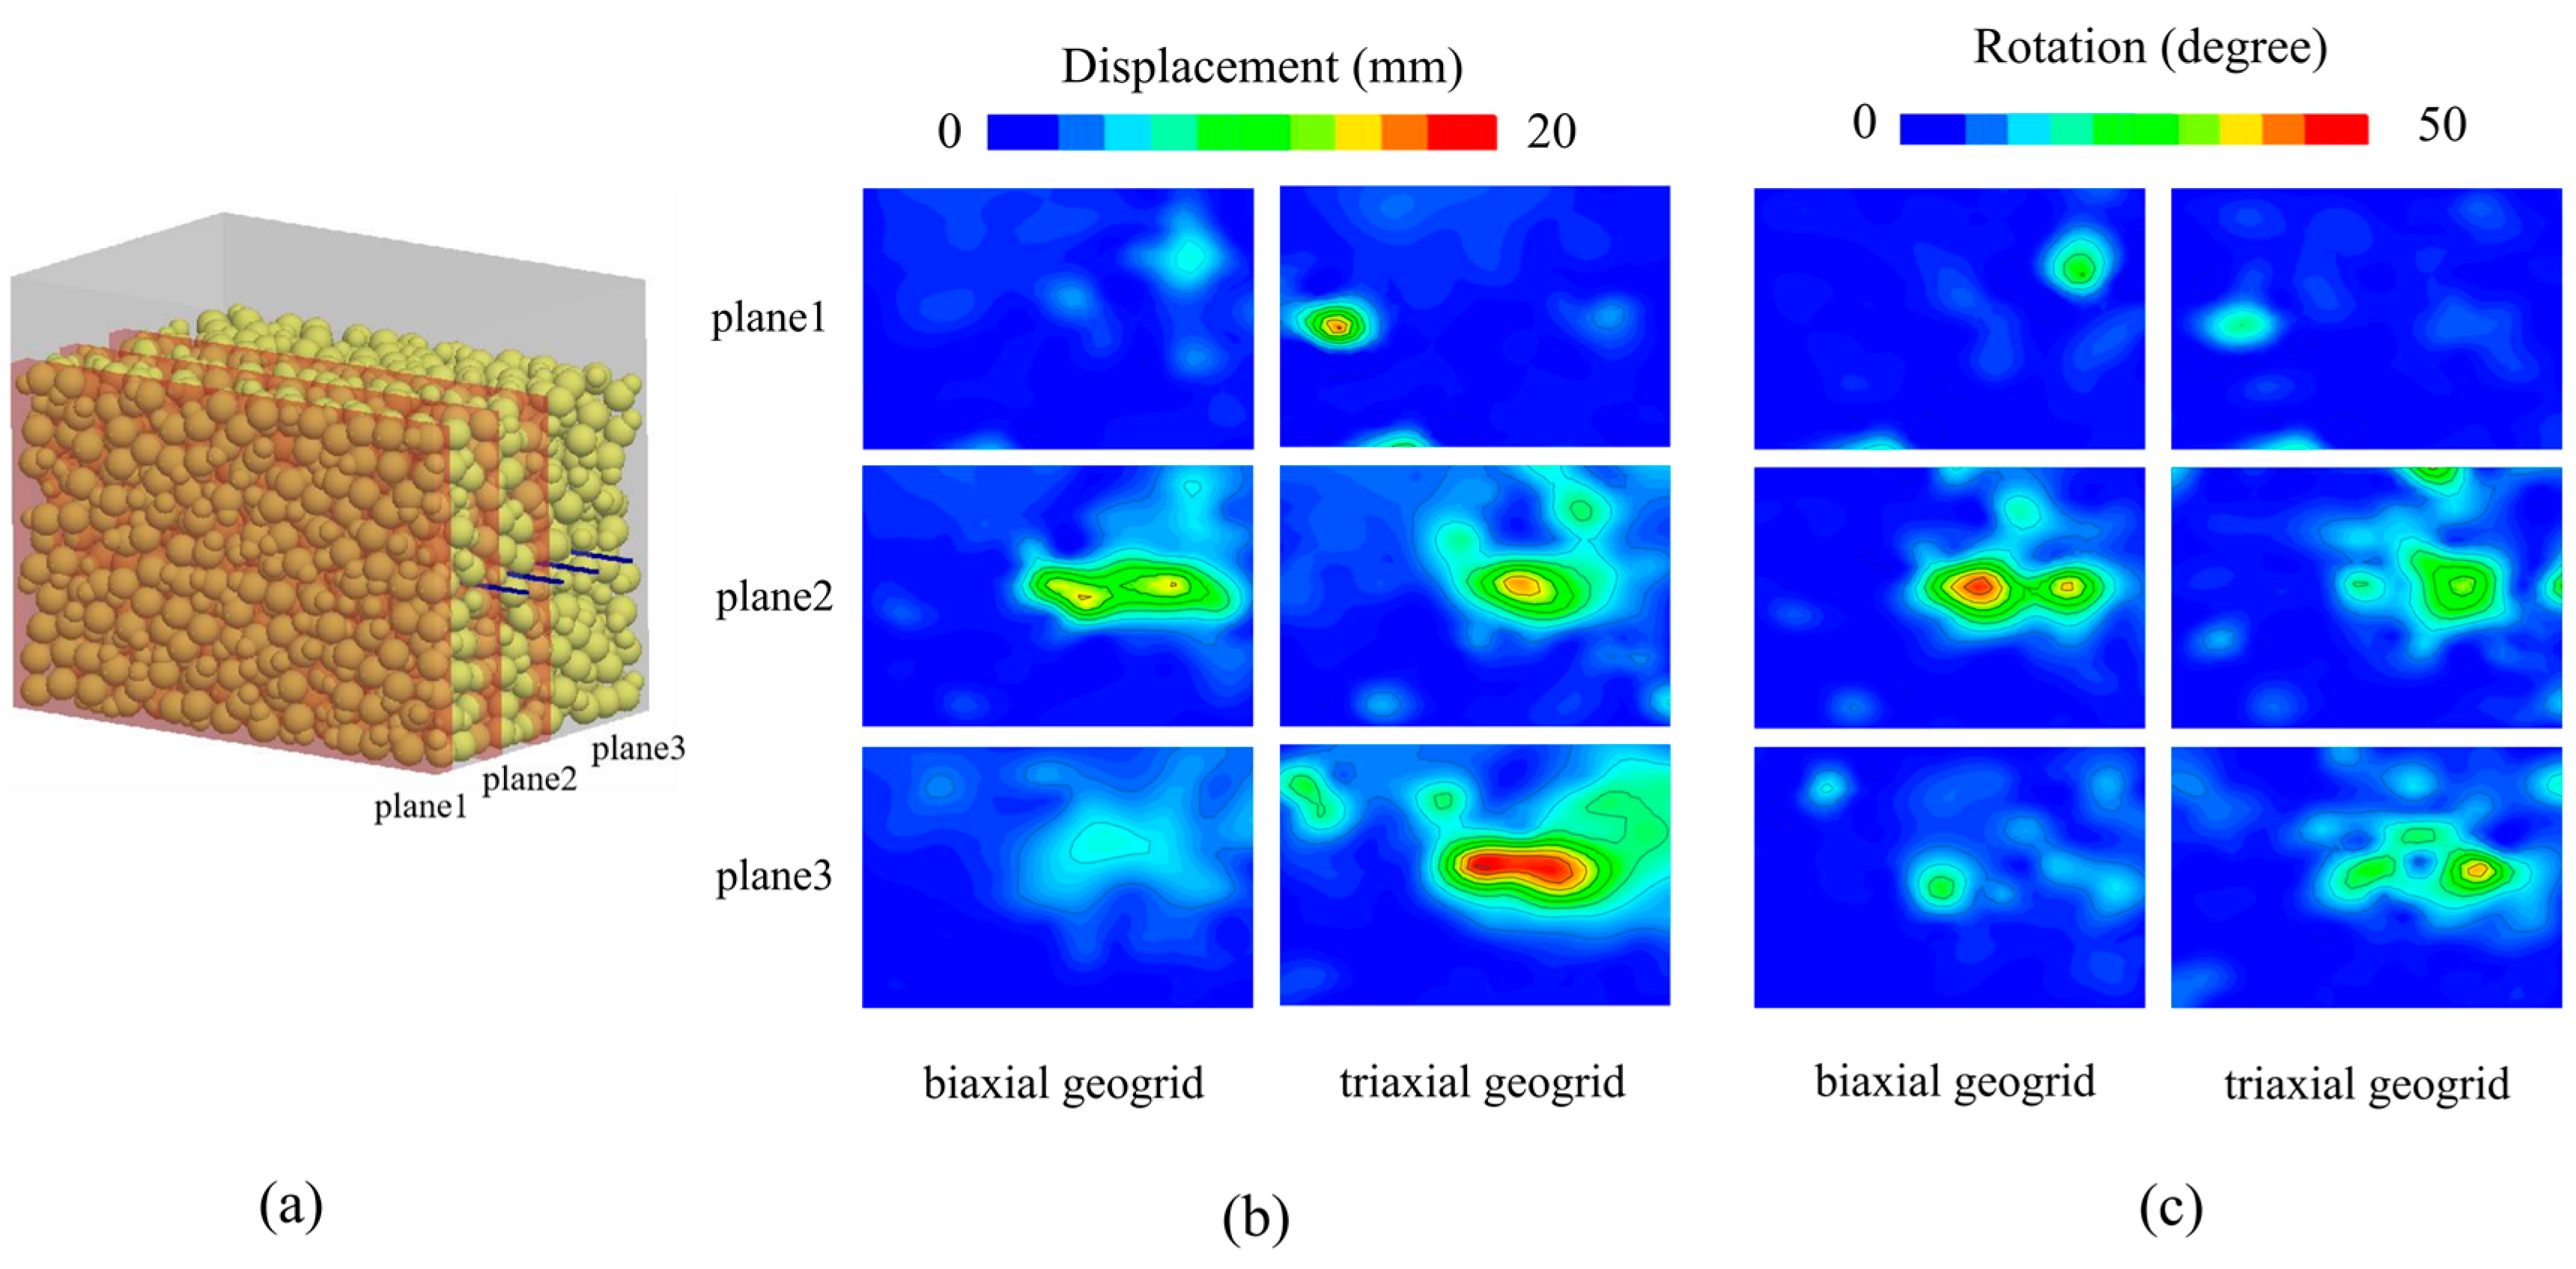
4.3. Particle Movement

According to Gao et al. [29], due to the existence of a geogrid structure, the particle rotation resistance is expected to increase. Particle resistance has an important impact on the interaction performance between the ballast and the geogrid. The resistance is mainly caused by the friction and embedment between the ballast and the geogrid, which leads to the translation and rotation of the ballast. Figure 11 shows the displacement and rotation of the particles around the geogrid at a 50-mm pullout displacement. In order to provide insights into particle movement, three sections—plane 1, plane 2 and plane 3—were chosen, as shown in Figure 11a. The rotation was calculated as the angle between the clumps’ main axes from the initial state (0 mm) to the final state (50 mm).
Figure 11b,c show that the particles near the geogrid reinforced area produce larger displacement and rotation. The greater the displacement and rotation of the ballast, the stronger the interlocking between the geogrid and the ballast in this area. For the sections at three different positions (planes 1–3), the maximum displacement and rotation of the triaxial geogrid appear near plane 3. Meanwhile, conversely, the maximum displacement and rotation of biaxial geogrid appear near plane 2.

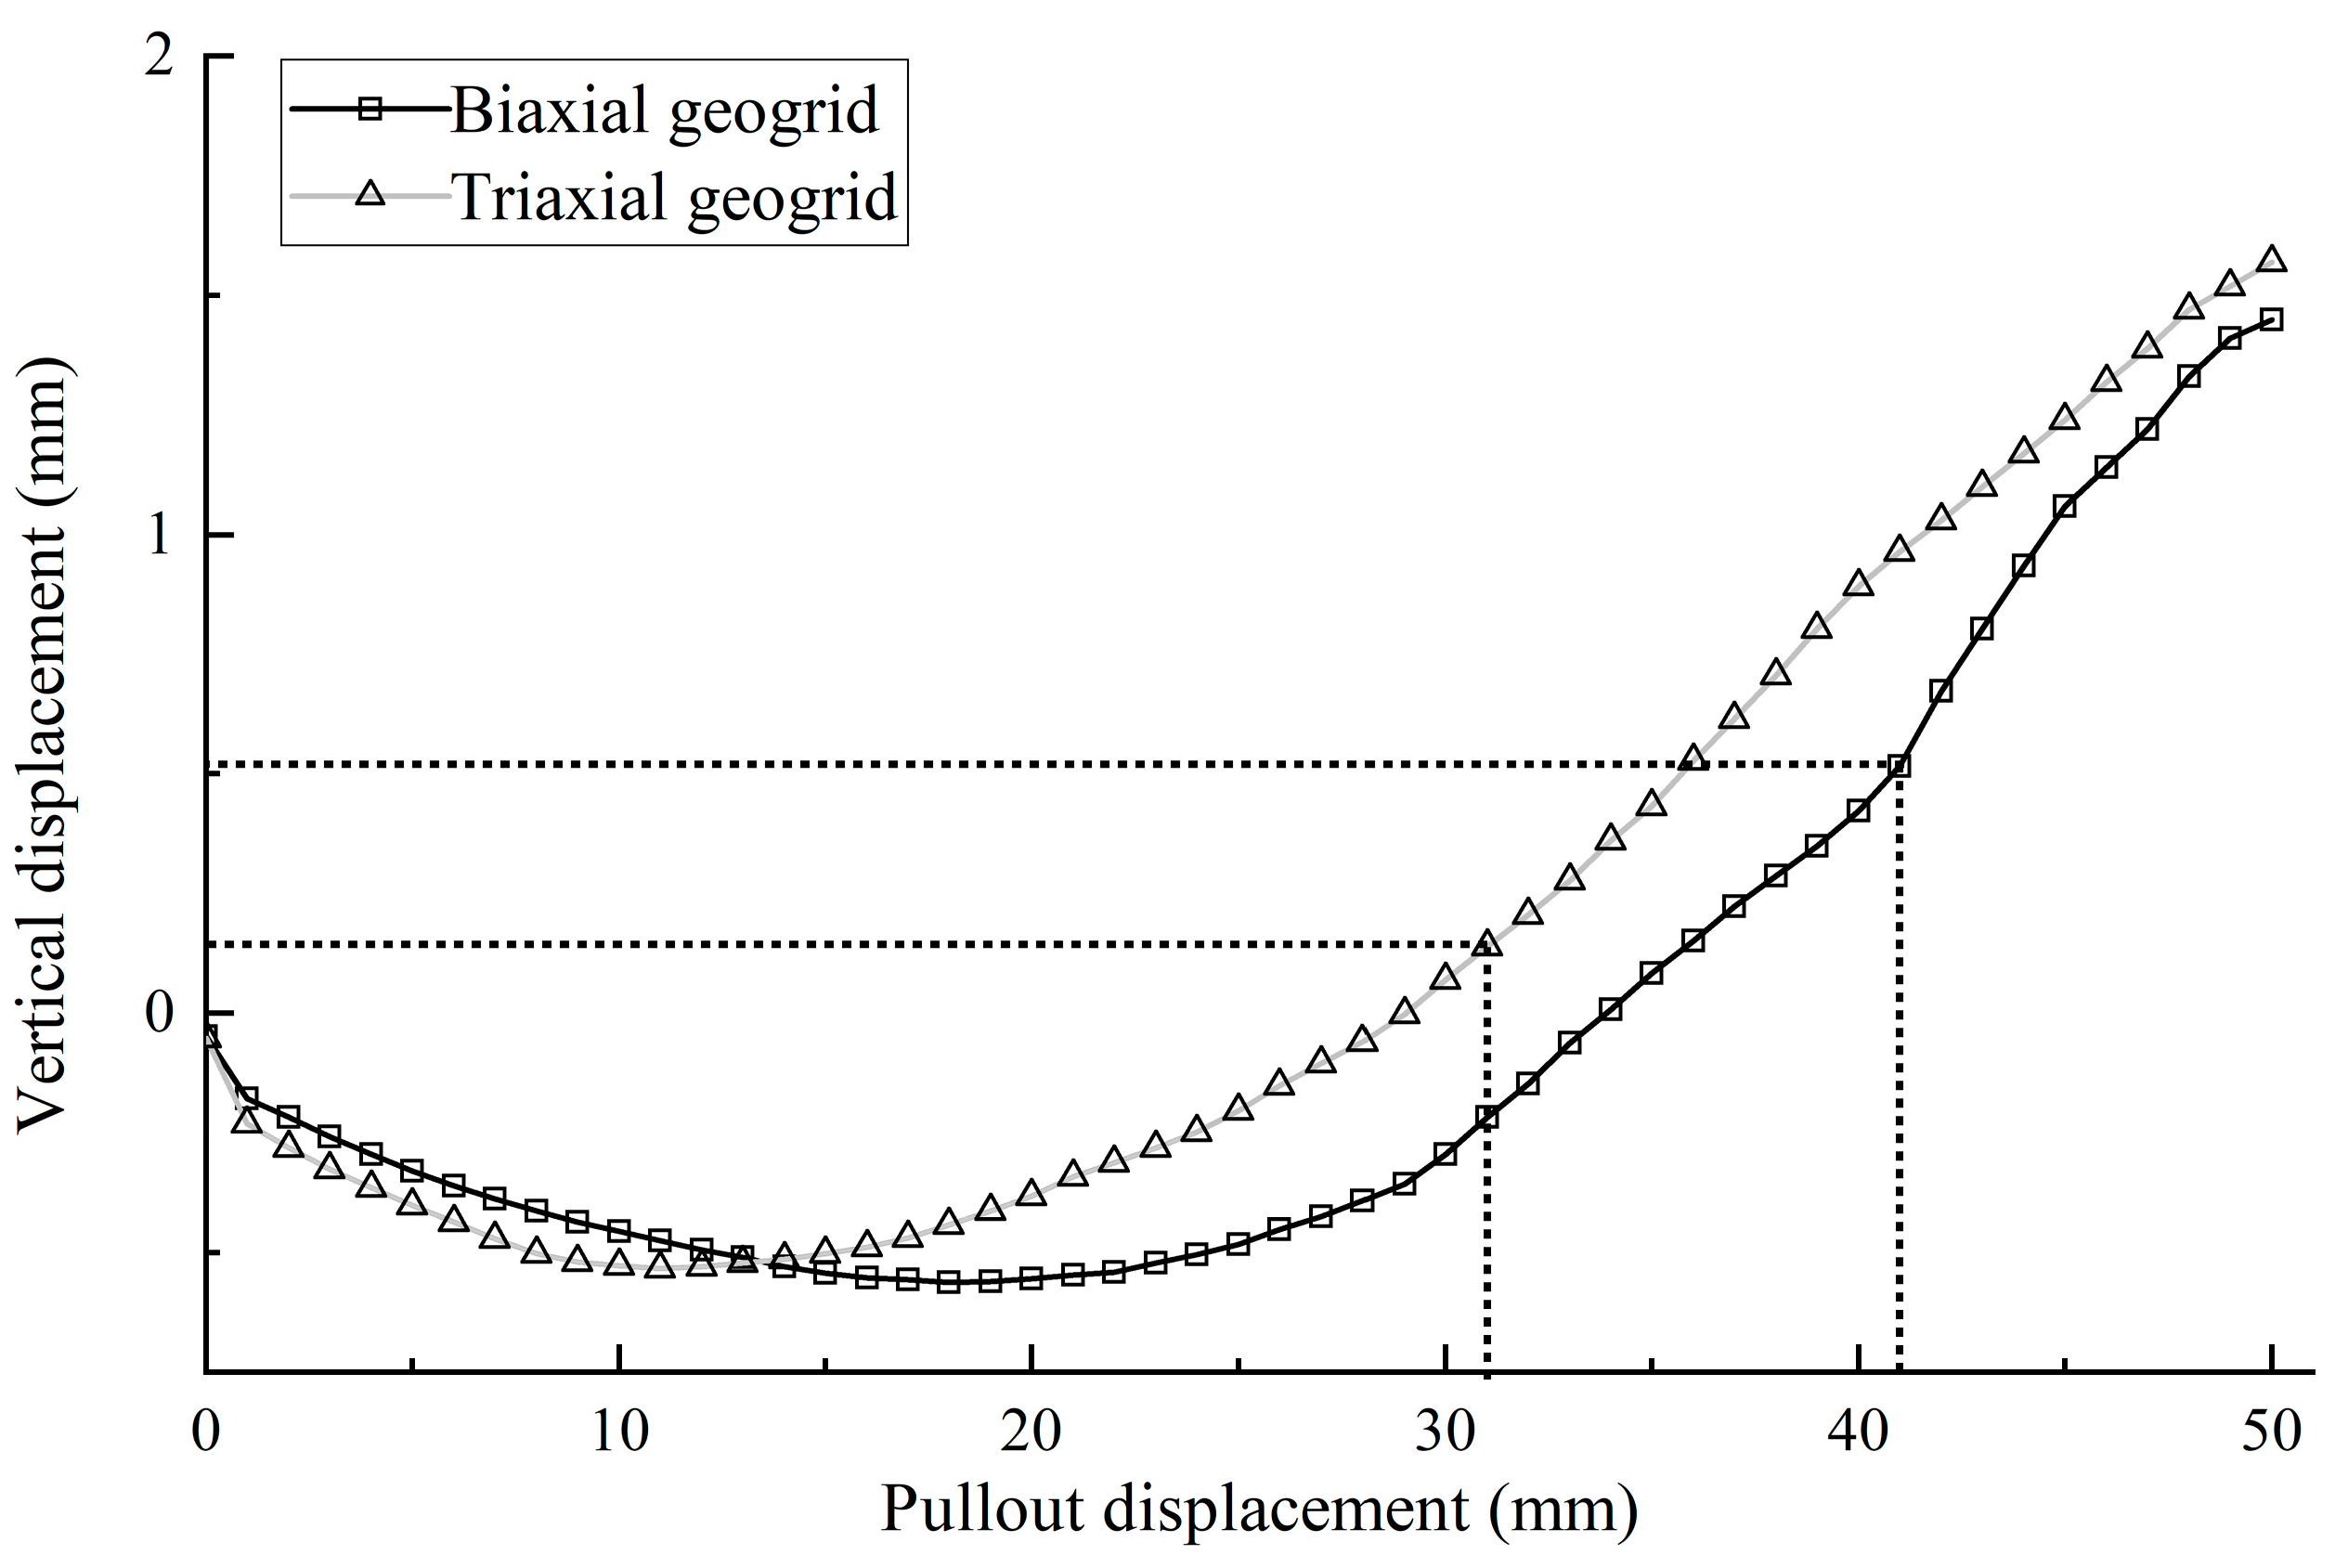
4.4. Response of the Ballast Box and Surcharge Block

In the ballasted trackbed, ballast particles and the embedded geogrid form a reinforced composite foundation with improved performance. The structural properties of the mechanically stabilized layer are influenced by the depth of the confined zones. Therefore, the contact forces of the right-side wall before and after the pullout were measured and compared in simulation.
As shown in Figure 12, the interlocking effect is the largest at about 70 mm on both sides of the geogrid, decreases during the transition zone, and then disappears at a distance greater than about 150 mm. For the contact force of the front wall before and after the pullout, the contact forces above and below the geogrid are relatively symmetrical due to confinement at both the top and the bottom. When the pullout displacement reaches 50 mm, the contact force distribution of the front wall of the triaxial geogrid is more concentrated than that of the biaxial geogrid. Therefore the triaxial geogrid has much larger front wall resistance than the biaxial geogrid in the fully confined zone.
Figure 13 shows the vertical displacement contour of the top surcharge block at the pullout displacement of 50 mm, which reflects the volume change of the ballast sample. It shows that more movement (dilation) occurs on the right part, which implies that the dilative behavior is more obvious in the reinforced zone at the right-hand end of the sample. The top surcharge block can tilt during the pullout process, which is consistent with the observations in the experimental tests.
Considering that the dilatancy mainly occurs on the right side of the sample, the average vertical displacement of the surcharge block was recorded. Figure 14 shows that the biaxial geogrid reinforced ballast samples compacted in the initial 10 mm and then expanded; meanwhile, the triaxial geogrid reinforced ballast samples compacted up to a displacement of about 18 mm and then expanded. The displacement at the peak pullout force (approximately 30 mm for the biaxial geogrid and 42 mm for the triaxial geogrid, as shown in Figure 6) is associated with the maximum rate of dilation for the sample, given by the average vertical displacement of the surcharge block. In addition, the extent of dilation in the triaxial geogrid reinforced sample was larger than that in the biaxial geogrid sample.

5. Conclusions

The DEM-FDM coupled simulation of pullout tests was performed on two types of geogrids embedded within a ballast sample. This method was not only able to reproduce the deformation characteristic of the geogrid using the continuous elements in FLAC3D but could also investigate the micro-mechanical behavior of ballast particles using PFC3D. The simulation results show that the DEM-FDM coupled method can well predict the relationship between pullout force and displacement. Compared with the DEM geogrid model with bonded particles, the development of FDM geogrid stress and deformation were more accurately simulated. For the ballast particles with a particle size of 40 mm and the same geogrid reinforcement area, the triaxial geogrid with an aperture of 75 mm shows better pullout resistance than the biaxial geogrid with an aperture of 65 mm, which is consistent with the experimental results. Most of the geogrid deformation and particle movement occurred mainly near the geogrid reinforcing zone, where a strong interaction forms between the geogrid and particles. Moreover, the biaxial geogrid reinforced ballast samples compacted at the initial 10 mm and then expanded; meanwhile, the triaxial geogrid reinforced ballast samples compacted up to a displacement of about 18 mm and then expanded. The extent of dilation in the triaxial geogrid reinforced sample was larger than that in the biaxial geogrid sample. Furthermore, the interlocking effect was the largest at about 70 mm on both sides of the geogrid. The triaxial geogrid showed much larger front wall resistance than the biaxial geogrid in the fully confined zone. The particles near the geogrid reinforced area produced larger displacement and rotation. The greater the displacement and rotation of the ballast, the stronger the interlocking between the geogrid and the ballast. The particle movement near the triaxial geogrid was larger than that of the biaxial geogrid. Moreover, the dilation in the triaxial geogrid reinforced sample was larger than that in the biaxial geogrid sample.

Author Contributions

Conceptualization, J.F. and C.C.; methodology, J.L. and C.C.; software, J.L. and R.R.; validation, J.F. and J.L.; formal analysis, C.C. and R.R.; investigation, J.L. and C.C.; resources, R.R.; data curation, J.L.; writing—original draft preparation, J.L.; writing—review and editing, J.F. and C.C.; visualization, J.L.; supervision, C.C. and R.R.; project administration, J.F.; funding acquisition, C.C. All authors have read and agreed to the published version of the manuscript.

Funding

This research received no external funding.

Institutional Review Board Statement

Not applicable.

Informed Consent Statement

Not applicable.

Data Availability Statement

Not applicable.

Acknowledgments

The research described in this paper was financially supported by the Science and Technology Planning Project of Hunan Province, China (No. 2019RS2050), the National Natural Science Foundation of China (No. 51708438), Key Research and Development Program in Hunan Province (2022SK2099) and the Science and Technology Project of the Hunan Provincial Department of Water Resources (XSKJ2021000-23).

Conflicts of Interest

The authors declare no conflict of interest.

References

  1. Ma, K.; Wang, L.; Long, L.; Peng, Y.; He, G. Discrete Element Analysis of Structural Characteristics of Stepped Reinforced Soil Retaining Wall. Geomat. Nat. Hazards Risk 2020, 11, 1447–1465. [Google Scholar] [CrossRef]
  2. Kiersnowska, A.; Koda, E.; Fabianowski, W.; Kawalec, J. Effect of the Impact of Chemical and Environmental Factors on the Durability of the High Density Polyethylene (HDPE) Geogrid in a Sanitary Landfill. Appl. Sci. 2017, 7, 22. [Google Scholar] [CrossRef] [Green Version]
  3. Kim, Y.-J.; Kotwal, A.R.; Cho, B.-Y.; Wilde, J.; You, B.H. Geosynthetic Reinforced Steep Slopes: Current Technology in the United States. Appl. Sci. 2019, 9, 2008. [Google Scholar] [CrossRef] [Green Version]
  4. Koda, E.; Kiersnowska, A.; Kawalec, J.; Osiński, P. Landfill Slope Stability Improvement Incorporating Reinforcements in Reclamation Process Applying Observational Method. Appl. Sci. 2020, 10, 1572. [Google Scholar] [CrossRef] [Green Version]
  5. Kawalec, J.; Grygierek, M.; Koda, E.; Osiński, P. Lessons Learned on Geosynthetics Applications in Road Structures in Silesia Mining Region in Poland. Appl. Sci. 2019, 9, 1122. [Google Scholar] [CrossRef] [Green Version]
  6. Park, K.; Kim, D.; Park, J.; Na, H. The Determination of Pullout Parameters for Sand with a Geogrid. Appl. Sci. 2021, 11, 355. [Google Scholar] [CrossRef]
  7. Mosallanezhad, M.; Taghavi, S.H.S.; Hataf, N.; Alfaro, M.C. Experimental and Numerical Studies of the Performance of the New Reinforcement System under Pull-out Conditions. Geotext. Geomembr. 2016, 44, 70–80. [Google Scholar] [CrossRef]
  8. Abdi, M.R.; Mirzaeifar, H. Experimental and PIV Evaluation of Grain Size and Distribution on Soil–Geogrid Interactions in Pullout Test. Soils Found. 2017, 57, 1045–1058. [Google Scholar] [CrossRef]
  9. Yogarajah, I.; Yeo, K.C. Finite Element Modelling of Pull-out Tests with Load and Strain Measurements. Geotext. Geomembr. 1994, 13, 43–54. [Google Scholar] [CrossRef]
  10. Perkins, S.W.; Edens, M.Q. Finite Element Modeling of a Geosynthetic Pullout Test. Geotech. Geol. Eng. 2003, 21, 357–375. [Google Scholar] [CrossRef]
  11. Hussein, M.G.; Meguid, M.A. A Three-Dimensional Finite Element Approach for Modeling Biaxial Geogrid with Application to Geogrid-Reinforced Soils. Geotext. Geomembr. 2016, 44, 295–307. [Google Scholar] [CrossRef]
  12. Zhang, G.; Yang, Y.; Su, F. Parameter Optimization of Geogrid-Reinforced Foundations Based on Model Experiments and Numerical Simulations. Appl. Sci. 2019, 9, 3592. [Google Scholar] [CrossRef] [Green Version]
  13. Guadagnin Moravia, M.; Villard, P.; De Mattos Vidal, D. Geogrid Pull-out Modelling Using DEM. E3S Web Conf. 2019, 92, 13015. [Google Scholar] [CrossRef]
  14. Ngo, N.T.; Indraratna, B.; Rujikiatkamjorn, C. DEM Simulation of the Behaviour of Geogrid Stabilised Ballast Fouled with Coal. Comput. Geotech. 2014, 55, 224–231. [Google Scholar] [CrossRef] [Green Version]
  15. Miao, C.; Jia, Y.; Zhang, J.; Zhao, J. DEM Simulation of the Pullout Behavior of Geogrid-Stabilized Ballast with the Optimization of the Coordination between Aperture Size and Particle Diameter. Constr. Build. Mater. 2020, 255, 119359. [Google Scholar] [CrossRef]
  16. Chen, W.-B.; Zhou, W.-H.; Jing, X.-Y. Modeling Geogrid Pullout Behavior in Sand Using Discrete-Element Method and Effect of Tensile Stiffness. Int. J. Geomech. 2019, 19, 04019039. [Google Scholar] [CrossRef]
  17. Chen, C.; McDowell, G.R.; Thom, N.H. A Study of Geogrid-Reinforced Ballast Using Laboratory Pull-out Tests and Discrete Element Modelling. Geomech. Geoengin. 2013, 8, 244–253. [Google Scholar] [CrossRef] [Green Version]
  18. Stahl, M.; Konietzky, H.; Te Kamp, L.; Jas, H. Discrete Element Simulation of Geogrid-Stabilised Soil. Acta Geotech. 2014, 9, 1073–1084. [Google Scholar] [CrossRef]
  19. Tran, V.D.H.; Meguid, M.A.; Chouinard, L.E. A Finite–Discrete Element Framework for the 3D Modeling of Geogrid–Soil Interaction under Pullout Loading Conditions. Geotext. Geomembr. 2013, 37, 1–9. [Google Scholar] [CrossRef]
  20. Tran, V.D.H.; Meguid, M.A.; Chouinard, L.E. The Application of Coupled Finite-Discrete Element Method in Analyzing Soil-Structure Interaction Problems; CIMNE: Barcelona, Spain, 2013; pp. 200–211. [Google Scholar]
  21. Tran, V.D.H.; Meguid, M.A.; Chouinard, L.E. Three-Dimensional Analysis of Geogrid-Reinforced Soil Using a Finite-Discrete Element Framework. Int. J. Geomech. 2015, 15, 04014066. [Google Scholar] [CrossRef]
  22. Alagiyawanna, A.; Sugimoto, M.; Sato, S.; Toyota, H. Influence of longitudinal and transverse members on geogrid pullout behavior during deformation. Geotext. Geomembr. 2001, 19, 483–507. [Google Scholar] [CrossRef]
  23. Moraci, N.; Piergiorgio, R. Factors affecting the pull-out behaviour of extruded geogrids embedded in a compacted granular soil. Geotext. Geomembr. 2006, 24, 220–242. [Google Scholar] [CrossRef]
  24. Palmeira, E.M. Soil-geosynthetic interaction: Modelling and analysis. Geotext. Geomembr. 2009, 27, 368–390. [Google Scholar] [CrossRef]
  25. Palmeria, E.M.; Milligan, G.W.E. Scale and Other Factors Affecting the Results of Pull-out Tests of Grids Buried in Sand. Géotechnique 1989, 39, 511–542. [Google Scholar] [CrossRef]
  26. Chen, C.; McDowell, G.; Rui, R. Discrete Element Modelling of Geogrids with Square and Triangular Apertures. Geomech. Eng. 2018, 16, 495–501. [Google Scholar]
  27. Chen, C.; Indraratna, B.; McDowell, G.; Rujikiatkamjorn, C. Discrete Element Modelling of Lateral Displacement of a Granular Assembly under Cyclic Loading. Comput. Geotech. 2015, 69, 474–484. [Google Scholar] [CrossRef]
  28. Peralta, A.F. Identification of Optimum Aggregate Gradation for Transportation Applications of Multiaxial Geogrids. Ph.D. Thesis, Georgia Institute of Technology, Atlanta, GA, USA, 2016. [Google Scholar]
  29. Gao, G.; Meguid, M.A. Effect of Particle Shape on the Response of Geogrid-Reinforced Systems: Insights from 3D Discrete Element Analysis. Geotext. Geomembr. 2018, 46, 685–698. [Google Scholar] [CrossRef]
Figure 1. Large box pullout test set-up in the laboratory.
Applsci 11 09001 g001
Figure 2. Comparison of geogrid models: (a) DEM biaxial geogrid; (b) DEM triaxial geogrid; (c) FDM biaxial geogrid; (d) FDM triaxial geogrid and (e) FDM geogrid rib from a side view.
Applsci 11 09001 g002aApplsci 11 09001 g002b
Figure 3. Calibration test simulation and calibration results: (a) a single rib test of triaxial geogrid; (b) single rib test of biaxial geogrid and (c) force-strain curve.
Applsci 11 09001 g003
Figure 4. The buckling of the FLAC triaxial geogrid model under compression: (a) top view and (b) front view.
Applsci 11 09001 g004
Figure 5. DEM-FDM of large box pullout test: (a) embedded geogrid specimen and simulated surcharge; (b) 2-ball clump used in the simulation and (c) FDM geogrid model used in the simulation.
Applsci 11 09001 g005
Figure 6. Comparison of geogrid pullout resistance between experimental and simulation results.
Applsci 11 09001 g006
Figure 7. Contact force network and geogrid stress at different pullout displacement: (a) biaxial geogrid and (b) triaxial geogrid.
Applsci 11 09001 g007
Figure 8. 3D contact force distribution of particles during pullout: (a) biaxial geogrid and (b) triaxial geogrid.
Applsci 11 09001 g008
Figure 9. Geogrid deformation at different pullout displacements: (a) biaxial geogrid and (b) triaxial geogrid.
Applsci 11 09001 g009
Figure 10. Deformation behavior of biaxial and triaxial geogrid: (a) geogrids in experiments; (b) geogrids in DEM-FDM model and (c) geogrids in DEM model.
Applsci 11 09001 g010
Figure 11. Particle displacement and rotation contours: (a) three sections of sample; (b) particle displacement and (c) particle rotation.
Applsci 11 09001 g011
Figure 12. Contact force applied on the front wall before and during the pullout test simulation.
Applsci 11 09001 g012
Figure 13. Vertical displacement of surcharge block after pullout: (a) biaxial geogrid and (b) triaxial geogrid.
Applsci 11 09001 g013
Figure 14. Average vertical displacement of surcharge block.
Applsci 11 09001 g014
Publisher’s Note: MDPI stays neutral with regard to jurisdictional claims in published maps and institutional affiliations.

