1. Introduction
Geotectonic processes are often perceived as slow, encapsulated in the colloquial expression of ‘long geological time scales’. With improved experimental facilities to identify the details of geological time dependences, we now understand that they occur on many different time scales. Even those which evolve over thousands of years, such as some metamorphic processes, proceed by short-time atomistic changes which simply add up to the observed long-term evolution. Long-term time evolution is often constituted by a long sequence of short singular events and research has partly shifted from the continuous description of geological processes to the analysis of these singular events from spontaneous changes in chemical composition, atomic ordering, phase transitions, and crack propagation to earthquakes, the collapse of structures in the mining industry and so forth. The investigation of singular ‘rare events’ has entered geological and mineralogical research after it already became a key research field in metallurgy [
1,
2], material sciences [
3,
4,
5] and solid-state physics [
6,
7,
8]. In addition, many short events are commonly observed in biogenic materials and in food processing. The observation of the collapse of these materials under stress leads to novel analytical tools to register the collapse mechanisms via the formation of avalanches and allow an assessment of their mechanical stability. The purpose of this paper is to highlight some recent experimental developments for the investigation of commonly used geomaterials and some analogs using acoustic emission spectroscopy, and to connect their analysis with current theoretical models.
2. Avalanches and Acoustic Emission Spectroscopy
When physical systems produce discontinuous burst responses under external fields, the bursts often follow the predictions of avalanche physics and ‘crackling noise’ emitters [
6,
9,
10]. Typical examples include natural avalanche disasters, such as earthquakes [
11,
12]. The avalanche behavior does not depend on the size of the earthquake with pico-scale earthquakes and global earthquakes following very similar patterns. Avalanche dynamics also describe the fluctuations of stock markets, which have small fluctuations and stock disasters caused by financial crisis [
6], the temporary evolution of neuron connectors during ‘thinking’ processes [
13,
14,
15], and the medical deterioration of brain structures [
16,
17]. Other examples are the Barkhausen ‘noise’ of pinned domain walls during magnetization processes [
18,
19,
20,
21], martensitic transformations [
22,
23], plastic deformation in solids [
24], materials failure [
25], ferroelectric and ferroelastic domain movements [
3,
26,
27,
28,
29] etc. Avalanche events are monitored by different monitoring methods, such as force drop measurement [
30], optical observation [
28], thermal radiation observation [
23], etc.
Acoustic emission (AE) spectroscopy has become the method of choice in many fields [
5,
31,
32,
33] because it is highly sensitive. For example, the AE system constructed by the Vallen company, Germany, has a sampling rate that can reach up to 10 MHz, an arrival time resolution of 100 ns, and an energy resolution of 1.8 × 10
−18 V
2s (i.e., in the attojoule regime, aJ) referred to sensor signal at 34 dB preamplifier gain. A previous study showed simultaneous measurements of the avalanche of stress and AE during mechanically induced twin boundary motion in a shape memory alloy. It showed that the probability of finding an AE event during a stress drop is ~100 times higher than between stress drops. Additionally, the relations between mechanical energy drops and the lower bound of the acoustic emitted energy is approximately proportional [
34]. The common drawback of AE is that the local signal is first locally transferred into an acoustic signal inside the sample which then propagates as an acoustic wavelet to the noise detector. The wave profile of AE is hence determined only indirectly by the initial signal and great care has to be taken not to confuse the measured signal with that of the initial atomic event. This problem has been analyzed in great detail [
35], the analytical techniques highlight the strong similarity with the deconvolution procedure to analyze propagating waves in the context of geophysical seismology. The current statistical analysis of AE signals, especially its energy probability distribution function (PDF) and the interevent times, are not much affected by wave profiles and there is a large amount of literature which elucidates some of the intricacies of AE spectroscopy [
35,
36,
37,
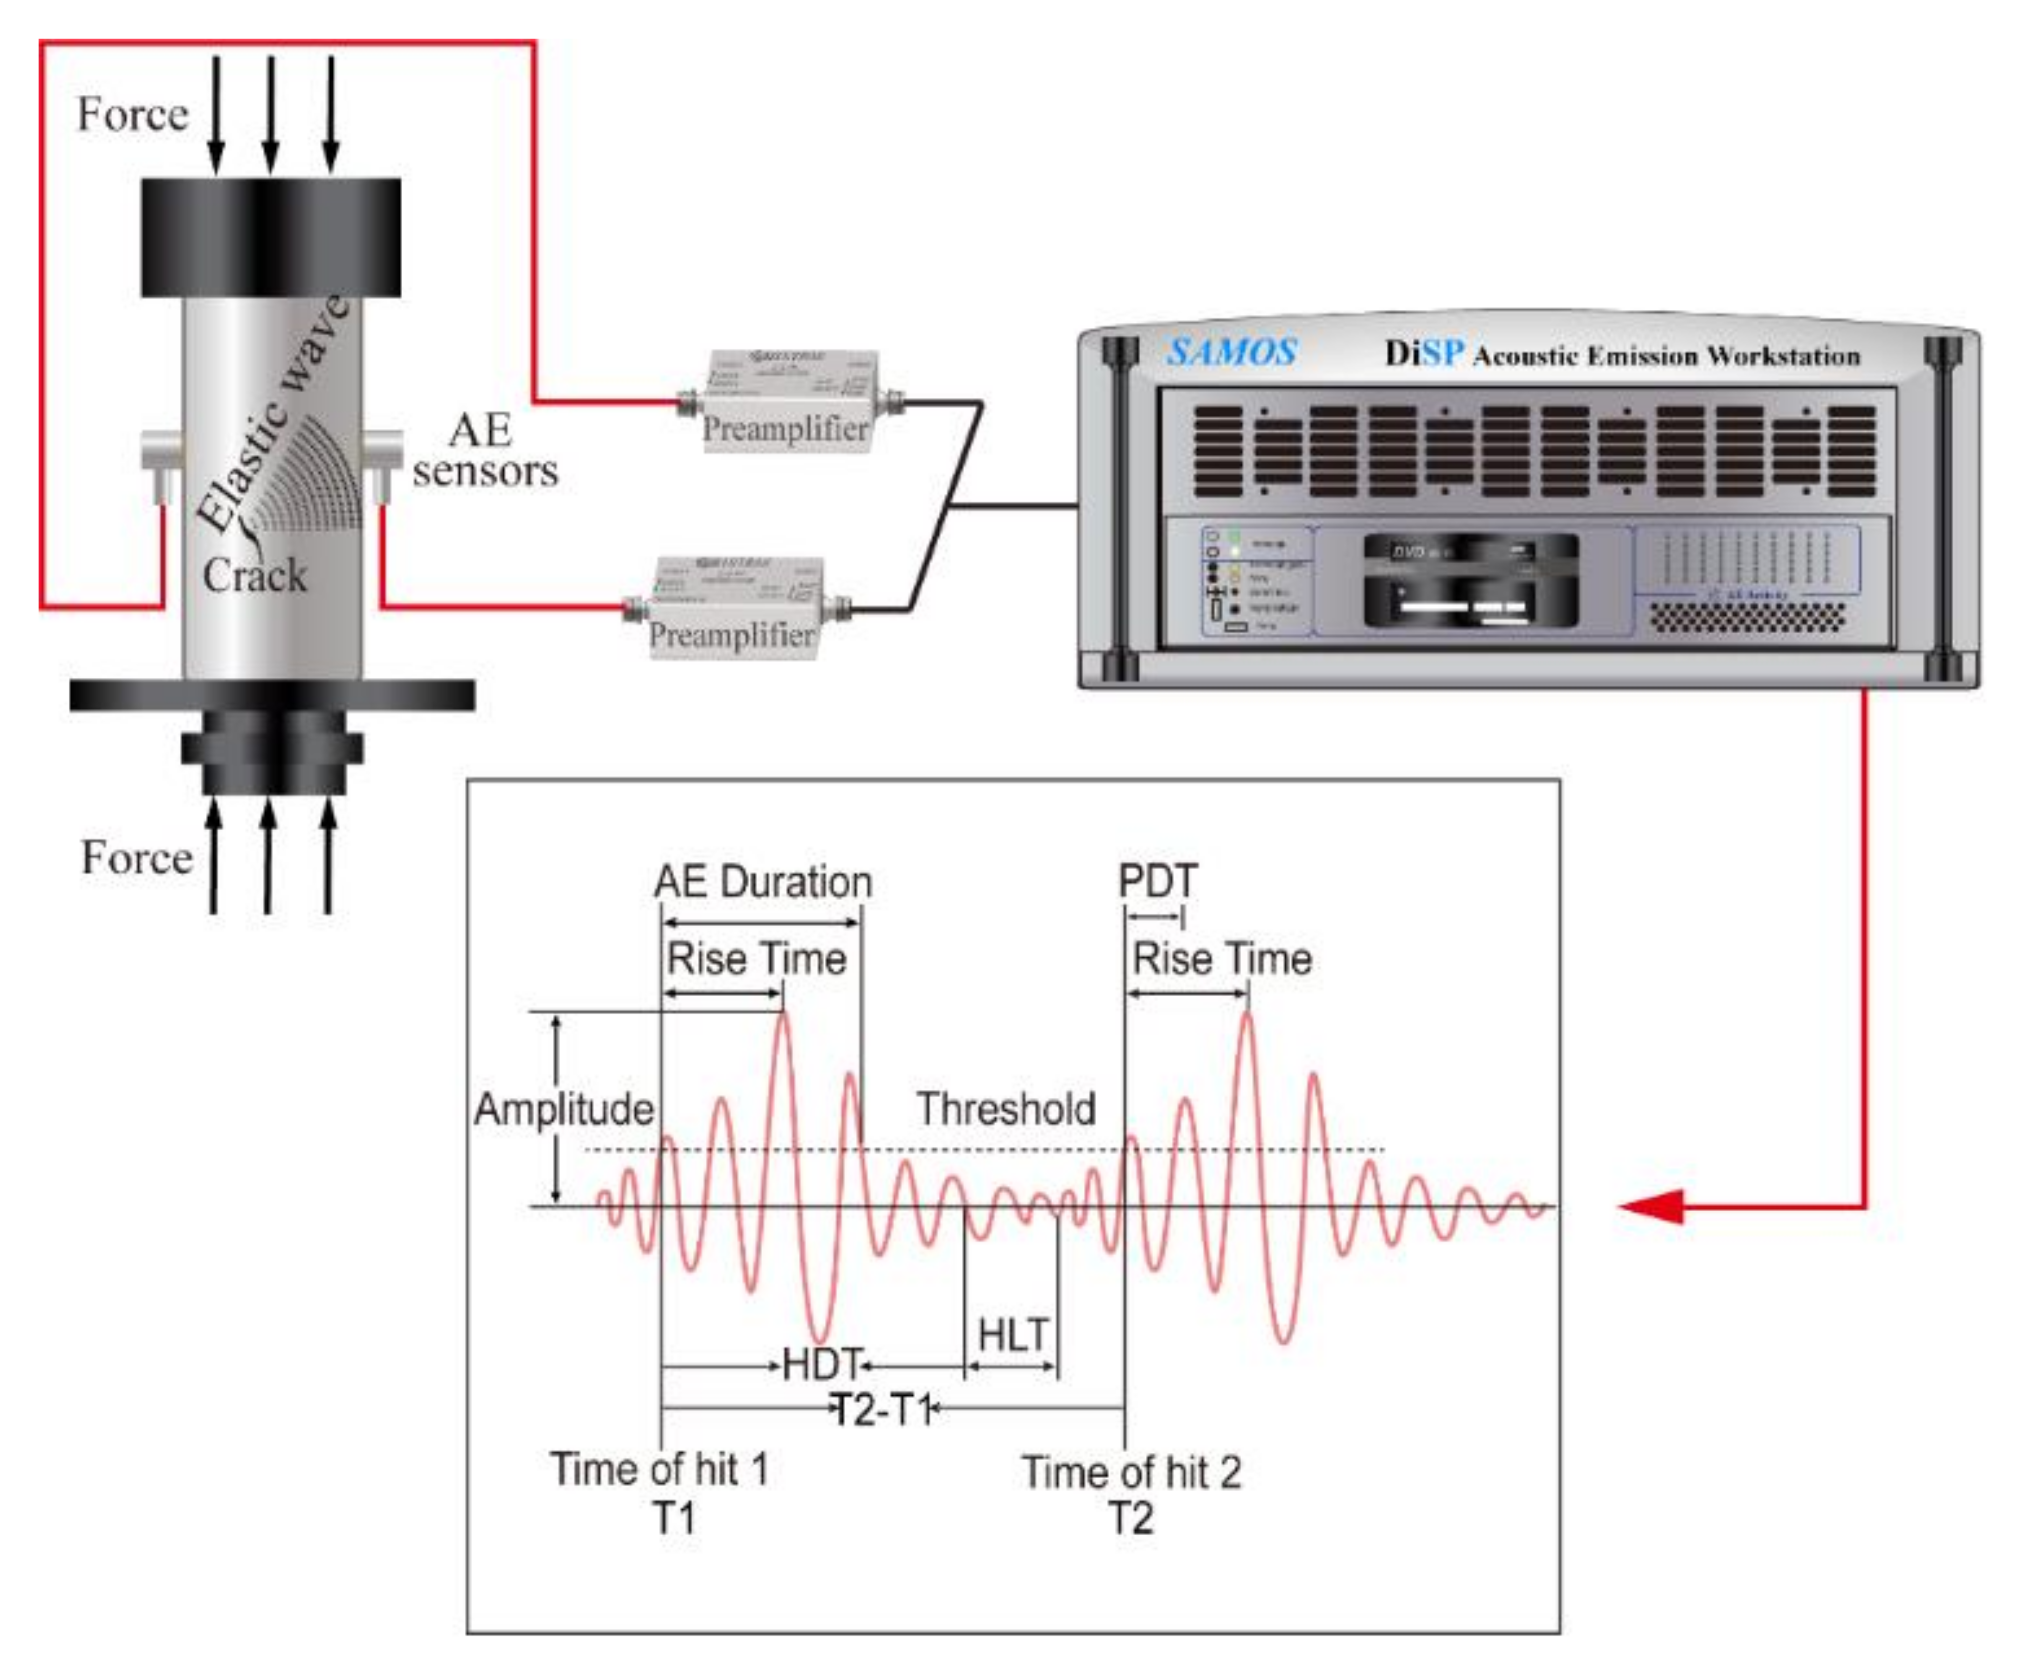
38]. The AE signal is in the form of a wave in
Figure 1, and the important parameters of AE waves are their amplitude, duration, rise time, absolute energy, and waiting time.
The amplitude A(t) is a function of time t and captures the evolution of the conjugate parameter to the external force. The time evolution of the amplitude is typically initiated by an incubation period where A(t) increases exponentially leading to the maximum amplitude, called Amax. The duration is the time period over which an avalanche survives. Experimental time scales typically extend from a few microseconds to many milliseconds. Absolute energies are obtained by numerical integration of the square voltage of signals E = 1/R , where ti and tj are starting and ending times of the signal and R = 10 kΩ is a reference resistance. The rise time is the time difference between starting time of a wavelet and time of the wave peak. The waiting times are the times between consecutive events, also called ‘interevent times’.
3. Collapse Predicting
Tectonic materials are generally inhomogeneous, anisotropic and show nonlinear elastic responses. Non-linearities often lead to sudden collapses under elastic constrains and to catastrophic failure. The catastrophic failure is not continuous, and the evolution of strain fields is not smooth, but abrupt, and displays typical avalanche characteristics. Earthquakes and mine collapses are examples of such catastrophic failures. The development of methods which can serve as early warning systems of such disasters has been the focus of disaster prediction research for many years [
39,
40,
41,
42]. Progress has been very limited due to the complexity of the nonlinear time evolution during failure, the hidden triggering mechanisms and insufficient theoretical models [
43,
44,
45]. Compared with the traditional mechanical constitutive model and failure criterion, statistical physics provides an alternative research framework for disaster research [
46,
47,
48]. They are based on elastic responses, as measured by seismic waves in the geological context, while acoustic emission (AE) spectroscopy is used on an engineering and laboratory time and length scale. A series of acoustic emission studies of geological materials such as shales [
49], porous quartz [
50], berlinite [
51], corundum [
52] and goethite [
32] show that the acoustic emission signals released during the failure process characterize well the statistical features of the collapse with the following characteristic features: the acoustic emission signal (amplitude and energy of the ‘jerks’ or burst signals) follow power law statistics. In addition, the waiting time distribution between events, and the aftershock distribution of these geomaterials, are indeed very similar to observations of earthquake so that it may be assumed that the underlying principles of the statistical processes are very similar [
53].
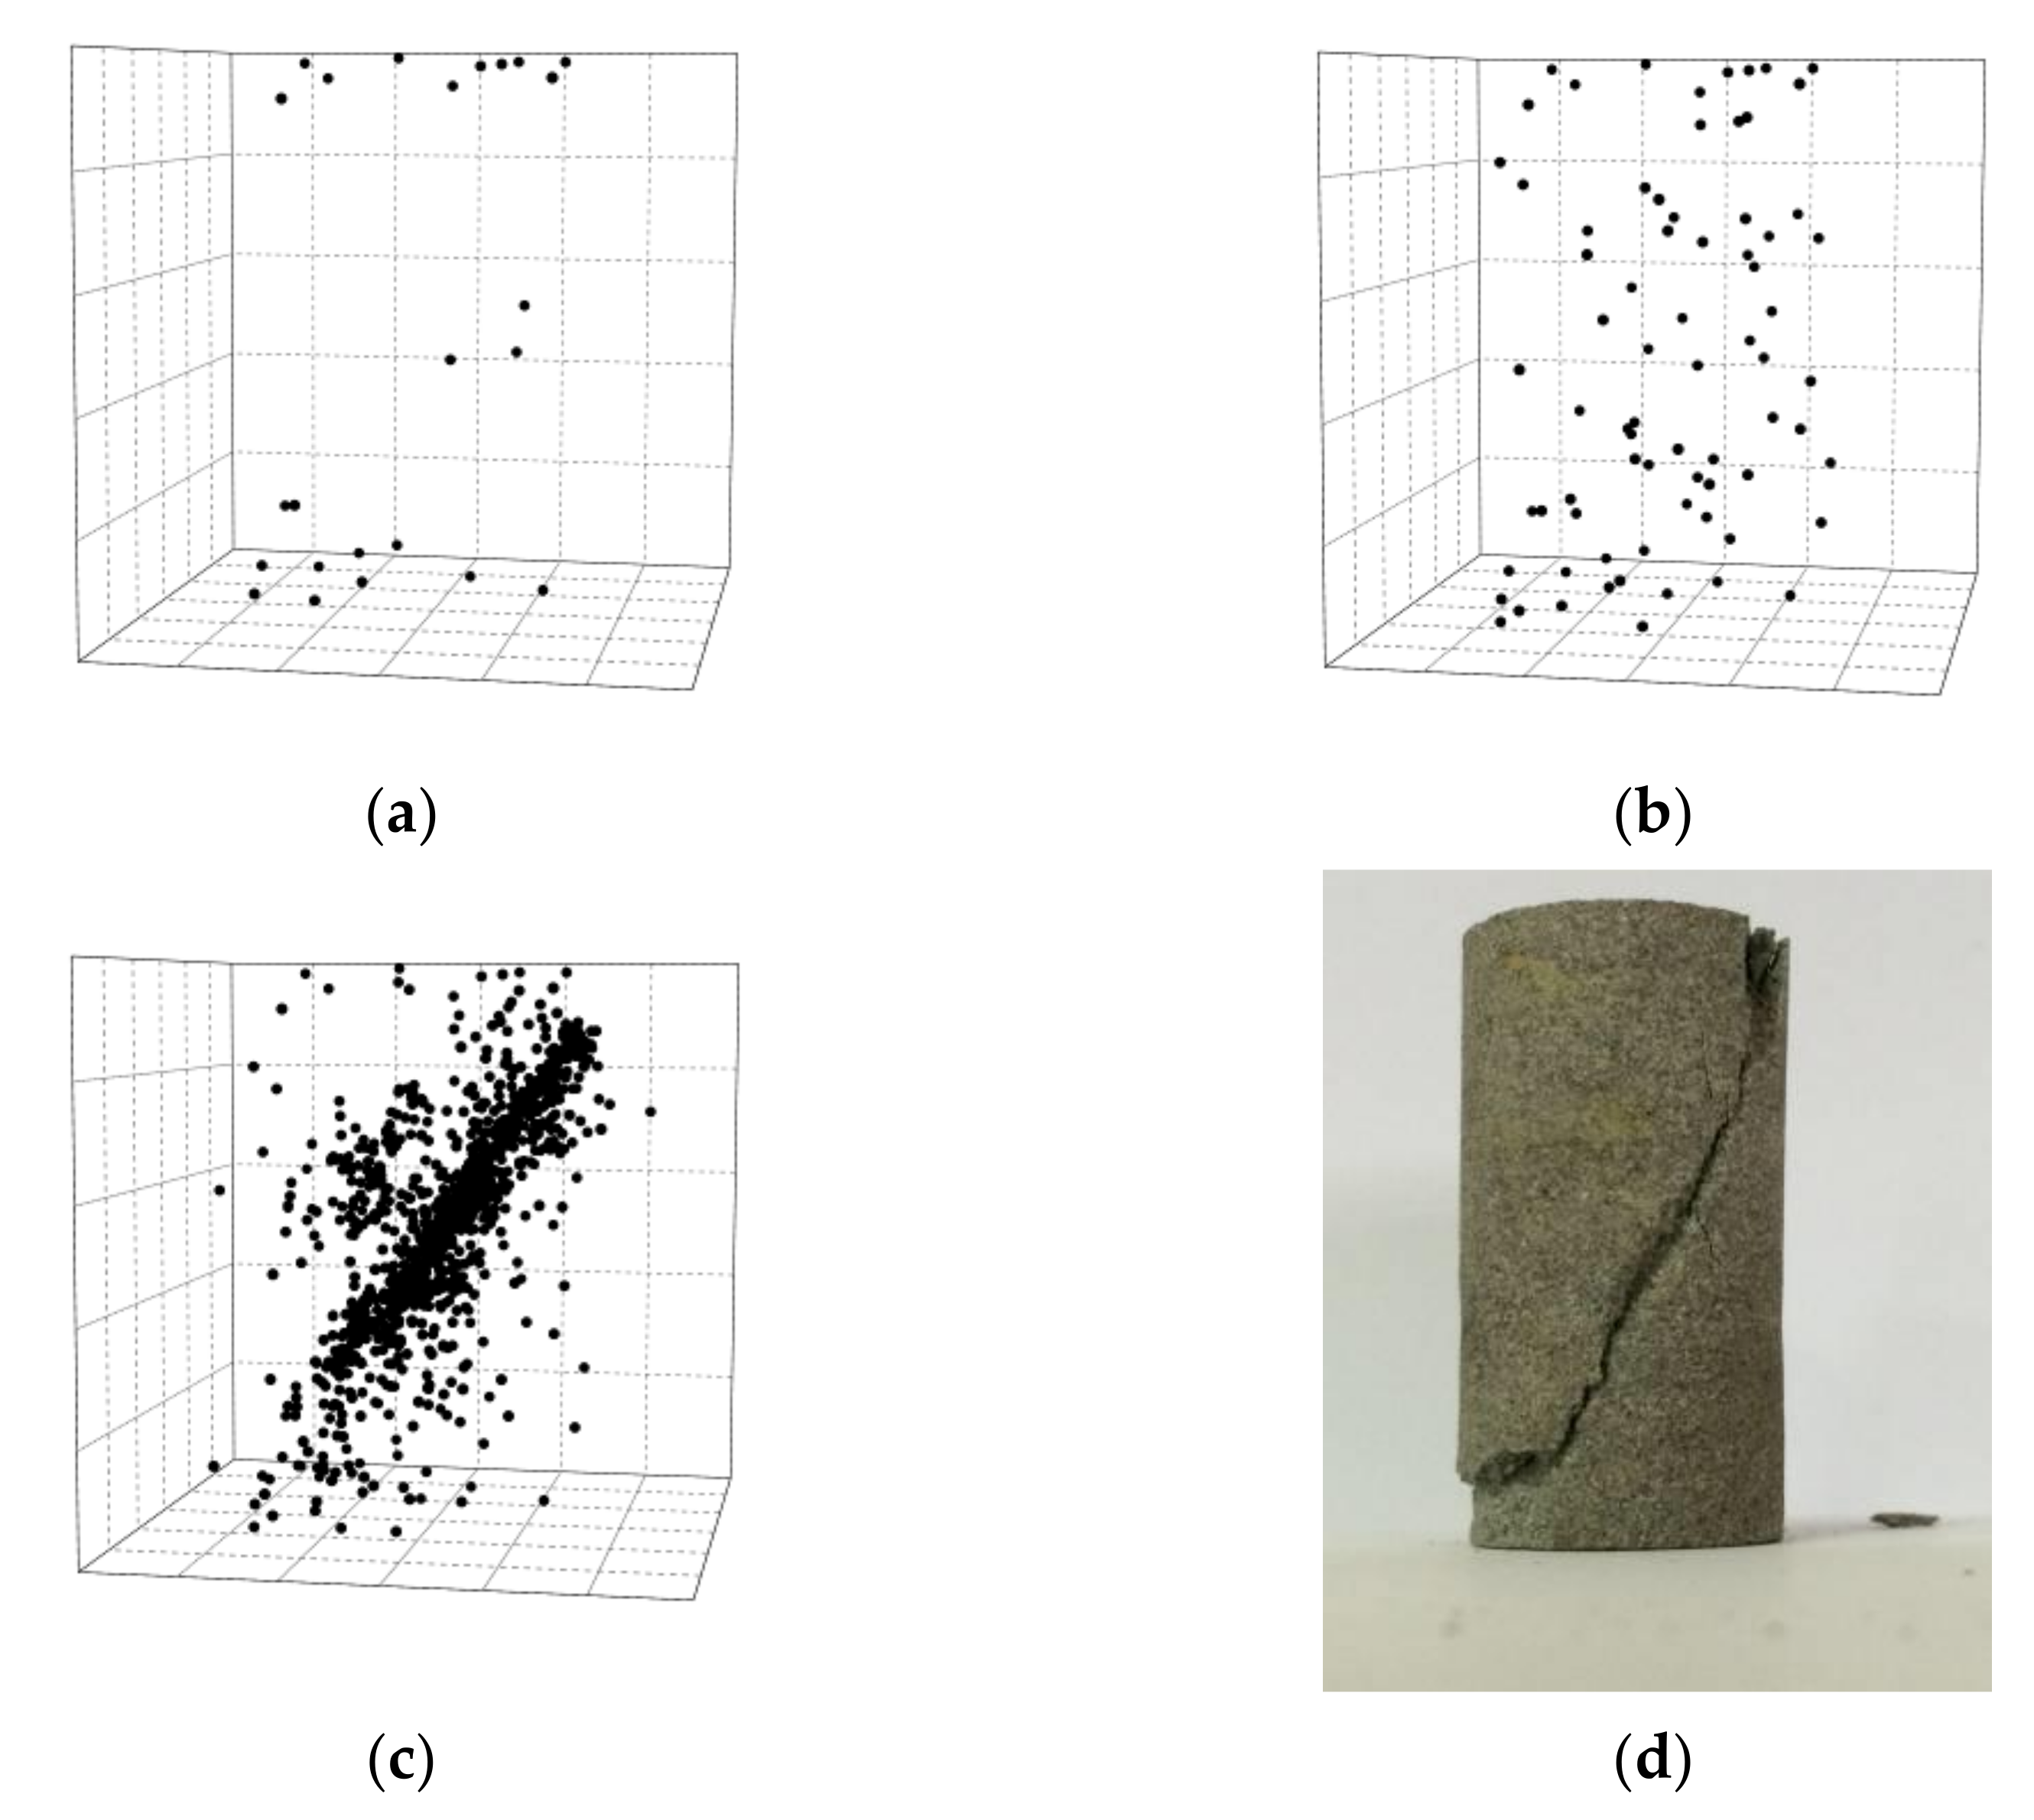
Jiang et al. [
54] explored early warning AE signals of compressed geological materials before they collapse. The probability for an event with energy E is a power law P(E) dE~E
−εdE. Compared with previous attempts, they used larger samples and higher pressure to observe the change of power law exponents in AE energy distributions. Dry and wet sandstone and coal samples were studied under uniaxial compression. Initially, the damage centers are almost randomly distributed with little spatial correlation between them. Closer to the final collapse, the damaged areas interact and form fracture zones, which leads to the final catastrophic failure (
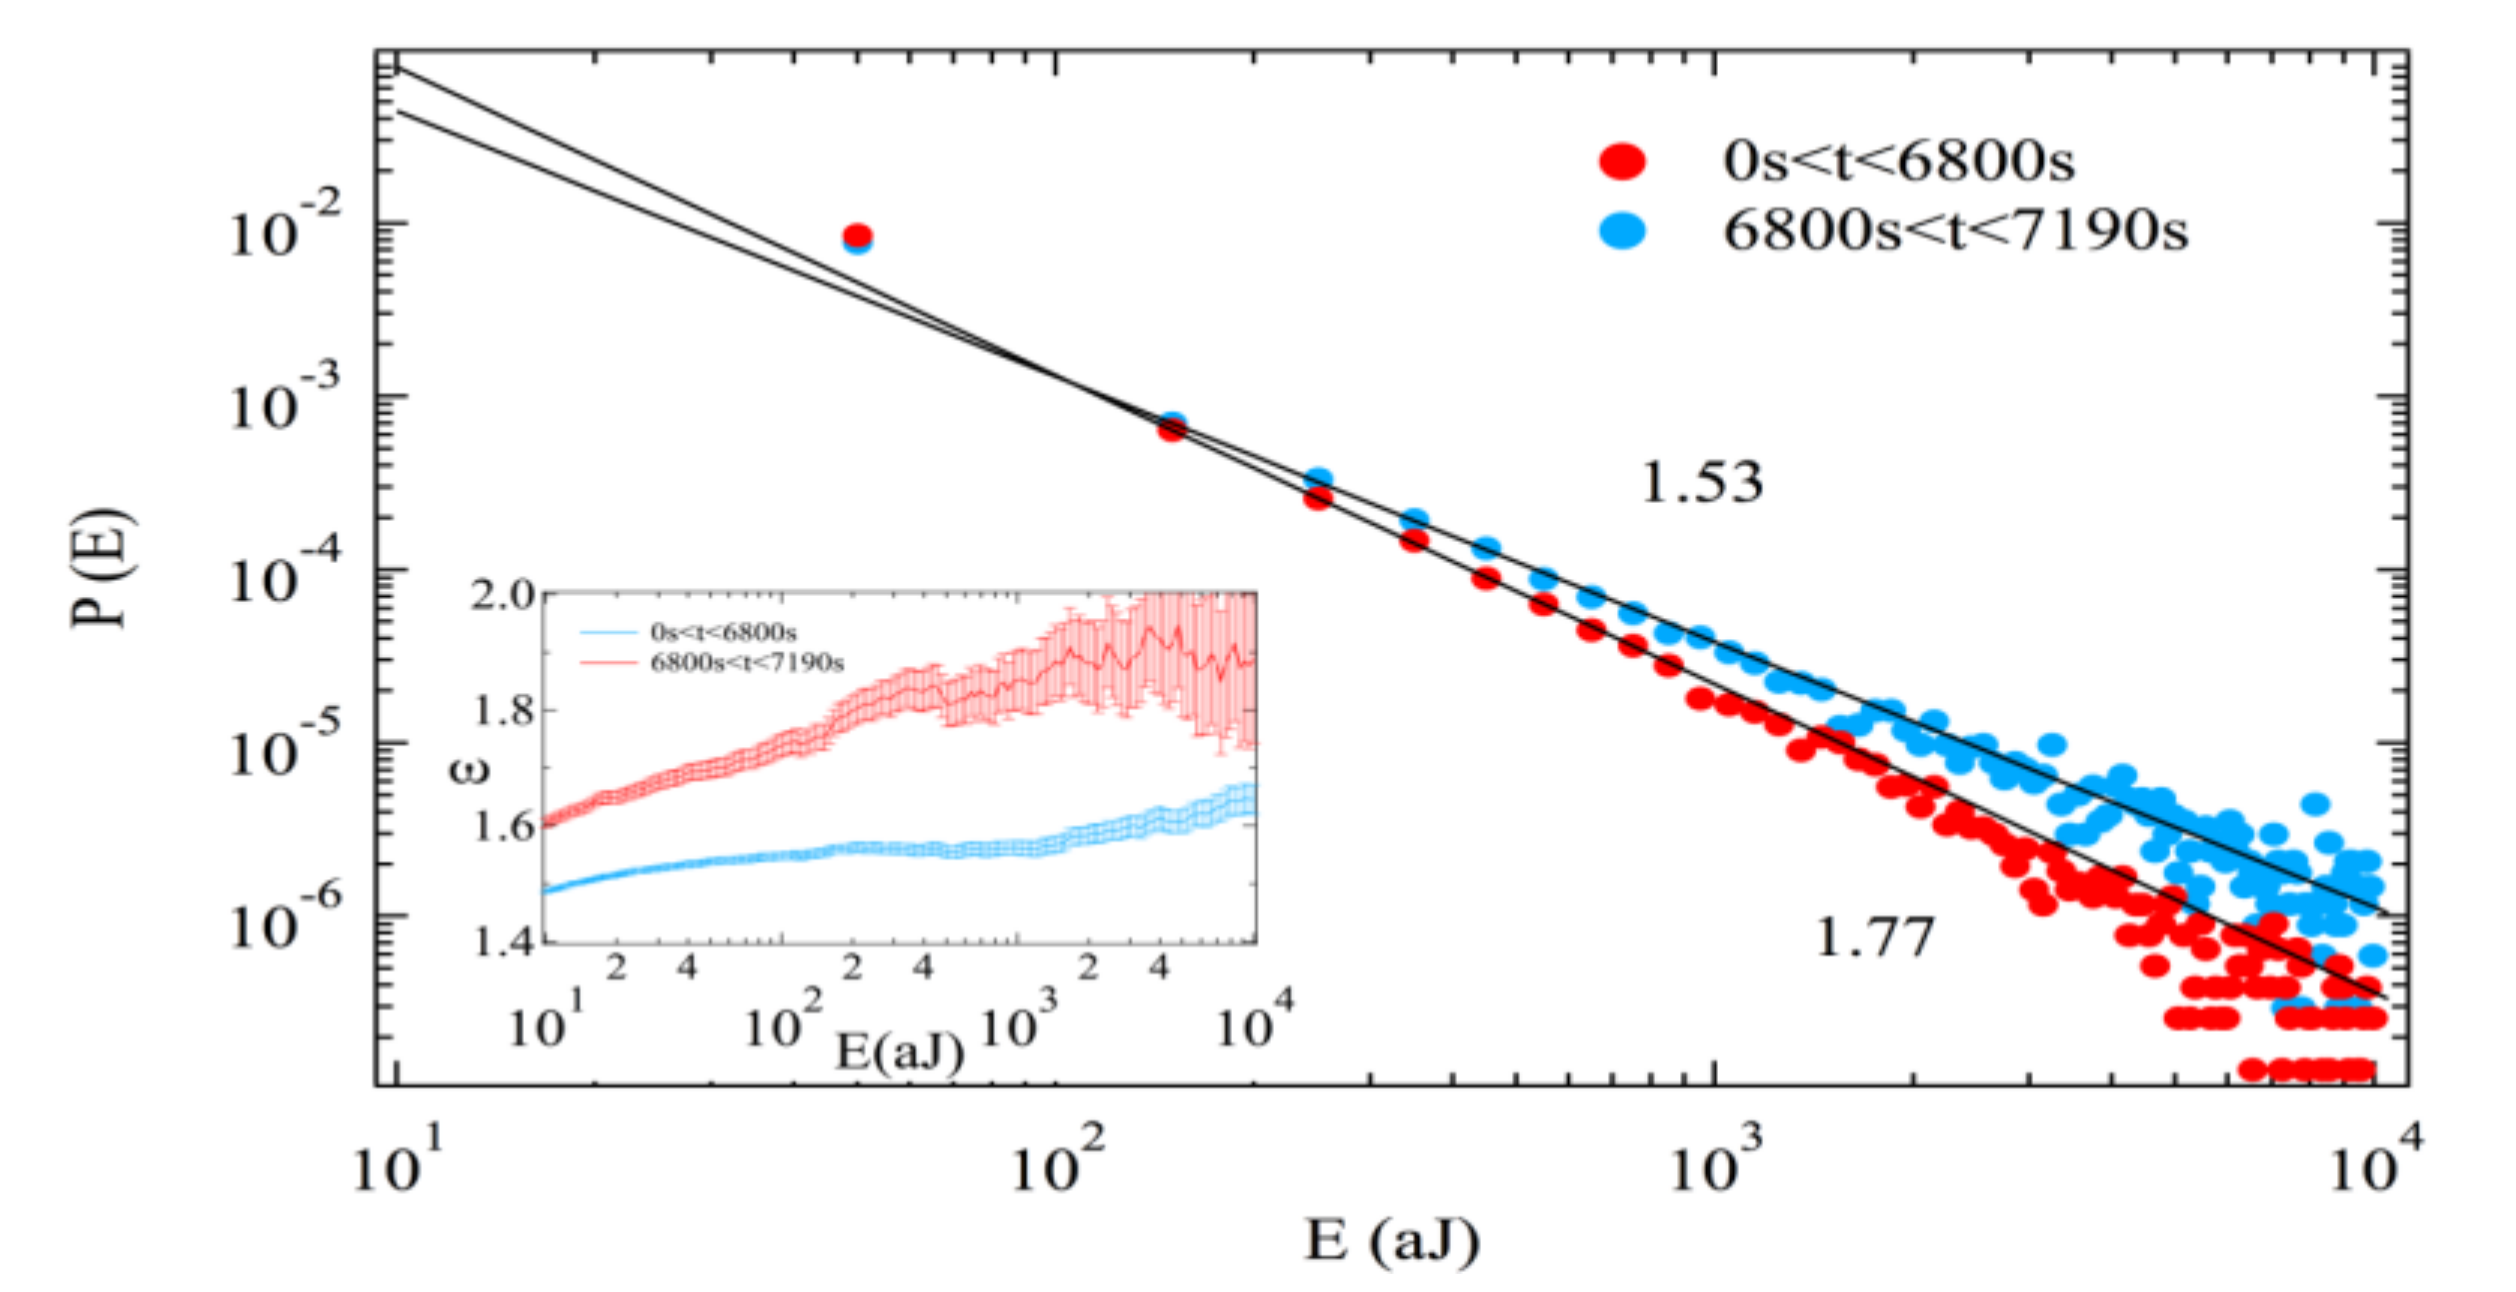
Figure 2). The power law exponents ε show different values in these two stages. For example, for sandstone, the energy exponent during the early stage is ε = 1.77, while near failure it reduces to 1.53 (
Figure 3).
The time evolution of avalanche exponents is well understood by the tendency to assume some ‘critical values’ near failure points [
35]. Experimental results in coal [
55] and sandstone [
50] confirm this picture. Discrete element computer simulations [
56,
57] show variable power law exponents. Variable exponents were previously observed in several physical systems. For compression with the collapse of martensitic porous Ti-Ni alloy, the first series of events is generated by de-twinning (ε = 2), while later stages relate to fracture (ε = 1.7) [
58]. Again, the exponent reduces systematically when the collapse progresses.
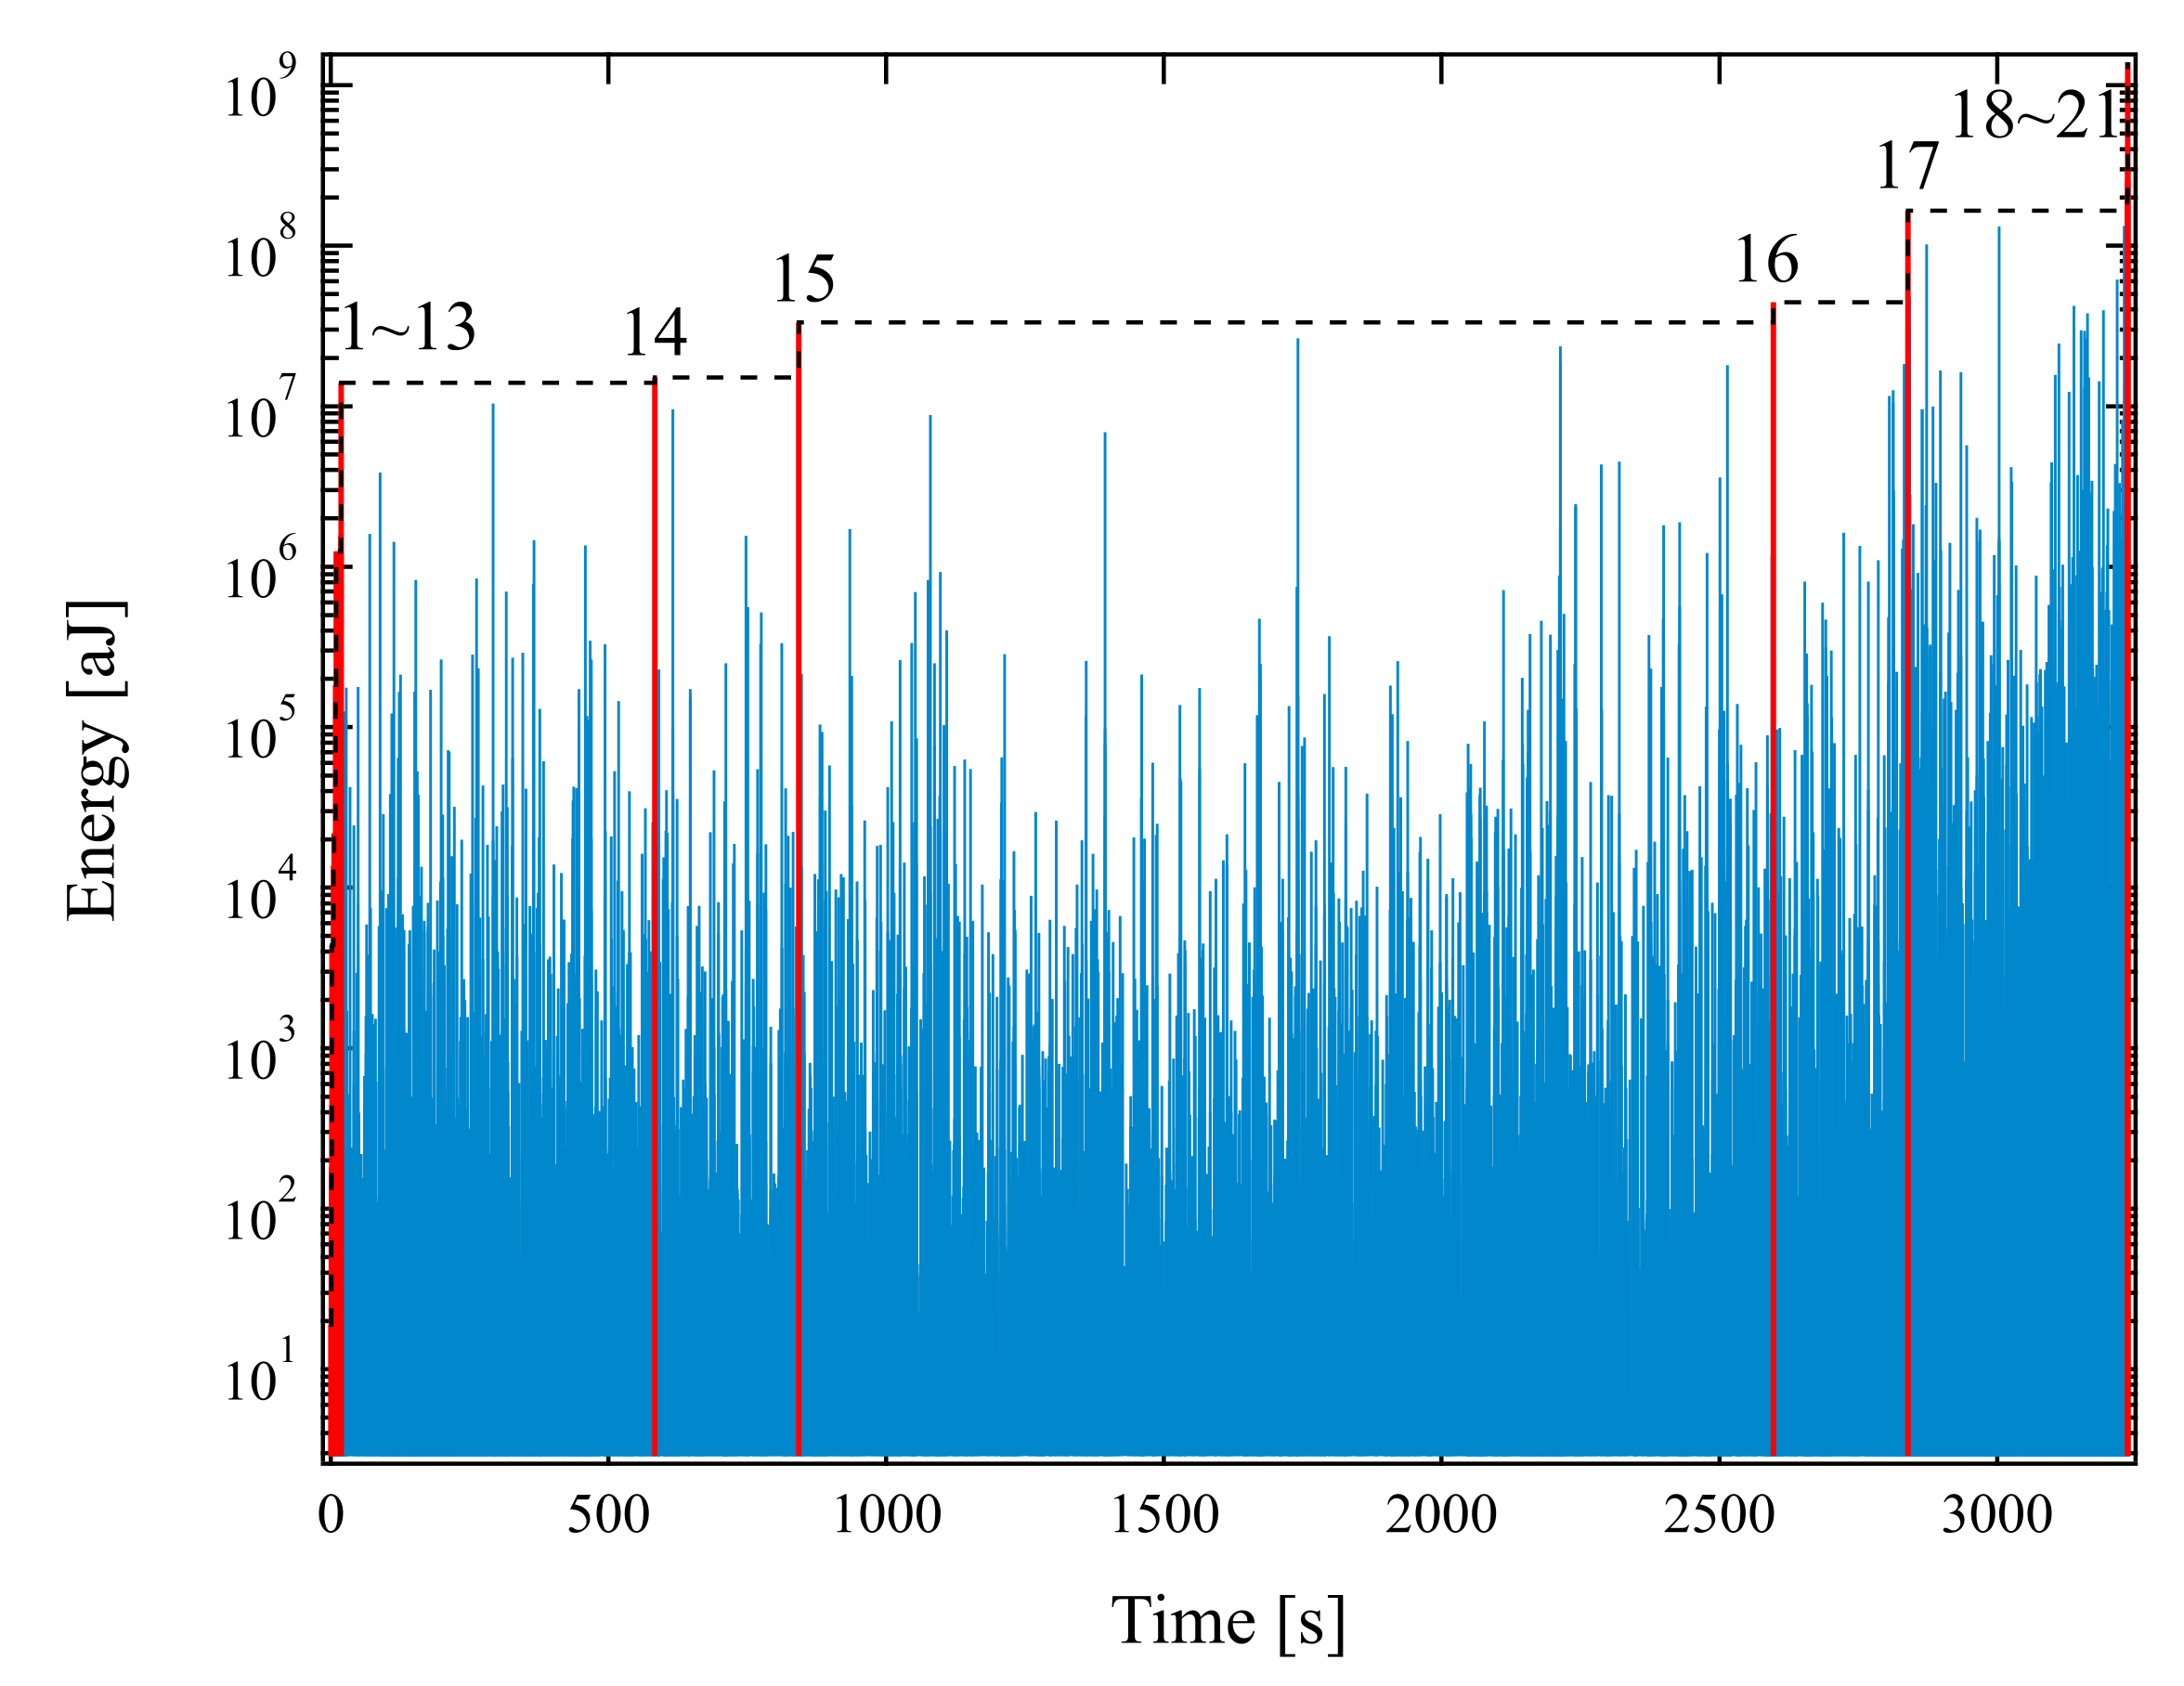
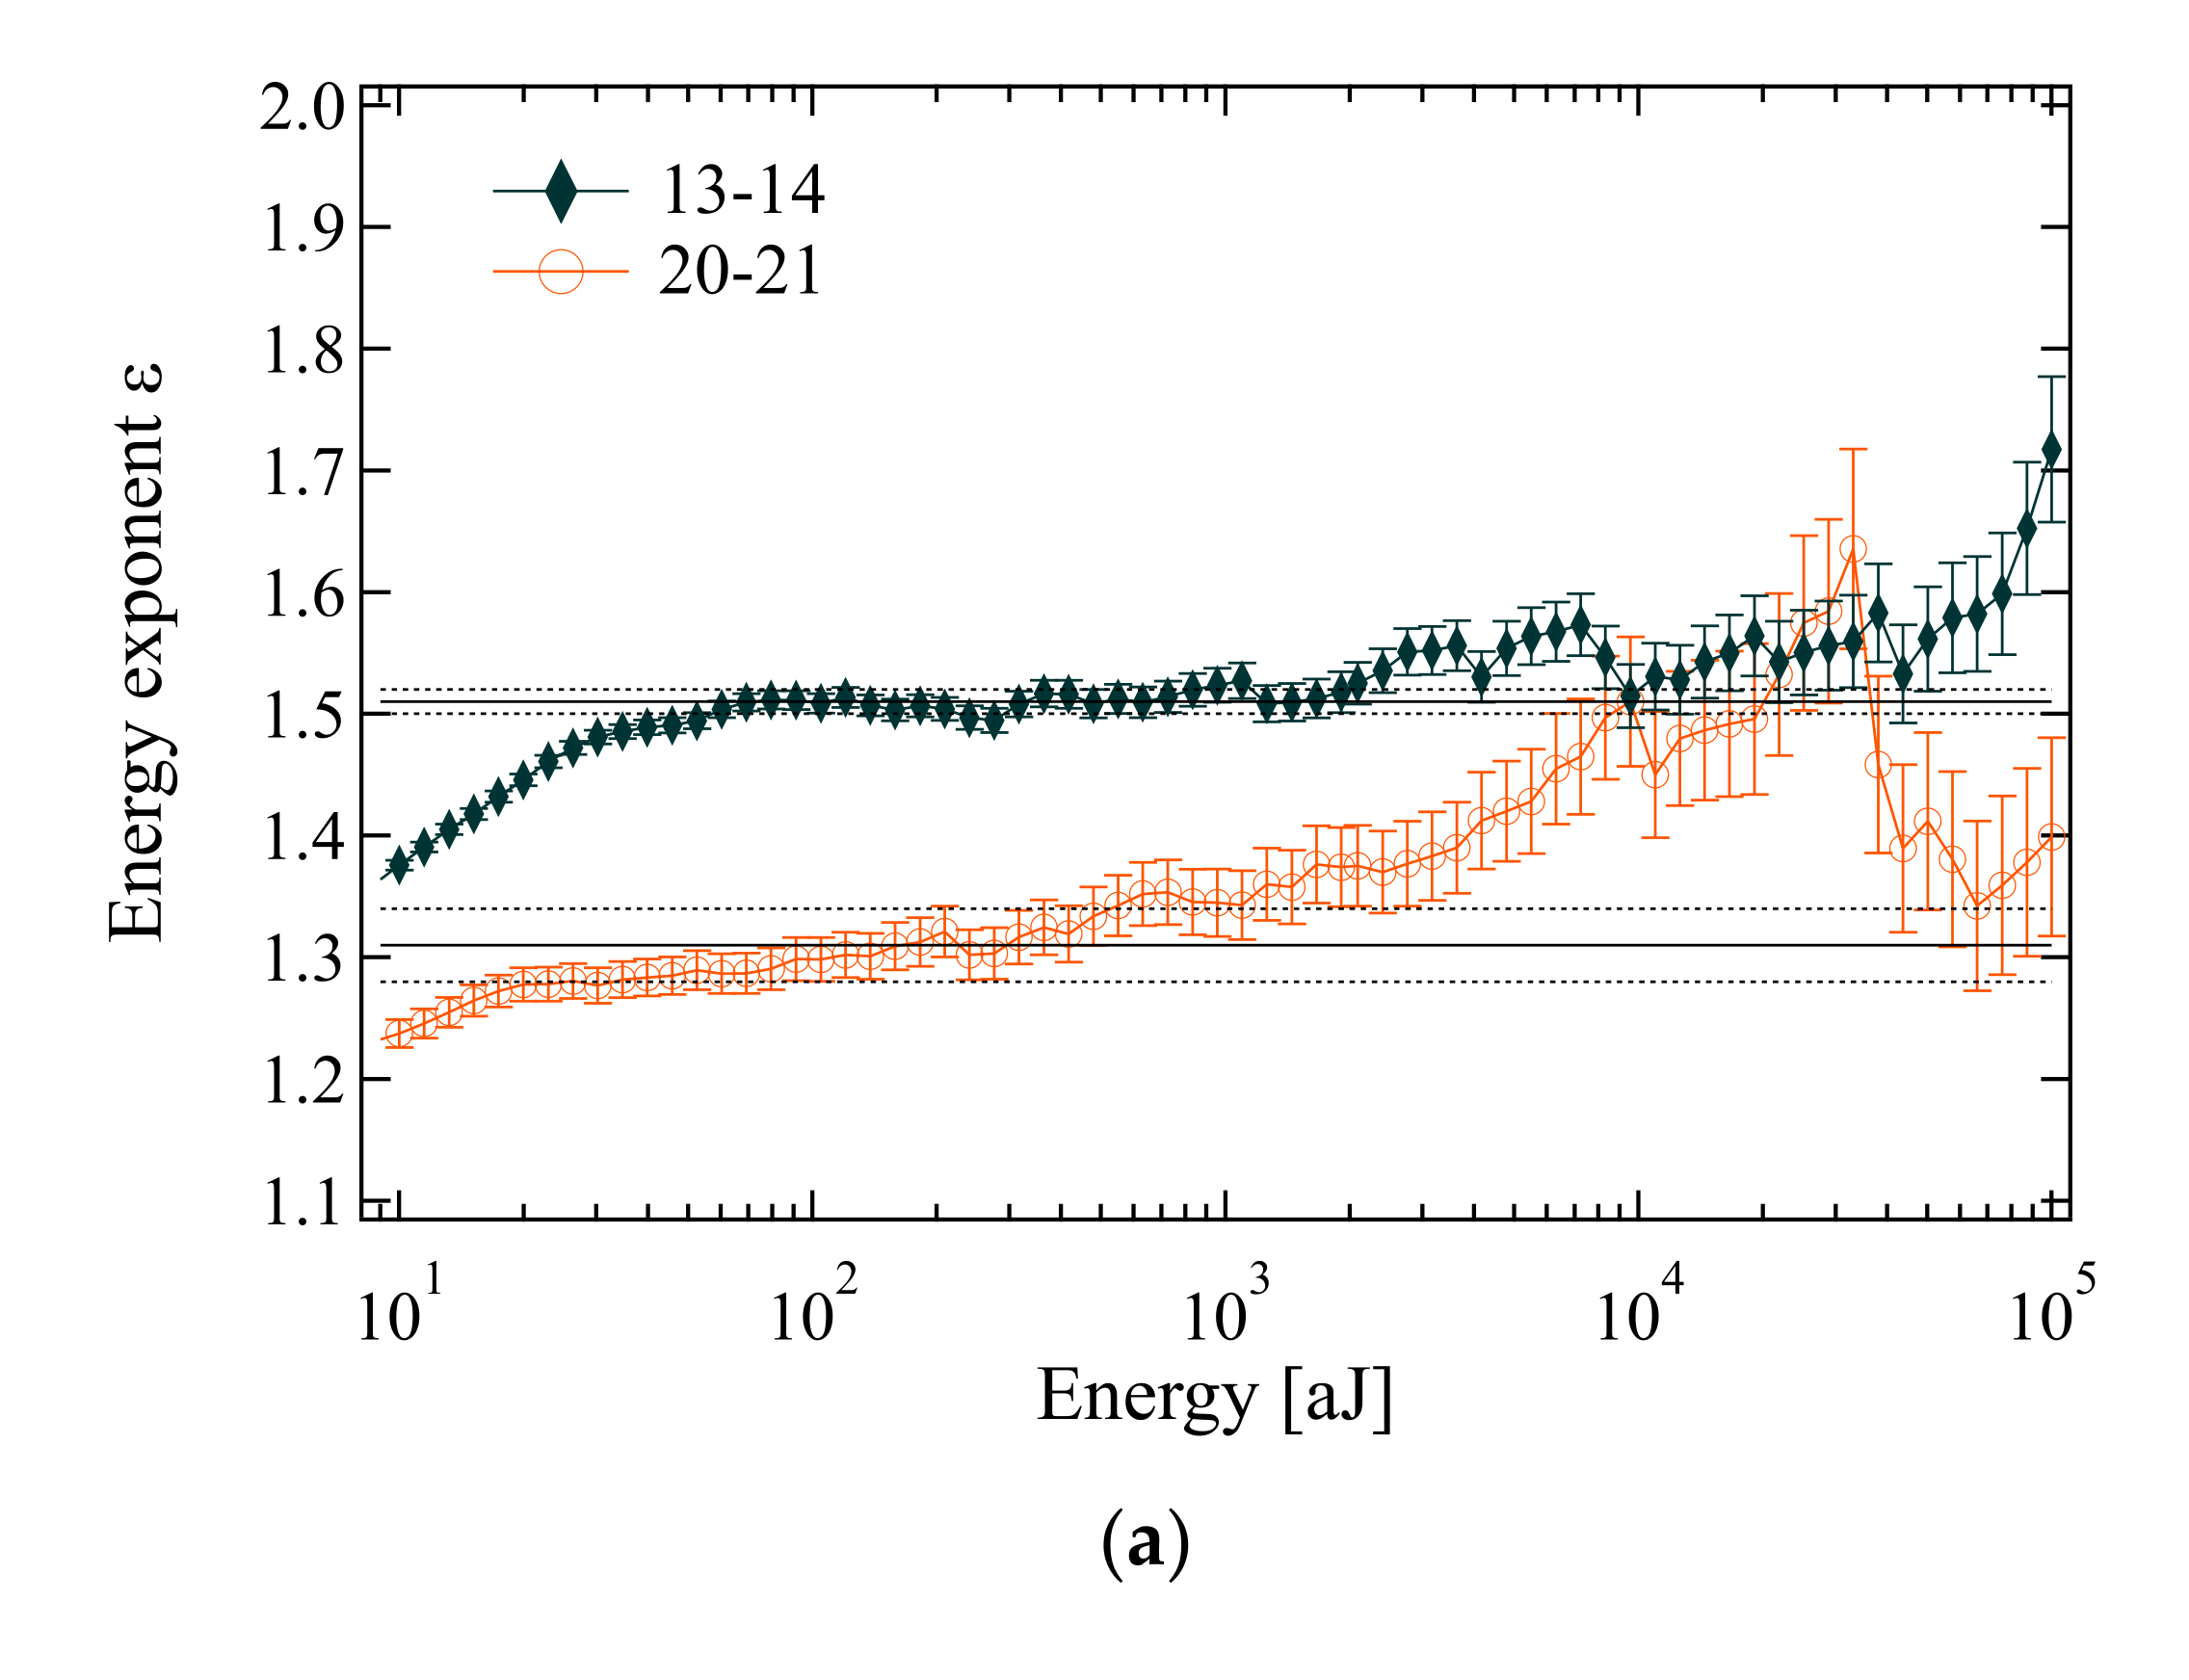
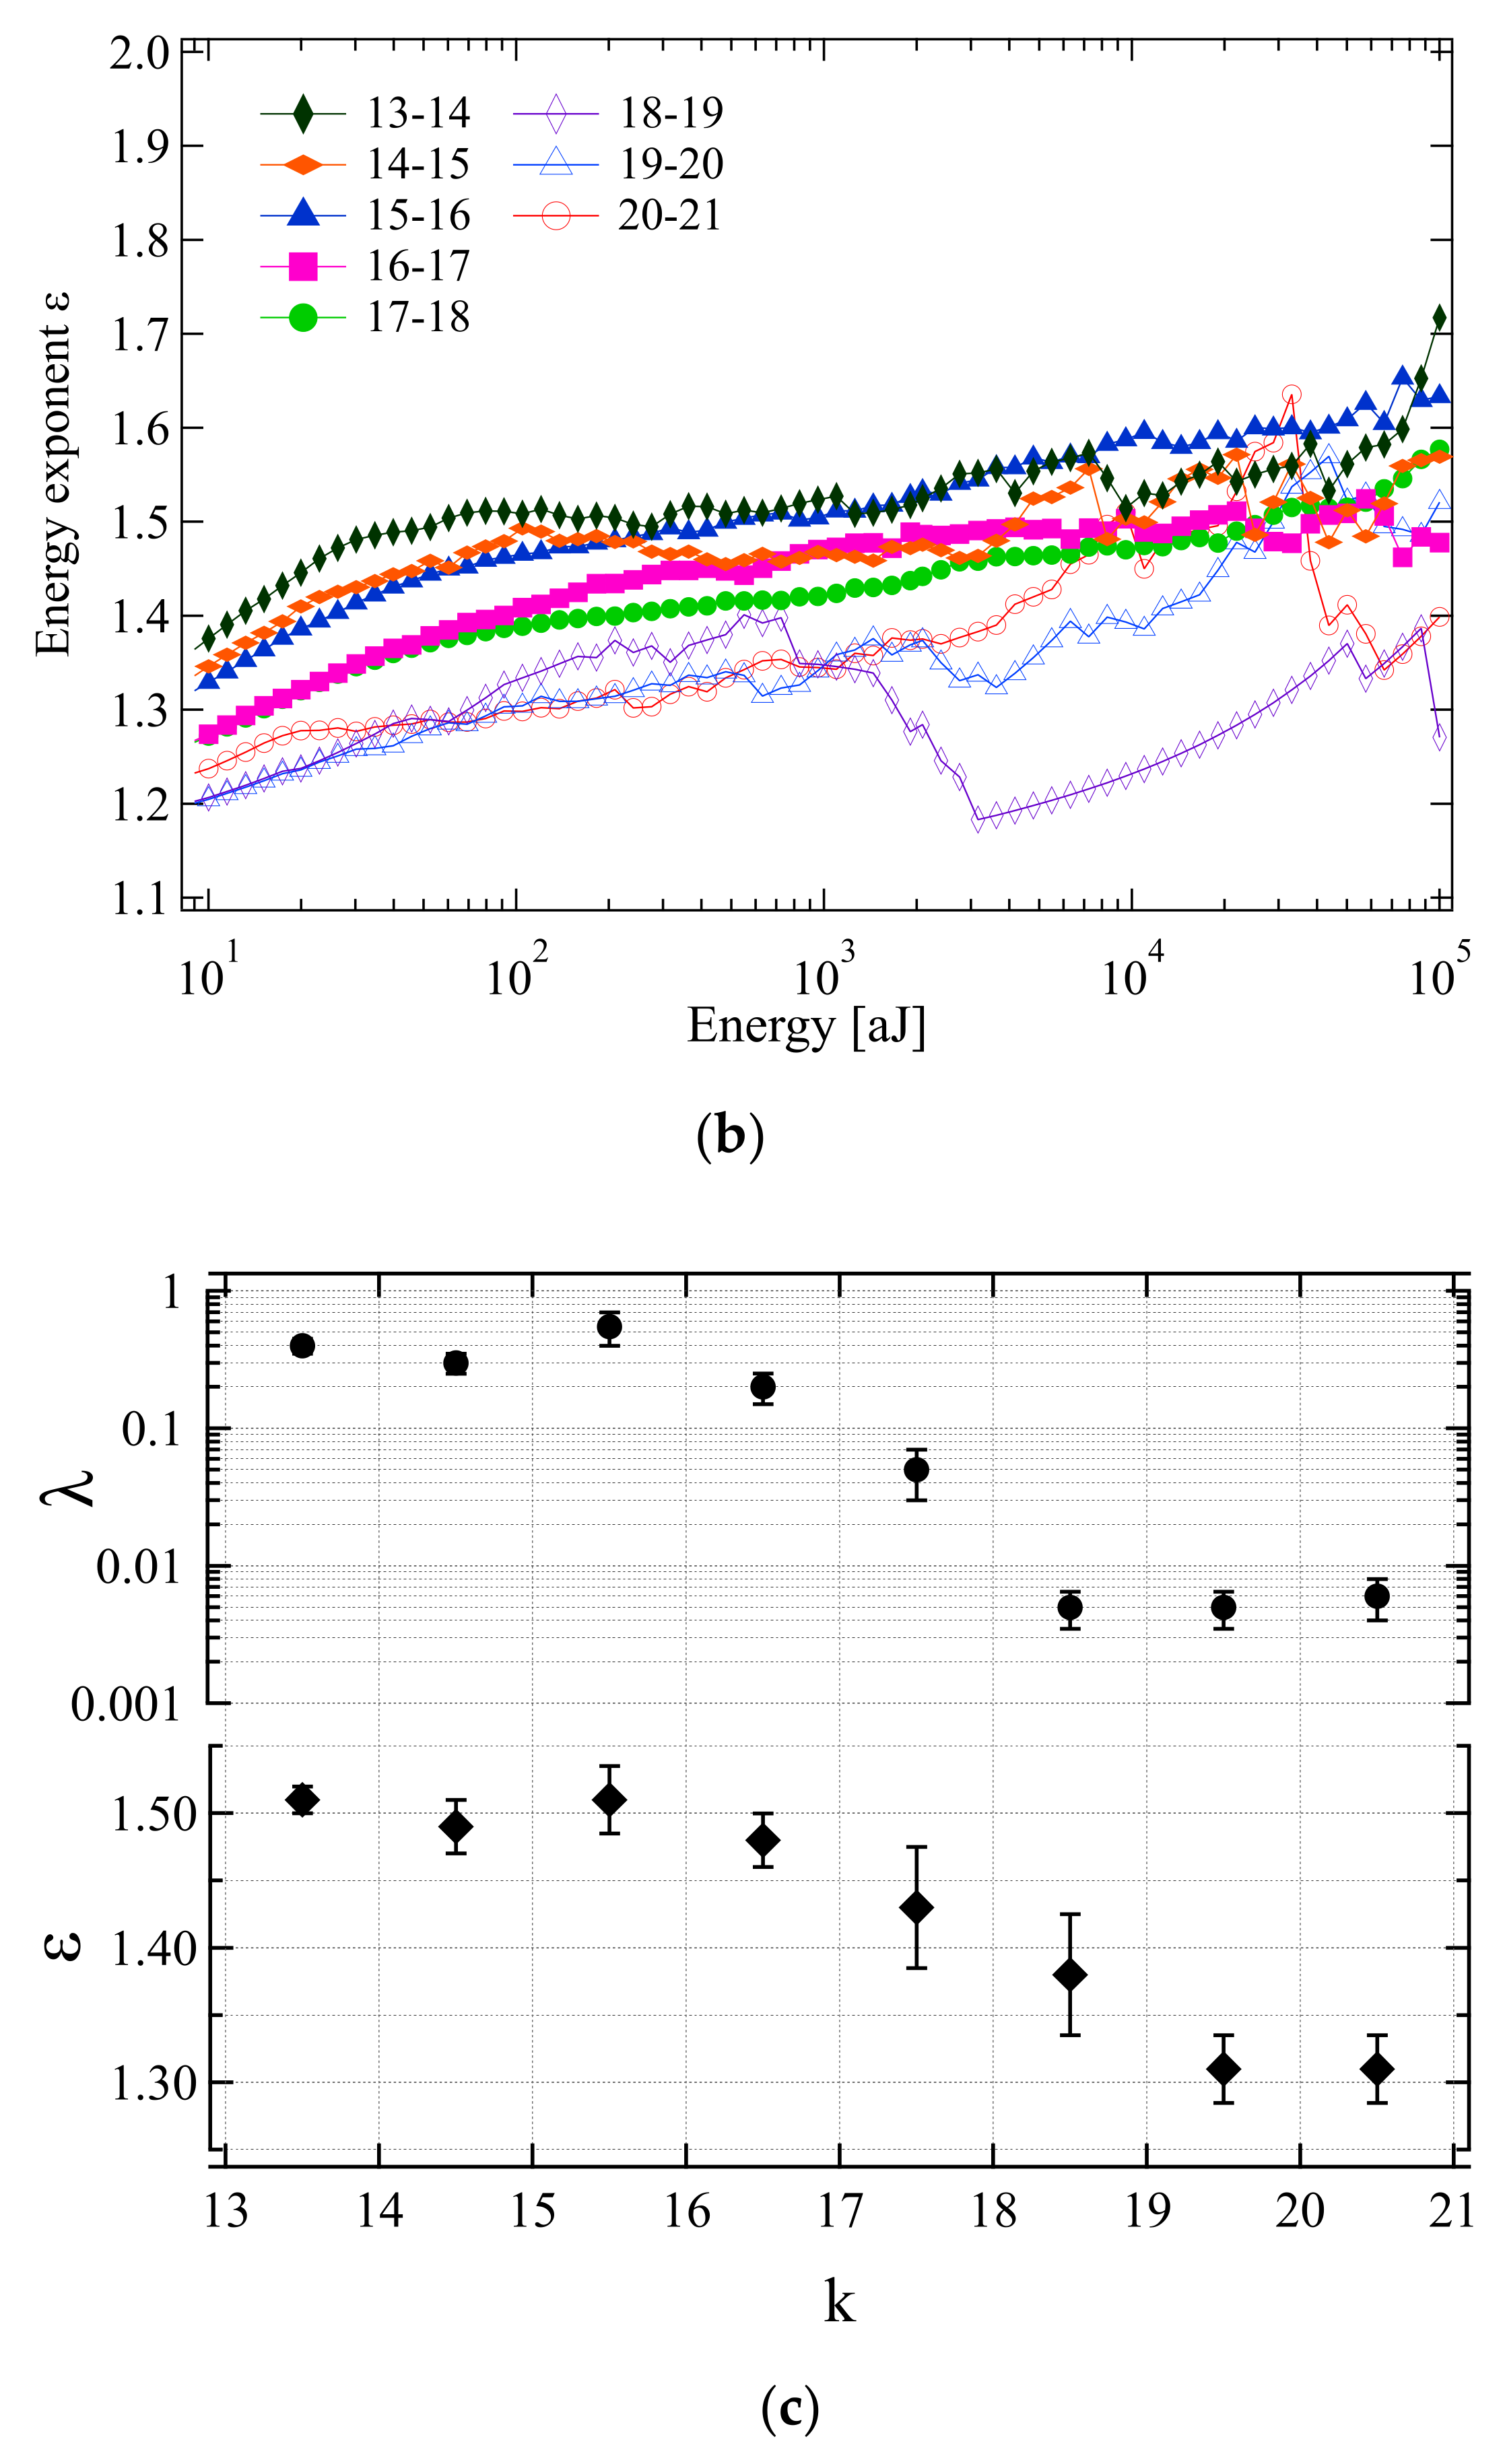
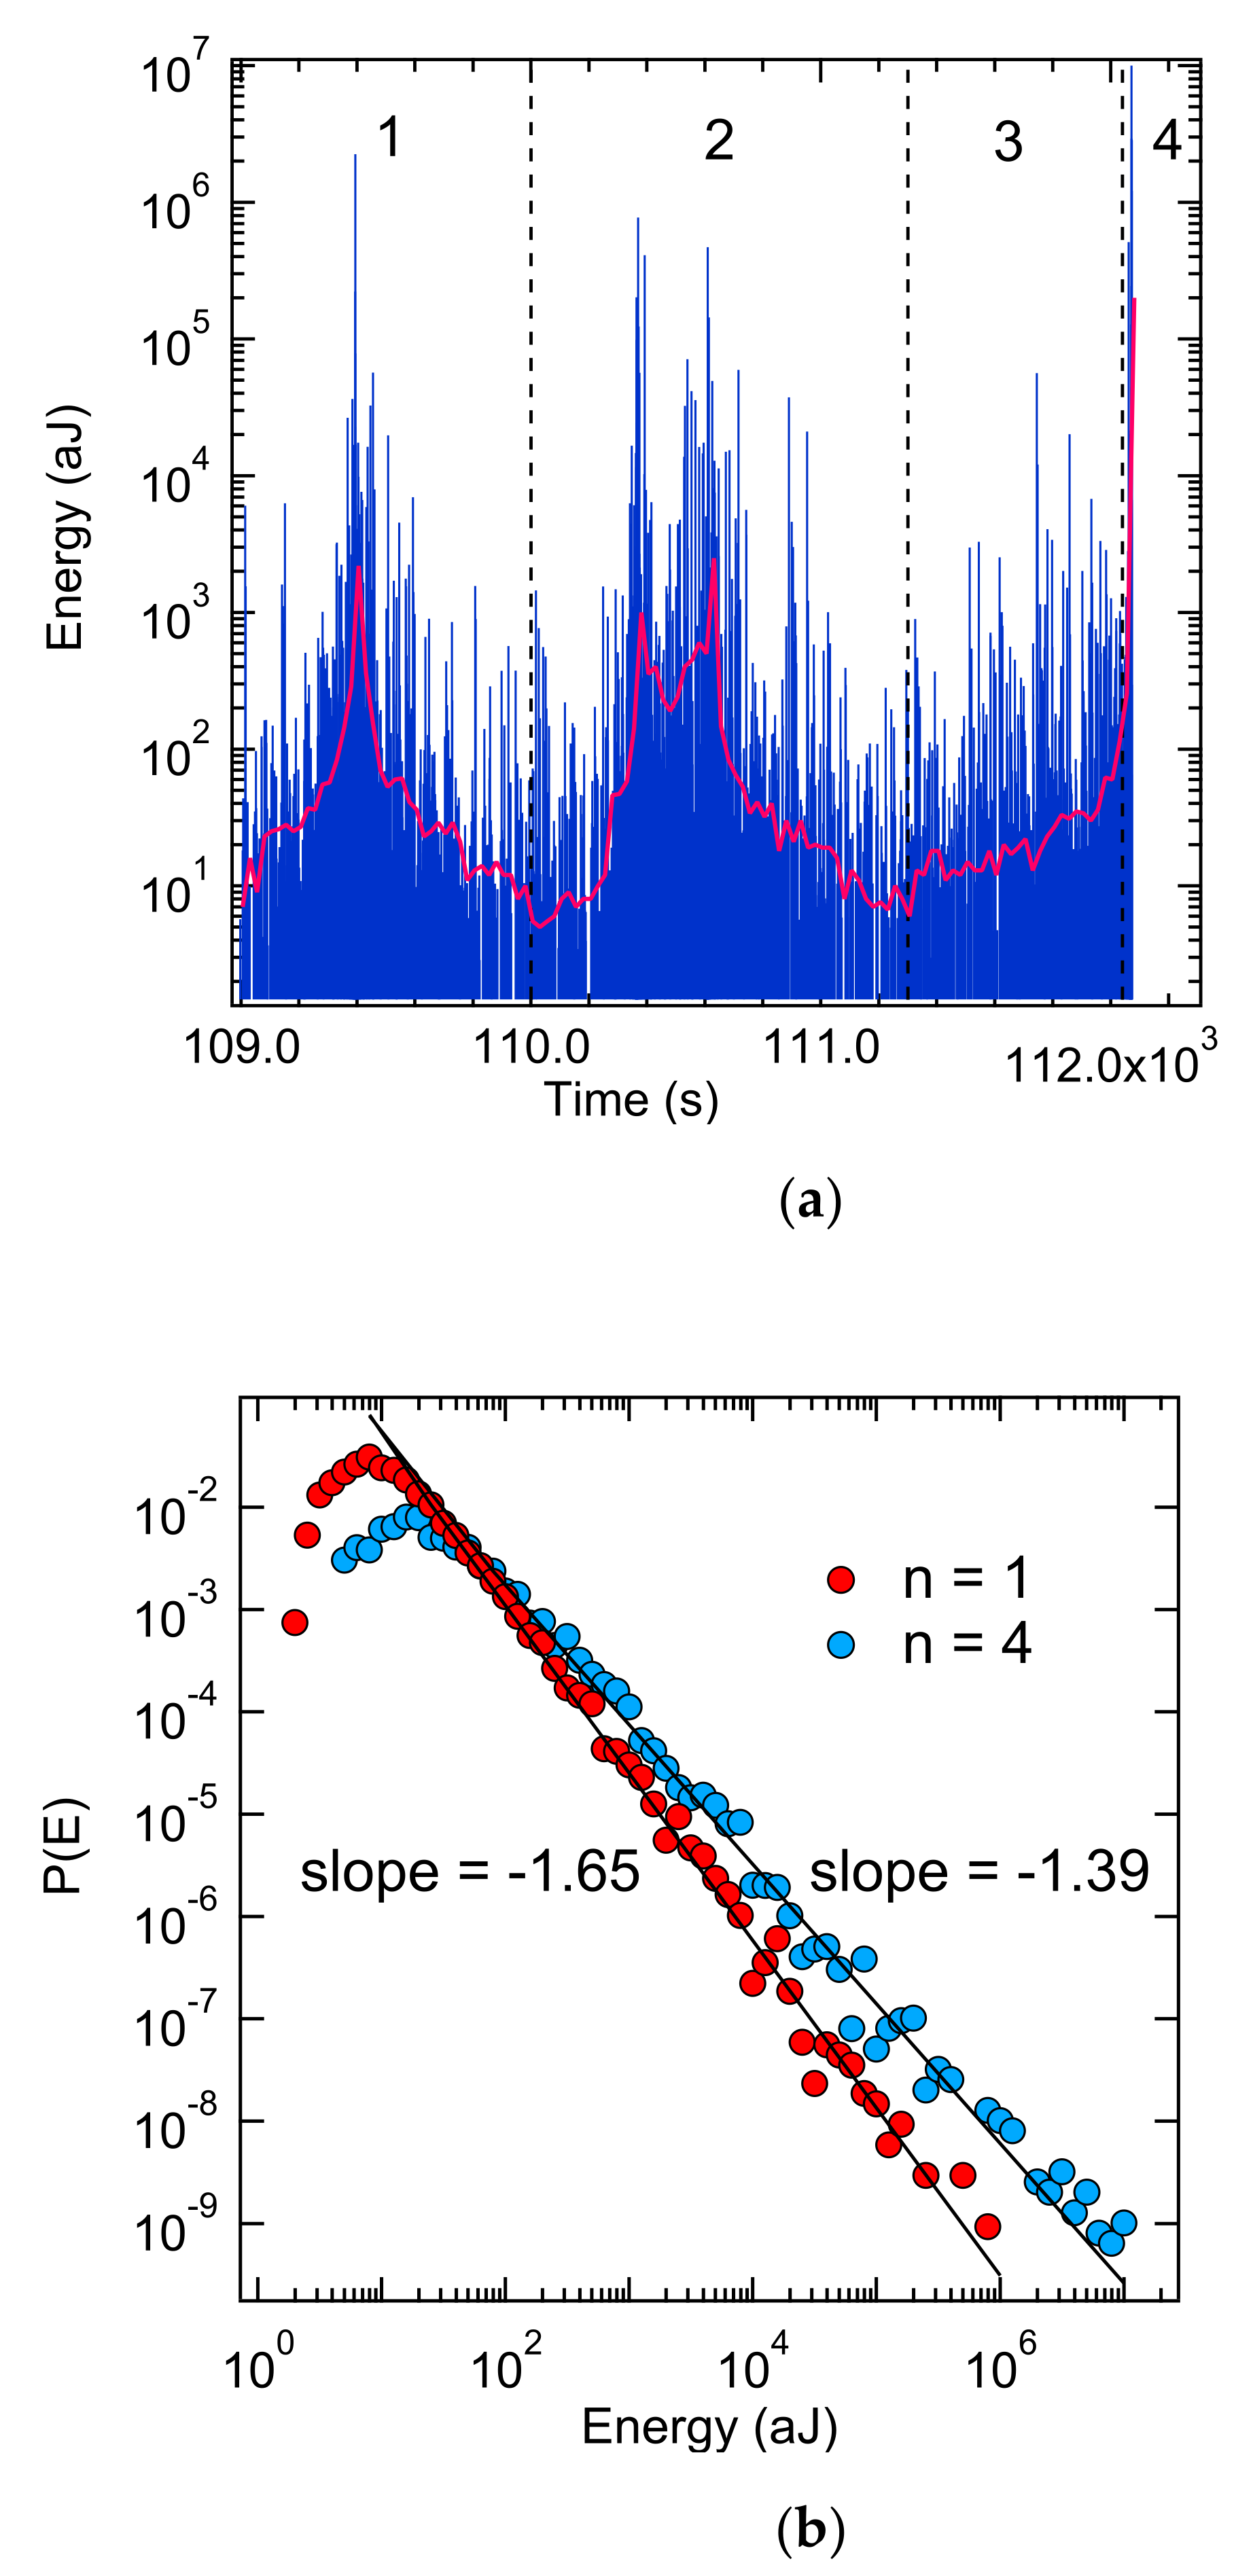
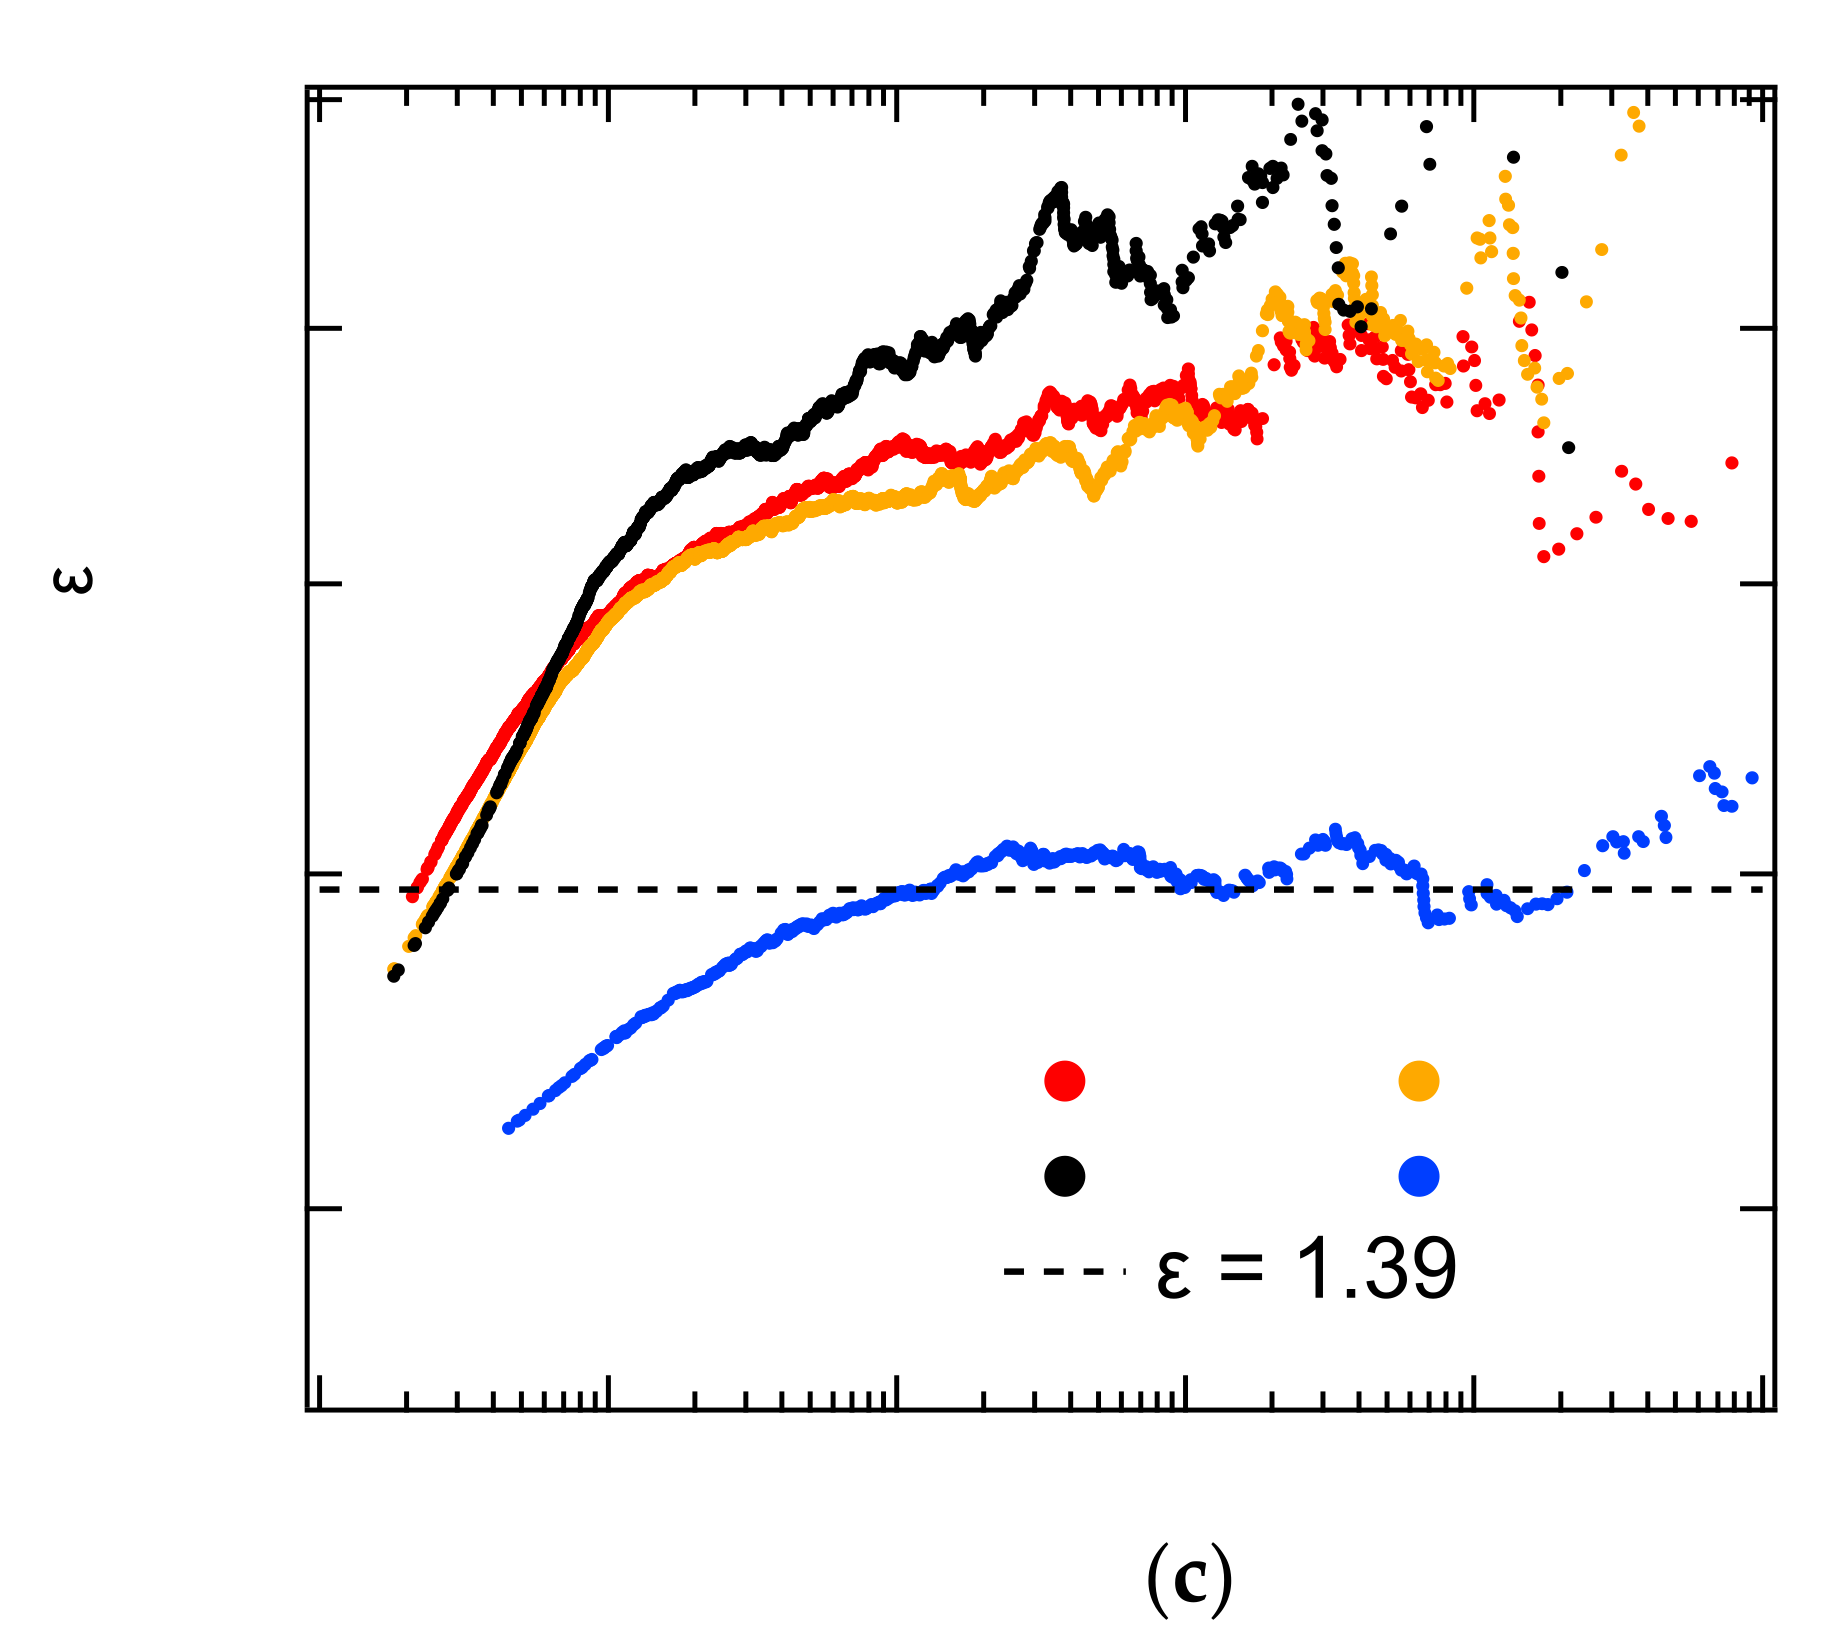
Jiang and his coauthors proposed the use of superjerks (also called “record breaking” events) to analyze AE spectra [
59]. A superjerk is defined as an avalanche signal with energy greater than any previous event of the series. It has attracted great attention due to its relevance for climate and earthquake research [
60,
61,
62]. Superjerks divide the whole AE spectrum into many subintervals (
Figure 4). By analyzing the probability density distribution of AE energy in each subinterval, the critical exponent decreases with the increase in superjerk ranks, which can be used as a warning signal of impeding disasters (
Figure 5). At the same time, it is also found that the waiting time intervals at times close to the final collapse become shorter and the AE signal strengths more intensive. The AE parameters hence evolve with the superjerk rank. A combination of these early warning signals was found to be the best approach to develop a reliable alarm system for structural collapse. Recently, a fiber bundle model has shown that the statistics of records of the event series of breaking bursts provide a very good tool to detect the acceleration breaking bursts, which could be used as an early warning of an imminent catastrophic failure [
63]. Similar results have also been reported during soft uniaxial compression of three silica-based (SiO
2) nanoporous materials. The variations in the activity rate are sufficient to explain the presence of multiple periods of accelerated seismic release leading to distinct brittle failure events [
64].
4. Avalanche Mixing
A crucial outcome of previous research is that failure does generally not follow a single mechanism. This surprising result can be exemplified by the observation of a collapse processes in metals [
2] where local porous collapse and the movement of dislocations combine to achieve the final, global collapse. In other cases, the porous collapse entails the avalanche movements of twin boundaries [
58], or a phase transition triggers catastrophic changes of microstructures related to structural transformations [
65]. During avalanche evolution we find that often one instability triggers another instability. This means that several avalanche mechanisms interact and mix dynamically [
66]. In this situation, probability densities are no longer simple power laws but show the typical up-wards curvature of mixed power laws [
67]. Salje et al. [
67] extended the analysis of mixing to the use of the ‘maximum likelihood estimation method’, ML [
68,
69,
70]. They derived the characteristic ML profiles for single, underdamped avalanches (a plateau), a damped avalanche (a monotonically increasing profile), and mixed avalanches (a peak before a plateau). The upwards bent probability density distribution translates into a steep increase in the ML estimates for small avalanche energies which peaks at a maximum value, which is bounded by the energy exponent of the avalanche with the higher exponent. It then decays towards the exponent of the second avalanche. This rather complex ML profile was identified in several experimental investigations, which shows that avalanche mixing is indeed a much more common phenomenon than previously assumed [
6].
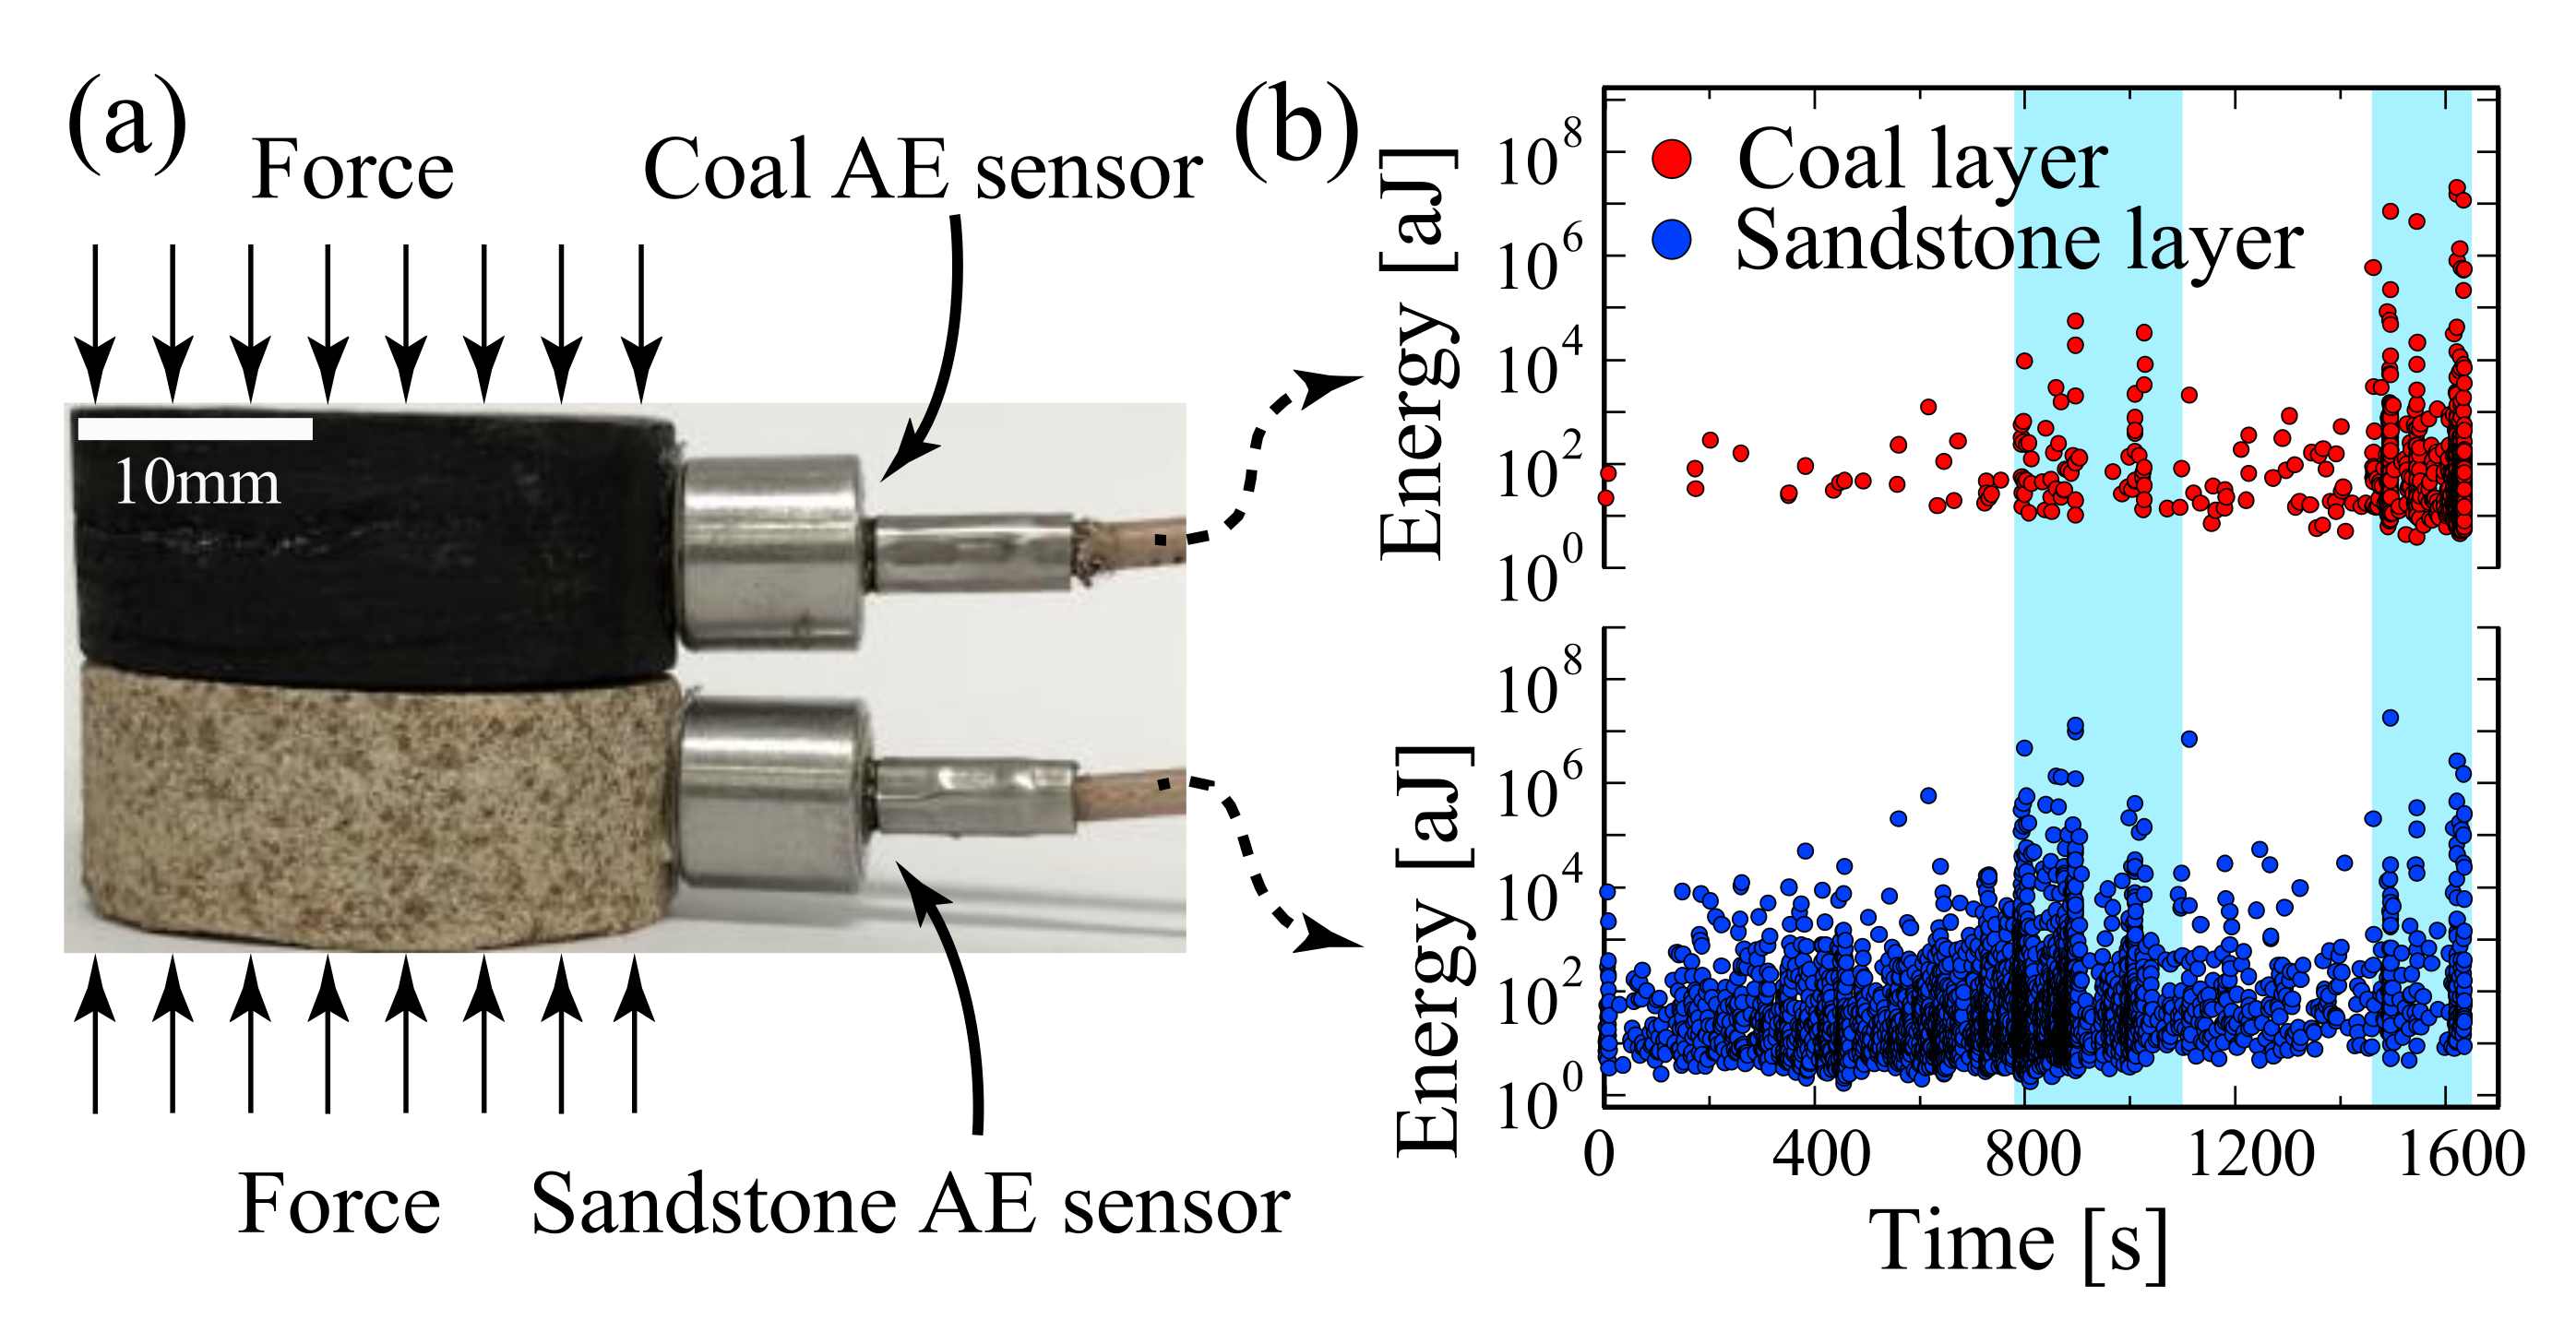
In order to confirm the mixing mechanism for different avalanches during a collapse process, Salje and his coauthors designed a simple and instructive experimental arrangement. They used two materials with different strengths and superimposed them in the same stress device (
Figure 6) [
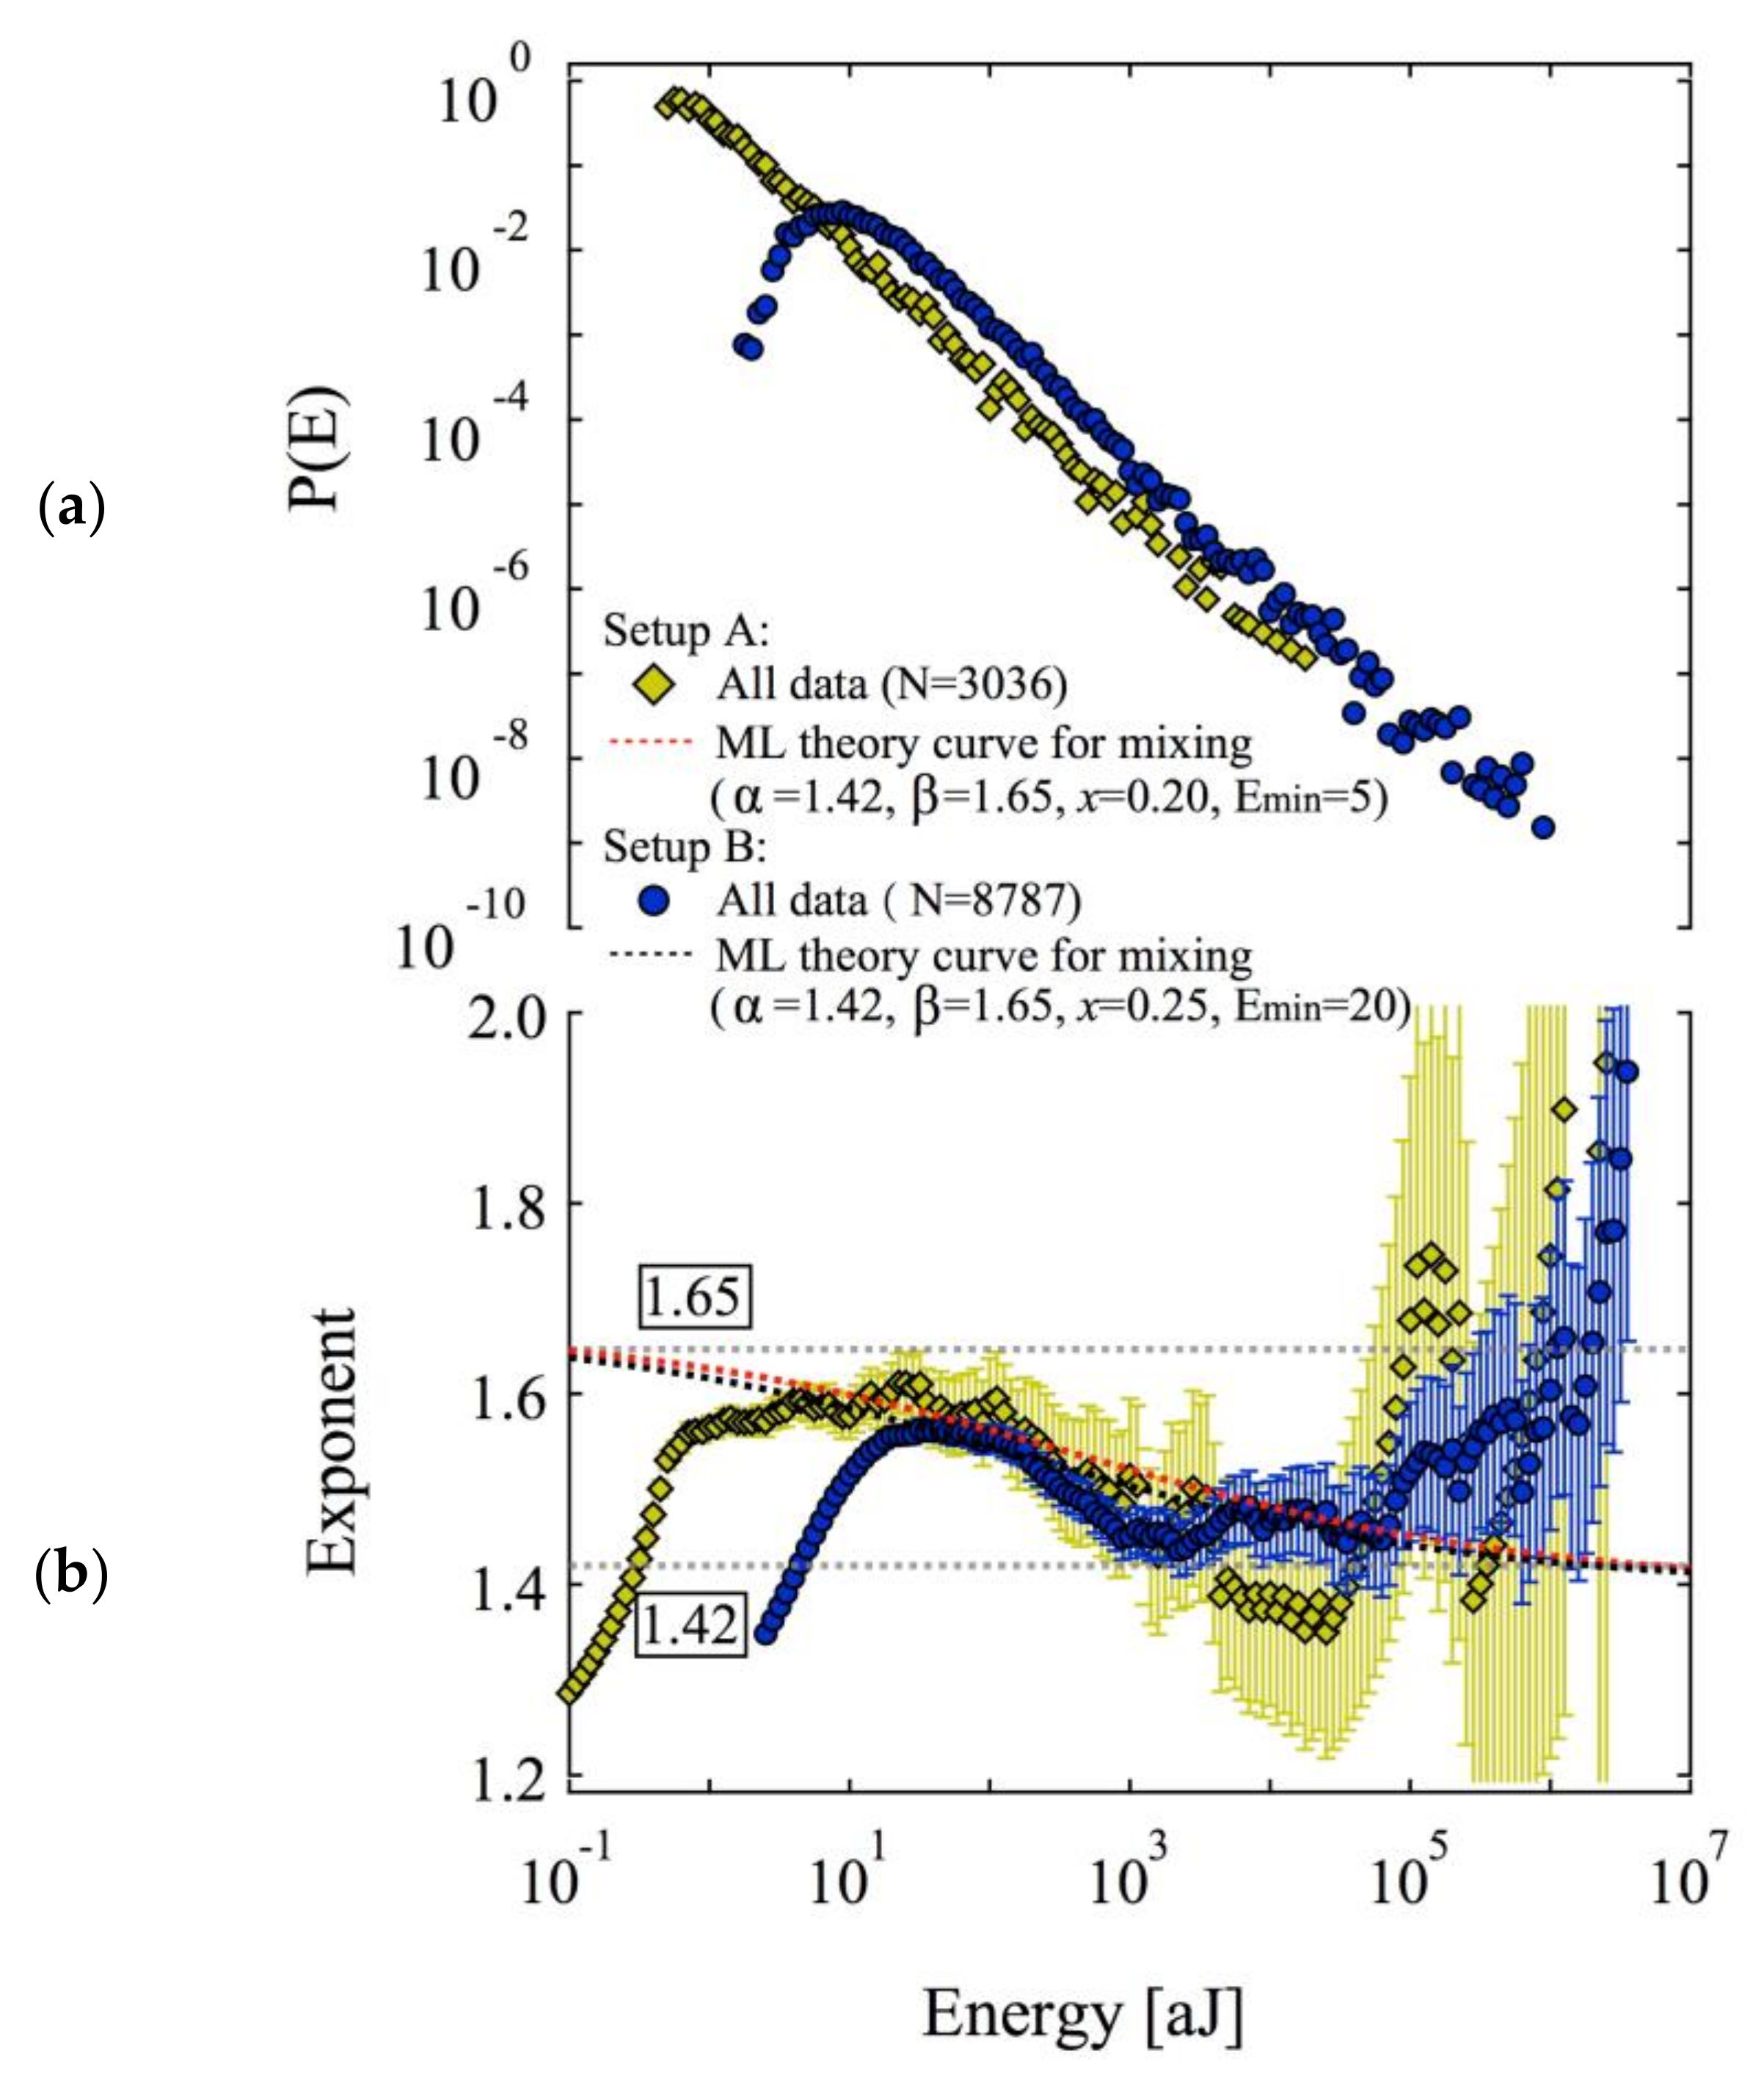
71]. The stress was identical for both materials, but the avalanche dynamics were different. This experiment combined one porous material at the early stage of uncorrelated, random damage mode while the second material was more highly damaged within the correlated failure state. The common stress created two avalanche processes simultaneously and ensured mixing between them. In the compression experiment, they used coal and sandstone as test materials. As predicted by theory, the probability distribution of the AE energy of the composite rock was a nonpower law with an upwards bent of the probability distribution function (PDF) in double logarithmic display. The maximum likelihood estimation curve showed the predicted increase, peak and decrease towards the lower exponent (
Figure 7). Several other compression experiments show that the mixing effect of different avalanche mechanisms is a common phenomenon. For example, compression experiments on granite show that the crumbling and fracture mechanism of granite mineral particles can form a state of avalanche mixing [
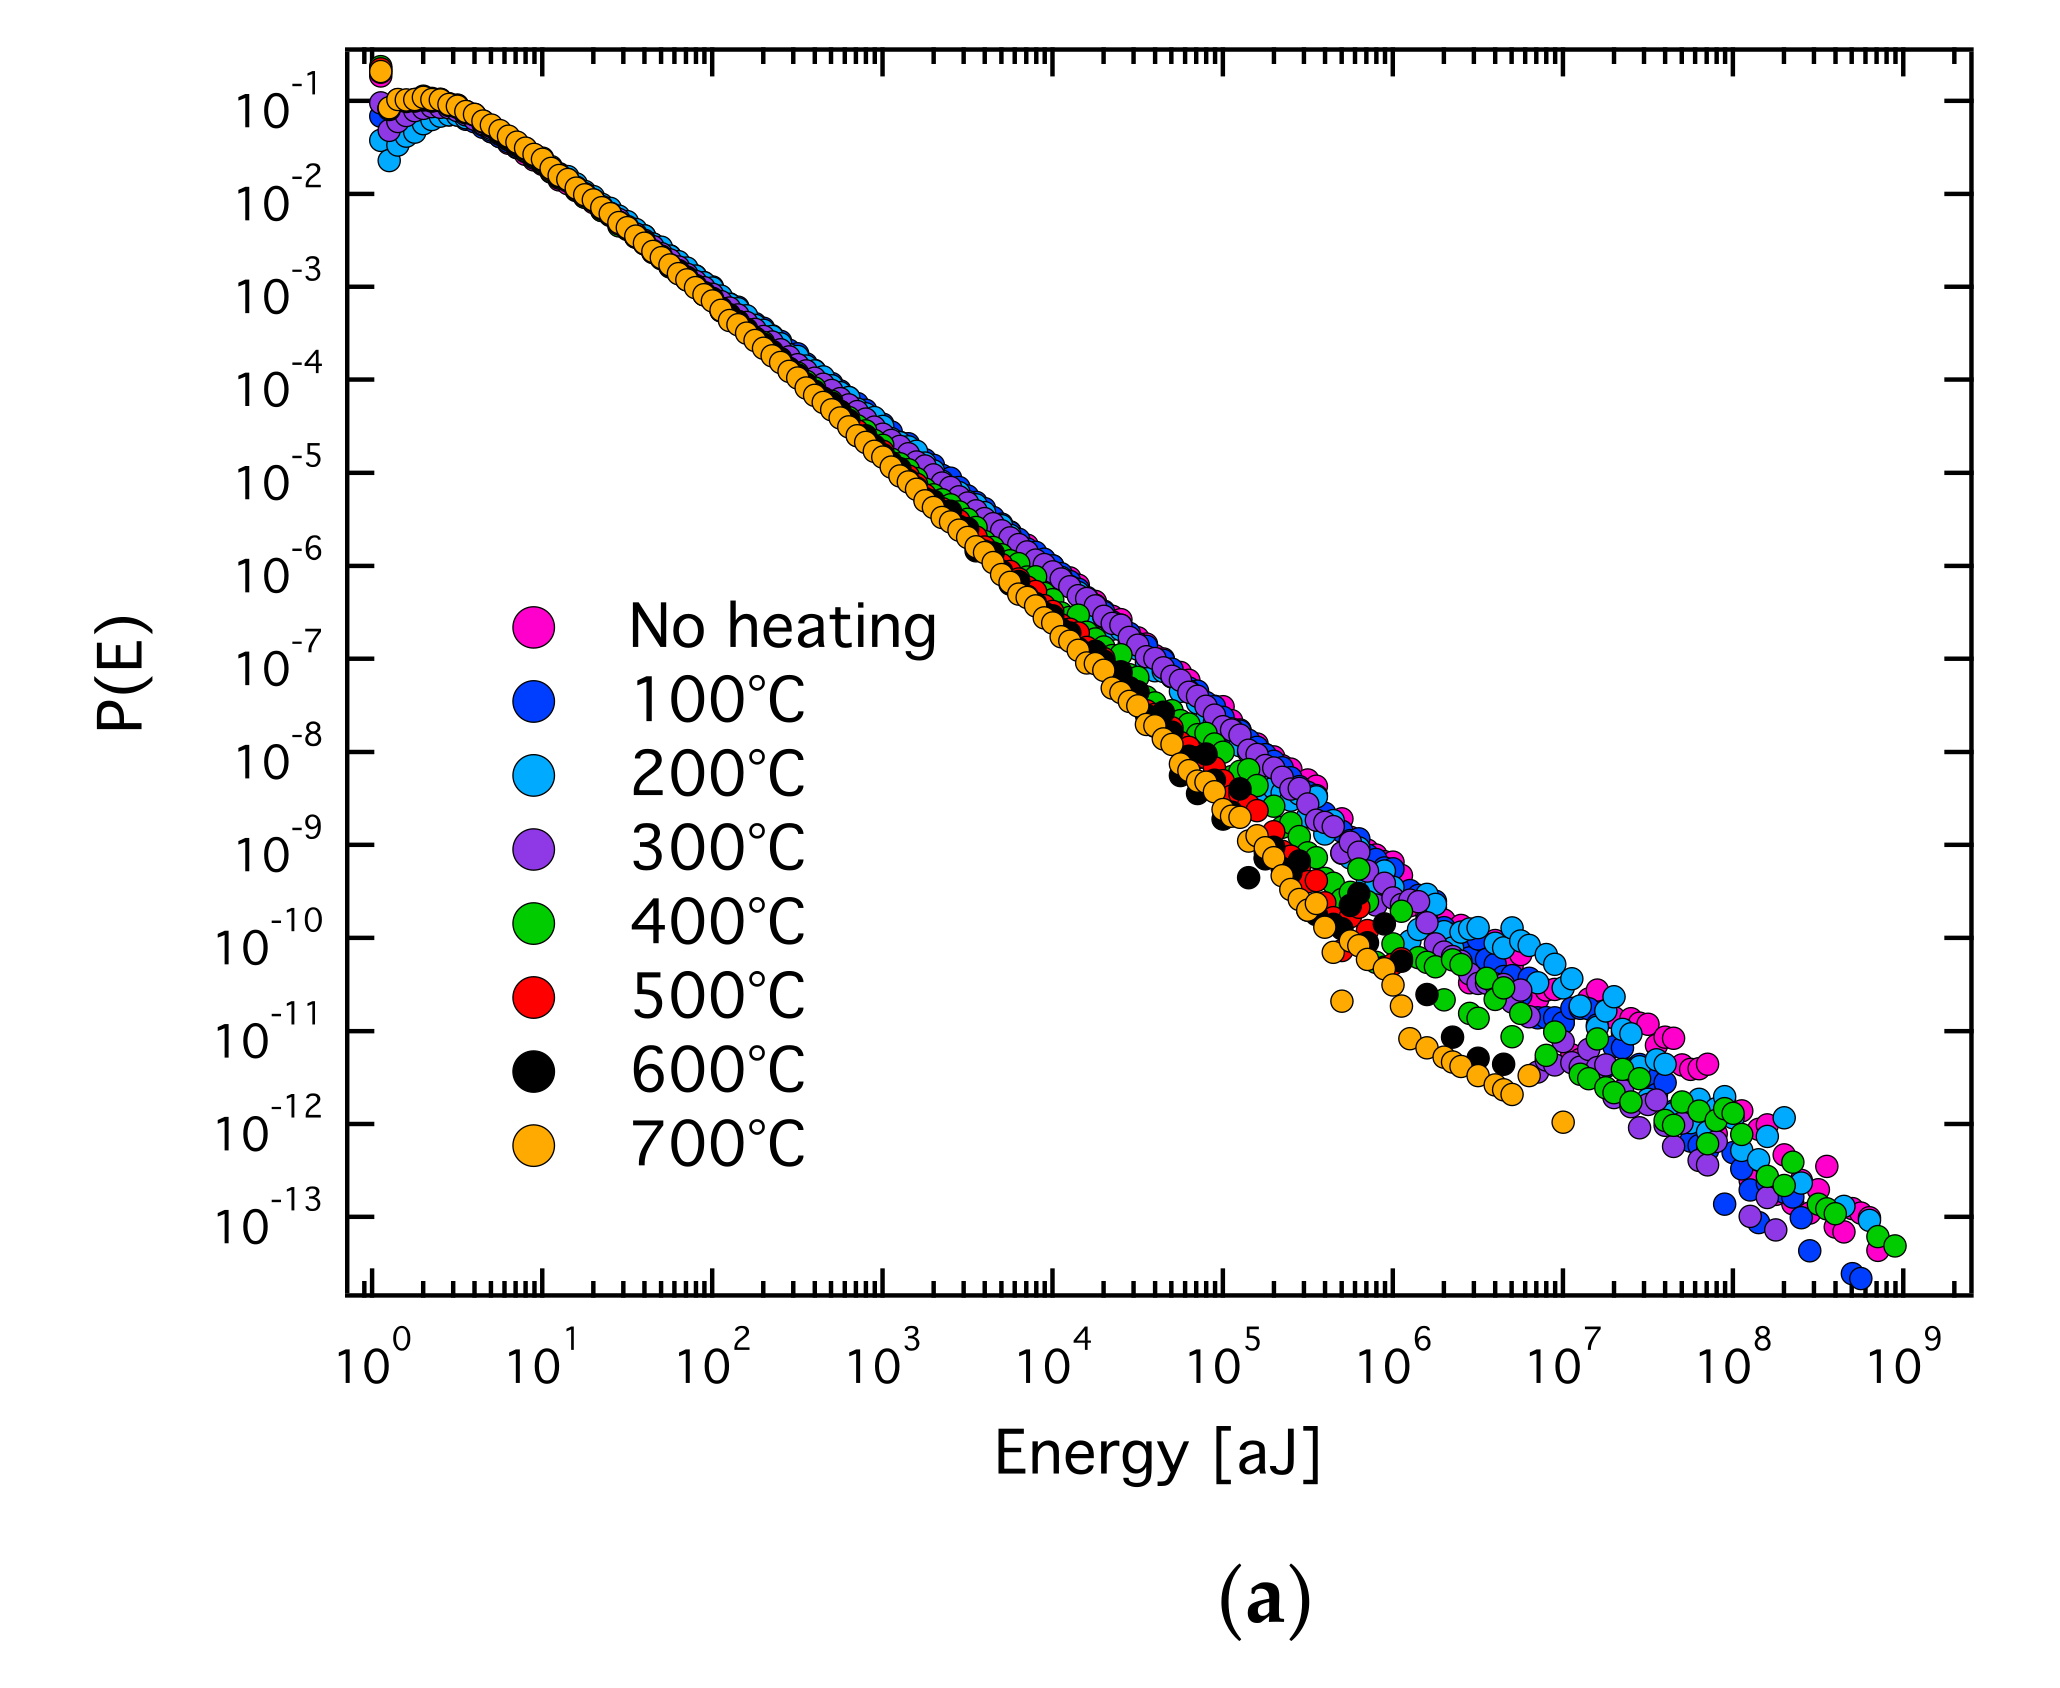
72]. High temperature annealing (near the α-β phase transition temperature of quartz) reduces the internal constraints of granite and weakens the effect of fracture, so that the mixing between crumbles and fracture is observed (
Figure 8). The AE crack analysis helps to evaluate whether there is prior damage in granite, which plays an important role in the safety assessment of granite caves for nuclear waste deposition.
For uniaxial compression under stress control, the sample compression stops after the first cracks occur. If the stress is further increased, it constitutes a confining effect and additional friction occurs. This effect was exemplified for sandstone where confined compression tests always show avalanche mixing, in contrast with the uniaxial compression test without confinement [
73].
In addition to geological materials, the mixing of different avalanche mechanisms has also been studied in several materials. For example, in a porous Mg-Ho alloy, the interaction between dislocation and fracture leads to the mixing of avalanche mechanism during compression and tension [
2]. The critical exponents of the two mechanisms are consistent with the mean field theory and the force integrated mean field theory, respectively. Furthermore, the two avalanche mechanisms can be separated by synchronous waveform analysis. Chen and her collaborators have demonstrated how to separate dislocation moves and entanglements in 316 L stainless steel. They showed that the main difference between the two mechanisms is the average duration for each type of avalanche [
74].
5. Applications
5.1. Biocementation
The energy consumption to produce cement for building work is particularly high. The cement industry creates significant environmental pollution, so that the development of new environmentally friendly cementitious materials has become a research hotspot in many countries. Some micro-organisms produce calcium carbonate in the process of metabolism, which induce calcium carbonate deposition during cementation [
75,
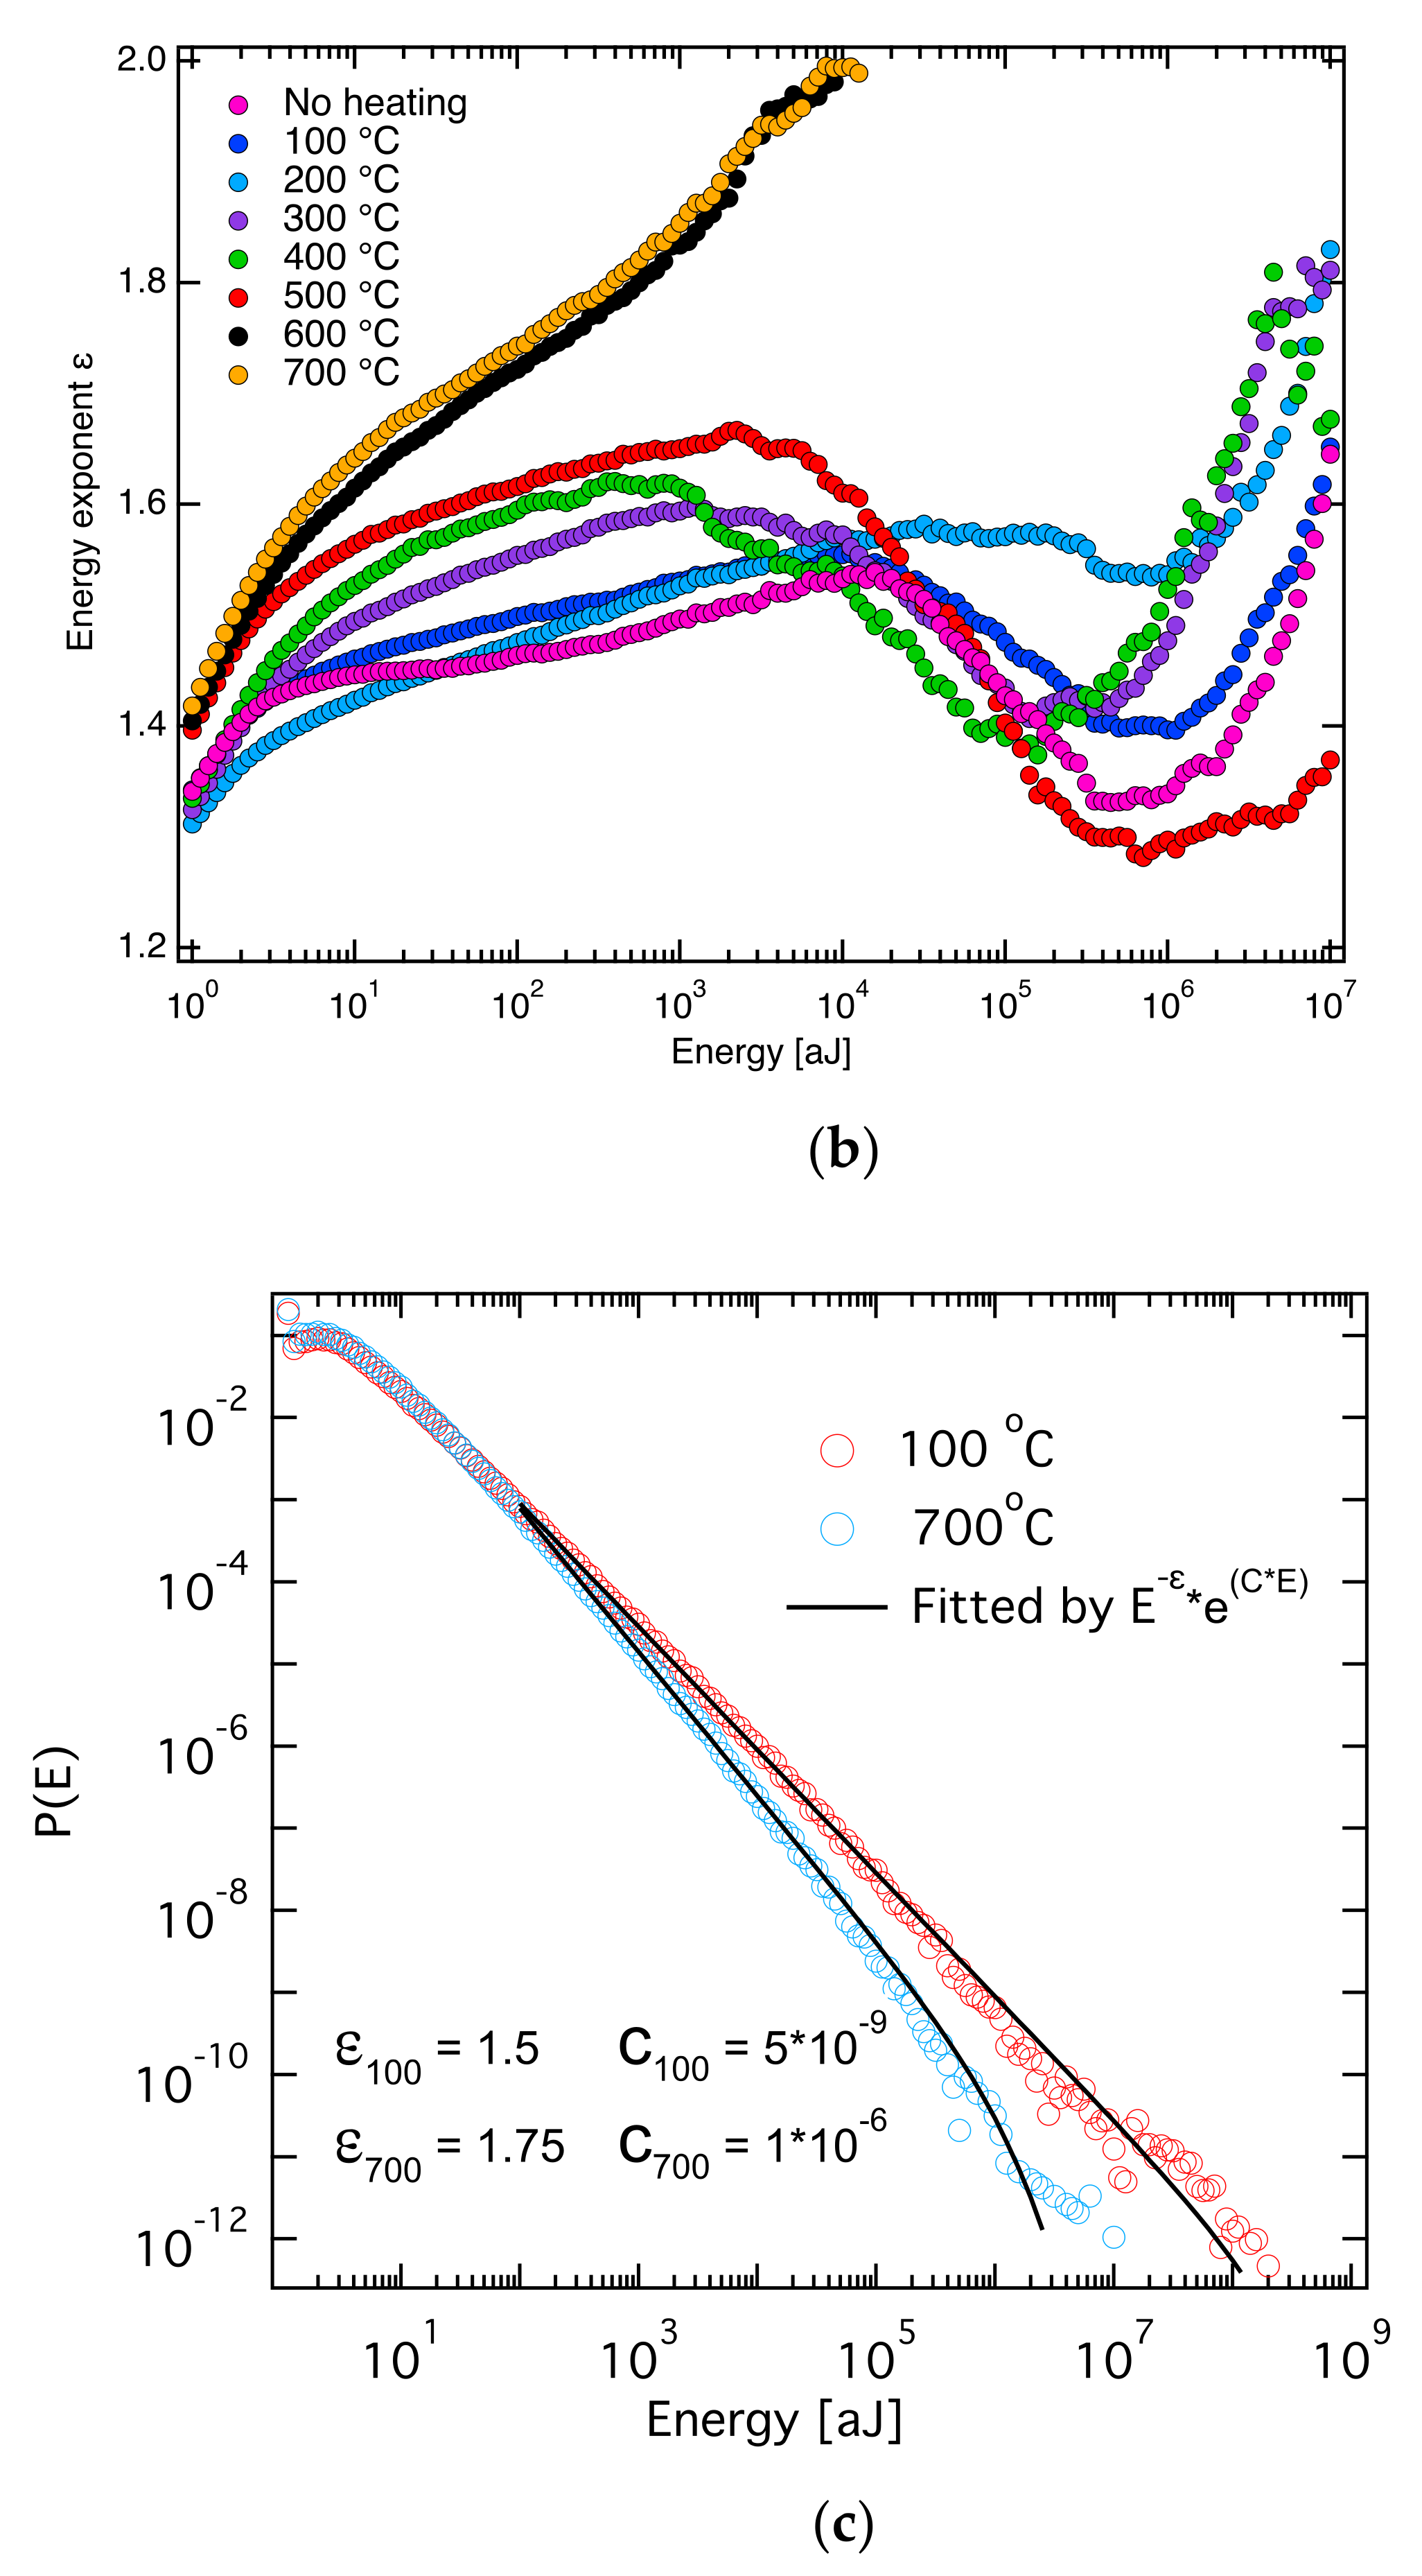
76]. One of the important applications is in the construction of calcareous sand islands and reefs. Calcareous sand exists widely throughout the Earth’s tropical zones. The main construction requirement is that calcareous sand needs to be reinforced for foundation construction. Wang et.al. carried out compression failure experiments on single calcareous sand grain, unconsolidated sands and biocemented sand block [
77] (see
Figure 9). All three materials show avalanches under compression. Through the analysis of the avalanche characteristics of the three samples, it was found that the destruction mechanism of the biocemented calcareous sand is the failure of the bonding between sand particles via the biogenic calcium carbonate. Under stress the biocemented calcareous sand blocks degenerate rapidly back into sands without cementation and some carbonate clusters. In this case, the observation of crackling noise provides an excellent indicator for the stability of biocemented structures.
5.2. Hydroxyapatite (Human Teeth) Cracking
Teeth are the strongest part of the human body. They not only have the function of chewing, but also play an important role in pronunciation and facial appearances. They also contain microcracks which are not routinely found by optical and CT examination in dental clinics. This leads to wrong diagnosis of crack formation before the cracks become large enough to be observed optically. Moreover, tooth cracks do not self-repair, they can induce periodontitis and, ultimately, the loss of the tooth. The cracks do not induce pain at the initial stage, making it difficult for patients to detect tooth damage. When pain occurs, the best opportunity for treatment has already been missed. Wang et al. used healthy human molars to carry out damage examinations and found that the process of tooth cracking displays obvious avalanche characteristics [
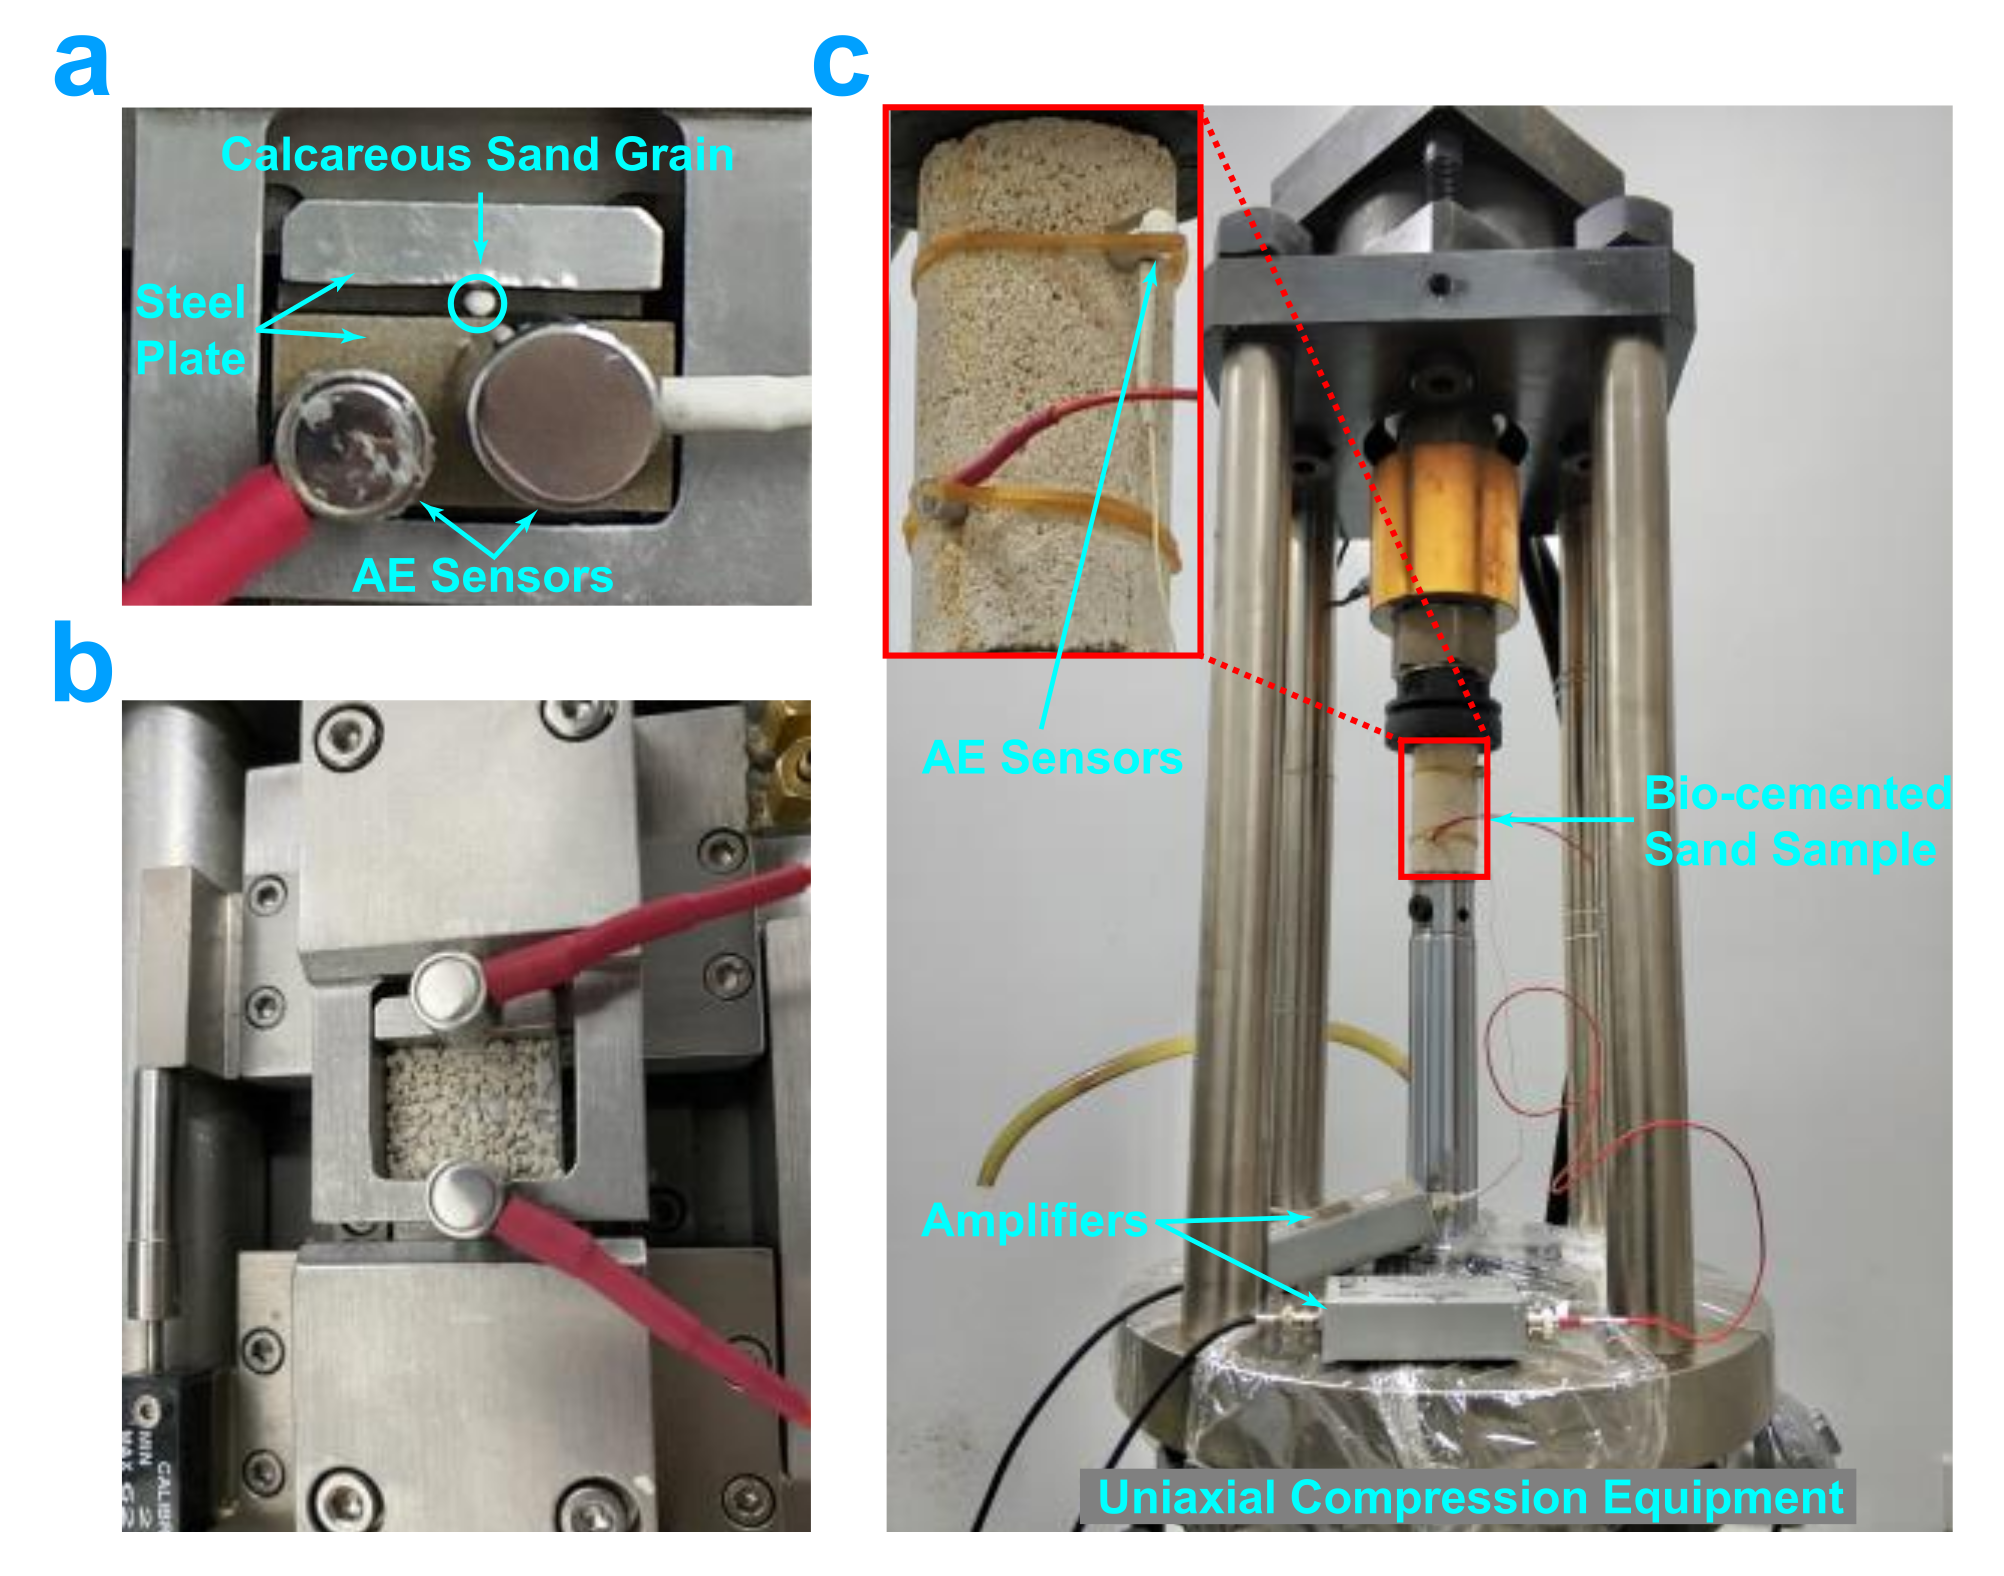
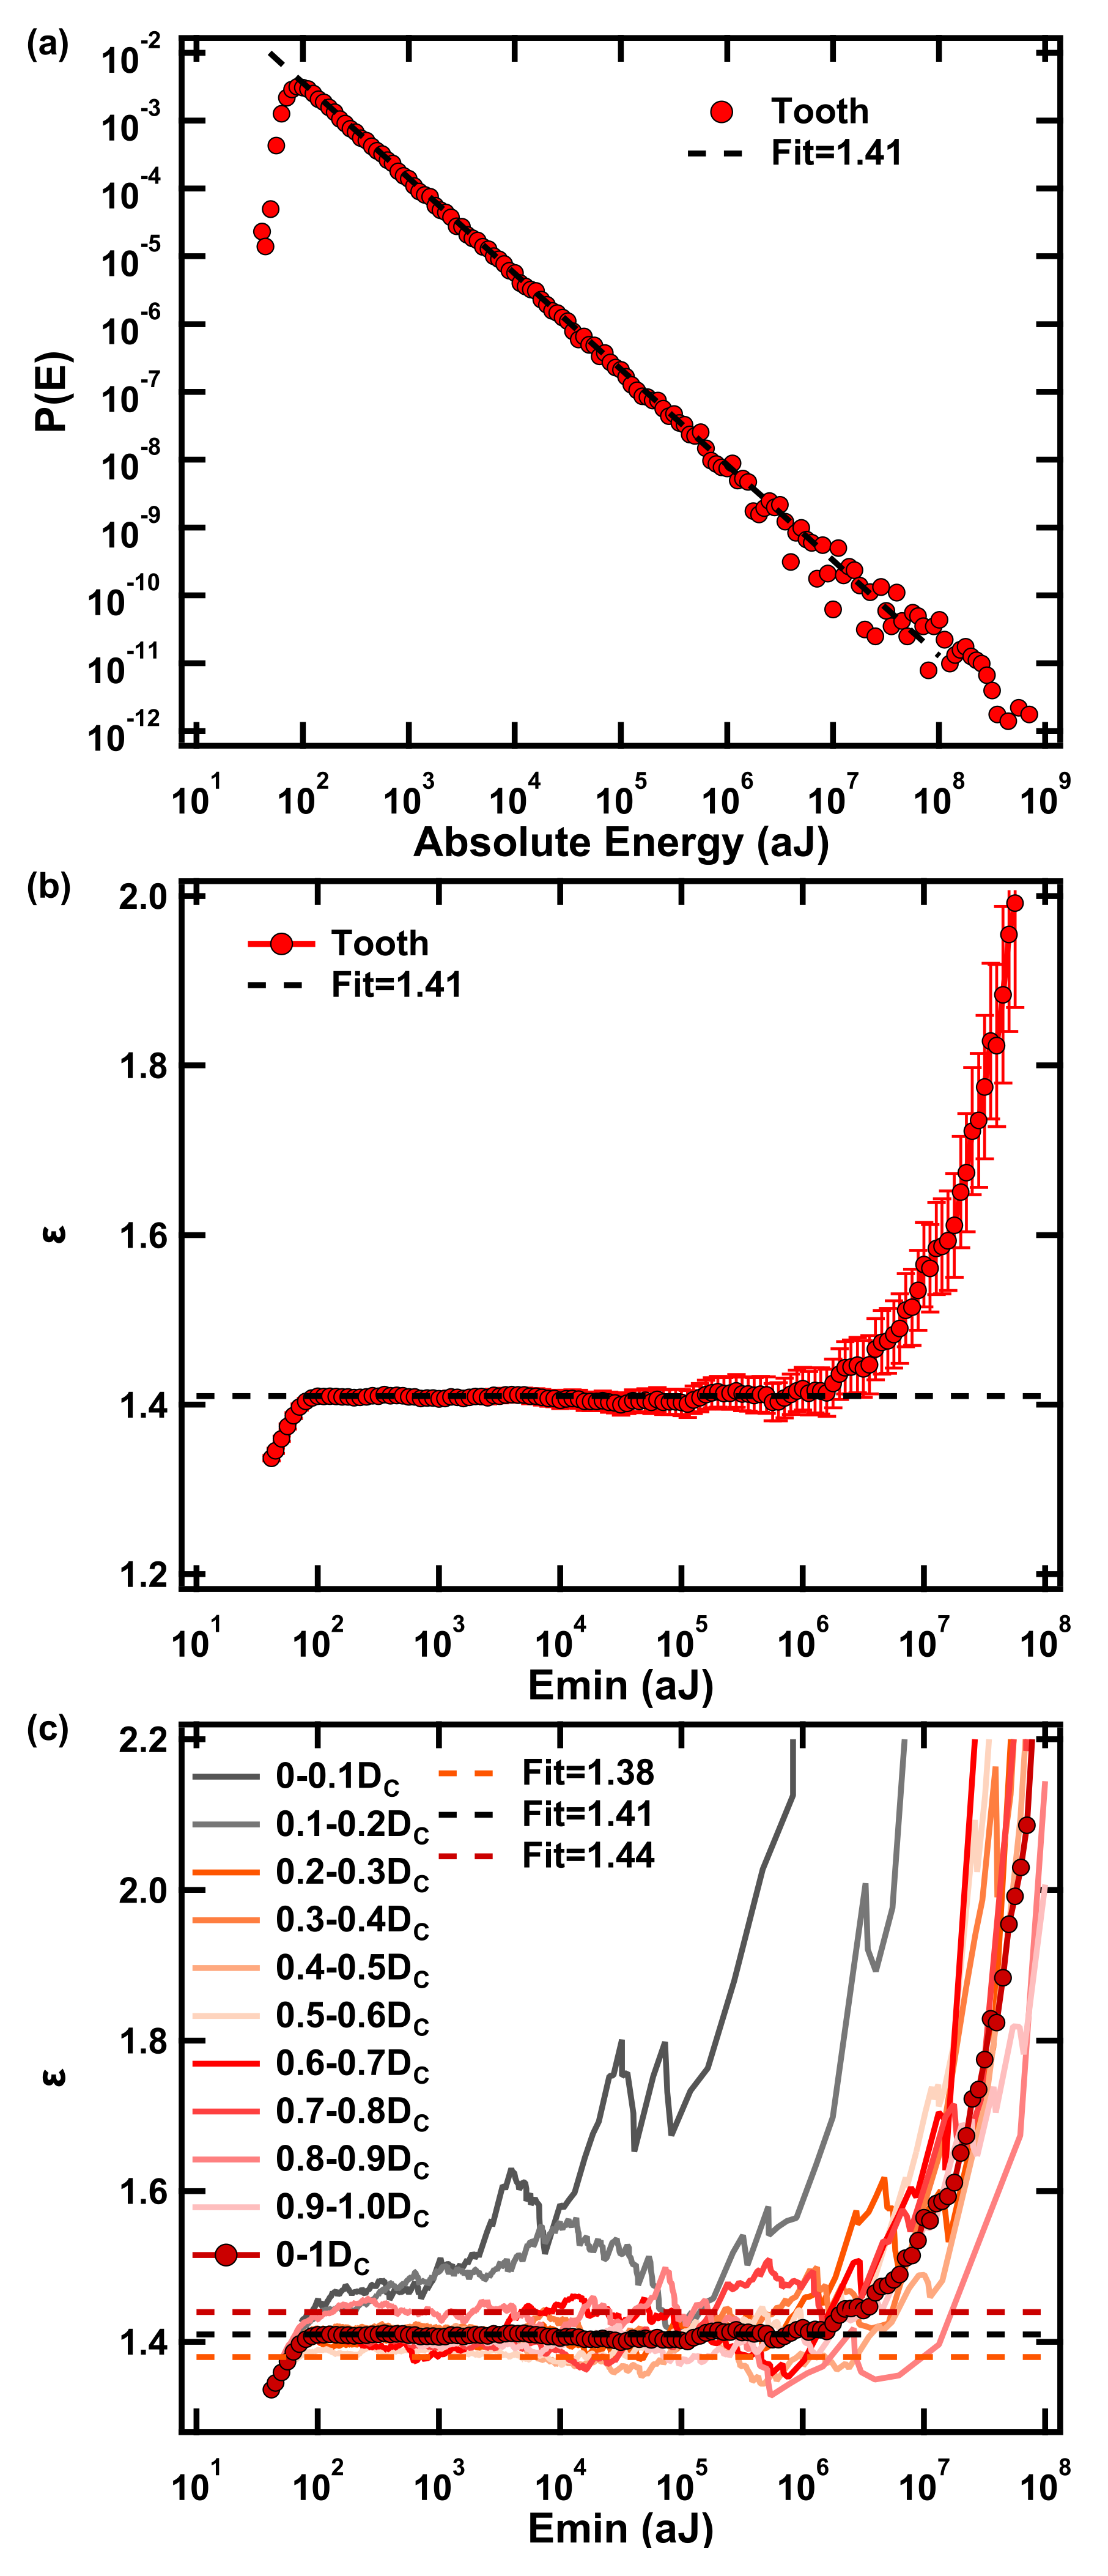
78]. Human teeth are composed of hydroxyapatite from a nanometer to a micrometer scale and are typically brittle. Cracks progresses through the tooth dentin pores, and exhibit abundant microstructures such as crack bridging, crack deflection and crack bifurcation. This complex crack evolution leads to avalanche dynamics. The stress–strain curve is a typically serrated with clustering of the acoustic emission signal. The absolute energy of AE meets the power-law distribution over nearly seven energy decades with a power-law exponent ε = 1.4,
Figure 10. The statistical distributions of signal amplitudes, durations, correlations between energies and amplitudes, and the relationship between amplitude and duration all meet the prediction of mean field theory very well. These avalanche signals do not appear when the tooth is undamaged so that the acoustic emission method is a warning of developing microcracks in teeth.
5.3. Sandstone Creep
When a constant force is applied to a material it still transforms via creep. Even if the applied force is lower than the ultimate strength of the material, the material will still fail after long-term damage accumulation. Creep is predominant in geotechnical and geological engineering, so it is necessary to monitor creep and predict disaster accumulation over time. According to the creep failure experiment of sandstone [
79], it is found that the acoustic emission signal is weaker in the stable creep stage than under constant strain rates. When the failure is approaching collapse, the AE signal of creep shows a series of activity periods (
Figure 11), which is different from the AE signal of increasing uniaxial compression. The probability density distribution of AE in the first few cycles has a high critical exponent value of ε = 1.6–1.7, while the final failure shows a fracture exponent of ε = 1.4. This creep results are consistent with fiber bundle simulations [
80,
81].
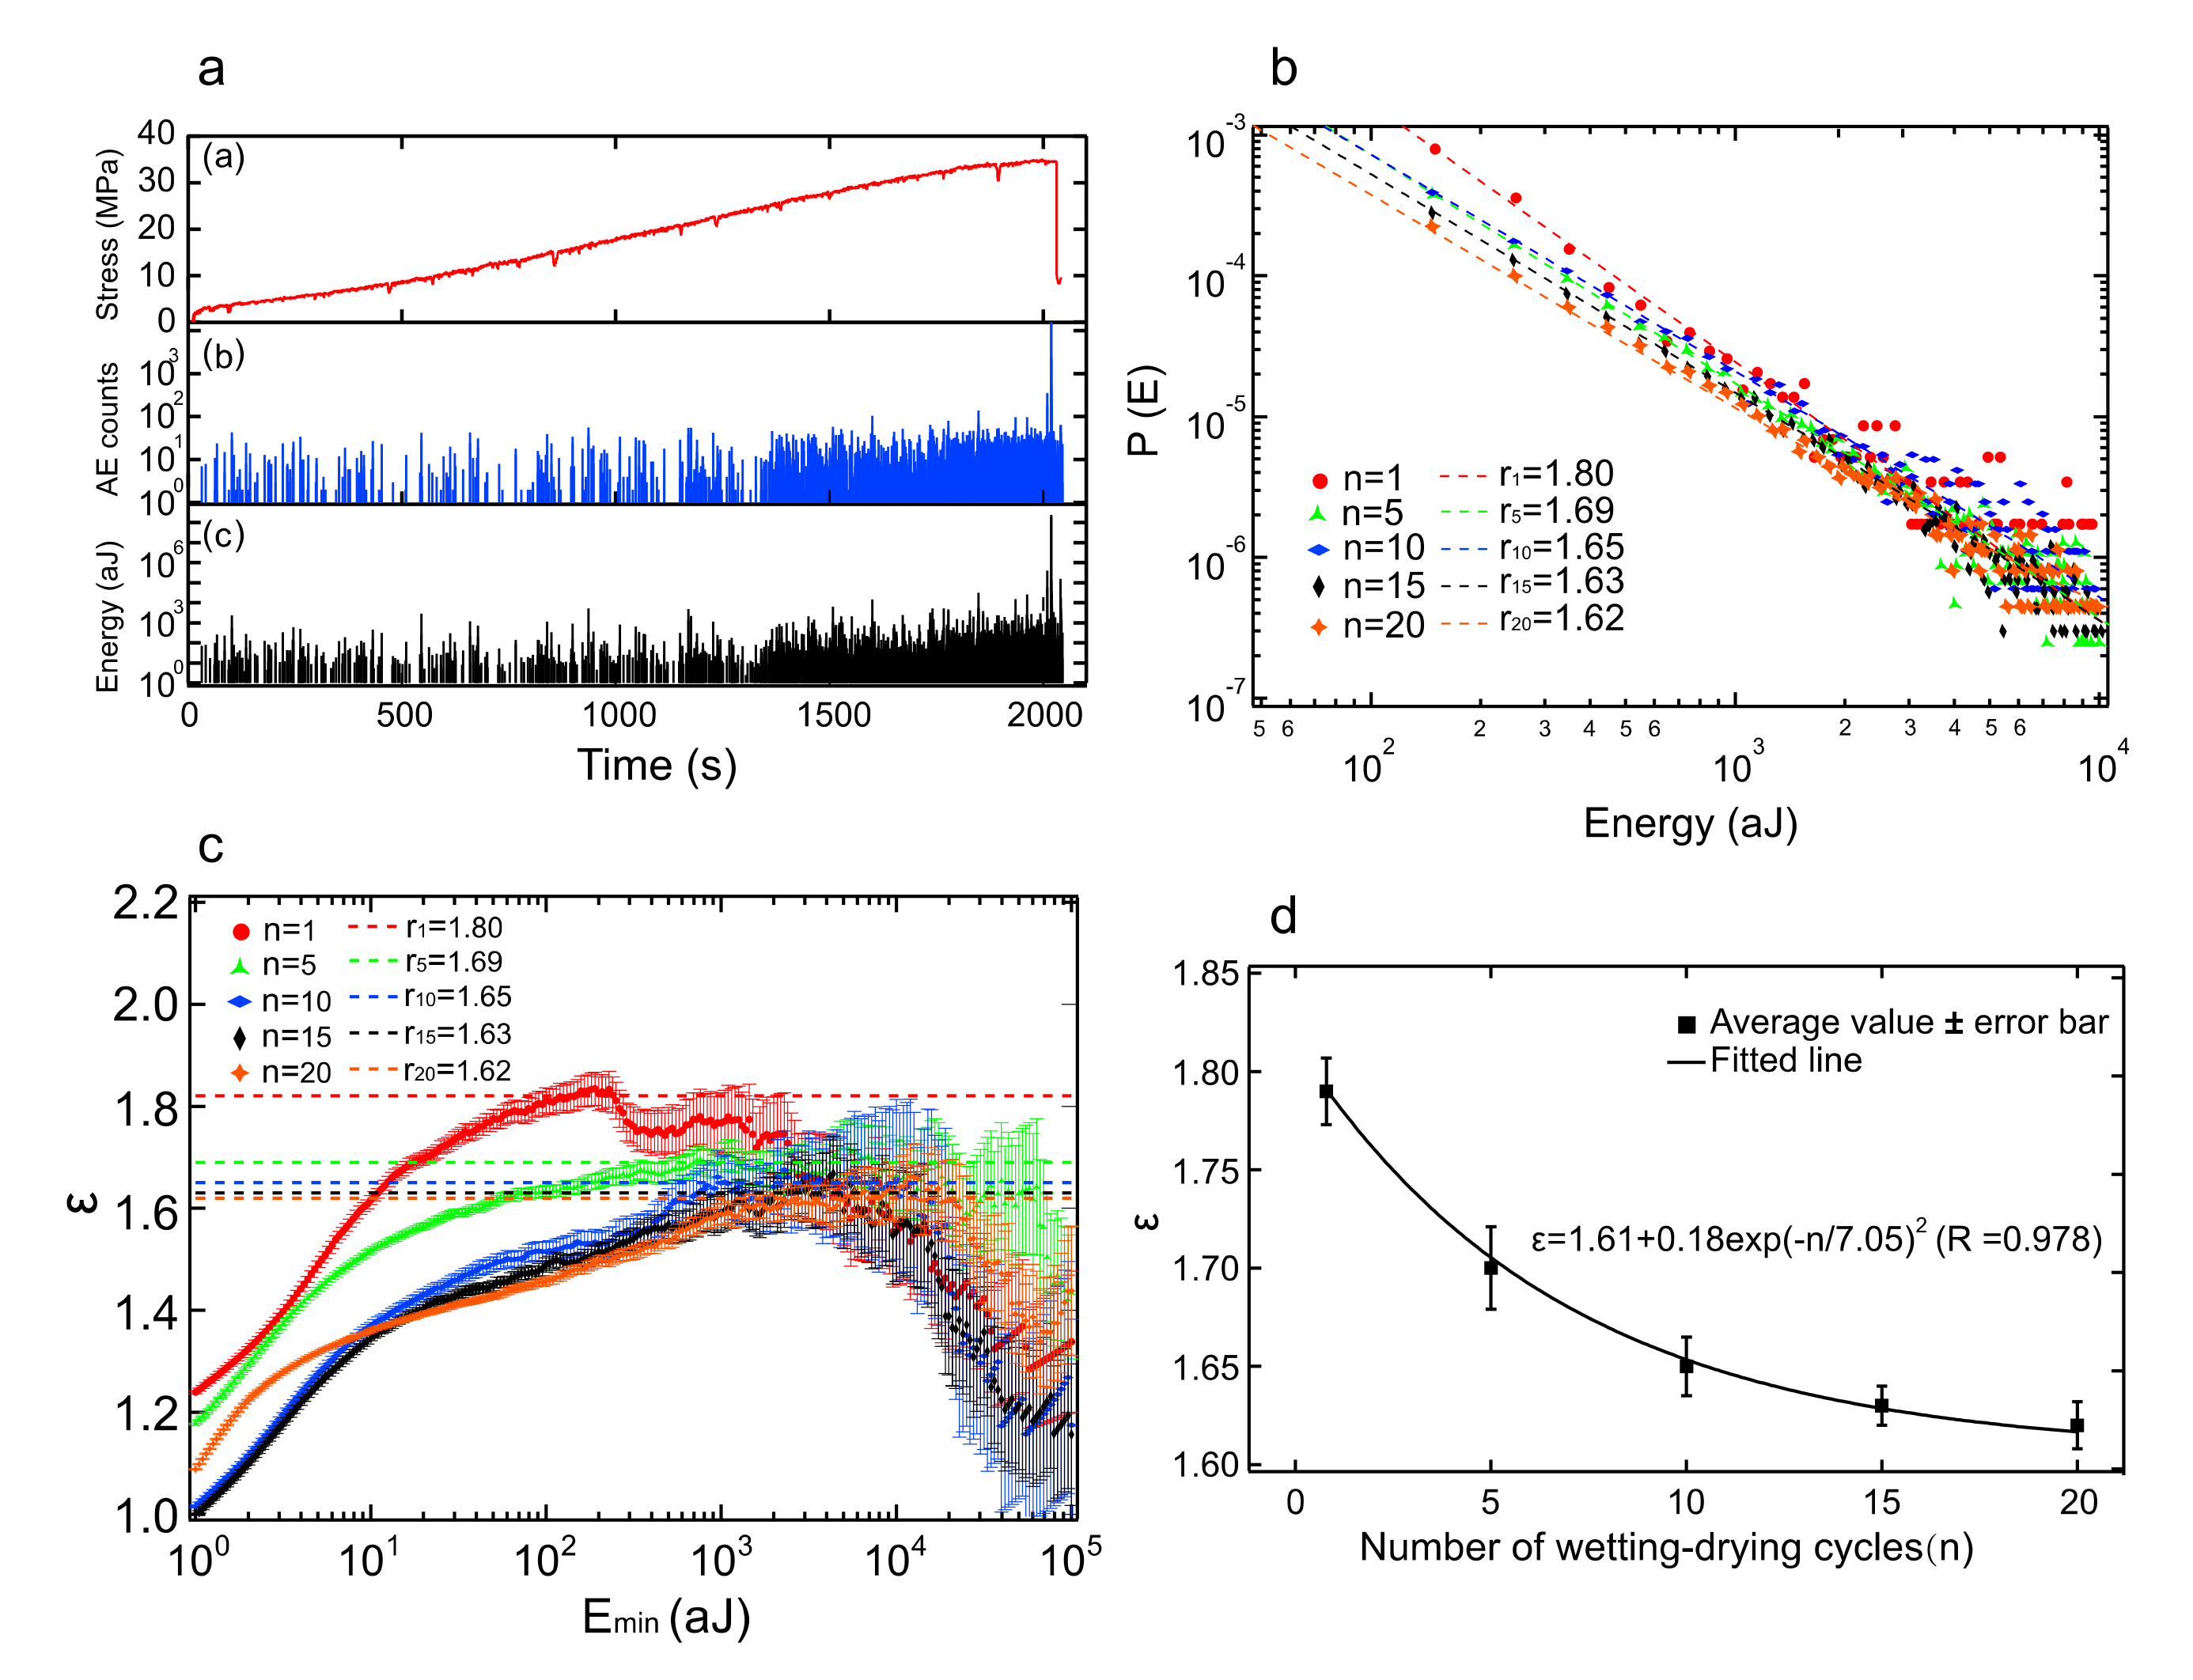
5.4. Damage of Wetting–Drying Cycles in Sandstone
Periodic changes of water levels in reservoirs causes wet cycle damage of reservoir rocks. The Three Gorges Reservoir was formed by the construction of China’s Three Gorges Dam, the world’s largest water conservancy project, which contains changes of water levels by nearly 30 m. Xie et al. used the typical sandstone in the Three Gorges Reservoir Area to measure acoustic emission and nuclear magnetic resonance images to study the dry–wet cycle damage [
82]. The internal damage of sandstone caused by dry–wet cycles is best seen by nuclear magnetic imaging. The detailed relation between the AE energy distribution exponent and the number of wetting–drying cycles is shown in
Figure 12, and the exponent values decreased in an exponential fashion towards the mean field value of 1.6.
5.5. Avalanches in Sugar Lumps
Sugar is a highly controversial additive to both coffee and tea and is perhaps one of the most contentious topics amongst academics. Sugar today is commonly produced from sugarcane. The sugar production process involves the separation of sucrose from these other nonsugars from the sugarcane, with a final purity of 99.9%. To obtain the classical cube shape, water is added to the granules, and the mixture is pressed into a mold. When the water is mixed into the granules, there is a partial dissolution on the surface of each granule, which results in pseudo-necking, and inter-granular bonding. Cubes are dried, and the inter-granular bonding is cemented in space.
Tate & Lyle sugar cubes (Tate & Lyle PLC, 1 Kingsway, London WC2B 6AT, UK) were measured, with an average dimension of 14.8 mm × 14.8 mm × 17.2 mm, as produced. A sugar cube was selected and prepared by slicing the original cube into a 3 mm × 4.5 mm × 6.25 mm rectangular prism using a scalpel, followed by polishing each face using sandpaper. The acoustic emission spectra were recorded with a threshold of 23.6 dB. The jerk spectrum is shown in
Figure 13a.
After the crushing of the sugar sample, the resultant grain size distribution was relatively narrow, ranging from 0.2 mm to 0.5 mm. The resultant spectrum showed power-law distributions over six decades, roughly consistent with the predictions from mean field theory with a power law exponent, ε = 1.47 shown in
Figure 13b. The microstructure of sugar lumps is very similar to bioconsolidated materials and sandstones. In each case larger grains are connected by some cement. The specific feature of sugar lumps is that the cement and the grains are the same materials, namely sugar, while the other materials have different cementation from the grain material. The avalanche exponents are nevertheless almost identical (near ε = 1.5).
6. Supplementary Discussion on Båth’s Law
We now discuss some aspects of the Båth’s law, which is sometimes used in AE analysis. As an average for shallow shocks it has been postulated that: Ms-M
AS* = 1.2, where Ms is the magnitude of main shock, and M
AS* is the magnitude of the largest aftershock [
83].
Båth’s law has been studied in previous coal, sandstone, teeth, Vycor glass, and biocemented sands compression acoustic emission tests [
54,
78,
79], but after carefully calculation code checking, we found that there was an error in the calculation of Båth’s law. The method of selecting aftershocks in these previous studies [
54,
78,
79] is to start from the defined main shock and compare the energy values between the subsequent signals and the main shock one by one along the time axis until a signal cut-off point larger than the main shock is found, and a new signal sequence is formed. The largest AE signal in this sequence is defined as the largest aftershock. The correct definition of relative magnitude should be ΔM = log
10(E
MS/E
AS*), but the calculation code is incorrectly written as ΔM = log
10(E
MS)/log
10(E
AS*), E
MS and E
AS* are the energy of main shock and the largest aftershock normalized by 1 aJ which is approximately the minimum detectable energy.
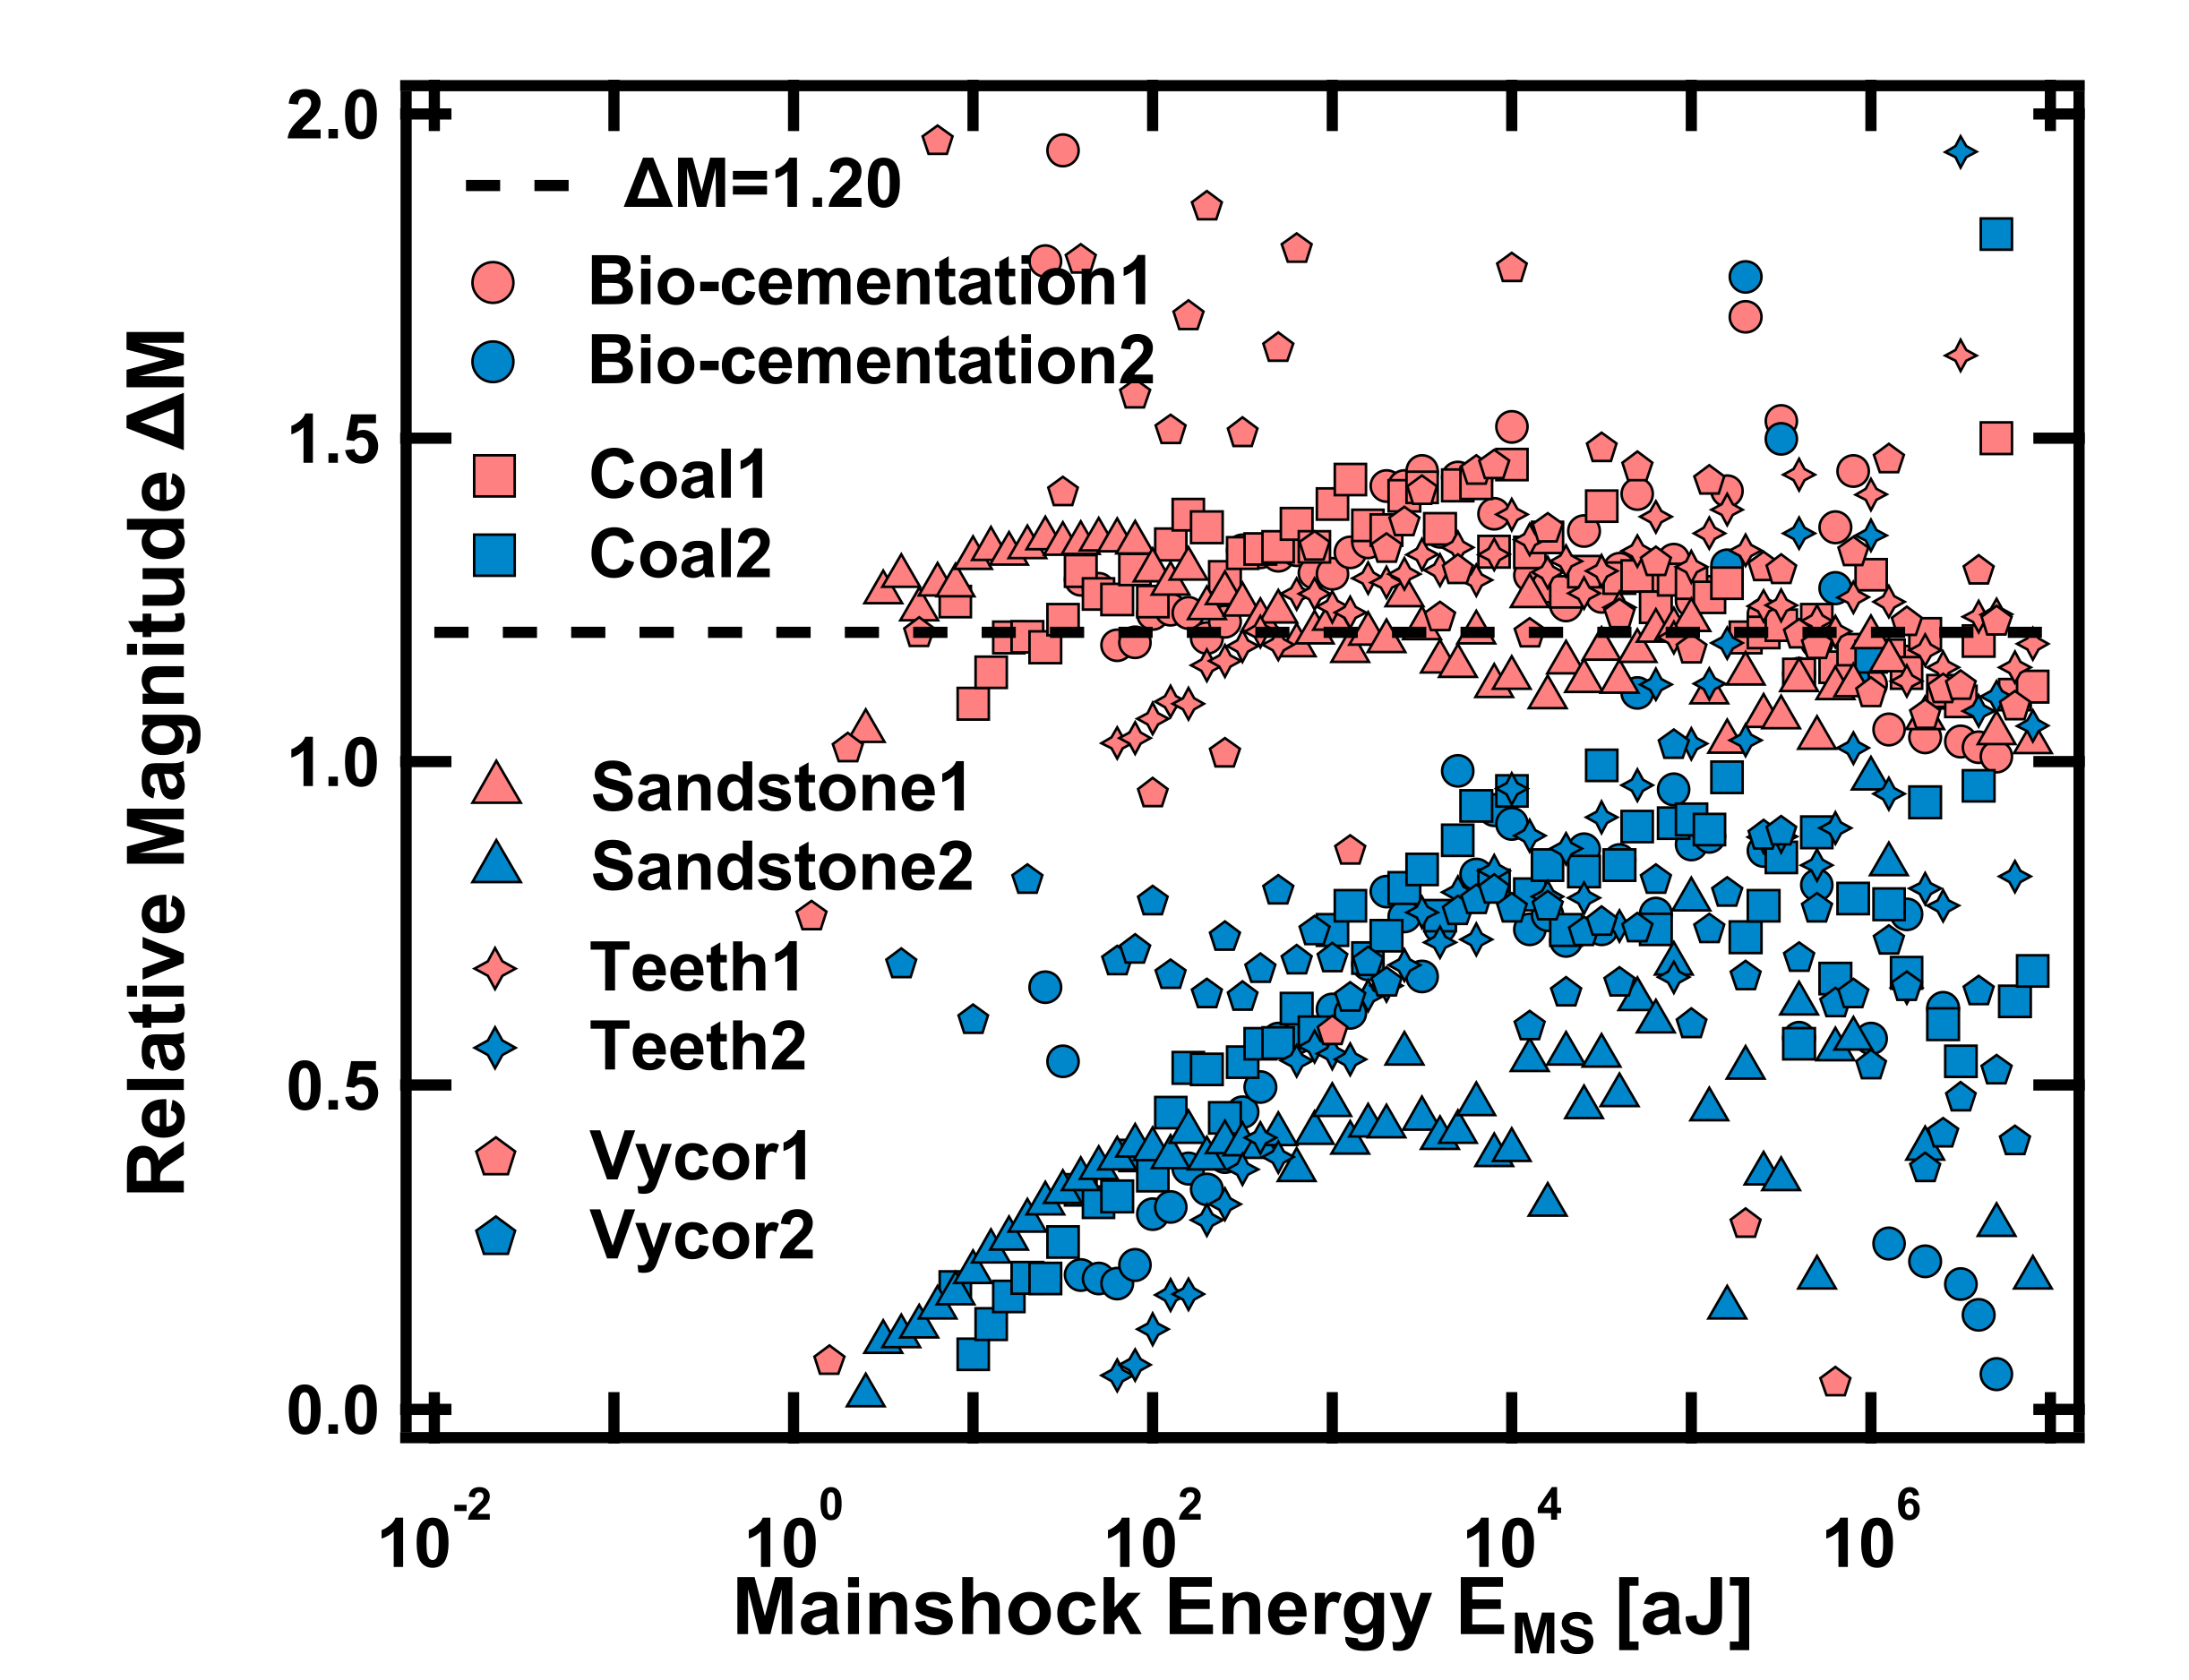
Figure 14 shows the comparison results of Båth’s law of different samples calculated by two formulas. Blue is the correct Båth’s law result and red is the ratio result of the incorrect calculation. There are three points to be pointed out. First, why does the correct Båth’s law formula not yield a result of 1.2? Secondly, the results of Båth’s law indicate that the relationship between the main shock and the largest aftershock is independent of the magnitude of the main shock, but the results of
Figure 14 show that the Båth’s law analysis does not show a constant index in the low energy range. Thirdly, why does the wrong formula achieve better results than the correct one and what does it represent? These problems may be caused by the choice of the largest aftershock. The influence of time is not considered in this selection scheme, which may lead to the result that the so-called largest aftershock may be far away from the main shock: and indeed, the so-called ‘largest aftershock’ is registered as an independent event rather than as an aftershock. Its energy is not different from the previous main shock, which results in the small relative magnitude of the aftershock. This effect is more obvious in the low energy range because of the limited statistics of the potential aftershocks. Therefore, it is very important to improve the way to select the relevant aftershock to correctly analyze Båth’s law in acoustic emission tests. We are conducting further work to combine information from Omori’s law and the Båth’s law to explore whether a better analysis of aftershocks is possible.
7. Conclusions
The anisotropy and heterogeneity of materials lead to the typical avalanche phenomenon in the failure process. This rapid discontinuous stepwise evolution of internal strain fields can be effectively captured by acoustic emission technology. The acoustic emission signal parameters, including acoustic emission energy, amplitude, and duration, follow power-law distributions. The power-law distribution is the only functional relationship with scale invariance, which means that avalanches satisfy the same statistical distribution and the same physical mechanism on different scales.
A very important aspect of the study of material damage is the development of early warning systems for disaster processes. The AE energy distribution exponent reflects the correlation effects near failure points during material deformation. With the increase in damage, the damage mechanism evolves from random failure points (e.g., point defects) to defect aggregation. This effect is accompanied by a decrease in the AE energy exponent. This reduction of the power-law exponent is best observed by analyzing the superjerk events in the acoustic emission spectrum. This has already been used in early warning systems for catastrophic failure.
In the typical scenario that more than one power-law mechanism exists with several interacting power-law mechanisms, the composite probability density function is no longer a straight line in double logarithmic representation but shows some curvature. The recommended method to analyze these distributions is the maximum likelihood (ML) method, to estimate the respective exponent values of the two power laws and the proportion of their mixing.
We reviewed the acoustic emissions of common materials such as sandstone, coal, calcium carbonate sands, and sugar. While the avalanche characteristics are now well established there is still work to be done. One is to optimize the search process of aftershock sequences. Others involve applications such as pico-seismology in bore holes to assess the geological configuration and the stability of a well. How can we make the effective early warning and prevention of geological disasters possible? The challenge of separating the main action mechanism from the mixed mechanisms and carrying out grouting or anchoring for the shear or friction mechanism of the fault or crack remains unsolved. In the fields of materials sciences, physics and chemistry, AE spectroscopy is already used to optimize materials such as better alloys from space crafts to bicycles, and to assess the frequency range of ferroic modulators and switches in the gigacycle regime.
Funding
This research was funded by EPSRC (No. EP/P024904/1), the EU’s Horizon 2020 programme under the Marie Skłodowska-Curie grant agreement No 861153, the financial support from the Natural Science Foundation of China (No. 51908088), and the Natural Science Foundation of Chongqing (cstc2019jcyj-xfkxX0001).
Institutional Review Board Statement
Not applicable.
Informed Consent Statement
Not applicable.
Data Availability Statement
Data will be made available under reasonable request.
Conflicts of Interest
The authors declare no conflict of interest.
References
- Ding, X.; Zhao, Z.; Lookman, T.; Saxena, A.; Salje, E.K.H. High junction and twin boundary densities in driven dynamical systems. Adv. Mater. 2012, 24, 5385–5389. [Google Scholar] [CrossRef]
- Chen, Y.; Ding, X.; Fang, D.; Sun, J.; Salje, E.K.H. Acoustic emission from porous collapse and moving dislocations in granular Mg-Ho alloys under compression and tension. Sci. Rep. 2019, 9, 1–12. [Google Scholar] [CrossRef] [PubMed]
- Salje, E.K.H.; Xue, D.; Ding, X.; Dahmen, K.A.; Scott, J.F. Ferroelectric switching and scale invariant avalanches in BaTiO3. Phys. Rev. Mater. 2019, 3, 014415. [Google Scholar] [CrossRef]
- Salje, E.K.H.; Li, S.; Stengel, M.; Gumbsch, P.; Ding, X. Flexoelectricity and the polarity of complex ferroelastic twin patterns. Phys. Rev. B 2016, 94, 024114. [Google Scholar] [CrossRef]
- Salje, E.K.; Soto-Parra, D.E.; Planes, A.; Vives, E.; Reinecker, M.; Schranz, W. Failure mechanism in porous materials under compression: Crackling noise in mesoporous SiO2. Philos. Mag. Lett. 2011, 91, 554–560. [Google Scholar] [CrossRef]
- Sethna, J.P.; Dahmen, K.A.; Myers, C.R. Crackling noise. Nature 2001, 410, 242. [Google Scholar] [CrossRef]
- Perković, O.; Dahmen, K.; Sethna, J.P. Avalanches, Barkhausen Noise, and Plain Old Criticality. Phys. Rev. Lett. 1995, 75, 4528–4531. [Google Scholar] [CrossRef]
- Dahmen, K.; Sethna, J.P. Hysteresis, avalanches, and disorder-induced critical scaling: A renormalization-group approach. Phys. Rev. B 1996, 53, 14872–14905. [Google Scholar] [CrossRef]
- Salje, E.; Dahmen, K.A. Crackling Noise in Disordered Materials. Annu. Rev. Condens. Matter Phys. 2014, 5, 233–254. [Google Scholar] [CrossRef]
- Salje, E.K.; Saxena, A.; Planes, A. Avalanches in Functional Materials and Geophysics; Springer: London, UK, 2017. [Google Scholar]
- Bak, P.; Christensen, K.; Danon, L.; Scanlon, T. Unified Scaling Law for Earthquakes. Phys. Rev. Lett. 2002, 88, 178501. [Google Scholar] [CrossRef]
- Kawamura, H.; Hatano, T.; Kato, N.; Biswas, S.; Chakrabarti, B.K. Statistical physics of fracture, friction, and earthquakes. Rev. Mod. Phys. 2012, 84, 839–884. [Google Scholar] [CrossRef]
- Preziosi, D.; Lopez-Mir, L.; Li, X.; Cornelissen, T.; Lee, J.H.; Trier, F.; Bouzehouane, K.; Valencia, S.; Gloter, A.; Barthélémy, A.; et al. Direct mapping of phase separation across the metal–insulator transition of NdNiO3. Nano Lett. 2018, 18, 2226–2232. [Google Scholar] [CrossRef]
- Yu, S.; Wu, Y.; Jeyasingh, R.; Kuzum, D.; Wong, H.-S.P. An electronic synapse device based on metal oxide resistive switching memory for neuromorphic computation. IEEE Trans. Electron Devices 2011, 58, 2729–2737. [Google Scholar] [CrossRef]
- Zhu, L.Q.; Wan, C.J.; Guo, L.Q.; Shi, Y.; Wan, Q. Artificial synapse network on inorganic proton conductor for neuromorphic systems. Nat. Commun. 2014, 5, 1–7. [Google Scholar] [CrossRef]
- Cocchi, L.; Gollo, L.L.; Zalesky, A.; Breakspear, M. Criticality in the brain: A synthesis of neurobiology, models and cognition. Prog. Neurobiol. 2017, 158, 132–152. [Google Scholar] [CrossRef]
- Pajevic, S.; Plenz, D. Efficient Network Reconstruction from Dynamical Cascades Identifies Small-World Topology of Neuronal Avalanches. PLoS Comput. Biol. 2009, 5, e1000271. [Google Scholar] [CrossRef]
- Harrison, R.; Dunin-Borkowski, R.; Putnis, A. Direct imaging of nanoscale magnetic interactions in minerals. Proc. Natl. Acad. Sci. USA 2002, 99, 16556–16561. [Google Scholar] [CrossRef]
- Robinson, P.; Harrison, R.J.; McEnroe, S.A.; Hargraves, R.B. Lamellar magnetism in the haematite–ilmenite series as an explanation for strong remanent magnetization. Nature 2002, 418, 517–520. [Google Scholar] [CrossRef]
- Roberts, A.P.; Hu, P.; Harrison, R.J.; Heslop, D.; Muxworthy, A.R.; Oda, H.; Sato, T.; Tauxe, L.; Zhao, X. Domain State Diagnosis in Rock Magnetism: Evaluation of Potential Alternatives to the Day Diagram. J. Geophys. Res. Solid Earth 2019, 124, 5286–5314. [Google Scholar] [CrossRef]
- Durin, G.; Zapperi, S. The Barkhausen effect. Physics 2006, 13, 461. [Google Scholar]
- Vives, E.; Ortin, J.; Manosa, L.; Rafols, I.; Perezmagrane, R.; Planes, A. Distributions of avalanches in martensitic transformations. Phys. Rev. Lett. 1994, 72, 1694. [Google Scholar] [CrossRef]
- Gallardo, M.C.; Manchado, J.; Romero, F.J.; del Cerro, J.; Salje, E.K.H.; Planes, A.; Vives, E.; Romero, R.; Stipcich, M. Avalanche criticality in the martensitic transition of Cu67.64Zn16.71Al15.65 shape-memory alloy: A calorimetric and acoustic emission study. Phys. Rev. B 2010, 81, 174102. [Google Scholar] [CrossRef]
- Weiss, J.; Richeton, T.; Louchet, F.; Chmelik, F.; Dobron, P.; Entemeyer, D.; Lebyodkin, M.; Lebedkina, T.; Fressengeas, C.; McDonald, R.J. Evidence for universal intermittent crystal plasticity from acoustic emission and high-resolution extensometry experiments. Phys. Rev. B 2007, 76, 224110. [Google Scholar] [CrossRef]
- Zapperi, S.; Vespignani, A.; Stanley, H.E. Plasticity and avalanche behaviour in microfracturing phenomena. Nature 1997, 388, 658–660. [Google Scholar] [CrossRef]
- Casals, B.; Nataf, G.F.; Pesquera, D.; Salje, E.K.H. Avalanches from charged domain wall motion in BaTiO3 during ferroelectric switching. APL Mater. 2020, 8, 5. [Google Scholar] [CrossRef]
- Casals, B.; van Dijken, S.; Herranz, G.; Salje, E.K.H. Electric-field-induced avalanches and glassiness of mobile ferroelastic twin domains in cryogenic SrTiO3. Phys. Rev. Res. 2019, 1, 032025. [Google Scholar] [CrossRef]
- Casals, B.; Nataf, G.; Salje, E. Avalanche criticality during ferroelectric/ferroelastic switching. Nat. Commun. 2021, 12, 1–7. [Google Scholar] [CrossRef]
- Salje, E.; Wruck, B. Specific-heat measurements and critical exponentsof the ferroelastic phase-transition in PB3(PO4)2 and PB3(P1-XASXO4)2. Phys. Rev. B 1983, 28, 6510. [Google Scholar] [CrossRef]
- Navas-Portella, V.; Corral, A.; Vives, E. Avalanches and force drops in displacement-driven compression of porous glasses. Phys. Rev. E 2016, 94, 033005. [Google Scholar] [CrossRef]
- Salje, E.K.H.; Dul’kin, E.; Roth, M. Acoustic emission during the ferroelectric transition Pm(3)over-barm to P4mm in BaTiO3 and the ferroelastic transition R(3)over-barm-C2/c in Pb3(PO4)2. Appl. Phys. Lett. 2015, 106, 152903. [Google Scholar] [CrossRef]
- Salje, E.K.H.; Lampronti, G.I.; Soto-Parra, D.E.; Baró, J.; Planes, A.; Vives, E. Noise of collapsing minerals: Predictability of the compressional failure in goethite mines. Am. Miner. 2013, 98, 609–615. [Google Scholar] [CrossRef]
- Salje, E.K.H.; Wang, X.; Ding, X.; Sun, J. Simulating acoustic emission: The noise of collapsing domains. Phys. Rev. B 2014, 90, 064103. [Google Scholar] [CrossRef]
- Zreihan, N.; Faran, E.; Vives, E.; Planes, A.; Shilo, D. Relations between stress drops and acoustic emission measured during mechanical loading. Phys. Rev. Mater. 2019, 3, 043603. [Google Scholar] [CrossRef]
- Casals, B.; Dahmen, K.A.; Gou, B.; Rooke, S.; Salje, E.K.H. The duration-energy-size enigma for acoustic emission. Sci. Rep. 2021, 11, 1–10. [Google Scholar] [CrossRef]
- Chi-Cong, V.; Weiss, J. Asymmetric damage avalanche shape in quasibrittle materials and subavalanche (aftershock) clusters. Phys. Rev. Lett. 2020, 125, 105502. [Google Scholar]
- Vu, C.-C.; Plé, O.; Weiss, J.; Amitrano, D. Revisiting the concept of characteristic compressive strength of concrete. Constr. Build. Mater. 2020, 263, 120126. [Google Scholar] [CrossRef]
- Yang, Y.; Li, S.; Ding, X.; Sun, J.; Weiss, J.; Salje, E.K. Twisting of pre-twinned α-Fe nanowires: From mild to wild avalanche dynamics. Acta Mater. 2020, 195, 50–58. [Google Scholar] [CrossRef]
- Kong, Q.; Allen, R.M.; Schreier, L.; Kwon, Y.-W. MyShake: A smartphone seismic network for earthquake early warning and beyond. Sci. Adv. 2016, 2, e1501055. [Google Scholar] [CrossRef]
- Kong, Q.; Trugman, D.T.; Ross, Z.E.; Bianco, M.J.; Meade, B.J.; Gerstoft, P. Machine Learning in Seismology: Turning Data into Insights. Seism. Res. Lett. 2018, 90, 3–14. [Google Scholar] [CrossRef]
- Li, Z.; Meier, M.-A.; Hauksson, E.; Zhan, Z.; Andrews, J. Machine Learning Seismic Wave Discrimination: Application to Earthquake Early Warning. Geophys. Res. Lett. 2018, 45, 4773–4779. [Google Scholar] [CrossRef]
- Ma, T.; Tang, C.; Tang, L.; Zhang, W.; Wang, L. Rockburst characteristics and microseismic monitoring of deep-buried tunnels for Jinping II Hydropower Station. Tunn. Undergr. Space Technol. 2015, 49, 345–368. [Google Scholar] [CrossRef]
- Ohnaka, M. GEOPHYSICS: Rupture in the Laboratory. Science 2004, 303, 1788–1789. [Google Scholar] [CrossRef]
- Hudson, J.A.; Crouch, S.L.; Fairhurst, C. Soft, stiff and servo-controlled testing machines: A review with reference to rock failure. Eng. Geol. 1972, 6, 155–189. [Google Scholar] [CrossRef]
- E Abercrombie, R.; Mori, J. Occurrence patterns of foreshocks to large earthquakes in the western United States. Nature 1996, 381, 303–307. [Google Scholar] [CrossRef]
- Herrmann, H.J.; Roux, S. Statistical Models for the Fracture of Disordered Media; Elsevier: Amsterdam, The Netherlands, 2014. [Google Scholar]
- Chakrabarti, B.K.; Benguigui, L.-G. Statistical Physics of Fracture and Breakdown in Disordered Systems; Oxford University Press: Oxford, UK, 1997; p. 55. [Google Scholar]
- Hansen, A.; Roux, S. Statistics toolbox for damage and fracture. In Damage and Fracture of Disordered Materials; Springer: Vienna, Austria, 2000. [Google Scholar]
- Baró, J.; Planes, A.; Salje, E.K.; Vives, E. Fracking and labquakes. Philos. Mag. 2016, 96, 3686–3696. [Google Scholar] [CrossRef]
- Nataf, G.F.; Castillo-Villa, P.O.; Baro, J.; Illa, X.; Vives, E.; Planes, A.; Salje, E.K.H. Avalanches in compressed porous SiO2-based materials. Phys. Rev. E 2014, 90, 022405. [Google Scholar]
- Nataf, G.F.; O Castillo-Villa, P.; Sellappan, P.; Kriven, W.M.; Vives, E.; Planes, A.; Salje, E.K.H. Predicting failure: Acoustic emission of berlinite under compression. J. Phys. Condens. Matter 2014, 26, 275401. [Google Scholar] [CrossRef]
- Castillo-Villa, P.; Baró, J.; Planes, A.; Salje, E.K.H.; Sellappan, P.; Kriven, W.M.; Vives, E. Crackling noise during failure of alumina under compression: The effect of porosity. J. Phys. Condens. Matter 2013, 25, 292202. [Google Scholar] [CrossRef]
- Baró, J.; Corral, A.; Illa, X.; Planes, A.; Salje, E.; Schranz, W.; Soto-Parra, D.E.; Vives, E. Statistical Similarity between the Compression of a Porous Material and Earthquakes. Phys. Rev. Lett. 2013, 110, 088702. [Google Scholar] [CrossRef]
- Jiang, X.; Jiang, D.; Chen, J.; Salje, E.K. Collapsing minerals: Crackling noise of sandstone and coal, and the predictability of mining accidents. Am. Miner. 2016, 101, 2751–2758. [Google Scholar] [CrossRef]
- Ribeiro, H.V.; Costa, L.S.; Alves, L.G.D.A.; Santoro, P.A.; Picoli, S.; Lenzi, E.; Mendes, R.S. Analogies between the cracking noise of ethanol-dampened charcoal and earthquakes. Phys. Rev. Lett. 2015, 115, 025503. [Google Scholar] [CrossRef]
- Kun, F.; Varga, I.; Lennartz-Sassinek, S.; Main, I.G. Approach to failure in porous granular materials under compression. Phys. Rev. E 2013, 88, 062207. [Google Scholar] [CrossRef]
- Kun, F.; Varga, I.; Lennartz-Sassinek, S.; Main, I.G. Rupture Cascades in a Discrete Element Model of a Porous Sedimentary Rock. Phys. Rev. Lett. 2014, 112, 065501. [Google Scholar] [CrossRef]
- Soto-Parra, D.E.; Zhang, X.; Cao, S.; Vives, E.; Salje, E.K.H.; Planes, A. Avalanches in compressed Ti-Ni shape-memory porous alloys: An acoustic emission study. Phys. Rev. E 2015, 91, 060401. [Google Scholar] [CrossRef]
- Jiang, X.; Liu, H.; Main, I.G.; Salje, E.K.H. Predicting mining collapse: Superjerks and the appearance of record-breaking events in coal as collapse precursors. Phys. Rev. E 2017, 96, 023004. [Google Scholar] [CrossRef]
- Wergen, G.; Krug, J. Record-breaking temperatures reveal a warming climate. EPL Europhys. Lett. 2010, 92, 30008. [Google Scholar] [CrossRef]
- Davidsen, J.; Grassberger, P.; Paczuski, M. Earthquake recurrence as a record breaking process. Geophys. Res. Lett. 2006, 33. [Google Scholar] [CrossRef]
- Davidsen, J.; Grassberger, P.; Paczuski, M. Networks of recurrent events, a theory of records, and an application to finding causal signatures in seismicity. Phys. Rev. E 2008, 77, 066104. [Google Scholar] [CrossRef] [PubMed]
- Kádár, V.; Pál, G.; Kun, F. Record statistics of bursts signals the onset of acceleration towards failure. Sci. Rep. 2020, 10, 1–12. [Google Scholar] [CrossRef] [PubMed]
- Baró, J.; Dahmen, K.A.; Davidsen, J.; Planes, A.; Castillo, P.O.; Nataf, G.F.; Salje, E.K.H.; Vives, E. Experimental Evidence of Accelerated Seismic Release without Critical Failure in Acoustic Emissions of Compressed Nanoporous Materials. Phys. Rev. Lett. 2018, 120, 245501. [Google Scholar] [CrossRef] [PubMed]
- Salje, E.K.H.; Zhang, H.; Idrissi, H.; Schryvers, D.; Carpenter, M.A.; Moya, X.; Planes, A. Mechanical resonance of the austenite/martensite interface and the pinning of the martensitic microstructures by dislocations in Cu74.08Al23.13Be2.79. Phys. Rev. B 2009, 80, 134114. [Google Scholar] [CrossRef]
- Salje, E.K.H.; Jiang, X. Crackling noise and avalanches in minerals. Phys. Chem. Miner. 2021, 48, 1–15. [Google Scholar] [CrossRef]
- Salje, E.K.H.; Planes, A.; Vives, E. Analysis of crackling noise using the maximum-likelihood method: Power-law mixing and exponential damping. Phys. Rev. E 2017, 96, 042122. [Google Scholar] [CrossRef]
- Bauke, H. Parameter estimation for power-law distributions by maximum likelihood methods. Eur. Phys. J. B 2007, 58, 167–173. [Google Scholar] [CrossRef]
- Clauset, A.; Shalizi, C.R.; Newman, M.E.J. Power-Law Distributions in Empirical Data. SIAM Rev. 2009, 51, 661–703. [Google Scholar] [CrossRef]
- Alava, M.J.; Nukala, P.K.V.V.; Zapperi, S. Statistical models of fracture. Adv. Phys. 2006, 55, 349–476. [Google Scholar] [CrossRef]
- Salje, E.K.H.; Liu, H.; Xiao, Y.; Jin, L.; Planes, A.; Vives, E.; Xie, K.; Jiang, X. Avalanche mixing and the simultaneous collapse of two media under uniaxial stress. Phys. Rev. E 2019, 99, 023002. [Google Scholar] [CrossRef]
- Xie, K.N.; Jiang, X.; Jiang, D.; Xiao, Y.; Chen, S.; Dahmen, K.A.; Vives, E.; Planes, A.; Salje, E.K. Change of crackling noise in granite by thermal damage: Monitoring nuclear waste deposits. Am. Miner. 2019, 104, 1578–1584. [Google Scholar] [CrossRef]
- Zhao, Y.F.; Liu, H.; Xie, K.; Salje, E.K.; Jiang, X. Avalanches in compressed sandstone: Crackling noise under confinement. Crystals 2019, 9, 582. [Google Scholar] [CrossRef]
- Chen, Y.; Gou, B.; Fu, W.; Chen, C.; Ding, X.; Sun, J.; Salje, E.K.H. Fine structures of acoustic emission spectra: How to separate dislocation movements and entanglements in 316L stainless steel. Appl. Phys. Lett. 2020, 117, 262901. [Google Scholar] [CrossRef]
- Terzis, D.; Laloui, L. 3-D micro-architecture and mechanical response of soil cemented via microbial-induced calcite precipitation. Sci. Rep. 2018, 8, 1416. [Google Scholar] [CrossRef]
- De Jong, J.T.; Soga, K.; Kavazanjian, E.; Burns, S.; van Paassen, L.; Al Quabany, A.; Aydilek, A.; Bang, S.; Burbank, M.; Caslake, L.; et al. Biogeochemical processes and geotechnical applications: Progress, opportunities and challenges. Geotechnique 2013, 63, 287–301. [Google Scholar] [CrossRef]
- Wang, L.; Jiang, X.; He, X.; Chu, J.; Xiao, Y.; Liu, H.; Salje, E.K. Crackling noise and bio-cementation. Eng. Fract. Mech. 2021, 247, 107675. [Google Scholar] [CrossRef]
- Wang, L.; Cao, S.; Jiang, X.; Salje, E.K.H. Cracking of human teeth: An avalanche and acoustic emission study. J. Mech. Behav. Biomed. Mater. 2021, 122, 104666. [Google Scholar] [CrossRef]
- Salje, E.K.H.; Liu, H.; Jin, L.; Jiang, D.; Xiao, Y.; Jiang, X. Intermittent flow under constant forcing: Acoustic emission from creep avalanches. Appl. Phys. Lett. 2018, 112, 054101. [Google Scholar] [CrossRef]
- Kun, F.; Halasz, Z.; Andrade, J.S., Jr.; Herrmann, H.J. Crackling noise in sub-critical fracture of heterogeneous materials. J. Stat. Mech. Theory Exp. 2009, 2009, P01021. [Google Scholar] [CrossRef]
- Halász, Z.; Danku, Z.; Kun, F. Competition of strength and stress disorder in creep rupture. Phys. Rev. E 2012, 85, 016116. [Google Scholar] [CrossRef]
- Xie, K.; Jiang, D.; Sun, Z.; Chen, J.; Zhang, W.; Jiang, X. NMR, MRI and AE Statistical Study of Damage due to a Low Number of Wetting–Drying Cycles in Sandstone from the Three Gorges Reservoir Area. Rock Mech. Rock Eng. 2018, 51, 3625–3634. [Google Scholar] [CrossRef]
- Båth, M. Lateral inhomogeneities of the upper mantle. Tectonophysics 1965, 2, 483–514. [Google Scholar] [CrossRef]
| Publisher’s Note: MDPI stays neutral with regard to jurisdictional claims in published maps and institutional affiliations. |
© 2021 by the authors. Licensee MDPI, Basel, Switzerland. This article is an open access article distributed under the terms and conditions of the Creative Commons Attribution (CC BY) license (https://creativecommons.org/licenses/by/4.0/).


