Abstract
The agricultural machinery is making a considerable negative contribution to the acceleration of global warming. In this study, we analyzed the impact of combine harvesters (CHs) on the global warming potential (GWP) by evaluating the telematics data from 67 CHs operating in Lithuania and Latvia between 2016 and 2020. This study examined the use of their technological operations and the associated impacts on ambient air and performed field tests using the same CH model to determine the composition of exhaust gases and the impact of different technological operations on GWP. The data confirmed the release of significant GWP during indirect operation, and it was estimated that considerable lengths of time were spent in idle (~20%) and transport (~13%) modes. During these operations, over 13% of the total GWP (~27.4 t year−1 per CH), affected by emissions, was released. It was calculated that a GWP reduction exceeding 1 t year−1 per machine can be achieved by optimizing the idling and transport operations. The dual telematics/field test data approach facilitates a comprehensive assessment of both the impact of CH exhaust gases on GWP and the methods for reducing the negative impact on the environment.
1. Introduction
One of today’s critical challenges is to meet the needs of a growing human population with limited resources, while prioritizing both global food security and sustainability (based on increasing crop yields) within the context of reducing environmental impacts [1]. Simultaneously, the potential for the efficient use of soil by future generations must be increased [2]. The urgent threat of climate change requires specific action, especially by the main emitters of greenhouse gases (GHGs), like agriculture, which is closely associated with environmental pollution. Agricultural activities are responsible for around 24% of GHGs [3], which often lead to water quality deterioration, wastage of water resources, and loss of biodiversity [4]. According to the latest Food and Agriculture Organization reports on agricultural GHG emissions, the world has almost doubled GHG in the last 50 years, and this amount could increase by another 30% by 2050 [5]. In terms of agricultural technologies, diesel fuels and fertilizers account for most of the energy consumed [6,7]; furthermore, fertilizers and pesticides have been identified among the most important secondary sources of CO2 emissions [8]. It is estimated that harvesting accounts for up to 30% of the total cost of using agricultural machinery. Reductions in fuel consumption, air pollution, and the associated costs incurred by farmers [9] can be realized by the optimization of work and the correct operation of combine harvesters (CHs). In 2017, the global agricultural sector produced CO2eq emissions of 11.1 gt year−1 [10], with Lithuania alone responsible for 4387.0 kt year−1 [11]. As an EU member state, Lithuania participates in the global climate change mitigation process, contributes to EU commitments, prepares national documents, participates in the formation of climate change policy, and is one of the 195 countries that have ratified the United Nations Framework Convention on Climate Change.
Rapidly increasing concentrations of atmospheric GHGs, including CO2, CH4, and N2O, are contributing to unprecedented changes in the earth’s atmosphere. Collectively, these three GHGs account for over 90% of anthropogenic global warming [12]. GWP is a widely used, convenient, and quantifiable measure of environmental impacts. Thus, this paper uses GWP as a clear indicator of the unified concept. It should be noted that the impact of CH exhaust gases on GWP is primarily influenced by the direct use of diesel fuel and its conversion to CO2 within internal combustion engines. Other emissions, including N2O and CH4, can be reduced by different engine technologies, (e.g., clean-up catalysts, NO control by selective catalytic reduction [13], and CO/HC emissions control by diesel oxidation catalysts), and a direct correlation has been noted between CO2 emissions and fuel consumption. In order to reduce engine emissions, the following engine improvement systems can also be useful: cylinder shut-off [14,15], start–stop [16,17], and speed reduction [18,19]. Emissions can also be reduced by switching to alternative fuels, such as compressed natural gas (LNG) and liquefied petroleum gas (LPG) [20], or by installing electric hybrid engines into the agricultural machinery [21,22,23]. However, overall, emissions can only be reduced if less fuel is used [24,25,26]. Other researchers are also looking at ways to reduce fuel consumption and air pollution when harvesting with CHs [27,28]. In their 2019 research, Špokas et al. revealed that leaving longer-length stubble in the field when harvesting is an acceptable way of reducing fuel consumption (and thus emissions) while preserving the driving speed. They achieved a reduction in hourly fuel consumption of 6.2 l h−1, which in turn resulted in 16.3 kg h−1 less CO2, by increasing the stubble height of oilseed rape from 0.2 to 0.4 m (equating to 7 t h−1 less stem mass being fed into the CH). However, research on the environmental impacts (in terms of GHGs or the GWP) of CHs is still lacking.
Thus, this study aimed to evaluate the GWP of the exhaust gases of CHs by assessing different technological operations and to identify methods for its reduction. We substantiate the benefits of the telematics data and field test data analysis method for a comprehensive economic and environmental assessment. We also propose an improved model of a continuous process to achieve economic and environmental goals, presented in a previously published article [29].
2. Data and Methods
2.1. Telematics Data Collection and Analysis
This study analyzed telematics data from CHs (one of the most popular models in the region with a tangential threshing apparatus) operating in Lithuania and Latvia between 2016 and 2020. Access to the relevant databases required a username and password. Such access was obtained from the manufacturer’s representative. In order to be able to objectively compare the telematics data with the data obtained during the field tests, a set of telematics data was selected only for CHs of the same model. In total, our filtering conditions were met by 67 different machines (from an array of 239 different machines). The information was then organized into a unified database to statistically process the collected data. In this study, the data for each individual machine for each year were downloaded to a personal computer; these were then imported into a data array for further processing. Only the information needed for the study was selected from the large telematics database, including working time and fuel consumption in different operational modes. A machine’s working time (h year−1) can be categorized as follows: idle with a partially full grain tank (T1), idle with a full grain tank (T2), unloading and not harvesting (T3), harvesting and unloading (T4), harvesting (T5), headland turn separator engaged (T6), transportation below 16 km h−1 (T7), and transportation above 16 km h−1 (T8). The categorizations for fuel consumption (l year−1) were as follows: idle with a partially full grain tank (F1), idle with full grain tank (F2), unloading and not harvesting (F3), harvesting and unloading (F4), harvesting (F5), headland turn separator engaged (F6), transportation below 16 km h−1 (F7), and transportation above 16 km h−1 (F8).
In the analysis, the T1 and T2 times were obtained during the CH’s idle mode, T7 and T8 were collected during the transport mode, and T3, T4, T5, and T6 were acquired during the CH’s working mode. Fuel consumption was calculated: F1 and F2 represent the fuel consumed at idling, F7 and F8 are the quantities of fuel consumed during the transport mode, and F3, F4, F5, and F6 represent the fuel consumed during direct work.
2.2. Calculation Methodology for Greenhouse Gases and Global Warming Potential
For the GHG and GWP calculations, this study converted the fuel consumption data from the telematics database from l year−1 and l h−1 to kg year−1 and kg h−1, respectively. A diesel fuel volume-to-mass conversion factor of 0.832 kg l−1 [30,31,32] was then employed.
The GHG emissions in the telematics data analysis were not measured directly but were assessed using the methodology outlined in Chapter 1.A.4 of the EMEP/EEA’s Air Pollutant Emission Inventory Guidebook [33]:
where E pollutant denotes the emission of a specified GHG (CO2, N2O, and CH4), FC fuel type denotes the fuel consumption, and EF pollutant denotes the emission factor of the pollutant (g t−1 or kg t−1) of the consumed diesel fuel (Table 1).
E pollutant = FC fuel type × EF pollutant,

Table 1.
Greenhouse gas (GHG) emission factors in agricultural transport using diesel fuel.
The GHG impact on GWP was estimated using Equation (2) [12,34,35,36,37]
GWP = ECO2 + 25 × ECH4 + 298 × EN2O.
The GWP in CO2 equivalents is such that 1 kg of CO2 equates to 1 kg of CO2eq, 1 kg of CH4 equals 25 kg of CO2eq, and 1 kg of N2O corresponds to 298 kg of CO2eq.
2.3. Field Test Measurement Device for CO2, O2, and NO
Concentrations of CO2, O2, and NO in the exhaust gases of the CHs during harvesting were analyzed using a hand-held AUTOplus 5-2 (Kane, Welwyn Garden, UK) gas analyzer, which has been used in previous research to analyze the emissions from mobile vehicles [38,39,40,41]. Table 2 provides the measurement range and resolution of the analyzer.
Table 2.
Measurement range of the individual components of exhaust gases.
At the time of the measurements, the analyzer had a valid calibration passport. Calibration was performed using a reference calibration gas. In the field tests, the measuring device was connected to the exhaust pipe via a flexible hose. After the speed (engine load factor) of the CH was modified, the exhaust gas composition was allowed to stabilize for 1 min. Then, 20 measurements were recorded, which were stored in the measuring device at 10 s intervals. The received data were then transferred to a personal computer via KANE LIVE software for further processing.
2.4. Combine Harvester and Test Site Specifications
In 2019 and 2020, field trials were conducted on the land of an agricultural company engaged in crop production. The Wideband Global SATCOM system field coordinates of the study site in 2019 and 2020 were 54.7970, 23.0079. The 2019 study used the winter wheat variety Ada for harvesting, whereas Balitus was used in 2020. Five samples were collected from 0.25 m2 areas in five randomly selected field locations to determine the weight of 1 m2 of the crop. The Ada variety weighed 1702.9 ± 209.1 g m−2 (grain moisture: 12.2% ± 1.1%), while the weight of the Balitus variety was 1370.2 ± 154.6 g m−2 (grain moisture: 13.5% ± 1.3%).
The wheat flow mass delivered to the CH was calculated using the following formula:
where q denotes the wheat mass fed to the CH (feed rate) in kg s−1, CS denotes the CH speed during harvesting in m s−1, HW denotes the CH header width in m, and WM denotes the mass of the wheat in 1 m2.
q = CS × HW × WM,
The same CH was used for the 2019 and 2020 field studies. There are already newer and higher environmental standards (i.e., Tier5) CHs. However, we chose to examine one of the most popular machines in the region at the moment. It should also be emphasized that the life cycle of a CH in the field is long, and this type of CH will work for many years to come. Table 3 presents the precise measurement specifications.
Table 3.
Combine harvester characteristics.
In the field tests for both years, fuel consumption and engine load of the CHs were recorded using data from the machines’ on-board computers. For each technological operation or change in harvesting speed, 10 on-board computers display values were recorded at equal 10 s intervals.
2.5. Statistical Analysis
The data were analyzed using Statistica 10.0 (TIBCO Software, Palo Alto, CA, USA) statistical software with a level of 0.05 as the significance criterion.
3. Results and Discussion
3.1. Results of the Telematics Data Analysis
Table 4 provides the summarized results of the telematics data analysis.
Table 4.
Combine harvester operating time structure and global warming potential (GWP) in various engine modes.
The study revealed the following key results:
- On average, each CH spent 68.2% ± 1.1% of its time in direct harvesting work between 2016 and 2020. Accordingly, in this mode, a GWP of 87.2% ± 0.7% was released into the environment via the exhaust gases. In the other modes (idle/transport), the emission of air pollutants occurred while the CH was engaged in indirect work. A similar value was calculated in previous studies and for other CH models [42].
- The maximum recorded engine operation time of a single CH per year (in all modes) was 1036.9 h year−1 with a minimum of 18.1 h year−1.
- The highest total annual GWP (in all modes) of a single CH was 94,262.7 kg year−1, while the lowest was 1974.7 kg year−1.
- Despite significant differences in absolute values between individual machines, the overall proportions of time spent engaged in direct work and in idle/transport modes were deemed comparable. The calculated correlation coefficient between the work (TW) and the idle (TI) modes was R2 = 0.88 (TW = 2.03TI + 72.87), whereas the coefficient between the work and the transport (TT) modes was R2 = 0.75 (TW = 4.73TT + 18.88). The calculated correlation coefficient between the GWP emitted in the work (FW) and idle (FI) modes was R2 = 0.81 (FW = 14.72FI + 6761.8), while the coefficient between the GWP emitted in the work and transport (FT) modes was R2 = 0.75 (FW = 8.61FT + 3961.1). These strong correlations indicate a stable relationship between the different modes (idle, transport, and work); however, they can also suggest that implementing changes to reduce both indirect working time and GWP emissions can be problematic.
The data analysis revealed the potential to reduce both the duration of indirect work and the associated negative environmental impacts. However, previous research has identified the influence of poorly organized work, inappropriate operator practices, and lack of knowledge and skills in the inefficient use of agricultural machinery [43,44].
3.2. Influence of Technological Operations on the Global Warming Potential in Idle, Transport, and Harvesting Modes
It can be concluded from the telematics data that during idling, the length of time spent in this mode (20.3%) and the GWP released (4.3%) account for fairly significant shares of the totals. By comparison, the idle time of other non-road machines can be between 20% and 70% [45,46,47]. The 2019 field tests explored the impact of fuel consumption on the GWP and the use of various technological operations at the idle speed of the CH engine. Figure 1 presents the obtained results.
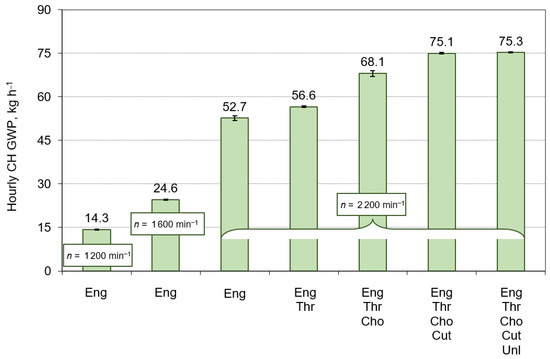
Figure 1.
Hourly global warming potential (GWP) of a combine harvester (CH) in idle mode engaging different operational units (Eng = engine, Thr = threshing unit, Cho = straw chopper unit, Cut = cutter bar unit, and Unl = grain unloading unit, where n = engine crankshaft speed) in the 2019 tests. The value of each column is derived from an average of 20 replicates.
These results confirm that engine speed had the most significant impact on the hourly GWP in idle mode. An increase in engine speed from 1200 to 2200 min−1 represented a very significant 2.7-fold increase in GWP emissions. However, other operations produced lower increases in GWP emissions, as follows:
- Cereal threshing unit: 7.5%
- Straw chopper unit: 20.3%
- Cutter bar unit: 10.2%
- Grain unloading unit: 0.3%
Generally, maximum reductions should be made in the duration of idling; however, where this is not possible, engine speed should be reduced, and unused technological operations should thus be terminated.
During the transport mode, the length of time and the GWP accounted for 13.2% and 8.8% of the totals, respectively. In 2019, the same field tests explored the relationships between engine speed, the use of technological operations, driving speed, and GWP. Figure 2 provides the obtained results.
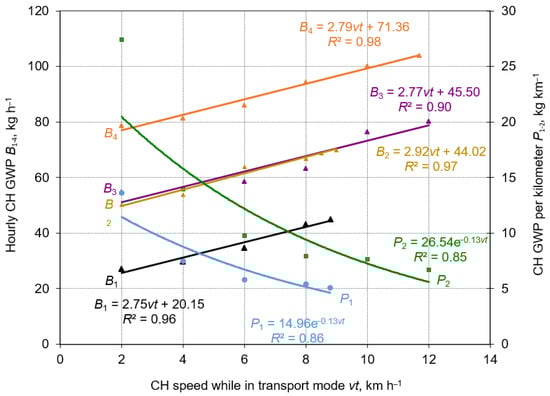
Figure 2.
Relations between combine harvester (CH) speed in transport mode and global warming potential (GWP) in the 2019 tests (stubble height, 15 cm; soil moisture, 16.2%): B1—All gears are switched off. Engine crankshaft speed n = 1690 min−1 B2—Gears engaged: header, threshing unit, and straw chopper. n = 1690 min−1 B3—All gears are switched off. n = 2340 min−1 B4—Gears are engaged: header, threshing unit, and straw chopper. n = 2200 min−1 P1—All gears are switched off. n = 1690 min−1 P2—All gears are switched off. n = 2340 min−1 The value of each point was obtained from an average of 20 replicates.
According to the outcomes of the 2019 field test study, the absolute numerical value of the GWP increased commensurately with driving speed, while the GWP per km was reduced. The graphs in Figure 2 indicate that when the CH moves between fields, it is preferable to terminate any technological operations, reduce the engine speed, and increase the driving speed.
The telematics data collected over a 5-year period from 67 CHs of the same model were compared with data from a specific CH obtained during field research. From the results given in Table 4 and Figure 1, the hourly GWP in idle mode can be potentially lower and equal to the 14.29 kg h−1 achieved during the tests, although an analysis of the 5-year data revealed the value to be 22.54 kg h−1. Considering that each CH spends an estimated average of 57.18 h year−1 in idle mode, a potential GWP reduction of 471.7 kg year−1 per machine is possible. This figure is even higher for the transport mode, for which the 5-year data provide an average hourly GWP of 63.84 kg h−1. Switching off all technological gears, reducing the engine speed to 1690 min−1, and driving at a speed of 8 km h−1 can achieve a GWP of 44.91 kg h−1 (Figure 2). The average time spent in the transport mode is 35.94 h year−1, which allows for a potential GWP reduction of 680.3 kg year−1. By optimizing the operation of CHs during their idling and transport modes, a potential GWP reduction of 1.15 t year−1 per machine is achievable. It should be stressed that reductions in GWP will not only produce positive environmental impacts but also have direct financial benefits for farmers.
The GWP per ton of wheat processed (Figure 3) was barely affected by changes to the speed of the threshing cylinder during threshing, particularly when the CH reached its optimal working speed (approx. 4–5 km h−1). At a harvesting speed of 1 km h−1 with threshing cylinder rotational speeds of 850 and 950 min−1, a 12.42% difference was noted in GWP. However, after reaching a maximum (and typical) harvesting speed of 5 km h−1, the GWP difference was 3.88%. A decrease in GWP per ton of wheat processed was realized by significantly increasing the running speed of the CH during harvesting; a comparison between running speeds of 1 and 5 km h−1 at a threshing cylinder speed of 950 min−1 resulted in a significant decrease in GWP by 60.08%. In fact, the driving speed during harvesting (or, more precisely, the supplied wheat crop flow in the threshing apparatus and the engine load) is the most important economic and environmental factor. If the selected driving speed is too low, the GWP per ton of raw material processed will be very high. Conversely, if the speed is too high (at the same time overloading the engine), we will lose part of the crop due to grain damage and grain separation losses. The latest CH models have built-in technologies that automatically select the driving speed (at the same time, the supplied crop in the threshing apparatus and the engine load) in order to achieve optimal fuel consumption and reduce the environmental impact. In our study, assessing these factors and making decisions depend on the CH driver. That is why it is important to research and publicize research results and properly educate CH drivers.
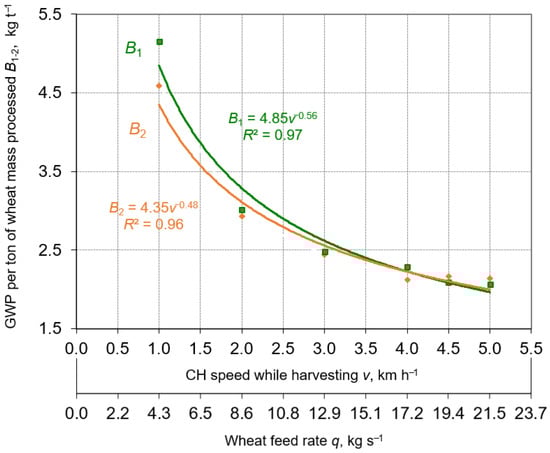
Figure 3.
Relation between combine harvester (CH) speed in harvesting mode and global warming potential (GWP) per ton of wheat mass processed in the 2019 tests (engine crankshaft speed n = 2200 min−1): B1—threshing cylinder rotational speed nt = 950 min−1 B2—nt = 850 min−1 The value of each point was obtained from an average of 20 replicates.
3.3. Link between Global Warming Potential in Threshing Mode and Exhaust Gas Concentrations and Engine Load
Figure 4 presents the results of the integrated field research conducted in 2020. The data show a connection between the GWP per ton of wheat processed, the exhaust gas content/concentration, the driving speed during harvesting, the feed rate, and the engine load factor. The most obvious result is that both NO content and CO2 concentration increased commensurately with harvesting speed (and thus engine load), while the concentration of O2 decreased. When comparing the values obtained at the slowest and fastest harvesting speeds (1 and 4.5 km h−1, respectively), the following differences are noted:
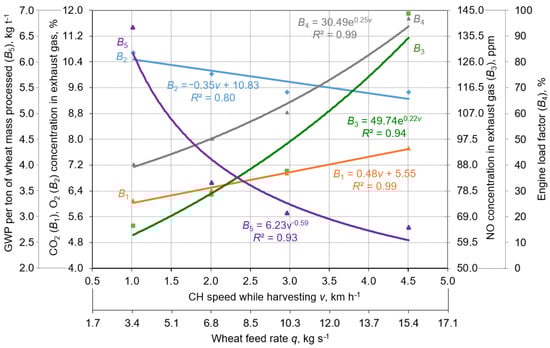
Figure 4.
Relationships between combine harvester (CH) speed, wheat feed rate, engine load factor, global warming potential (GWP) per ton of wheat mass processed, and exhaust gas concentrations during threshing in the 2020 tests. The value of each point was obtained from an average of 20 replicates.
- O2 concentration decreased by 23.4%
- CO2 concentration increased by 26.7%
- NO concentration increased by 118.9%
These variations are attributed to the fact that, as the speed of the CH increases, the amount of wheat flow per unit of time also increases. Simultaneously, there is an increase in engine load and corresponding rises in both gas compression and temperature inside the internal combustion engine’s cylinder. Increases also occur in the interactions between N, O, and C in both ambient air and diesel fuel. The consequences of heat and pressure cause O2 in the exhaust gases to decrease and CO2 and NO levels to rise [48].
Despite the research estimates indicating that the lowest GWP per ton of wheat processed during harvesting is achieved at top operational speeds (Figure 3 and Figure 4), there is no definitive conclusion or solution. Furthermore, when a CH reaches a certain critical speed during harvesting, there is an increase in both grain damage and grain separation losses [32]; therefore, other researchers indicate the need to include evaluations of both grain damage and grain loss [49]. Future research should investigate the determination of optimal harvesting speeds by comprehensively estimating GWP, grain damage, and grain losses.
After analyzing the accumulated multi-year telematics data and conducting field tests on a specific CH, we clearly see that there is potential for a more efficient use of the machine. We can propose a process that would allow continuous improvement to achieve economic and environmental goals (Figure 5). The proposed process has several scenarios and may include both machine data analysis with and without field testing to determine maximum measures to reduce fuel consumption, make optimal use of expensive agricultural machinery, and reduce GWP. The process offers the possibility of data analysis (only the data of a specific machine can be analyzed, or the whole array of machines of the same model can be compared), which shows the real situation in time and fuel consumption. The data obtained during the field tests are compared with the values recorded in the telematics system, and the possibilities of optimal work are analyzed. The analysis shall be followed by specific measures affecting economic and environmental factors, including, but not limited to, the training of CH operators, the regulation of machinery, and a better organization of ancillary transport.
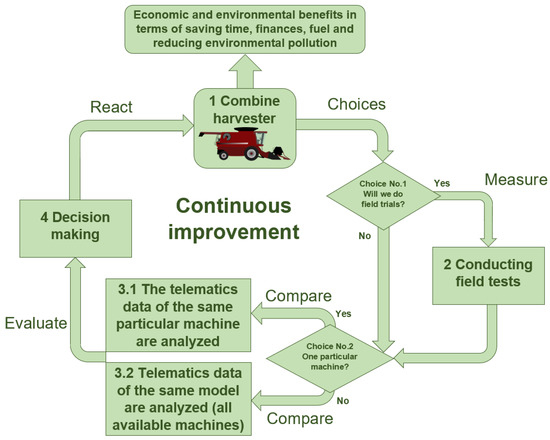
Figure 5.
Dual telematics/field test data analysis method process to reduce fuel consumption and environmental pollution.
4. Conclusions
During a CH’s relatively short annual operation (~282 h year−1), substantial quantities of GWP (~27 t year−1) are emitted. This study estimated the GWP released during the idle and transport modes to be significant (~1.2 and ~2.3 t year−1, respectively) and confirmed that GWP can be reduced by 32.9% during idling and transportation by decreasing engine speeds and disabling unnecessary process operations. Additionally, it was confirmed that increasing the driving speed during the transport mode produces a reduction in GWP per kilometer travelled; an increase in speed from 2 to 12 km h−1 can cause the GWP to decrease from 27.4 to 6.7 kg km−1. Furthermore, a fuel consumption–exhaust emission analysis revealed that the GWP per unit of wheat mass processed decreases significantly at higher harvesting speeds, and an estimated speed of ≥3 km h−1 with a wheat feed rate of at least 10 kg s−1 was proposed. It should be emphasized that driving speed, feed rate, and engine load during harvesting are the most important economic and environmental factors. Changes in the composition of exhaust gases are related directly to the driving speed during harvesting; the latter is also closely correlated with the load factor of the engine. This study also practically investigated the dependencies of changes in CO2 (6.1–7.7%) and NO concentrations (65–143 ppm) on engine load (which ranged between 40% and 96% during harvesting). As a result of the research, the authors propose a wider application of the dual telematics/field test data analysis method. It makes it possible to pursue both economic and environmental goals.
Author Contributions
D.S. (Dainius Savickas), D.S. (Dainius Steponavičius), L.Š., L.S., and M.S.; Conceptualization, D.S. (Dainius Savickas), D.S. (Dainius Steponavičius), L.Š, L.S., and M.S.; methodology, D.S. (Dainius Savickas) and D.S. (Dainius Steponavičius); software, D.S. (Dainius Savickas); validation, D.S. (Dainius Savickas) and D.S. (Dainius Steponavičius); formal analysis, D.S. (Dainius Savickas), D.S. (Dainius Steponavičius), L.S. and M.S.; investigation, D.S. (Dainius Savickas), D.S. (Dainius Steponavičius), and L.Š.; resources, D.S. (Dainius Savickas) and D.S. (Dainius Steponavičius); data curation, D.S. (Dainius Savickas), D.S. (Dainius Steponavičius), and L.Š.; writing—original draft preparation, D.S. (Dainius Savickas); writing—review and editing, D.S. (Dainius Savickas), D.S. (Dainius Steponavičius); visualization, D.S. (Dainius Savickas); supervision, D.S. (Dainius Steponavičius). All authors have read and agreed to the published version of the manuscript.
Funding
This research received no external funding.
Institutional Review Board Statement
Not applicable.
Informed Consent Statement
Not applicable.
Data Availability Statement
The data that support the findings of this study are available from the corresponding author, D. Savickas, upon reasonable request.
Conflicts of Interest
The authors declare no conflict of interest.
References
- O’Donoghue, C.; Chyzheuskaya, A.; Grealis, E.; Kilcline, K.; Finnegan, W.; Goggins, J.; Hynes, S.; Ryan, M. Measuring GHG Emissions across the Agri-Food Sector Value Chain: The Development of a Bioeconomy Input-Output Model. Int. J. Food Syst. Dyn. 2019, 10, 55–85. [Google Scholar] [CrossRef]
- Davis, K.F.; Gephart, J.A.; Emery, K.A.; Leach, A.M.; Galloway, J.N.; D’Odorico, P. Meeting Future Food Demand with Current Agricultural Resources. Glob. Environ. Chang. 2016, 39, 125–132. [Google Scholar] [CrossRef]
- Sykes, A.; Topp, C.; Rees, R. Modelling nutrient cycles in agriculture and their environmental impacts. In Assessing the Environmental Impact of Agriculture; Weidema, B., Ed.; Burleigh Dodds Science Publishing Limited: Series in Agricultural Science: Cambridge, UK, 2019; Volume 1, p. 69, ISBN 13: 9781786762283. [Google Scholar]
- Garnett, T. Where Are the Best Opportunities for Reducing Greenhouse Gas Emissions in the Food System (Including the Food Chain)? Food Policy 2011, 36, S23–S32. [Google Scholar] [CrossRef]
- Cordes, H.; Iriarte, A.; Villalobos, P. Evaluating the Carbon Footprint of Chilean Organic Blueberry Production. Int. J. Life Cycle Assess. 2016, 21, 281–292. [Google Scholar] [CrossRef]
- Šarauskis, E.; Masilionytė, L.; Juknevičius, D.; Buragienė, S.; Kriaučiūnienė, Z. Energy Use Efficiency, GHG Emissions, and Cost-Effectiveness of Organic and Sustainable Fertilisation. Energy 2019, 172, 1151–1160. [Google Scholar] [CrossRef]
- Hoffman, E.; Cavigelli, M.A.; Camargo, G.; Ryan, M.; Ackroyd, V.J.; Richard, T.L.; Mirsky, S. Energy Use and Greenhouse Gas Emissions in Organic and Conventional Grain Crop Production: Accounting for Nutrient Inflows. Agric. Syst. 2018, 162, 89–96. [Google Scholar] [CrossRef]
- Lal, R. Carbon Emission from Farm Operations. Environ. Int. 2004, 30, 981–990. [Google Scholar] [CrossRef]
- Sørensen, C.G. Workability and Machinery Sizing for Combine Harvesting. Agric. Eng. Int. CIGR J. Sci. Res. Dev. 2003, 5. PM 03.003. [Google Scholar]
- FAO. The Contribution of Agriculture to Greenhouse Gas Emissions. Available online: http://www.fao.org/resources/infographics/infographics-details/en/c/218650/ (accessed on 25 August 2021).
- Lithuania’s Greenhouse Gas Inventory Report 2020 Greenhouse Gas Emissions 1990–2018; Environmental Protection Agency: Vilnius, Lithuania, 2020; p. 567.
- Tian, H.; Chen, G.; Lu, C.; Xu, X.; Hayes, D.J.; Ren, W.; Pan, S.; Huntzinger, D.N.; Wofsy, S.C. North American Terrestrial CO2 Uptake Largely Offset by CH4 and N2O Emissions: Toward a Full Accounting of the Greenhouse Gas Budget. Clim. Chang. 2015, 129, 413–426. [Google Scholar] [CrossRef] [Green Version]
- Resitoglu, I.A.; Keskin, A.; Özarslan, H.; Bulut, H. Selective Catalytic Reduction of NOx Emissions by Hydrocarbons over Ag–Pt/Al2O3 Catalyst in Diesel Engine. Int. J. Environ. Sci. Technol. 2019, 16, 6959–6966. [Google Scholar] [CrossRef]
- Gutarevych, Y.; Mateichyk, V.; Matijošius, J.; Rimkus, A.; Gritsuk, I.; Syrota, O.; Shuba, Y. Improving Fuel Economy of Spark Ignition Engines Applying the Combined Method of Power Regulation. Energies 2020, 13, 1076. [Google Scholar] [CrossRef] [Green Version]
- Vopa, J.; Fridrichov, K.; Dlugo, J. Overview of the Potential and Limitations of Cylinder Deactivation. Renew. Sustain. Energy Rev. 2021, 146. [Google Scholar] [CrossRef]
- Lijewski, P.; Szymlet, N.; Fuć, P.; Domowicz, A.; Rymaniak, Ł. The Effect of Start-Stop Systems on Scooter Exhaust Emissions. Transp. Res. Part D Transp. Environ. 2021, 91. [Google Scholar] [CrossRef]
- Mueller, N.; Strauss, S.; Tumback, S.; Goh, G.-C.; Christ, A. Next Generation Engine Start/Stop Systems: “Free-Wheeling”. SAE Int. J. Engines 2011, 4, 874–887. [Google Scholar] [CrossRef]
- Warguła, Ł.; Krawiec, P.; Walus, K.J.; Kukla, M. Fuel Consumption Test Results for a Self-Adaptive, Maintenance-Freewood Chipper Drive Control System. Appl. Sci. 2020, 10, 2727. [Google Scholar] [CrossRef] [Green Version]
- Warguła, Ł.; Kukla, M.; Lijewski, P.; Dobrzynski, M.; Markiewicz, F. Influence of Innovative Woodchipper Speed Control Systems on Exhaust Gas Emissions and Fuel Consumption in Urban Areas. Energies 2020, 13, 3330. [Google Scholar] [CrossRef]
- Warguła, Ł.; Kukla, M.; Lijewski, P.; Dobrzyński, M.; Markiewicz, F. Impact of Compressed Natural Gas (CNG) Fuel Systems in Small Engine Wood Chippers on Exhaust Emissions and Fuel Consumption. Energies 2020, 13, 6709. [Google Scholar] [CrossRef]
- Qin, Z.; Luo, Y.; Li, K.; Peng, H. Optimal Design of a Novel Hybrid Electric Powertrain for Tracked Vehicles. Energies 2017, 10, 2141. [Google Scholar] [CrossRef] [Green Version]
- Troncon, D.; Alberti, L. Case of Study of the Electrification of a Tractor: Electric Motor Performance Requirements and Design. Energies 2020, 13, 2197. [Google Scholar] [CrossRef]
- Moreda, G.P.; Muñoz-García, M.A.; Barreiro, P. High Voltage Electrification of Tractor and Agricultural Machinery—A Review. Energy Convers. Manag. 2016, 115, 117–131. [Google Scholar] [CrossRef]
- Juostas, A.; Janulevičius, A. Tractor’s Engine Efficiency and Exhaust Emissions’ Research in Drilling Work. J. Environ. Eng. Landsc. Manag. 2014, 22, 141–150. [Google Scholar] [CrossRef] [Green Version]
- Fontaras, G.; Zacharof, N.G.; Ciuffo, B. Fuel Consumption and CO2 Emissions from Passenger Cars in Europe—Laboratory versus Real-World Emissions. Prog. Energy Combust. Sci. 2017, 60, 97–131. [Google Scholar] [CrossRef]
- Helmers, E.; Leitão, J.; Tietge, U.; Butler, T. CO2-Equivalent Emissions from European Passenger Vehicles in the Years 1995–2015 Based on Real-World Use: Assessing the Climate Benefit of the European “Diesel Boom”. Atmos. Environ. 2019, 198, 122–132. [Google Scholar] [CrossRef]
- Špokas, L.; Steponavičius, D. Fuel Consumption during Cereal and Rape Harvesting and Methods of Its Reduction. J. Food Agric. Environ. 2011, 9, 257–263. [Google Scholar]
- Milan, F.; Antonín, D.; Ivo, C.; Martin, F.; Petr, B. Harvest of Cereals and Oilseed Rape by Combine Harvesters New Holand CX 8090 and New Holand CR 9080. Poljopr. Teh. 2017, 42, 19–24. [Google Scholar]
- Savickas, D.; Steponavičius, D.; Domeika, R. Analysis of Telematics Data of Combine Harvesters and Evaluation of Potential to Reduce Environmental Pollution. Atmosphere 2021, 12, 674. [Google Scholar] [CrossRef]
- Pandian, A.K.; Ramakrishnan, R.B.B.; Devarajan, Y. Emission Analysis on the Effect of Nanoparticles on Neat Biodiesel in Unmodified Diesel Engine. Environ. Sci. Pollut. Res. 2017, 24, 23273–23278. [Google Scholar] [CrossRef]
- Chinnasamy, C.; Tamilselvam, P.; Ranjith, R. Influence of Aluminum Oxide Nanoparticle with Different Particle Sizes on the Working Attributes of Diesel Engine Fueled with Blends of Diesel and Waste Plastic Oil. Environ. Sci. Pollut. Res. 2019, 26, 29962–29977. [Google Scholar] [CrossRef]
- Špokas, L.; Steponavičius, D.; Žebrauskas, G.; Čiplienė, A.; Bauša, L. Reduction in Adverse Environmental Impacts Associated with the Operation of Combine Harvesters during the Harvesting of Winter Oilseed Rape. J. Environ. Eng. Landsc. Manag. 2019, 27, 72–81. [Google Scholar] [CrossRef]
- EMEP/EEA. Air Pollutant Emission Inventory Guidebook; European Environment Agency: Copenhagen, Denmark, 2019. Available online: https://www.eea.europa.eu/publications/emep-eea-guidebook-2019 (accessed on 23 August 2021).
- Sainju, U.M.; Barsotti, J.L.; Wang, J. Net Global Warming Potential and Greenhouse Gas Intensity Affected by Cropping Sequence and Nitrogen Fertilization. Soil Sci. Soc. Am. J. 2014, 78, 248–261. [Google Scholar] [CrossRef]
- Kliopova, I.; Staniškis, J.K.; Stunžėnas, E.; Jurovickaja, E. Bio-Nutrient Recycling with a Novel Integrated Biodegradable Waste Management System for Catering Companies. J. Clean. Prod. 2019, 209, 116–125. [Google Scholar] [CrossRef]
- Huang, R.; Liu, J.; He, X.; Xie, D.; Ni, J.; Xu, C.; Zhang, Y.; Ci, E.; Wang, Z.; Gao, M. Reduced Mineral Fertilization Coupled with Straw Return in Field Mesocosm Vegetable Cultivation Helps to Coordinate Greenhouse Gas Emissions and Vegetable Production. J. Soils Sediments 2020, 20, 1834–1845. [Google Scholar] [CrossRef]
- Azapagic, A.; Bore, J.; Cheserek, B.; Kamunya, S.; Elbehri, A. The Global Warming Potential of Production and Consumption of Kenyan Tea. J. Clean. Prod. 2016, 112, 4031–4040. [Google Scholar] [CrossRef]
- Rosdia, S.M.; Mamata, R.; Azri, A.; Sudhakar, K.; Yusri, I.M. Evaluation of Properties on Performance and Emission to Turbocharged SI Engine Using Fusel Oil Blend with Gasoline. IOP Conf. Ser. Mater. Sci. Eng. 2019, 469. [Google Scholar] [CrossRef] [Green Version]
- Sadhik Basha, J.; Al Balushi, M.; al Shibli, K.; Al Fazari, M.; Al Rumhi, S.; Al Mansouri, S.; Al Balushi, R. An Emission Control Strategy in a Low Capacity Single Cylinder Compression Ignition Engine Powered with Dee Blended Fuels. Mater. Sci. Energy Technol. 2020, 3, 770–779. [Google Scholar] [CrossRef]
- Daniyan, I.A.; Daniyan, O.L.; Adeodu, A.O.; Uchegbu, I.D.; Mpofu, K. Performance Evaluation of a Smart Multi Feedstock Biodiesel Plant. Procedia Manuf. 2019, 35, 1117–1122. [Google Scholar] [CrossRef]
- Awad, O.I.; Mamat, R.; Noor, M.M.; Yusop, F.; Yusri, I.M. The Impacts of Moisture Content on Performance and Emissions of a Four-Cylinder SI Engine Running with Fusel Oil—Gasoline Blends. WSEAS Trans. Environ. Dev. 2017, 13, 120–128. [Google Scholar]
- Savickas, D.; Steponavičius, D.; Kliopova, I.; Saldukaitė, L. Combine Harvester Fuel Consumption and Air Pollution Reduction. Water Air Soil Pollut. 2020, 231, 1–11. [Google Scholar] [CrossRef]
- Gasso, V.; Sørensen, C.A.G.; Oudshoorn, F.W.; Green, O. Controlled Traffic Farming: A Review of the Environmental Impacts. Eur. J. Agron. 2013, 48, 66–73. [Google Scholar] [CrossRef]
- Tihanov, G. Study on the Duration of Operations Perfomed by Transport Vehicles during Unloading of the Grain Harvester Hopper. Appl. Res. Tech. Technol. Educ. 2018, 6, 232–236. [Google Scholar] [CrossRef]
- McEwan, A.; Brink, M.; Spinelli, R. Efficiency of Different Machine Layouts for Chain Flail Delimbing, Debarking and Chipping. Forests 2019, 10, 126. [Google Scholar] [CrossRef] [Green Version]
- Wargula, L.; Kukla, M.; Krawiec, P.; Wieczorek, B. Impact of Number of Operators and Distance to Branch Piles on Woodchipper Operation. Forests 2020, 11, 598. [Google Scholar] [CrossRef]
- Spinelli, R.; Visser, R.J.M. Analyzing and Estimating Delays in Wood Chipping Operations. Biomass Bioenergy 2009, 33, 429–433. [Google Scholar] [CrossRef]
- Sindhu, R.; Amba Prasad Rao, G.; Madhu Murthy, K. Effective Reduction of NOx Emissions from Diesel Engine Using Split Injections. Alex. Eng. J. 2018, 57, 1379–1392. [Google Scholar] [CrossRef]
- Nik, M.A.E.; Khademolhosseini, N.; Abbaspour-Fard, M.H.; Mahdinia, A.; Alami-Saied, K. Optimum Utilisation of Low-Capacity Combine Harvesters in High-Yielding Wheat Farms Using Multi-Criteria Decision Making. Biosyst. Eng. 2009, 103, 382–388. [Google Scholar] [CrossRef]
Publisher’s Note: MDPI stays neutral with regard to jurisdictional claims in published maps and institutional affiliations. |
© 2021 by the authors. Licensee MDPI, Basel, Switzerland. This article is an open access article distributed under the terms and conditions of the Creative Commons Attribution (CC BY) license (https://creativecommons.org/licenses/by/4.0/).