1. Introduction
Most of the perishable food to be exported requires several transportation days to reach the destination. To preserve quality of the transported products, recommended environmental conditions are required [
1]. According to FAO (2019) [
2], 1.3 billion tons are annually wasted, corresponding to more than 30% of all the food produced, from which approximately 50% are fruit and vegetables. These data are unsustainable in our society and require an effort to minimize these extremely high food losses. New technologies such as Internet of Things (IoT) and artificial intelligence (AI) used during the postharvest supply chain would allow us to know more precisely where these losses occur and propose actions to minimize them [
3,
4,
5].
Temperature is the most important environmental factor to be preserved between certain recommended values during the postharvest stages [
6]. Many works have related the evolution of the temperature of the perishable commodities with the quality losses, obtaining representative models that allow for predicting the shelf life [
7,
8,
9,
10,
11]. Shelf life is the time in which a food product remains at high-quality standards while being microbiologically safe [
12]. These models allow for estimating commodities’ shelf life based on the temperature data recorded during the postharvest stages [
13]. Several suppliers provide devices able to record temperature data for a long time (months or years). Small card-shaped devices with USB connection are one of the most frequently used as temperature loggers during transport or other postharvest periods [
14,
15]. Other devices such as time temperature integrators (TTI) are also used to show temperature preservation during a certain period [
16]. Radio frequency identification (RFID) and IoT technologies, such as Bluetooth or NFC, are recently being used to distribute sensors inside pallets or cardboard boxes, making it possible to determine the temperature variation between different areas of the same load [
17], providing an either efficient or not pallet distribution [
18,
19] The time-temperature data registered by these portable and autonomous devices are downloaded at the destination for temperature abuse detection. A brief review is detailed in
Section 2.
Quality standards and consumer requirements, as well as the necessary guarantee by the transporter to ensure the correct logistical handling of the commodities, means that this sector demands precise, autonomous and flexible devices that are capable of data recording and real-time reporting those variables that influence the dynamic shelf life of a perishable product, as defined by postharvest technology. Even though the temperature is the main factor, other environmental variables such as relative humidity, luminosity, vibrations and physiological active gases such as oxygen (O
2), carbon dioxide (CO
2) and C
2H
4 (ethylene) influence the quality degradation processes, most of them resulted to maturation, so that their detection and control throughout the postharvest supply chain determines optimal preservation conditions [
20].
Wireless sensor network (WSN) platforms have been widely used in placements where a high density and an intelligent allocating of sensors is required for precision measurement [
21]. Areas such as precision agriculture [
22,
23], oceanography [
24] and home automation [
25,
26,
27] use IoT technology and cloud solutions [
28,
29] to deploy collaborative sensor networks. This WSN collects the information of the several nodes and routes the data to the Internet by using some of the protocols available such as GSM/GPRS, NoB-IoT, SigFox, LoRa, etc., which provide real-time access to the data.
In summary, the data-logger devices currently used for postharvest commodity monitoring are divided into: (i) passive communication devices with low power requirements but without real-time communication, i.e., they are not capable of transmitting the variables during the commercial life of the commodity; thus, it is possible only when the device is connected or approached to a reader in any of the phases of the product’s commercial cycle (RFID, indicator strips, USB loggers, I-button, etc.); (ii) IoT devices, which use some wireless communication bands to send the data to cloud servers on the Internet without operator handling (Bluetooth, Wi-Fi or ZigBee).
IoT devices can be divided between those that use narrowband networks such as SigFox, (SigFox, Labège (France), NB-IoT, LTE-M, or LoRA with low power consumption that have data-sending limitations and, currently, limited coverage and other devices with wideband networks. These devices that use wide bands, such as GSM, Iridium and CDMA, require devices with high power consumption that depend on sampling, the data frame protocol and frequency of data sending but have worldwide coverage. The use of these devices for postharvest commodity monitoring makes it necessary to manage power consumption optimally to achieve the same autonomy that the theoretical commodity shelf life.
The needs demanded by the land transportation sector in issues, such as integration, flexibility, autonomy and multi-point variable measurement, have motivated the design of the system presented in this article, which aims to overcome the limitations observed in the market equipment, highlighting the following:
Flexibility for any type of sensor measurement using analogic signals (voltage or current) or digital signals (1-wire, RS-232, SDI-12 [
30]).
Compatibility with cloud servers. Standard J-Son type frames are used for real-time data allocation.
Use of non-proprietary networks and as standard as possible to allow for worldwide use.
Management of collaborative networks for master-slave multi-point measurement.
Energy management for a minimum autonomy of 1 month with 15 min of data sampling.
Reduced size for flexible placement.
Low-cost design for assuming its loss or breakage during all stages of the commodity handling life.
The designed and described in this paper is a flexible multi-point measurement tool, able to communicate in real time the measured variables with a power consumption capable of providing a minimum autonomy of 1 month. The system is developed as a sensor nodes with two roles, the ‘slave’ node and ‘gateway’ node. The ‘slave’ node uses the Wi-Fi network for communication. The ‘gateway’ node uses GSM/GPRS for real-time cloud data allocating through the Internet but, in addition, it generates a Wi-Fi infrastructure for receiving multi-point measurement from the slave nodes. Slave nodes are designed for independent working. It means that they are able to connect and send data through any Wi-Fi network available during the postharvest chain and registered in the setup configuration of the device. The gateway node can be used as a mono-point measurement device and as a harvesting node in a WSN with the slave nodes.
The objective of this article is to demonstrate that a wireless network system based on Wi-Fi communication is able to operate correctly under the specifications of flexibility, robustness to signal loss and power autonomy enough to be used in the cold supply chain of perishable commodities.
This paper is divided into 8 sections. After the first section with the introduction,
Section 2 reviews the commercial devices used for commodities controlling transportation.
Section 3 describes the system architecture and the different working configurations.
Section 4 describes the hardware design and the different components used for the nodes. Software design for communication, time synchronization and power management are described in
Section 5.
Section 6 explains the methodology followed for conducting the tests, followed by the presentation of the results in
Section 7 and the conclusions and future work in
Section 8.
2. Review of State-Of-Art of Commercial Sensors for Shelf-Life Prediction Used in Transportation
A market study was carried out to review the technologies offered by different companies worldwide. It focuses on how the equipment controls the commodities during transportation, irrespective of kind of goods, industries, features controlled or transport.
An analysis of the dataloggers used yielded the following results: the simplest passive communication one is based on time-temperature indicators (TTI) and just controls temperature [
31], but it is not the most frequently used because RFID is the most extensive. The Faubel (Faubel & Co. Nachf. GmbH, Melsungen, Germany) company offers a system based on RFID and NFC, but it just controls temperature [
32]. NFC communication is used by Marathon Products (Marathon Products, Inc., San Leandro, CA, USA) [
33]. The disadvantage of these systems is the dependence on other devices for the manual or low-distance reading process, which avoids the possibility of network sensor reading and the real-time data transferring to proprietary servers for remote access. To avoid these inconveniences, some companies deploy gateway devices able to manage the measuring nodes, allowing for remote sensing and collecting data. This is the case of Secure System (Secure System GmbH, Munich, Germany), which focuses on security and personalized container access control, and recently also controls temperature and humidity [
34]; Sensitech (Sensitech, Beverly, MA, USA), which uses a router that receives the information transferred by a RFID sensors network [
15]; and OnAsset Intelligence (OnAsset Intelligence, Inc., Irving, TX, USA), which connects its sensor tags by Bluetooth Low Energy (BLE) [
35] to a harvesting data-system. With this evolution, these companies offer a flexible tool that allows for wireless measurement at several points simultaneously. In the last few years, other companies have promoted the use of devices connected via LoRa as an improvement. However, although they allow for wireless communications between measurement points, they need routers or gateways to send the data to the Internet [
36,
37,
38,
39]. ORBCOMM [
40] (ORBCOMM Networks LLC, Rochelle Park, NJ, USA) and Aeris (Aeris Communications, Inc., San Jose, CA, USA) [
41] implement their connected devices directly into the microprocessor installed into the refrigerator container to register the temperature readings to use their cloud connectivity.
A synergy between the connection by BLE or LoRa and the communication using GSM is made by Roambee (Roambee Corporation, Santa Clara, CA, USA) [
42], Swiftsensor (Swift Sensors, Inc., Austin, TX, USA) [
43] or JRI (JRI, Fesches le Châtel, France) [
44], whose systems send the registered data to a user interface. Laird Connectivity (Laird Connectivity, Akron, OH, USA) [
45] has replaced BLE with NB and LTE. Meanwhile, HyperTech (Hyper-Tech Systems, Petach Tikva, Israel) [
46] offers sensors based on Zigbee wireless devices, in the same way as hIOTron (hIOTron Gateway and application, Ashoka Nagar, Maharashtra) [
47], which includes with in-built GNSS module to track the vehicle position. Other companies including SenseAware from FedEx (FedEx Corporate Services, Inc., Memphis, TN, USA) [
48] or TagBox (TagBox Solutions Private Limited, Bengaluru, India) [
49] prefer to work with wireless devices that use Wi-Fi and GSM technologies for communication facilities.
As an evolution, some companies design devices that work simultaneously as a sensor and router collecting and send the data using just GSM [
50,
51,
52,
53].
3. System Architecture
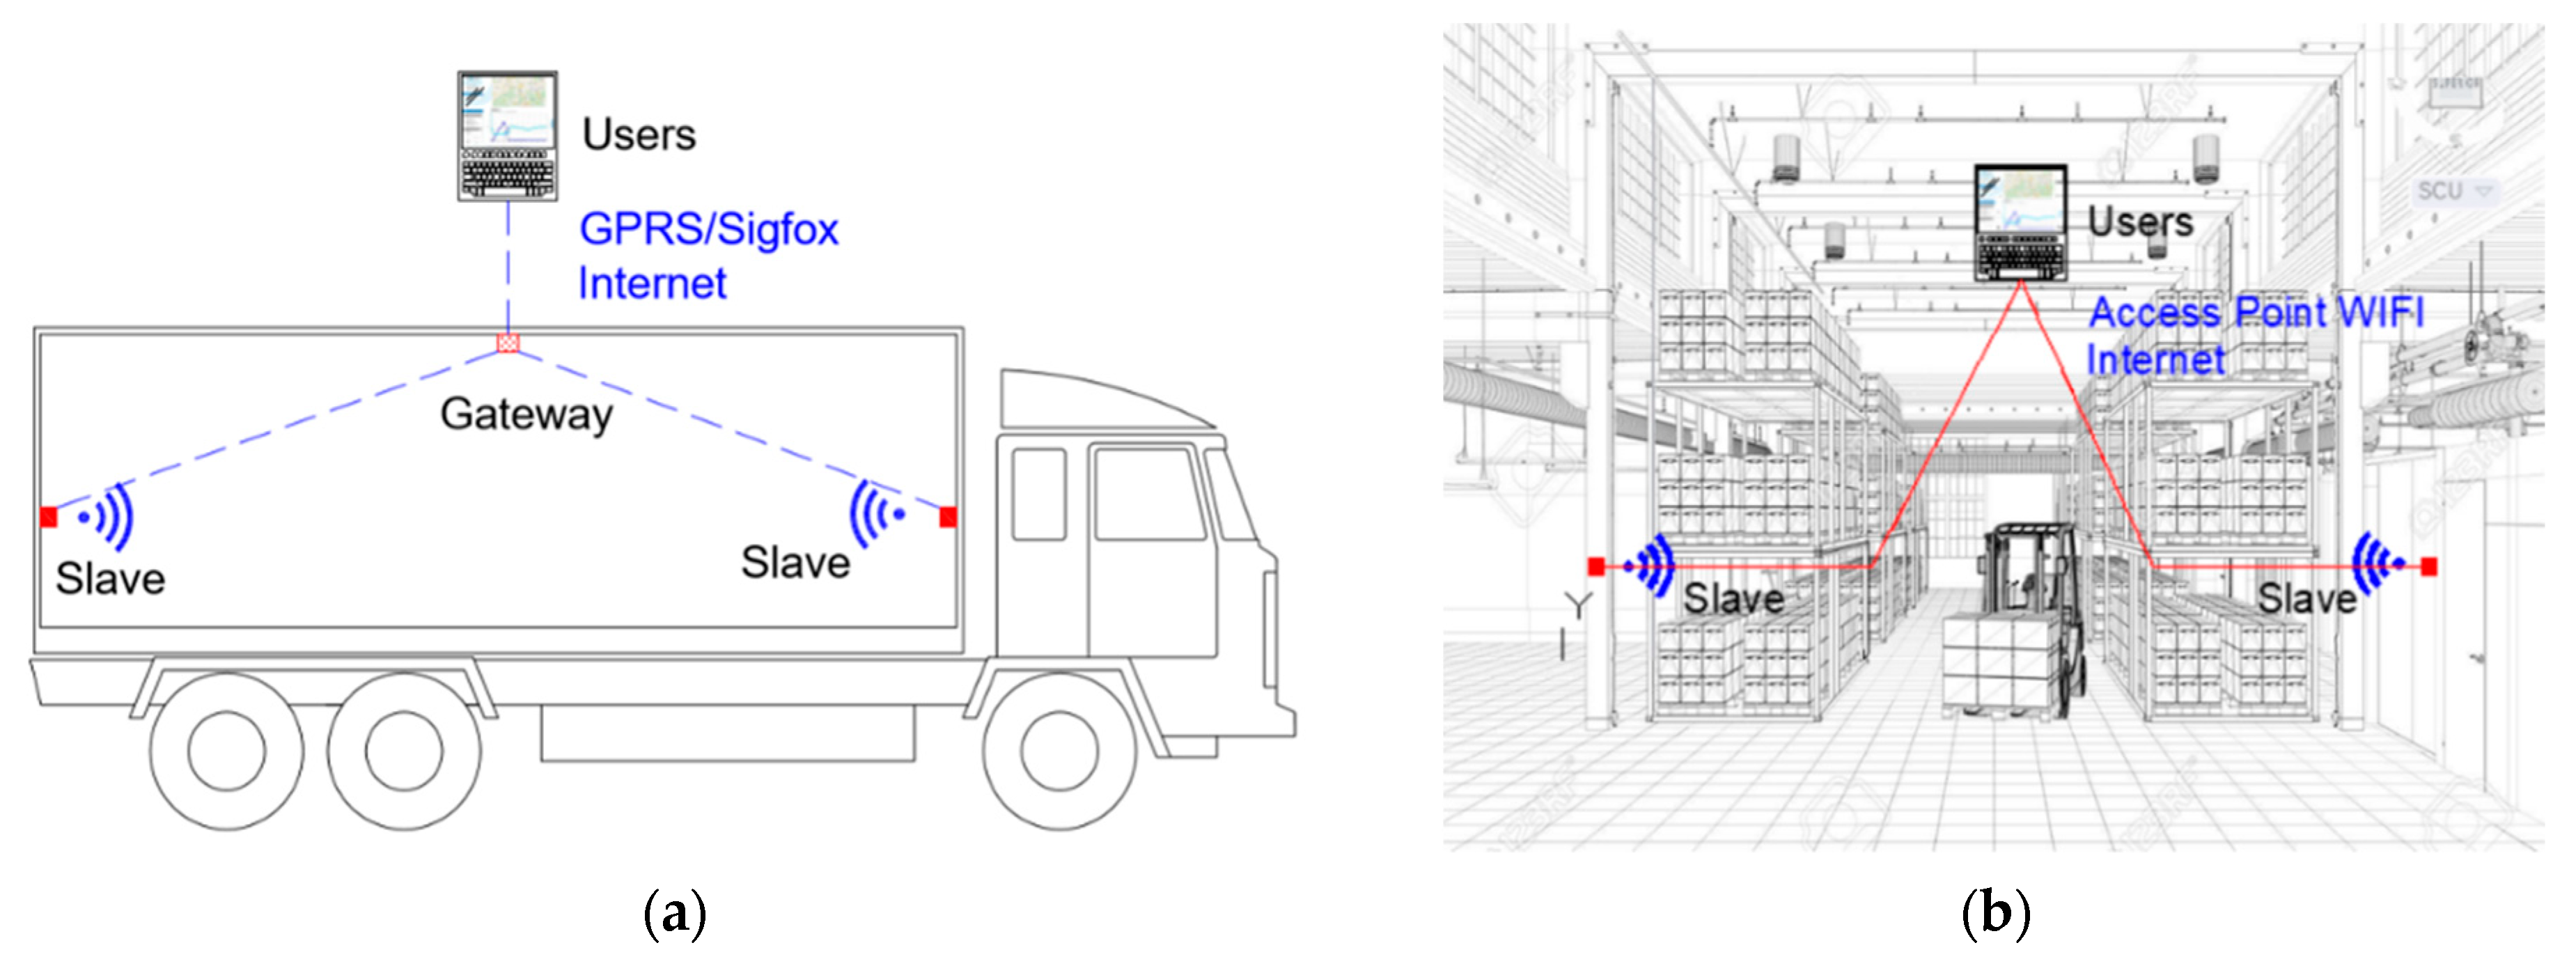
During the postharvest handling stages, the commodity is located in several places where Wi-Fi access points belonging to logistic companies that commercialize the product are available; thus, the system could be programmed with the lists of SSIDs and passwords to which it would connect in each stage. To solve the problems of lack of connection, the sensor nodes have storage capacity. As mentioned before, the difference between the gateway and the slave sensor nodes lies in the communication tasks they can perform. The gateway node acts as sink and coordinator, managing the information measured by itself and the information sent by the slave nodes. The combined information is transmitted to the servers through the Internet using commercial data communication networks (GPRS, SigFox or LTE). In addition, unlike a traditional wireless sensor network (WSN), the slave nodes can send the measured and recorded information without being connected to the gateway since they comply with the 802.11 (Wi-Fi) standard and this allows them, if properly configured and if Wi-Fi infrastructure is available, to send the information to the servers without a gateway node. In this way, the slave nodes can be located among the commodities, inside the card boxes or pallets, monitoring the conservation variables during the whole supply chain. The two working scenarios of the system are shown in
Figure 1. Both scenarios manage multi-point measurement: (a) configuration is used during land transport, where Wi-Fi connection is not available; (b) configuration is used in a logistic warehouse, where Wi-Fi infrastructure is available. The combination of both types of nodes allows for the use of the system in the different situations of commodities handling.
4. Hardware Description
The sensor nodes were developed under hardware platforms based on ESP32 (ESPRESSIF SYSTEMS, Co., Ltd., Shanghai, China) that provide embedded Wi-Fi and BLE interfaces besides several input/output pins for reading and control of the sensors. ESP32 is capable of functioning reliably in industrial environments, with an operating temperature ranging from –40 °C to +125 °C. It is engineered for mobile devices, wearable electronics and IoT applications, ESP32 achieves ultra-low power consumption with a combination of several types of proprietary software. ESP32 also includes state-of-the-art features, such as fine-grained clock gating, various power modes and dynamic power scaling. It includes built-in antenna switches, RF balun, power amplifier, low-noise receiver amplifier, filters and power management modules [
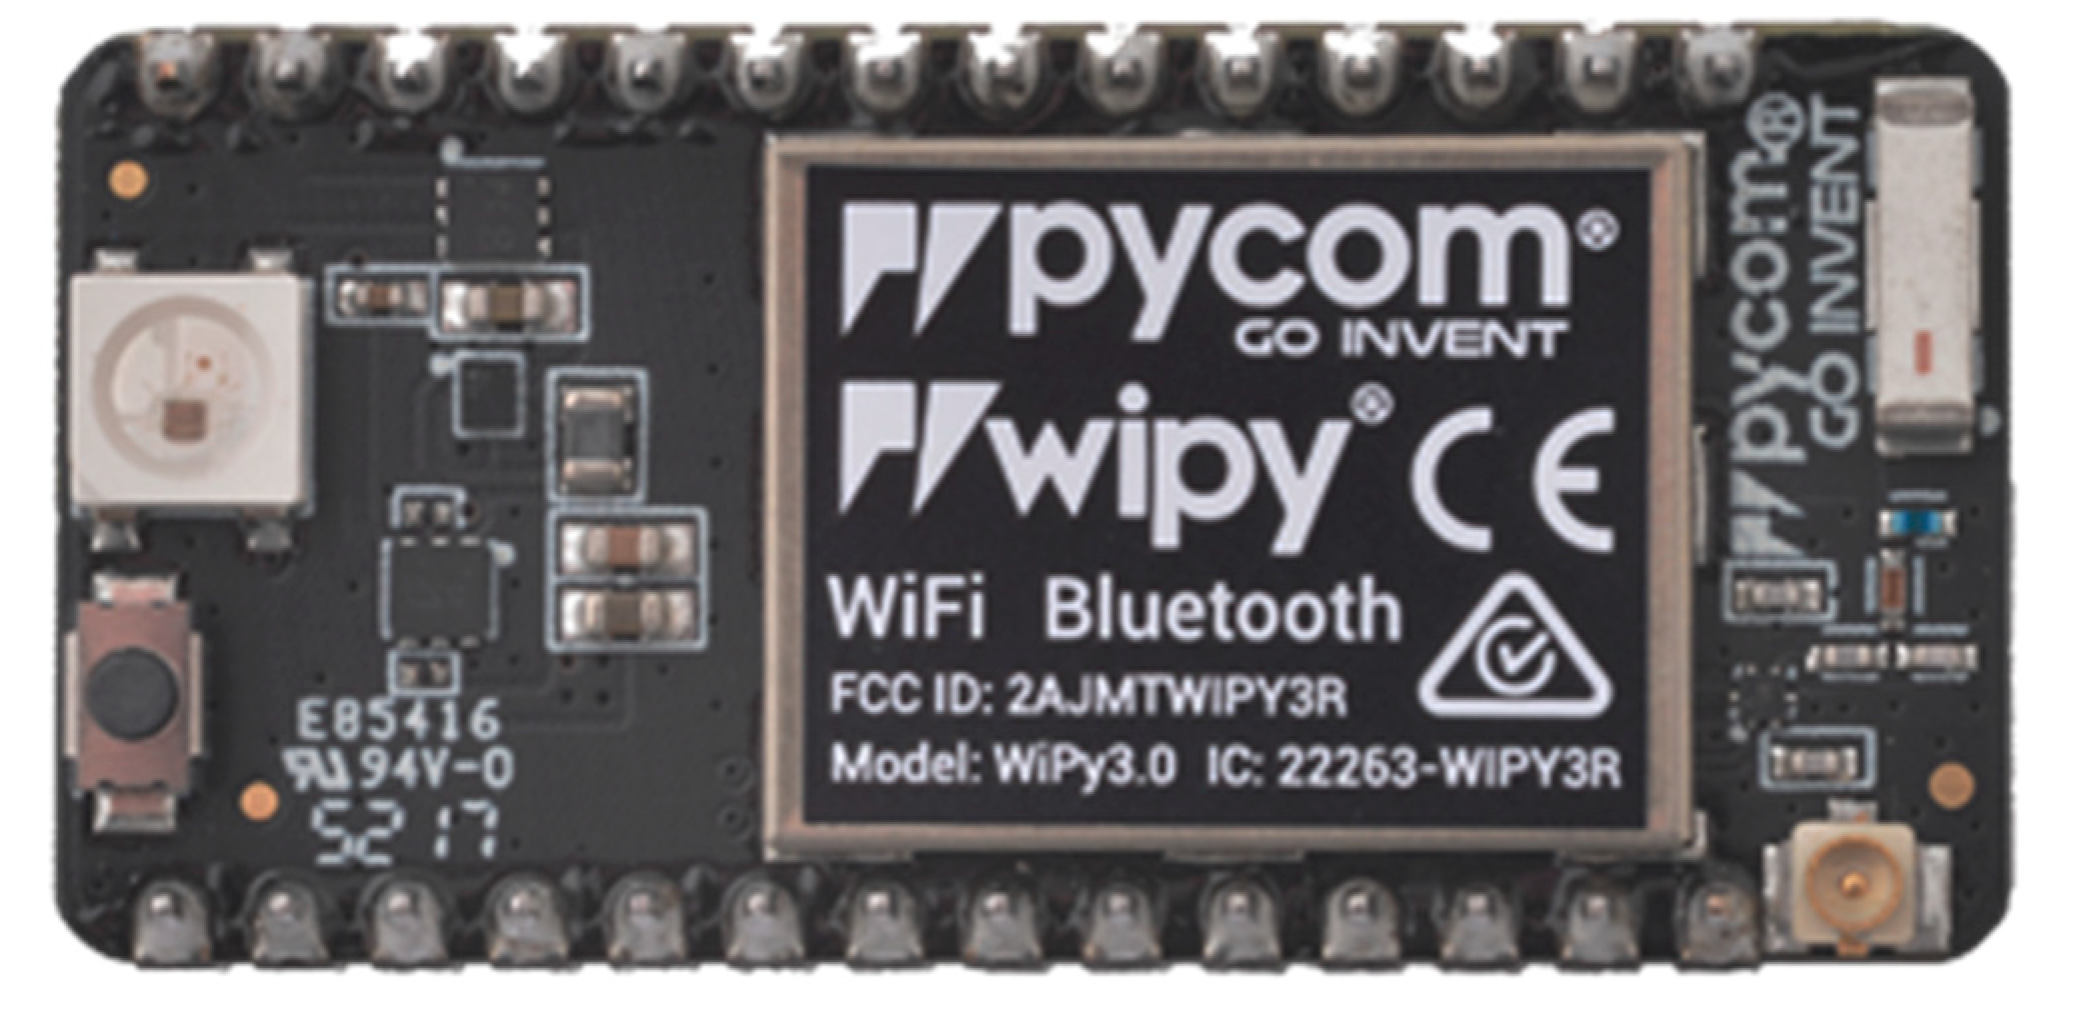
54]. WiPy (Pycom Ltd., Eindhoven, The Netherlands) is a microPython-enabled ESP32-based development board with a full suite of free services [
55]. WiPy 3.0 is an updated enterprise grade IoT development platform. The tiny MicroPython enables Wi-Fi and a Bluetooth IoT development platform with a ESP32 chipset and dual processor [
56] (see
Figure 2). Pycom provides software libraries to control the device and the interfaces that can be used.
Both the sensor and gateway nodes are designed using this low-cost hardware module.
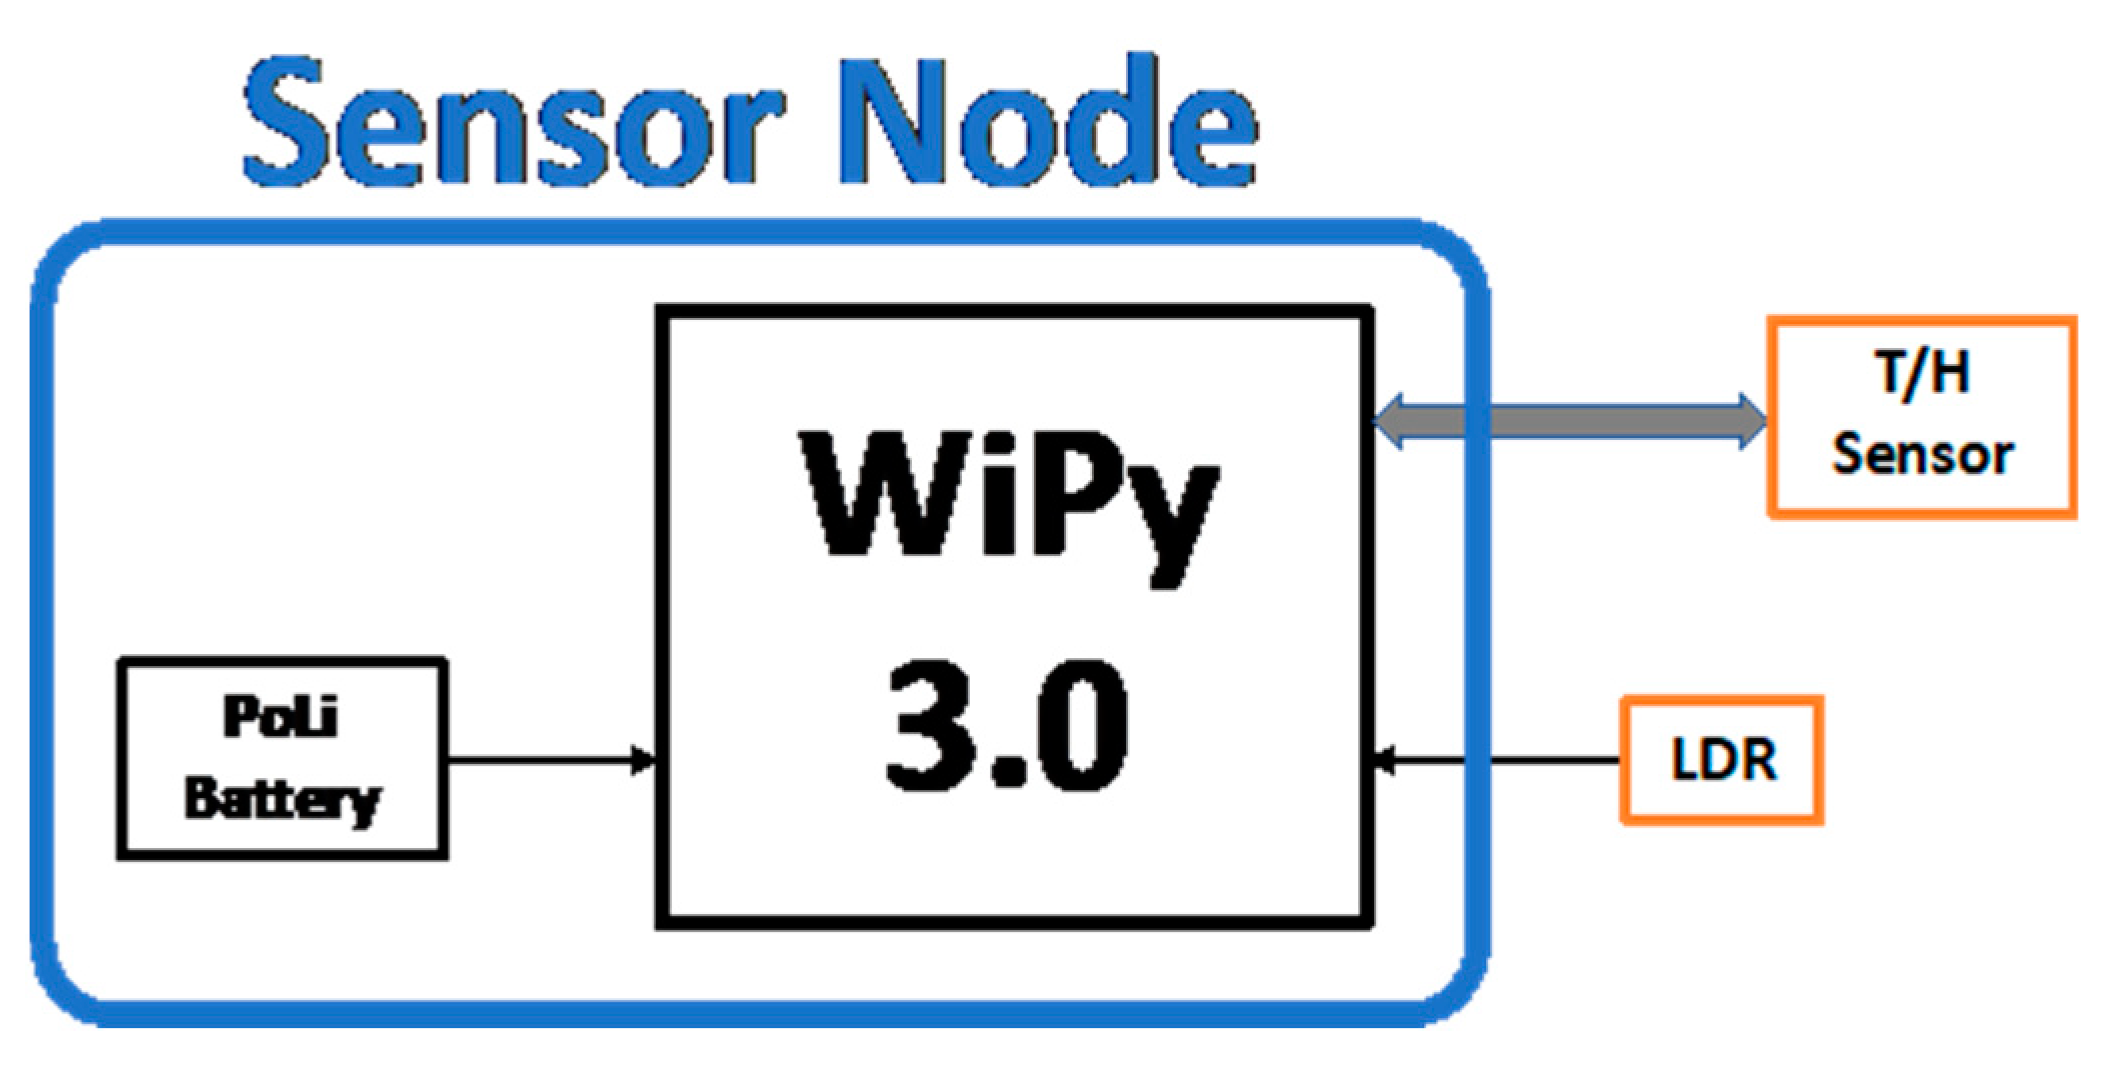
4.1. Sensor Node Design
The diagram of the sensor node can be seen in
Figure 3.
The sensor node is powered by a 3.7 V 3500 mAh PoLi battery, which directly supplies the WiPy module (its power range is 3.5 V to 5.5 V) by connecting it to the Vin pin. The WiPy has a voltage regulator that provides a stable voltage of 3.3 V and 550 mA, externally connected to pin 3V3 of the module. This voltage is used to provide power to the sensors of the node through a PNP transistor that allows, controlling its state (cut off/saturation), for the power supply activation of the sensors. The activation of this transistor is controlled by pin P9 of the module, configured as a digital output. As the 3V3 connection to the sensor power supply can be controlled by software, maximum energy optimization is achieved as the sensors are only powered when measurements are needed.
The sensor nodes are able to measure temperature, relative humidity and light conditions through the use of these components:
LDR NSL06S53 (Advanced Photonics, Camarillo, CA, USA). This sensor is used for light detection in undesired truck door opening events. LDR is connected to a fixed 113 kΩ resistor, making a resistive divider that is powered by 3.3 V sourced by the DC/DC converter of the WiPy. This resistive divider provides a voltage output proportional to the LDR value and connected to P19 (ADC1_4) of the WiPy module.
DHT22 module (Aosong Electronics Co., Ltd. Guangzhou, China). This device is based on AM2302 that includes one NTC temperature and a humidity-sensing component formed by two electrodes with a moisture-holding substrate between them. The temperature range is −40 to 125 °C (accuracy ±0.5 °C and resolution 0.1 °C) and the relative humidity range is 0% to 100% (accuracy ±2% and resolution 0.1%). A one-wire proprietary bus is used for communication between digital I/O P11 of WiPy module and DHT22. The sensor data frames are composed of 40 bits [
57] (see Equation (1)).
In addition, the device can measure the battery voltage using another resistive divider connected to analogic P16 (ADC1_3 of WiPy module).
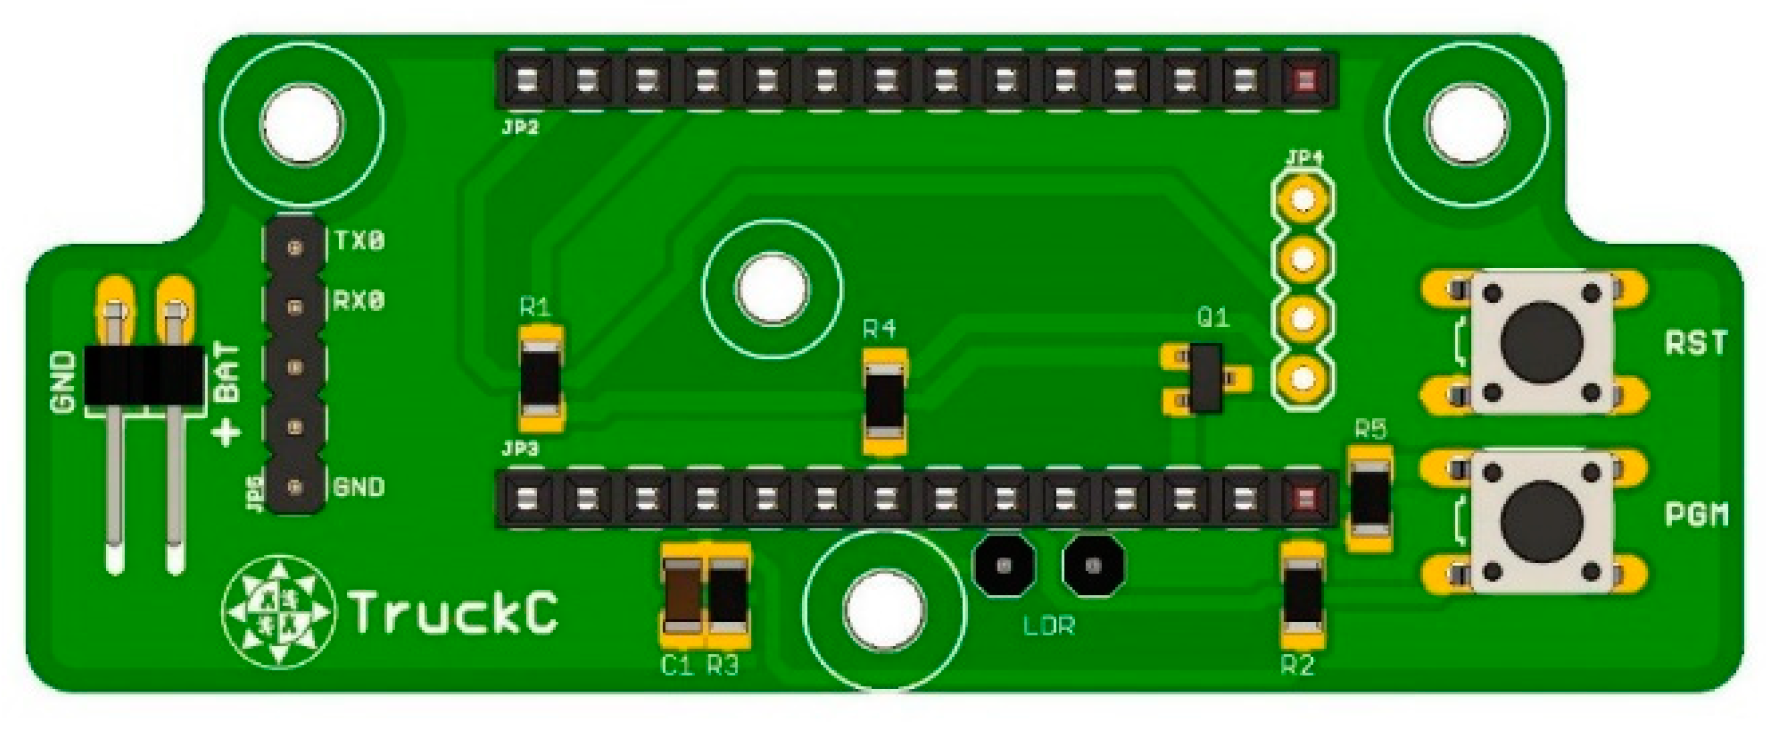
The size of the Electronic PCB is 73 × 28 mm. A 3D view of the PCB is depicted in
Figure 4, where the battery and programming connectors can be observed, and the plugs for LDR and DHT22 (JP4) are presented. Two push-buttons are added for reset and programming sequence purposes.
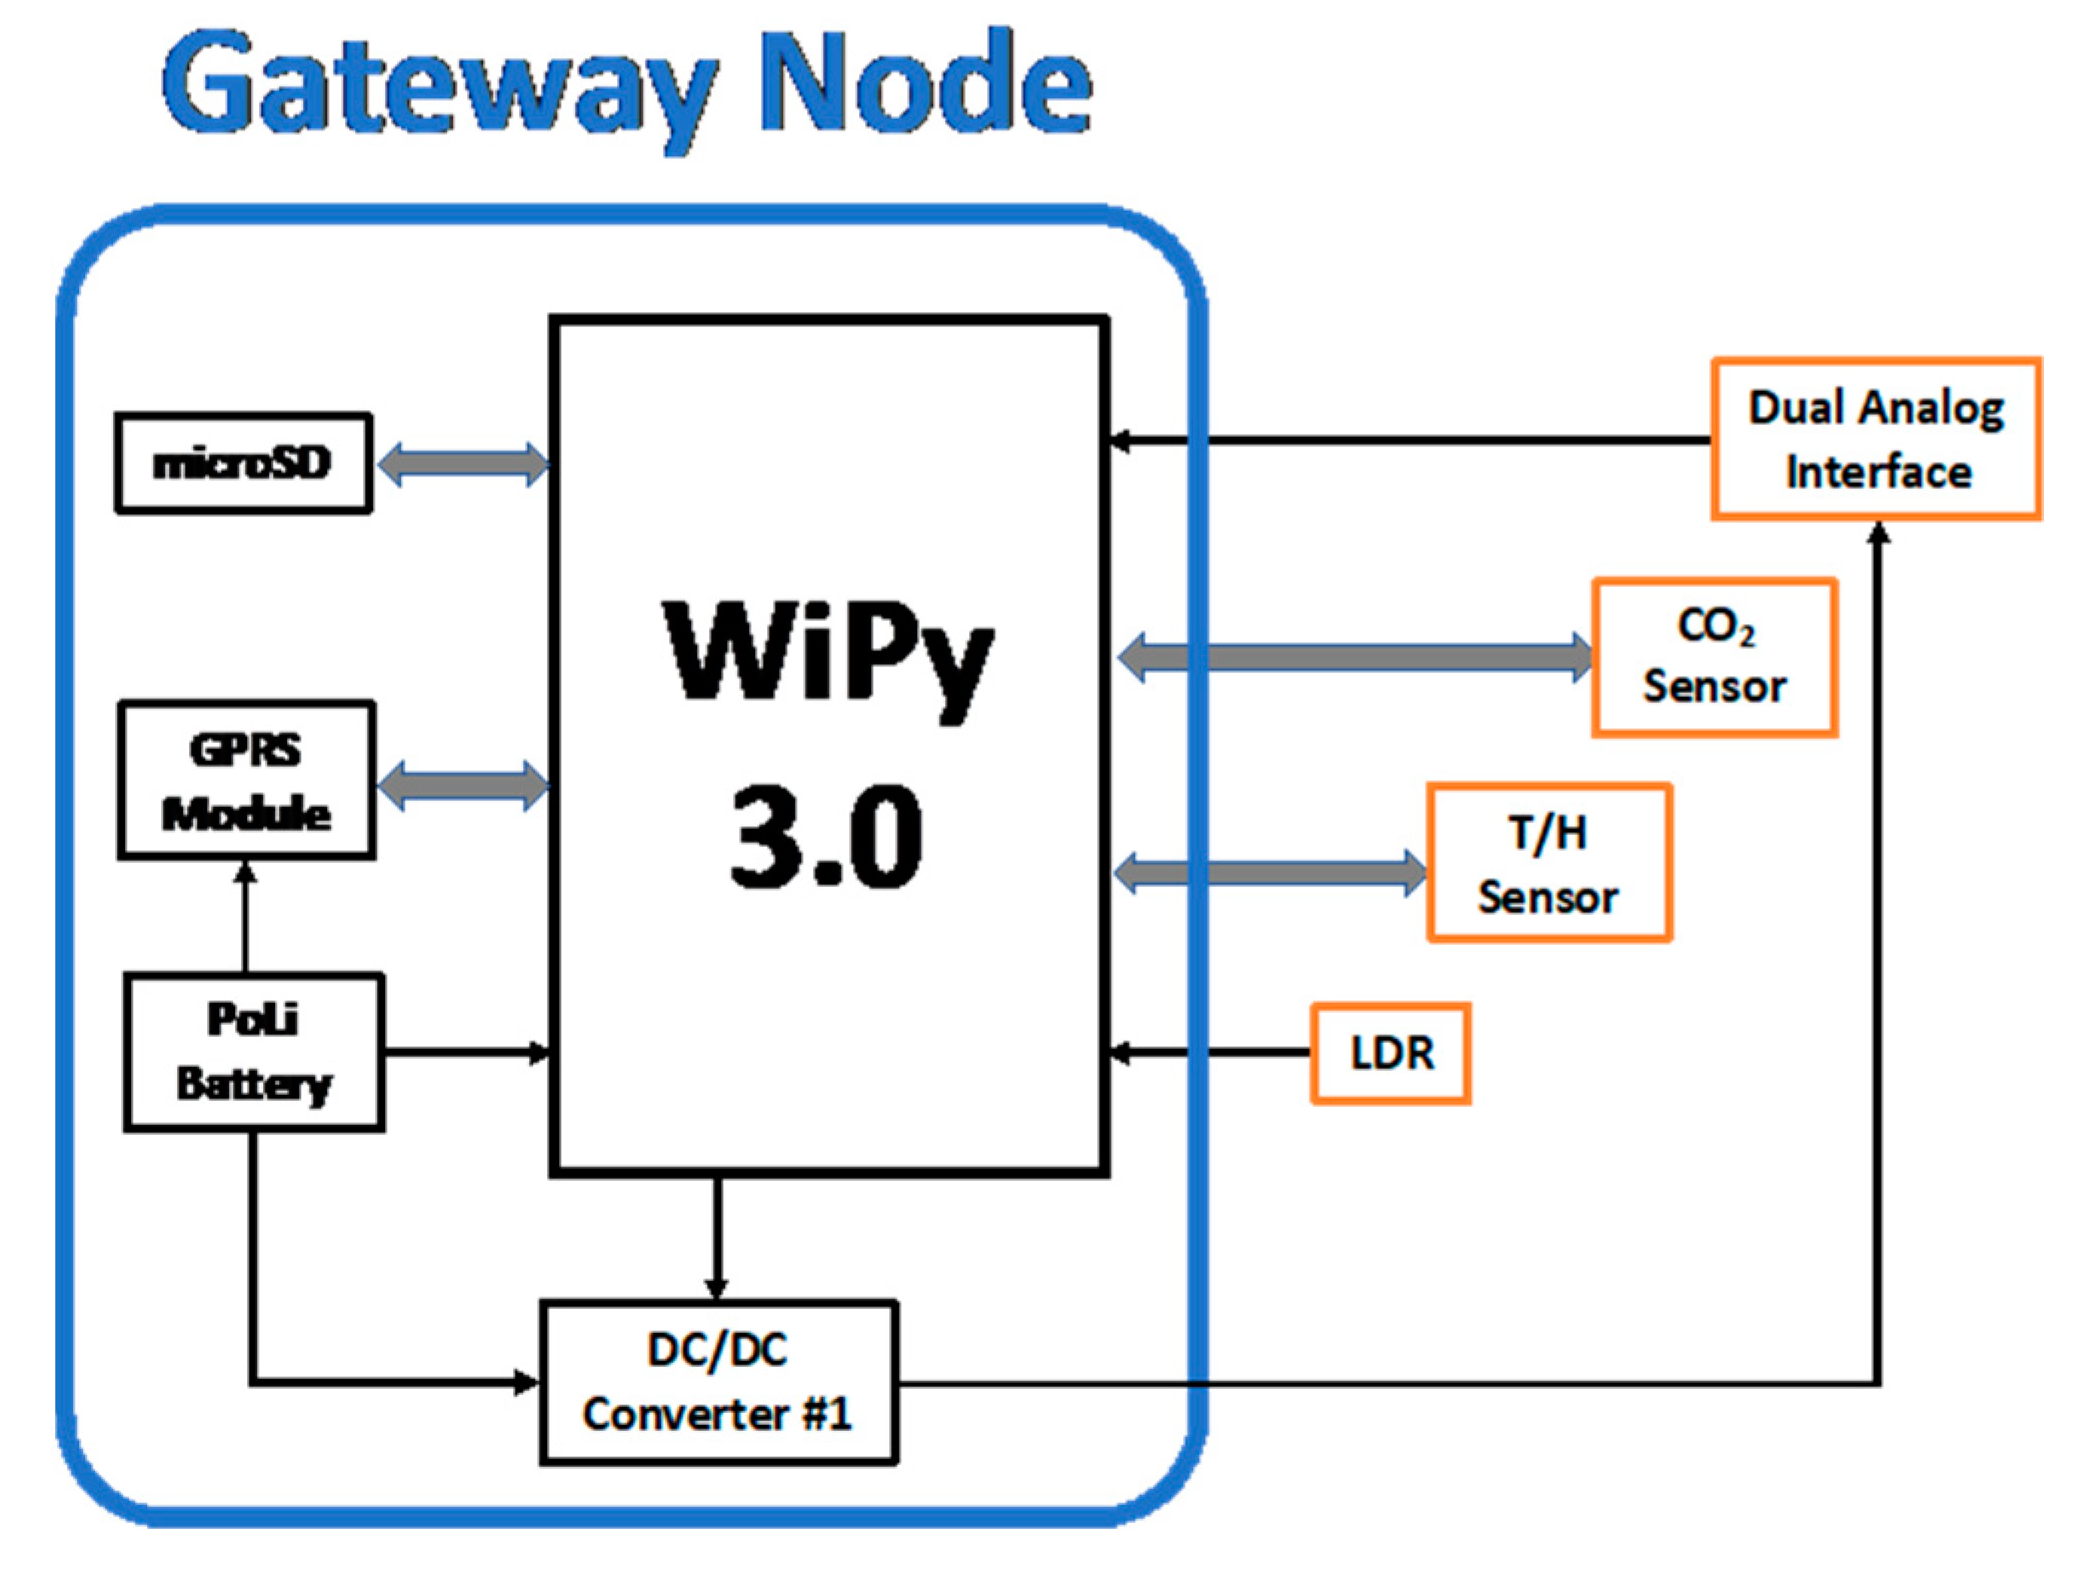
4.2. Gateway Node Design
The diagram of the gateway node can be seen in
Figure 5.
The gateway node is also based on WiPy 3.0. In addition to sensors managing, the gateway node has extended functions such as:
A MicroSD slot card for data storage. Three pins are used for SD managing. DAT0, SCLK and CMD are driven by P8, P4 and P20 using a UART1.
A GPRS communication module (SIM800, SimComm, Shanghai, China) powered directly from the battery and controlled by AT commands through the UART of the Pycom module. The WiPy module has three UARTs, which can be easily redirected to several pins for a flexible design. The Tx and Rx signals of the SIM800 are connected to P5 and P6 pins and the reset line is fed through P7 of the WiPy. UART1 is dynamically assigned to drive the AT commands because the UART1 is shared with SD storing.
A CO2 sensor (COZIR-GC16 CO2Meter, Ormond Beach, FL, USA) for commodities’ breathe monitoring. This sensor has a 0–20000 ppm range with an accuracy of 70 ppm ±5%. The sensor is serial controlled through UART2 directed to P20 (Tx) and P19 (Rx) pins of WiPy module. LDR light sensor is connected to P18 pin in the gateway node.
A DC/DC boost switching regulator (MIC2288, Microchip Technology Inc. Chandler, Arizona, USA) that provides 12 V power supply to additional sensors.
Two analogic inputs are either voltage (0–3 V) or current (4–20 mA) for additional sensor measurements, P14 and P15.
The power supply is provided by the WiPy module (3.3 V) to the microSD and the CO
2 sensor. It is switched using a transistor for optimum energy saving as explained in
Section 3.
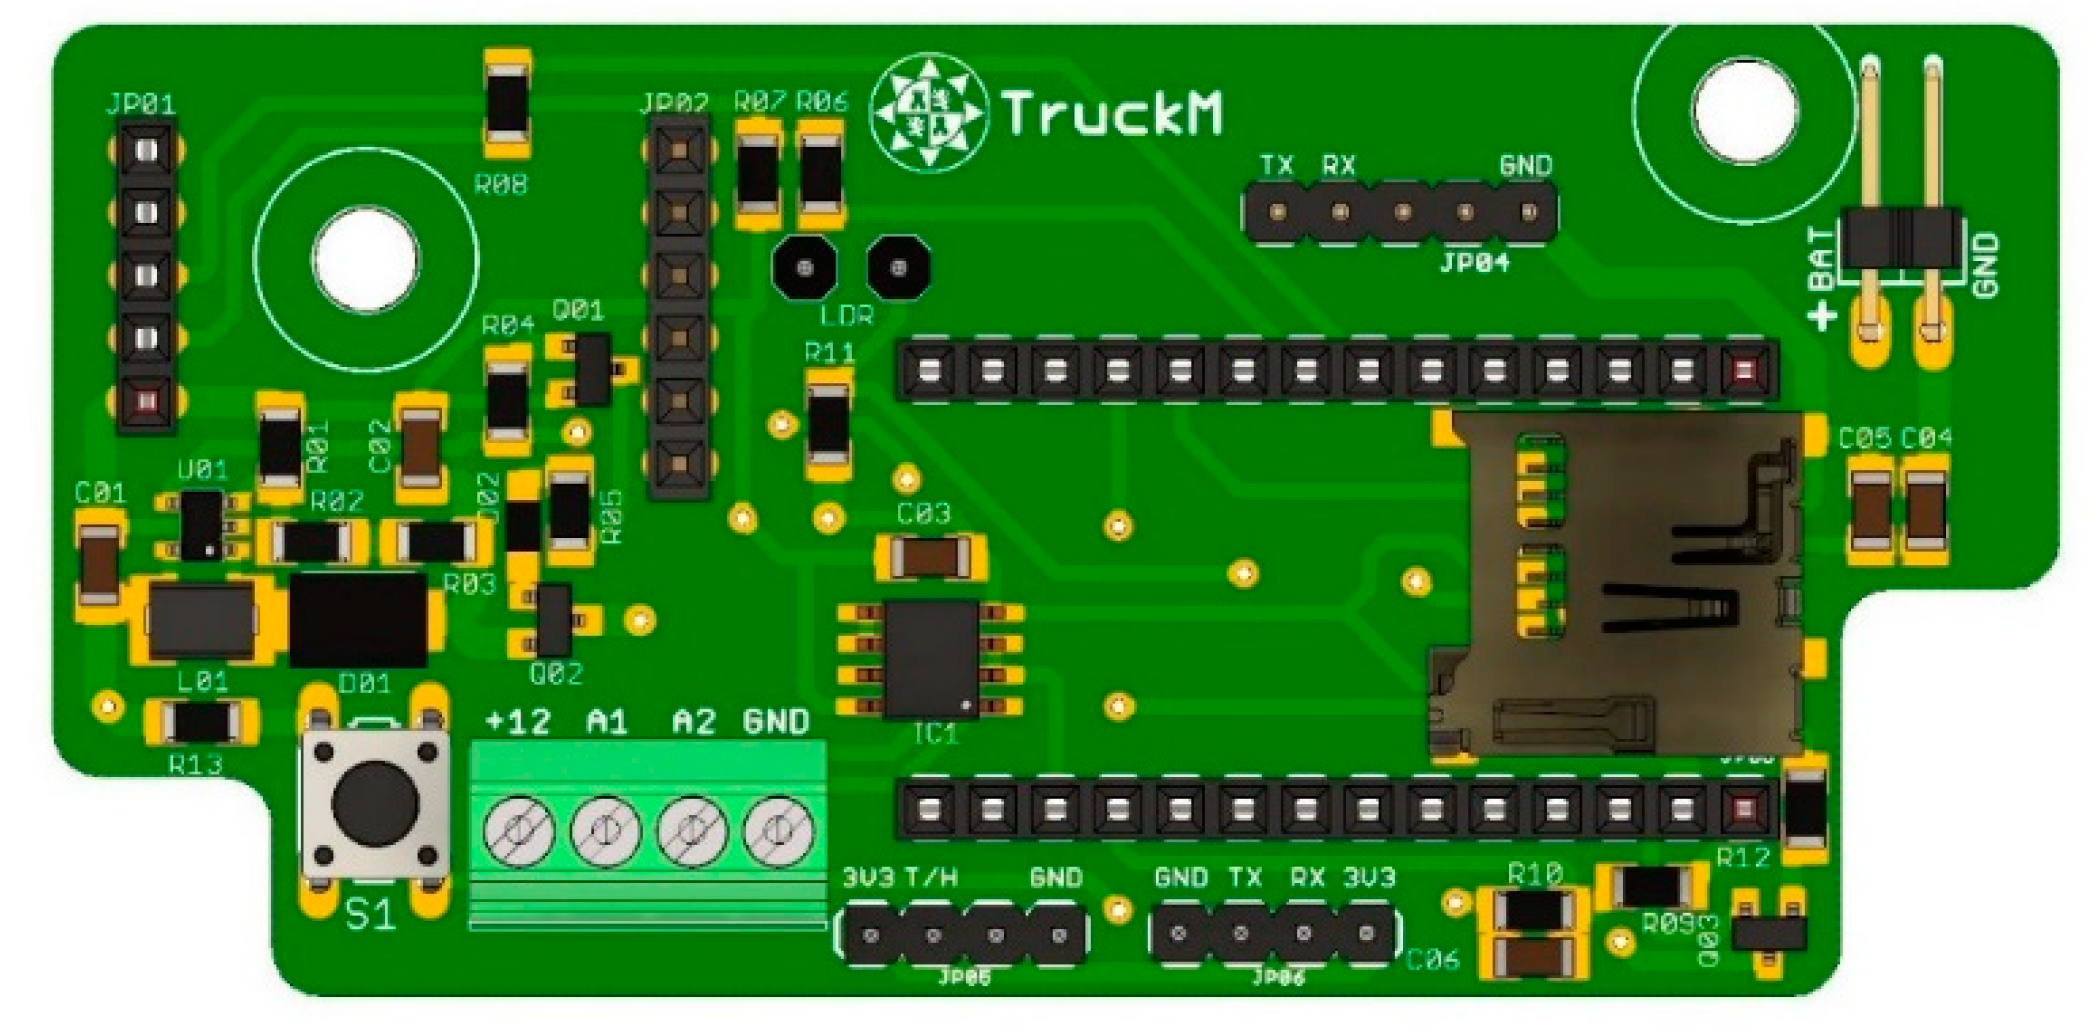
The size of the gateway node board is 82 × 40 mm. The 3D view of the PCB is shown in
Figure 6.
The GPRS SIM800 module is placed on the board using the JP01 and JP02 plugs. A push-button S1 is installed to run the setup sequence.
5. Software Architecture
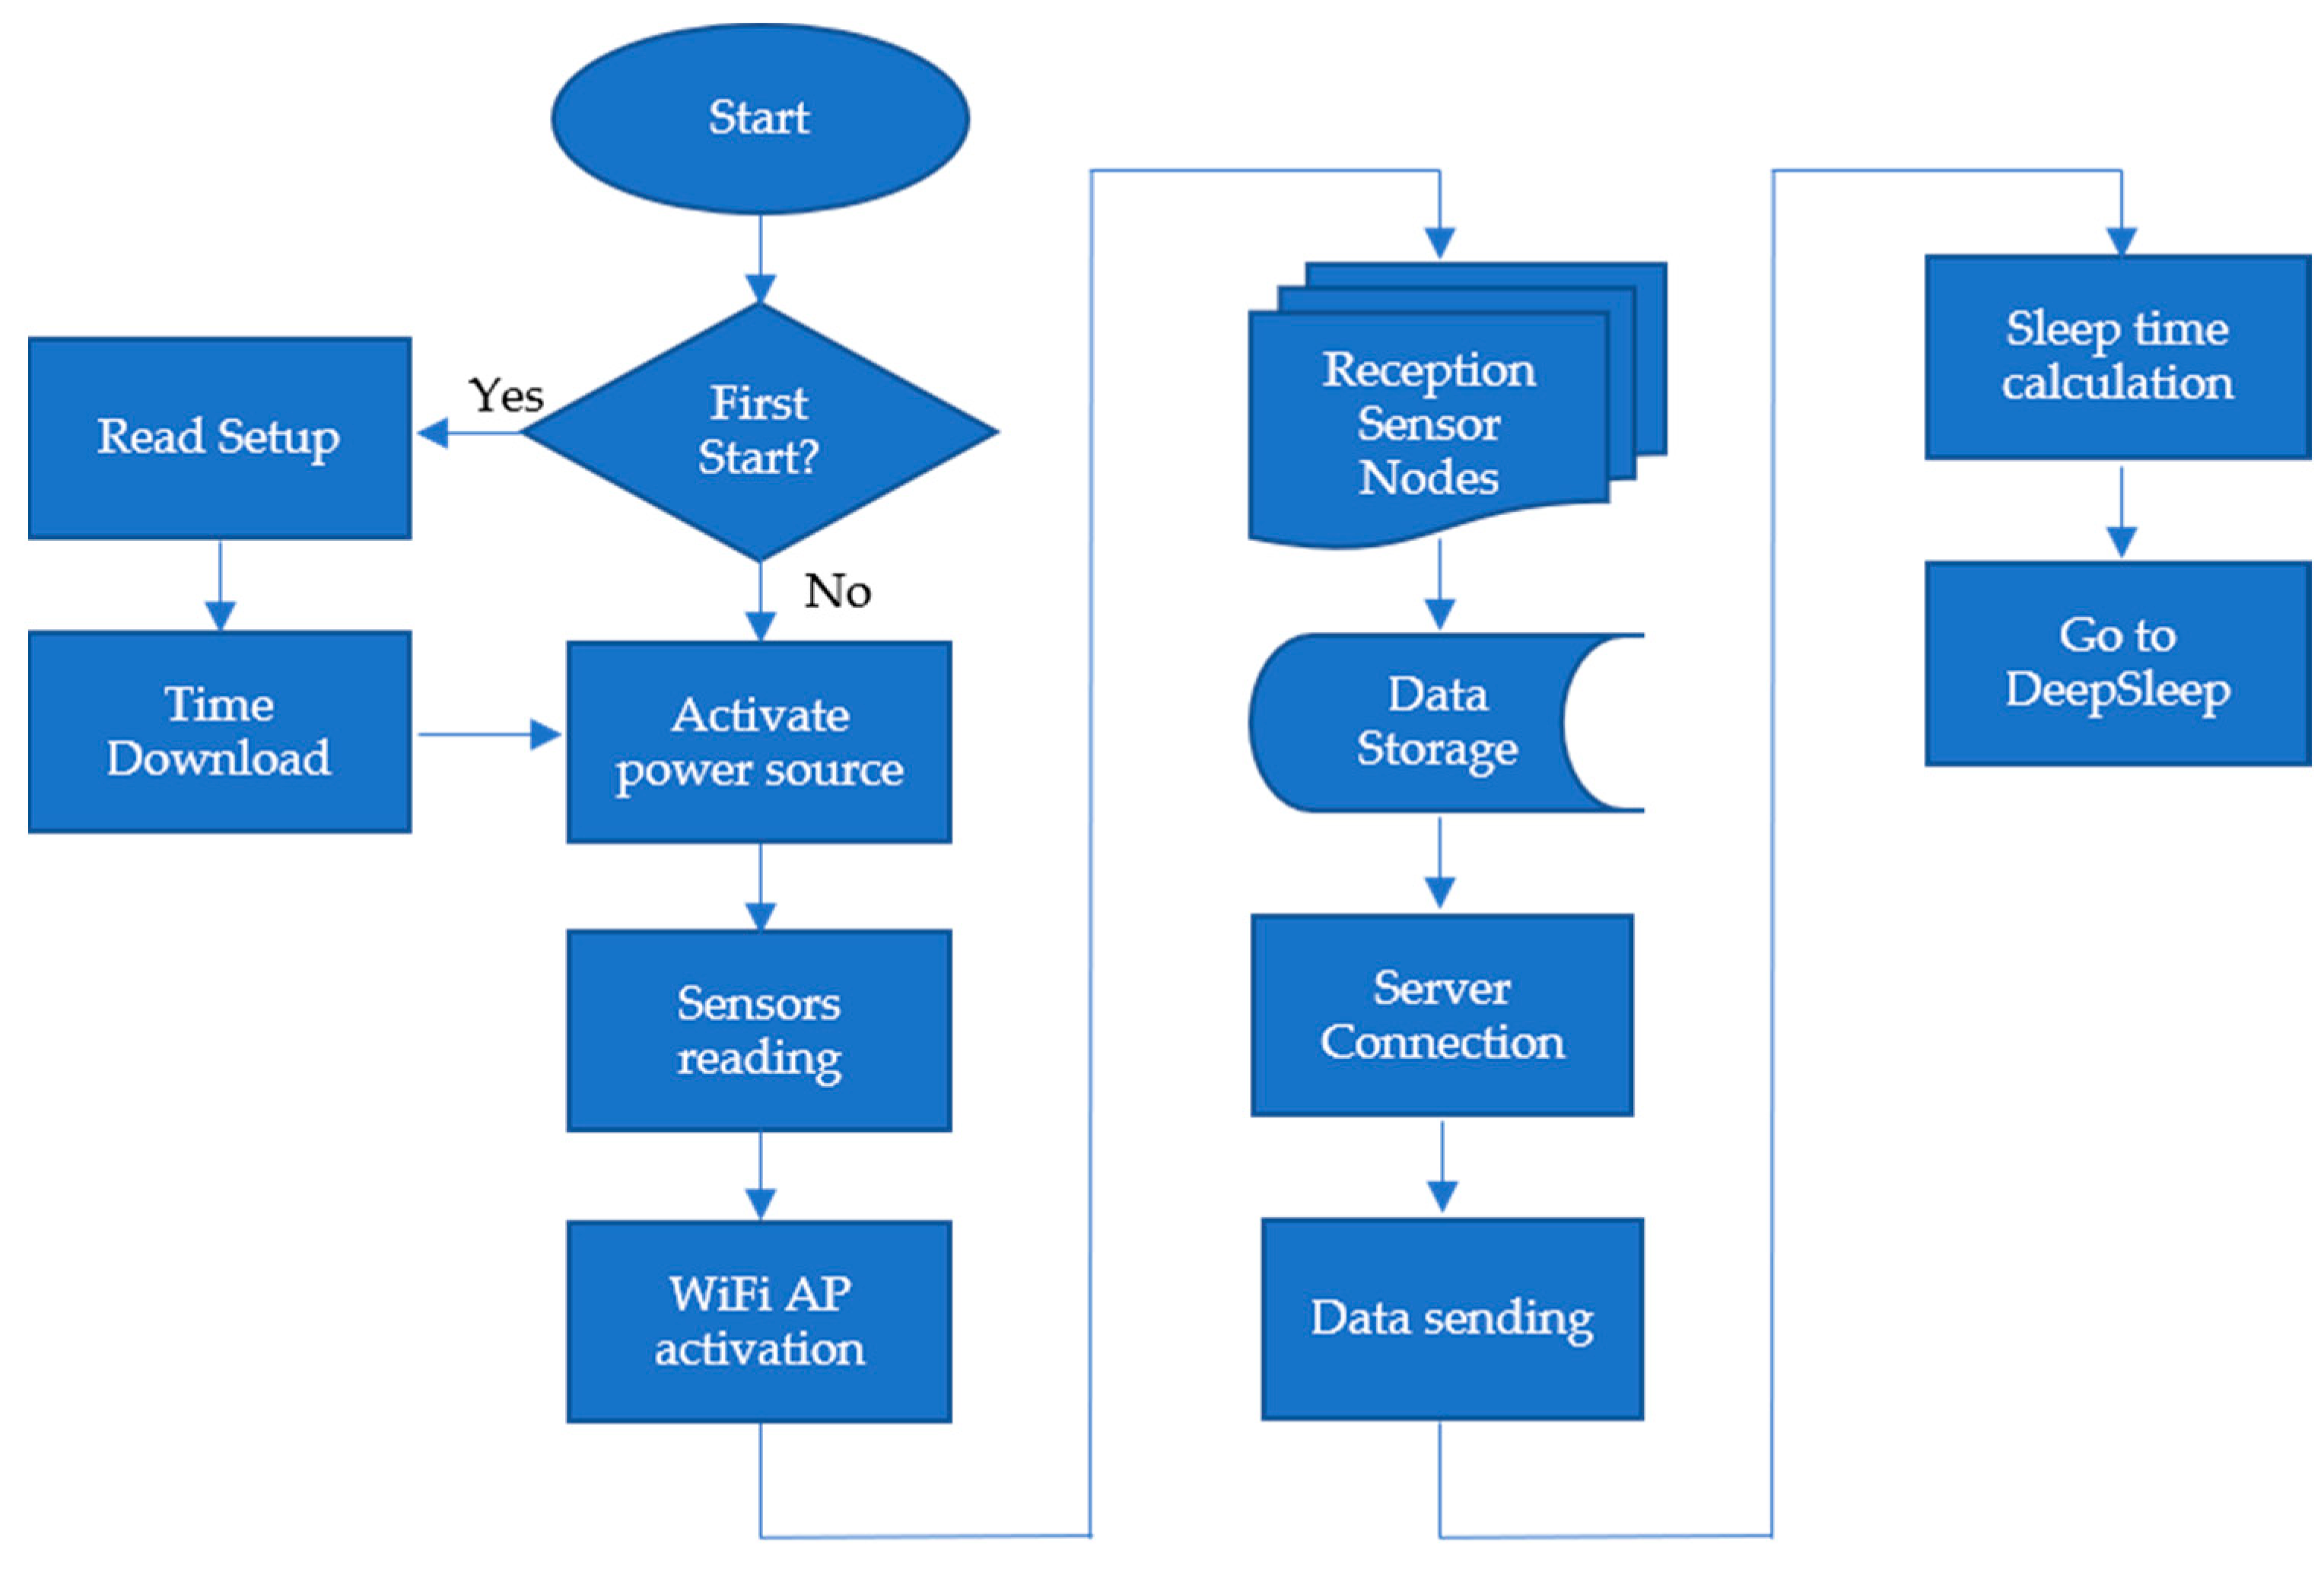
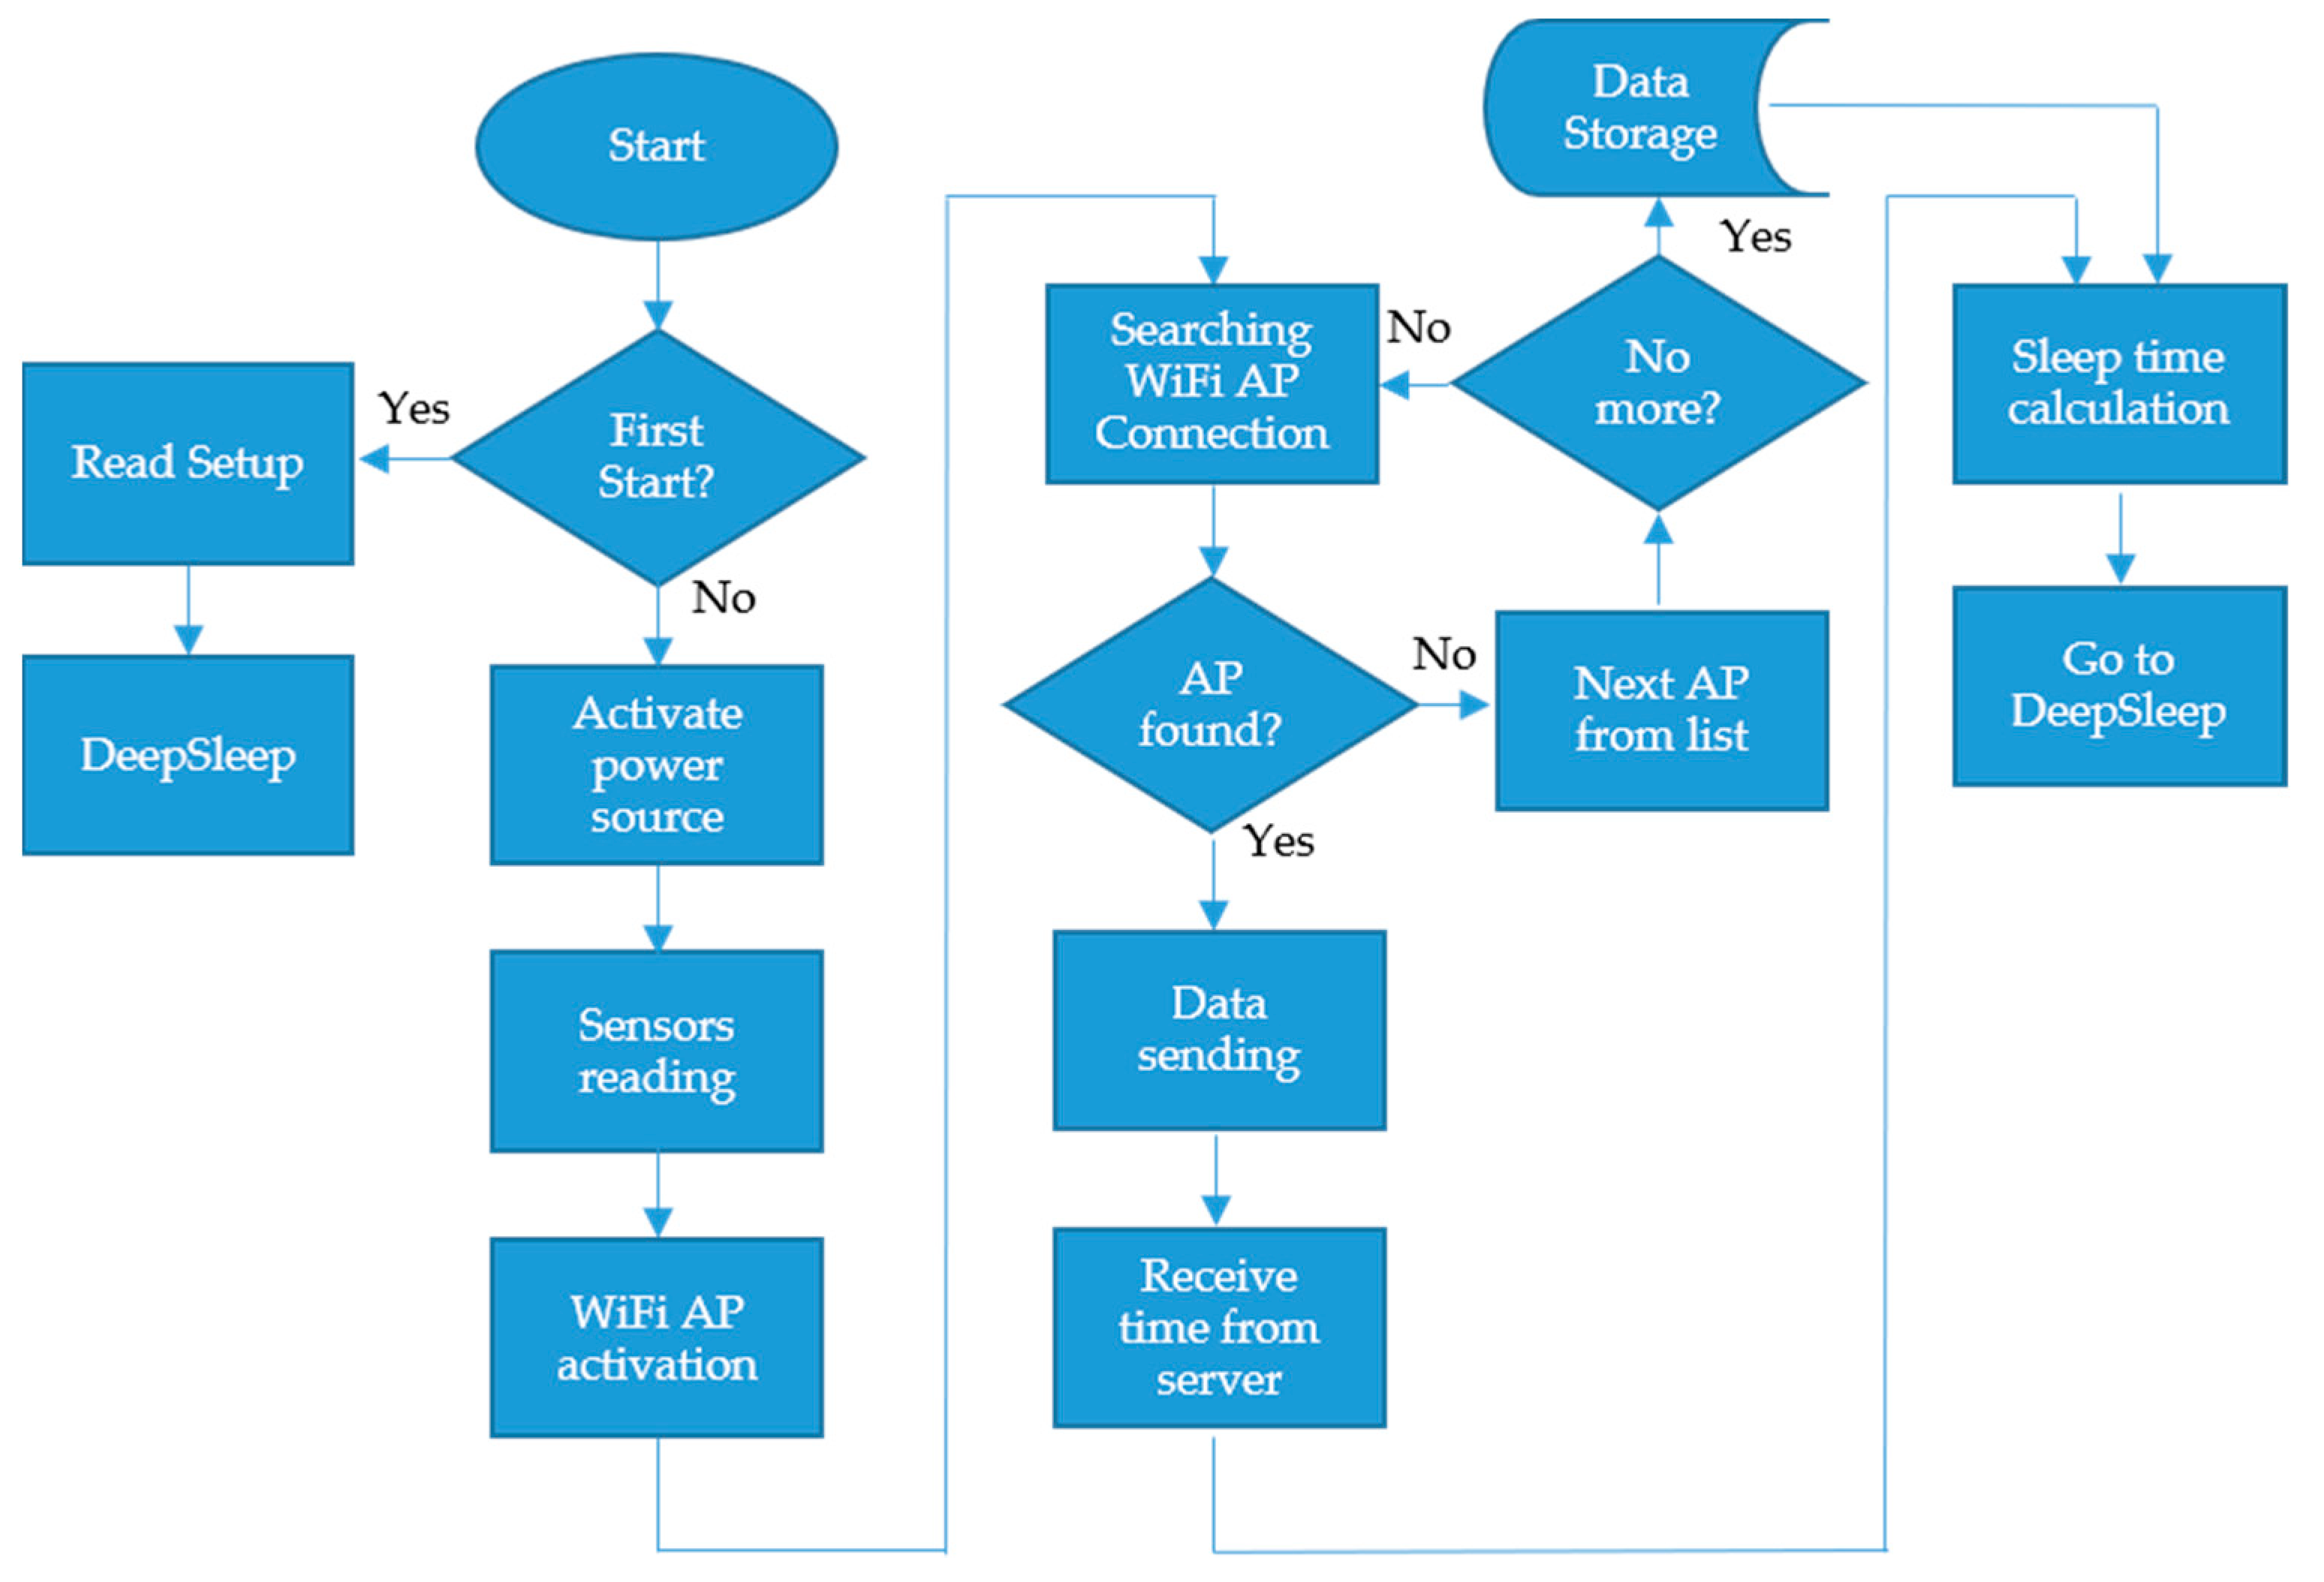
The code programmed in the nodes was developed in microPython. Besides the standard microPython modules, Pycom company supplies specific libraries to control the GPIO, UARTs, DC-DC and other peripheral components included in the WiPy 3.0 module. The next flowcharts show the general operation of the gateway node (
Figure 7) and sensor node (
Figure 8).
Both nodes were developed around four operational groups:
5.1. Instrumentation, Sampling and Information Storage
The instrumentation procedure is executed according to the programmed sampling time, which defines the frequency that the system wakes up, measures the sensors, records the information and (if necessary) sends the data. In the designed nodes, the instrumentation time was defined as an integer value of the number of samples desired per hour, with a maximum of 12. This process makes the system always instrument in the same minute every hour. The equation to calculate the remaining seconds that the system has to fall into the deep sleep before the next sample is calculated with the following equations.
Equation (2) calculates the exact minute of the hour when the next sampling will take place.
where sampling is the minutes between measurements programmed in the setup file.
Equation (3) calculates the remaining seconds to reach the sampling time and, therefore, the time that the node must be in deep-sleep ultra-low power mode before it wakes up.
Regarding the deviation in the time measurement between sampling periods, a test was performed to measure the time differences when the node was awakened from deep sleep. The average deviation for a period of 900 s (15 min) was 2.7 s, which implies an accuracy of 0.3%. This low accuracy is because the ESP32 does not use the RTC to wake up the device, but an ultra-low power timer. However, the device compares at each wakeup RTC and resets the second’s wakeup value for the next sampling, so the timer accuracy value is not too important.
Analogic sensors are connected to ADC pins integrated into the module. In addition, P16 is used for battery level measurement. UARTs and digital pins are used for digital sensors, as previously written.
To improve the stability of the sensor readings, a biased average of 20 sensor readings was performed every 25 ms.
A Python dictionary with seven keys in the format [ID_nodo; Temp; Hum; %CO2; %Lum; Vbatt; ppm C2H4] is returned after the measurement procedure is executed.
These data are temporarily stored in a partition of the device’s flash memory. If the communication procedure is not possible due to coverage lacks or other problems, the data are stored together with the time stamp assigned to that dictionary in the SD card.
5.2. Power Management
Power management is a priority function of the system since the operation of the nodes is necessary for several weeks. Most of the time, the nodes are in an inactive mode, so the associated deep-sleep (time-out) function is used, which requires only 25 µA [
56]. This function can be “awakened” through a timeout specified as a parameter of this function. This parameter is calculated at the end of the current process using Equations (2) and (3).
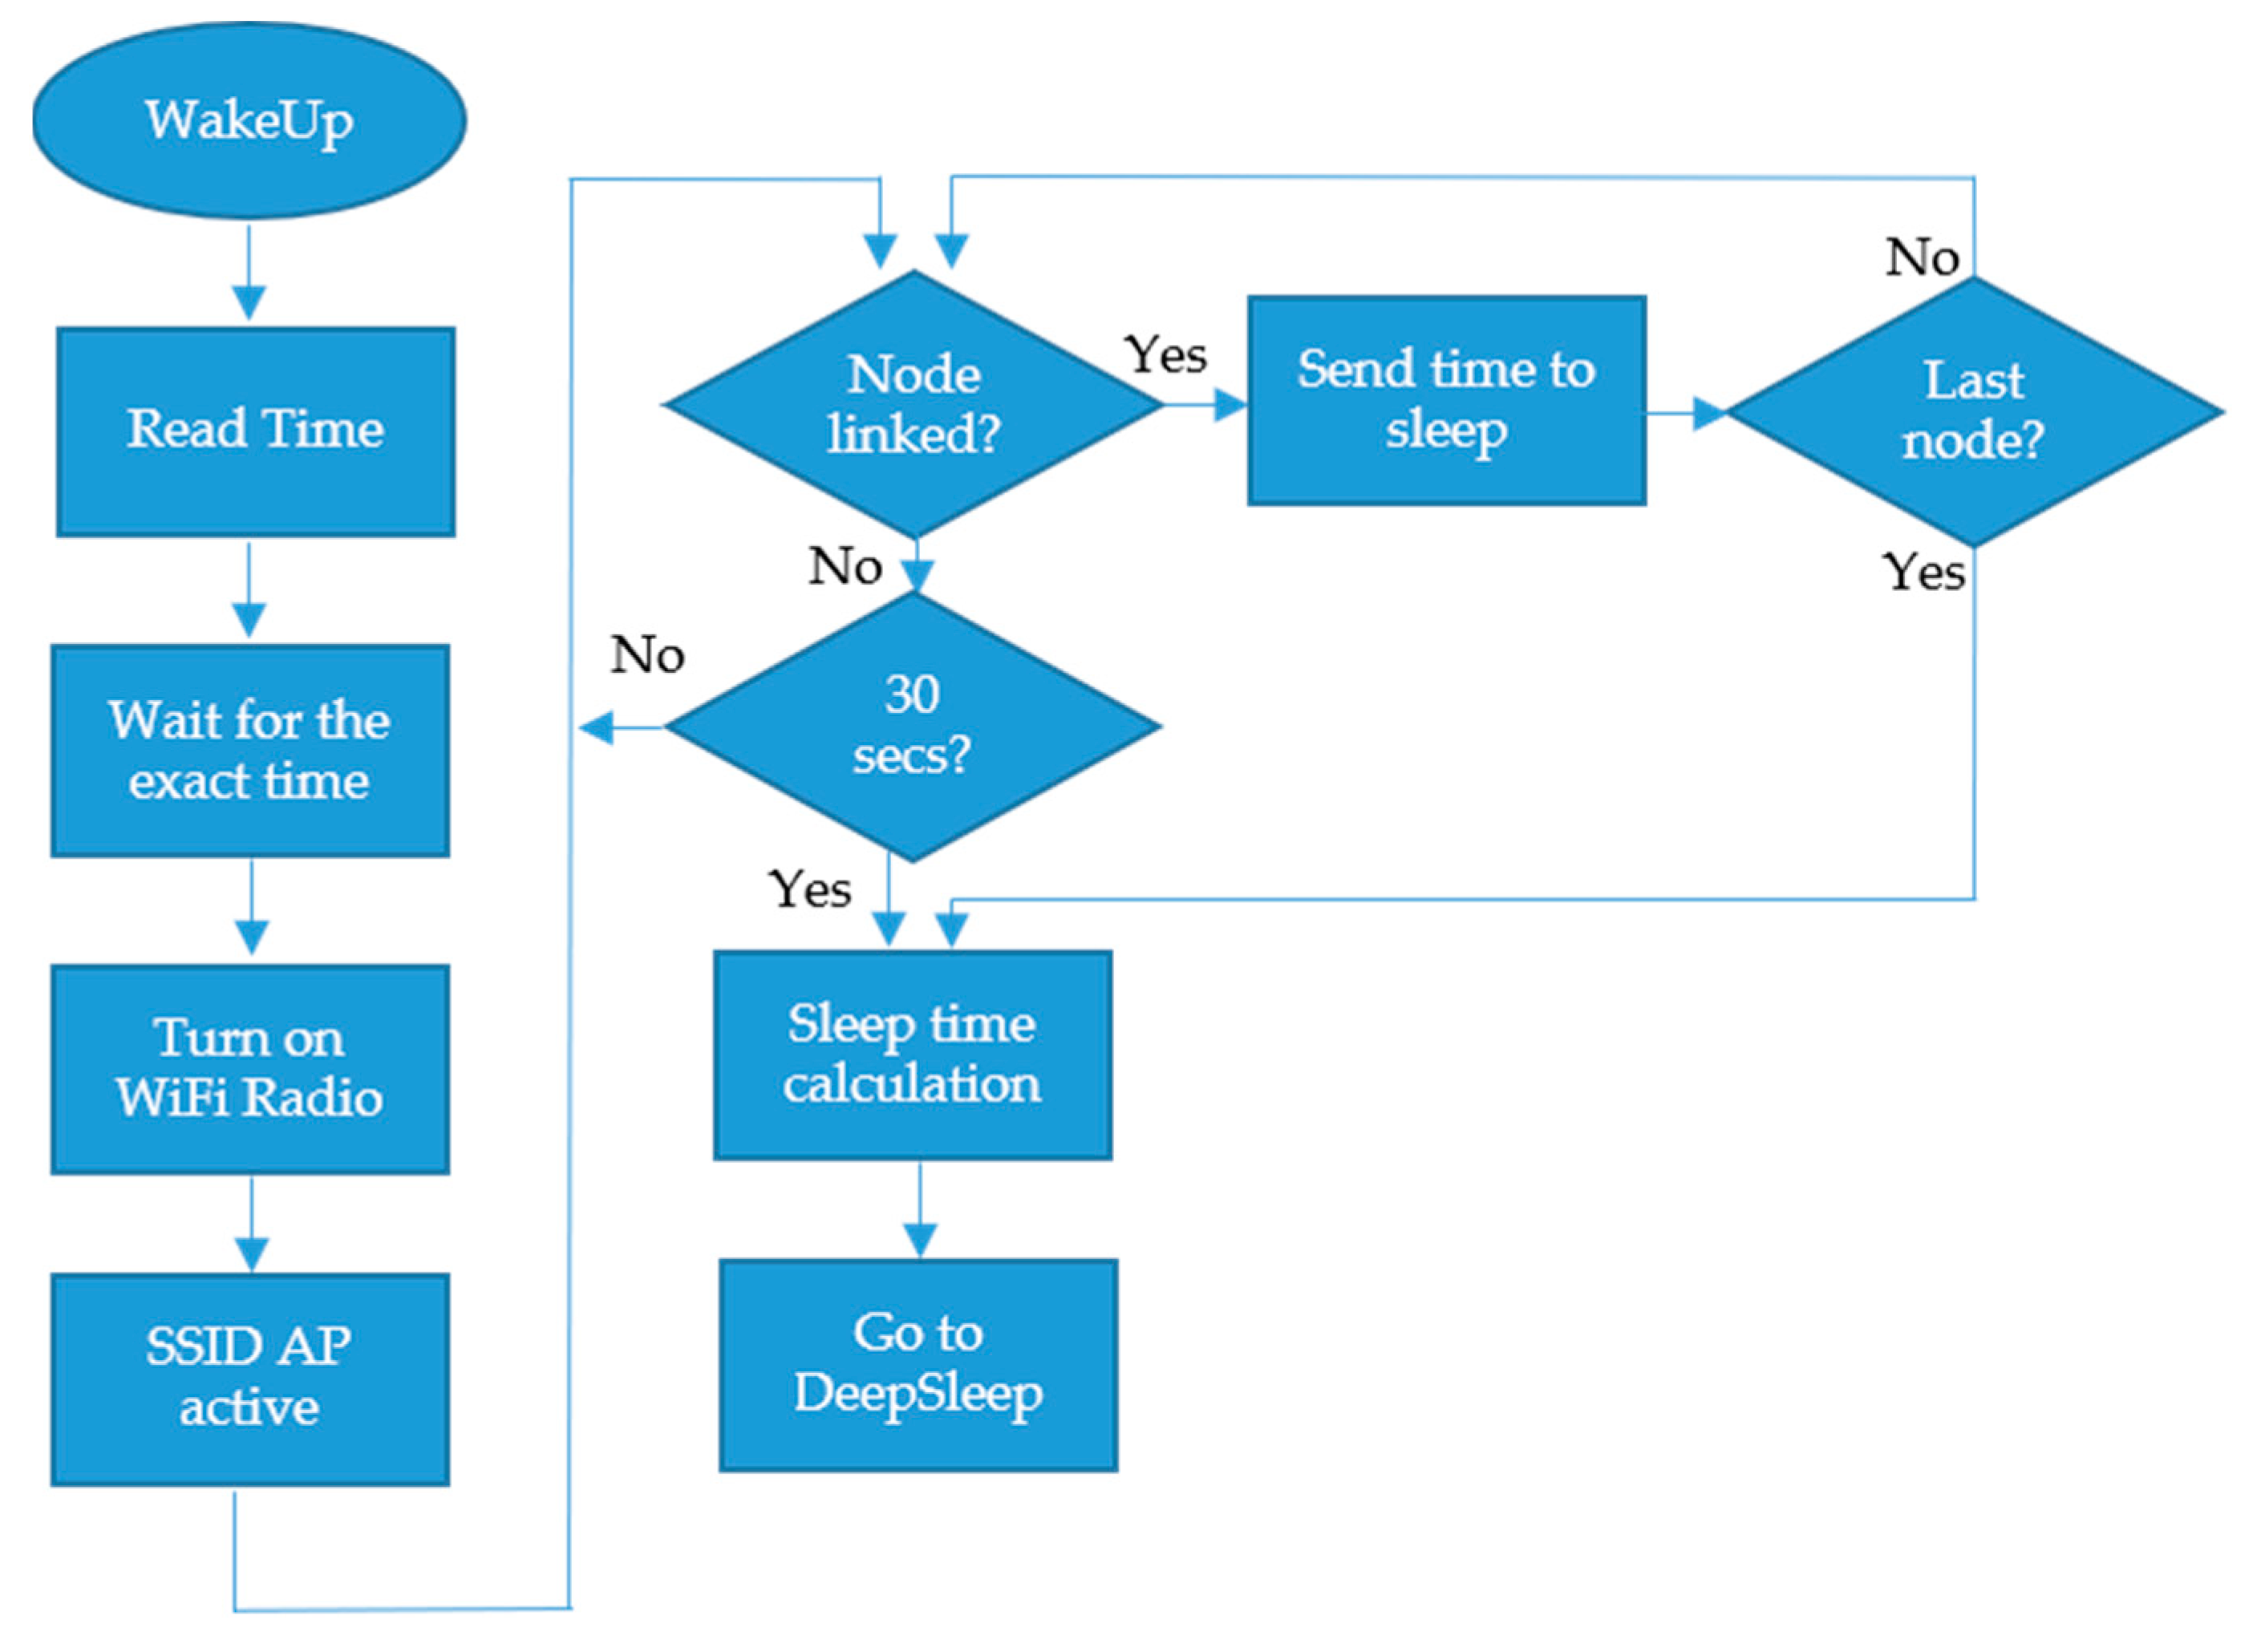
Using Wi-Fi communication for information exchange is very convenient due to the high compatibility and the large amount of Wi-Fi equipment available. However, the high consumption of this type of communication makes it necessary to incorporate energy managers to optimize battery life. The best way to reduce the power consumption of Wi-Fi transceivers is to reduce the time they must be online to send and receive information.
Regarding this issue, a time-synchronization algorithm was developed, so that the sensor nodes and the gateway nodes are synchronized with each other minimizing the connection time between them. The time pattern is always handled by the gateway node since it must “wait” for the sensor nodes to connect and send the information. The flowchart of the algorithm is presented in
Figure 9.
5.3. Communications
To optimize the time that the process is involved in the communication procedure, sockets over TCP are used for sending/receiving information to/from the server.
As mentioned in
Section 3, the gateway node can be used as a stand-alone sensor device that performs socket communication with the server through GPRS/SigFox/LTE networks or, in addition, used as an access point Wi-Fi server for reception data messages from sensor nodes.
The information frames generated from the sensor nodes are sent directly to the database server if there is a recorded SSID available. Otherwise, the information is sent through the gateway. In this situation, the information registered by the nodes is carried out through an internal IP enabled by the gateway (192.168.4.1) common to all the slave nodes that communicate with the outside through it. In this case, the gateway node receives and coordinates the information from the slave nodes, synchronizing in each communication the “time-synchronization” slot and creating the necessary frames for the socket of the server that hosts the data.
Table 1 shows the format of the data frames sent by the gateway node to the server once the information from four Slave nodes distributed and connected to the generated access point was received.
After the data frames are sent and ACK from the server is received, the gateway node sends the timestamp in Unix epoch format and the geolocation coordinates using the engineering mode of the SIM800 to get detailed network information [
53].
5.4. Remote Setup
Remote setup is a critical procedure for easy operational management of the devices. Bluetooth BLE was used to carry out the programming of the setup parameters since ESP32 incorporates BLE and personal devices, such as smartphones or tablets, also feature this technology. Consequently, BLE can easily be used by the operator as a tool for setting up the nodes. Configuration parameters include operating values such as the sampling period, cloud data storage and the SSIDs and passwords of the Wi-Fi networks through which the nodes are connected in the different locations of the transported product. These data can also be inserted using QR codes.
The node activates the BLE reception after a push-button is pressed that enables the transfer of data from an APP that uses the Bluetooth services of the device on which it is installed (see
Figure 10).
6. Test Methodology
The performance of the system cannot only be exclusively described by the correct measurement of the parameters, it has to be subjected to different temperature and humidity conditions of the storage and transport rooms, which affect the transmission performance and energy autonomy.
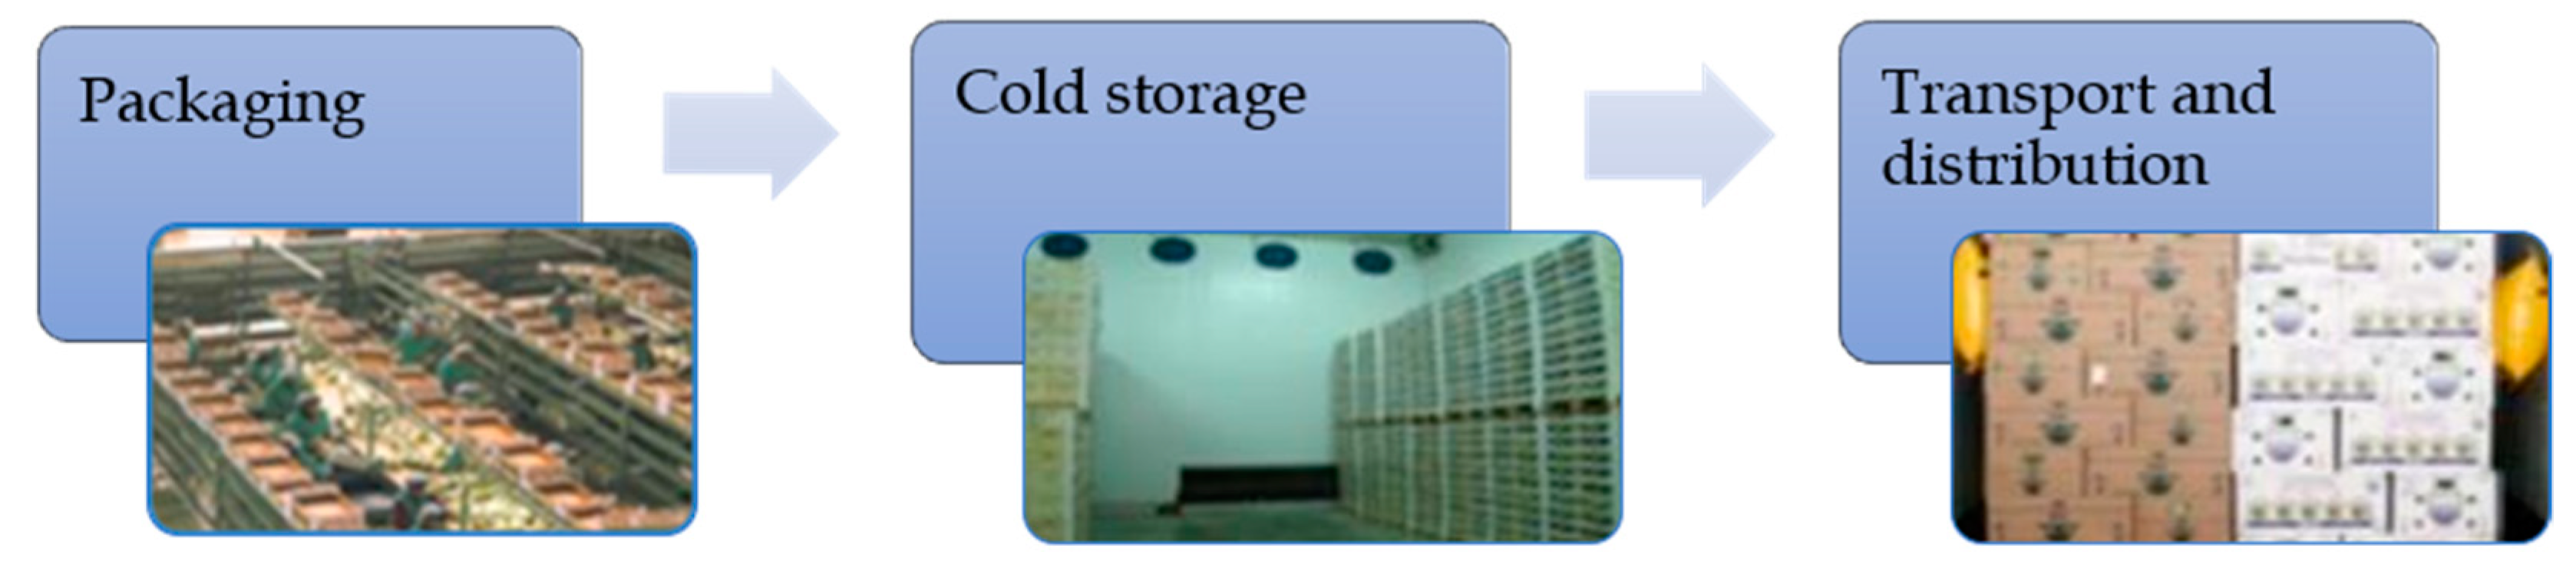
Tests were carried out with the designed devices installed with different master-slave or slave-only configurations in three stages of the distribution process of the commodities: (i) center for sorting and packaging after harvest, (ii) cold storage and (iii) transportation and distribution stages (see
Figure 11).
The center for sorting and packaging where the devices were installed was Fruca Marketing (Ctra. Fuente Álamo, km 6, 30,332 Balsapintada, Murcia, Spain). The devices were configurated with Wi-Fi network provided by the company.
Cold storage tests were carried out in the Intituto de Biotecnologia Vegetal facilities (IBV–Campus Muralla del Mar 30202, Cartagena, Murcia).
Finally, the land transport trials were carried out on several trips where the devices were installed at strategic points in the refrigerated cabin. The transports to different locations in Europe were carried out by the companies Transportes Mesa (Calle Los Carriones, 20, 30,594 Cartagena, Murcia) and Transportes el Segura (Poligono Industrial de Lorqui, S/N, Lorqui, Murcia). The setpoint temperatures were 10, 5 and 2.5 °C to check the operation and thermal distribution in the different locations of the devices.
7. Results
7.1. Performance of the Communication System
Six trials were conducted for communication testing purposes. Lettuces were used as a model of perishable food to be monitored in the trials, which lasted 10–12 days approximately. Trials 1 to 4 used two slave nodes for the three stages and one gateway node to provide internet access during the transportation and distribution stage. Trials 5 and 6 used three slave nodes during the three stages connected to several Wi-Fi networks previously configured in the setup file of the nodes. The devices were deployed at different places inside the commodities boxes. To check the communication performance in the different tests, the device records in the SD card packets, which were successfully sent at their corresponding sampling time (received packet). When the communication is unsuccessful, the device records the frame to send it later, and in that case, the attempt is marked as lost packet in order to evaluate the success rate in the communication tests of the devices in the different trials.
Table 2 shows the total amount of data monitored and sent successfully to the server.
The ratio between received and lost data packets shows the communication performance. Although lost data were recovered as soon as the nodes restored Internet access, the valid data ratio demonstrates that Wi-Fi can be used as a communication carrier in these processes.
Wireless transmission performance at 2.4 GHz frequencies, such as those used in Wi-Fi, is influenced by temperature and humidity conditions [
58,
59].
These disturbances were reflected in the tests by some inter-sensor sending rates. However, 14 of the 18 tests that were carried out in temperature conditions between 10 and 2 °C had performance rates above 90%, which supports the use of this wireless transmission technique for the specific conditions of transport and storage of perishable products. However, it should be noted that non-communicated data are stored internally by the nodes and sent later when conditions are suitable.
7.2. Energy Management
Energy management is also a key factor in highly temperature-dependent and humidity-dependent conditions. The operational duration of the nodes depends on the capacity of the battery and the sampling period, so the analysis of the energy behavior of the node in an operational cycle is representative of the energy expenditure of the node in operational conditions. A digital power meter Yokowaga WT210 (Musashino, Tokio, Japan) was used for energy monitoring of the nodes.
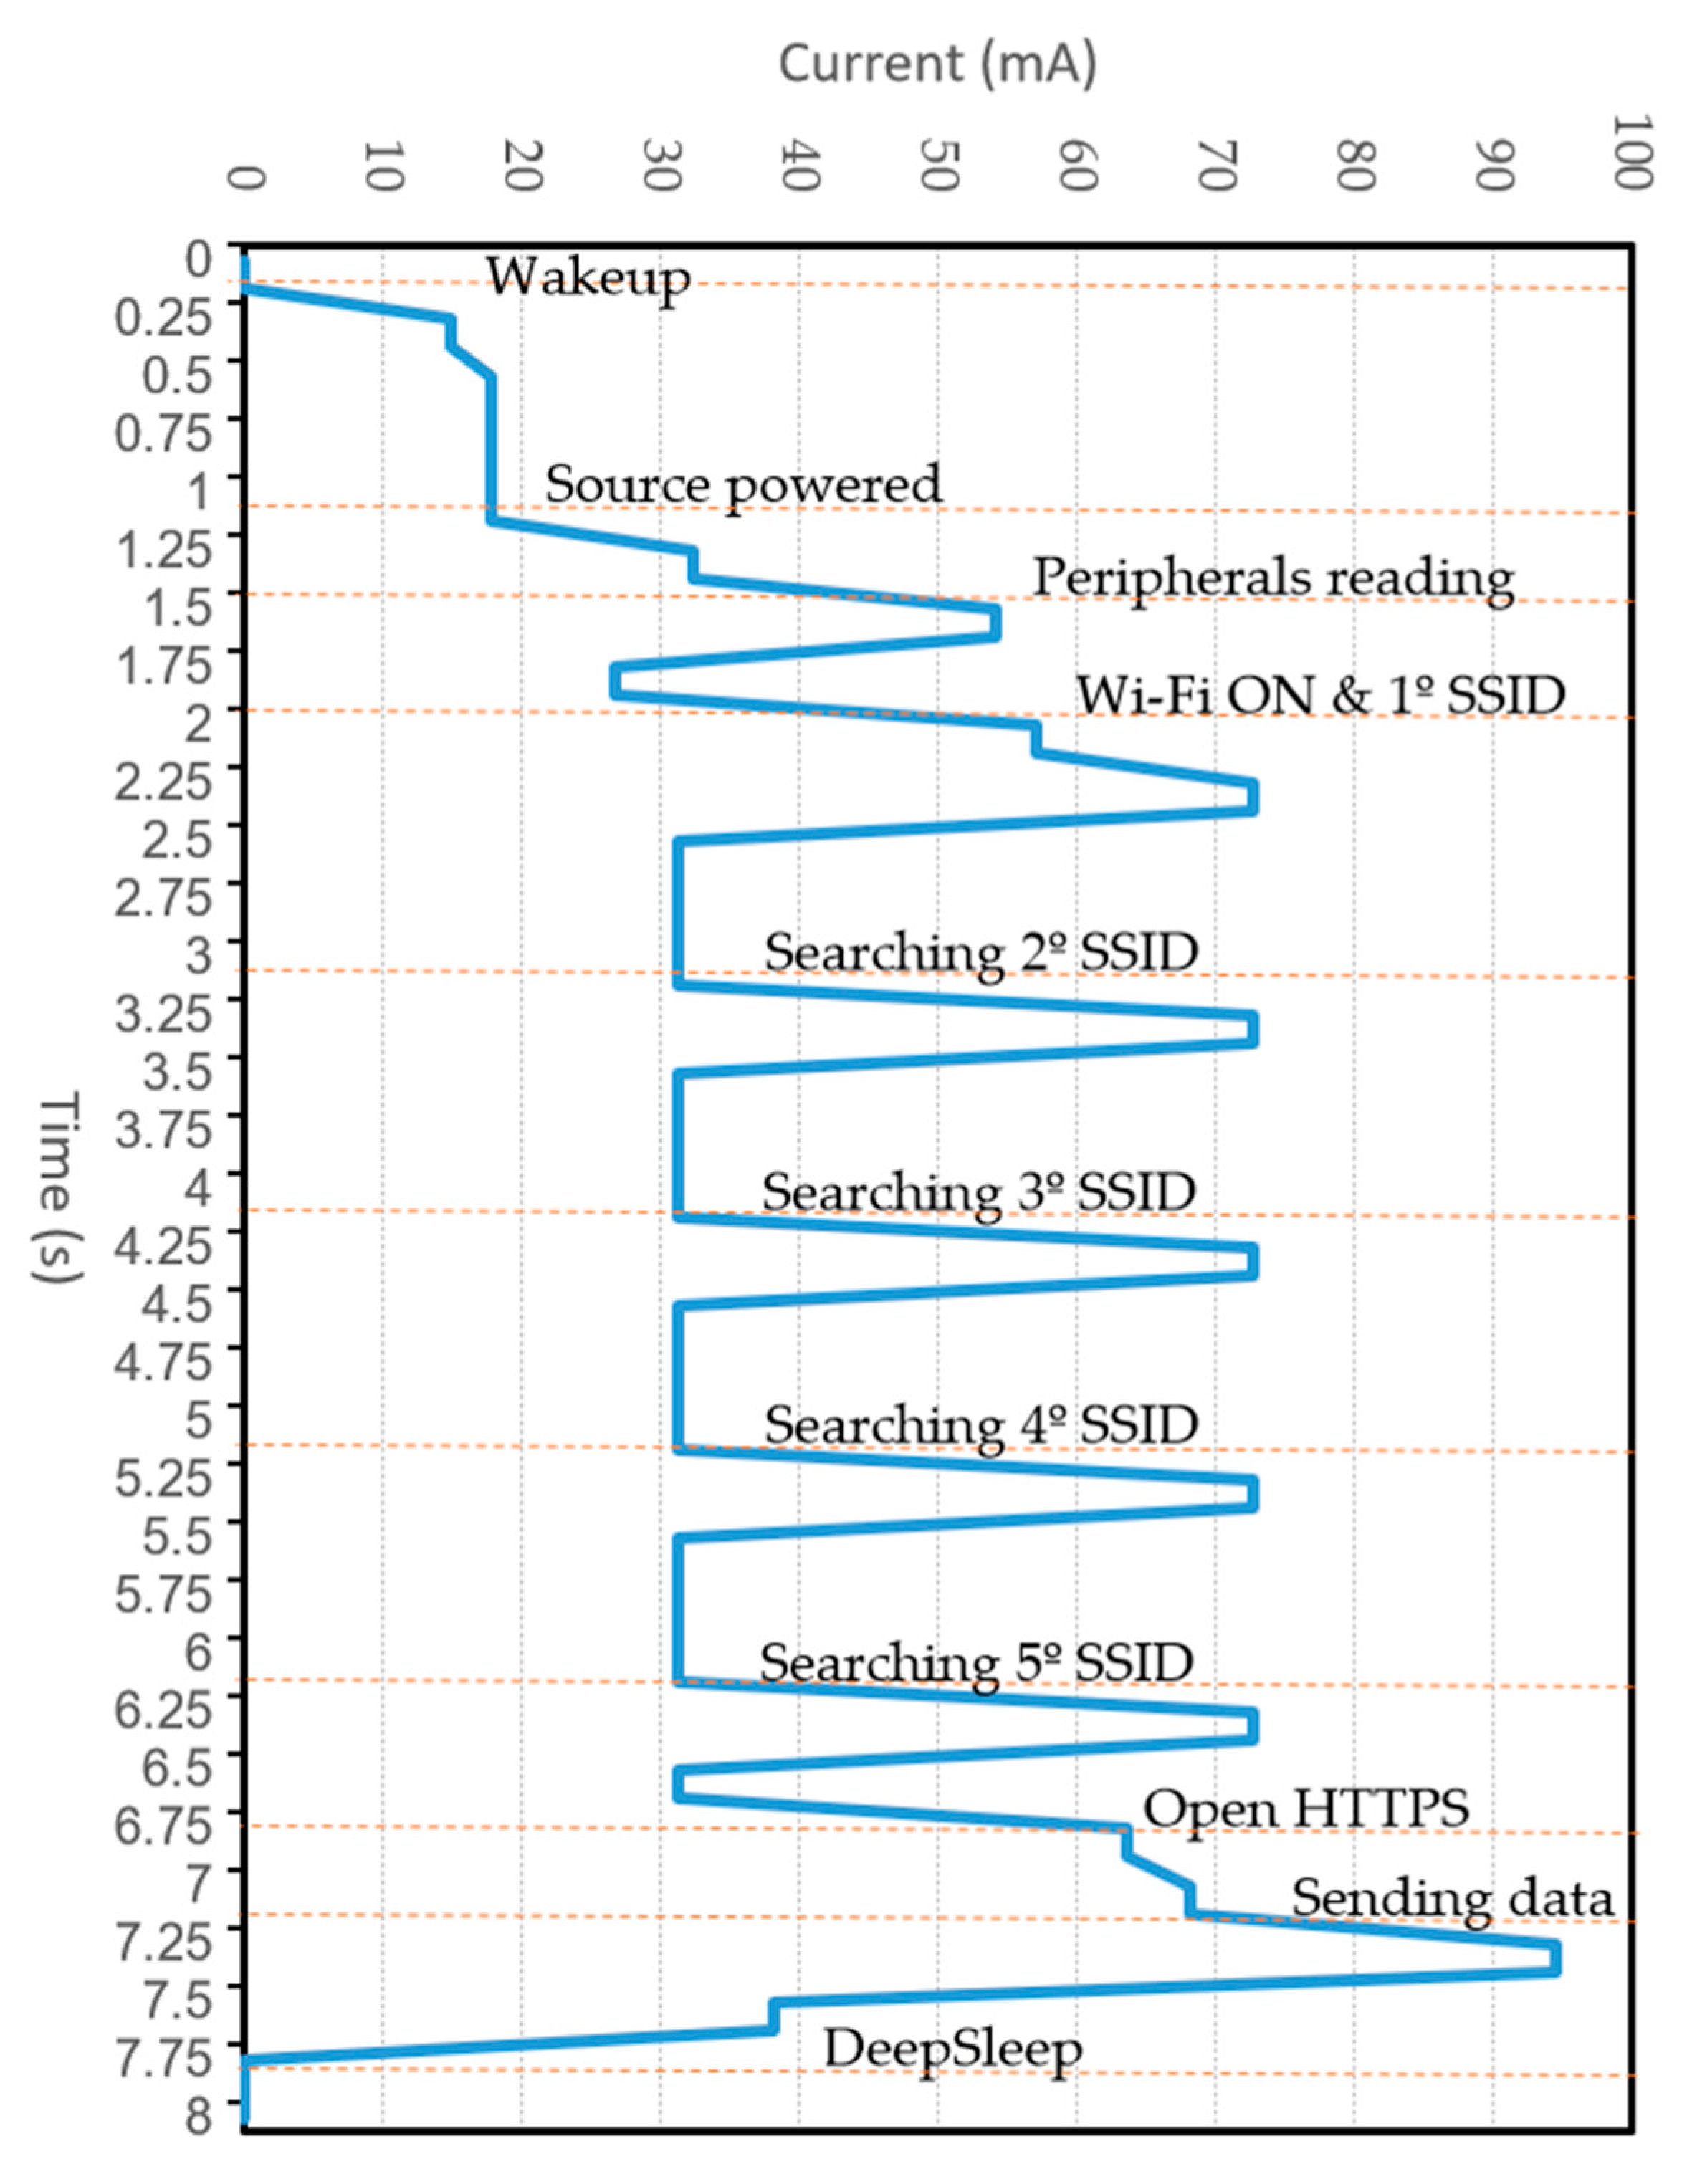
Wi-Fi SSID searching and data sending to the cloud server are the processes with the greatest consumption in the sensor node. In order to calculate the energy consumption in the worst scenario, the sensor node was programmed with five SSID, but only the last one was available. The different modes and routines are described in
Figure 12.
A large part of the consumption in each sampling cycle depends on the attempts to connect to the available communication network (
Figure 12). For this reason, proper management of the networks allows for a reduction in energy consumption.
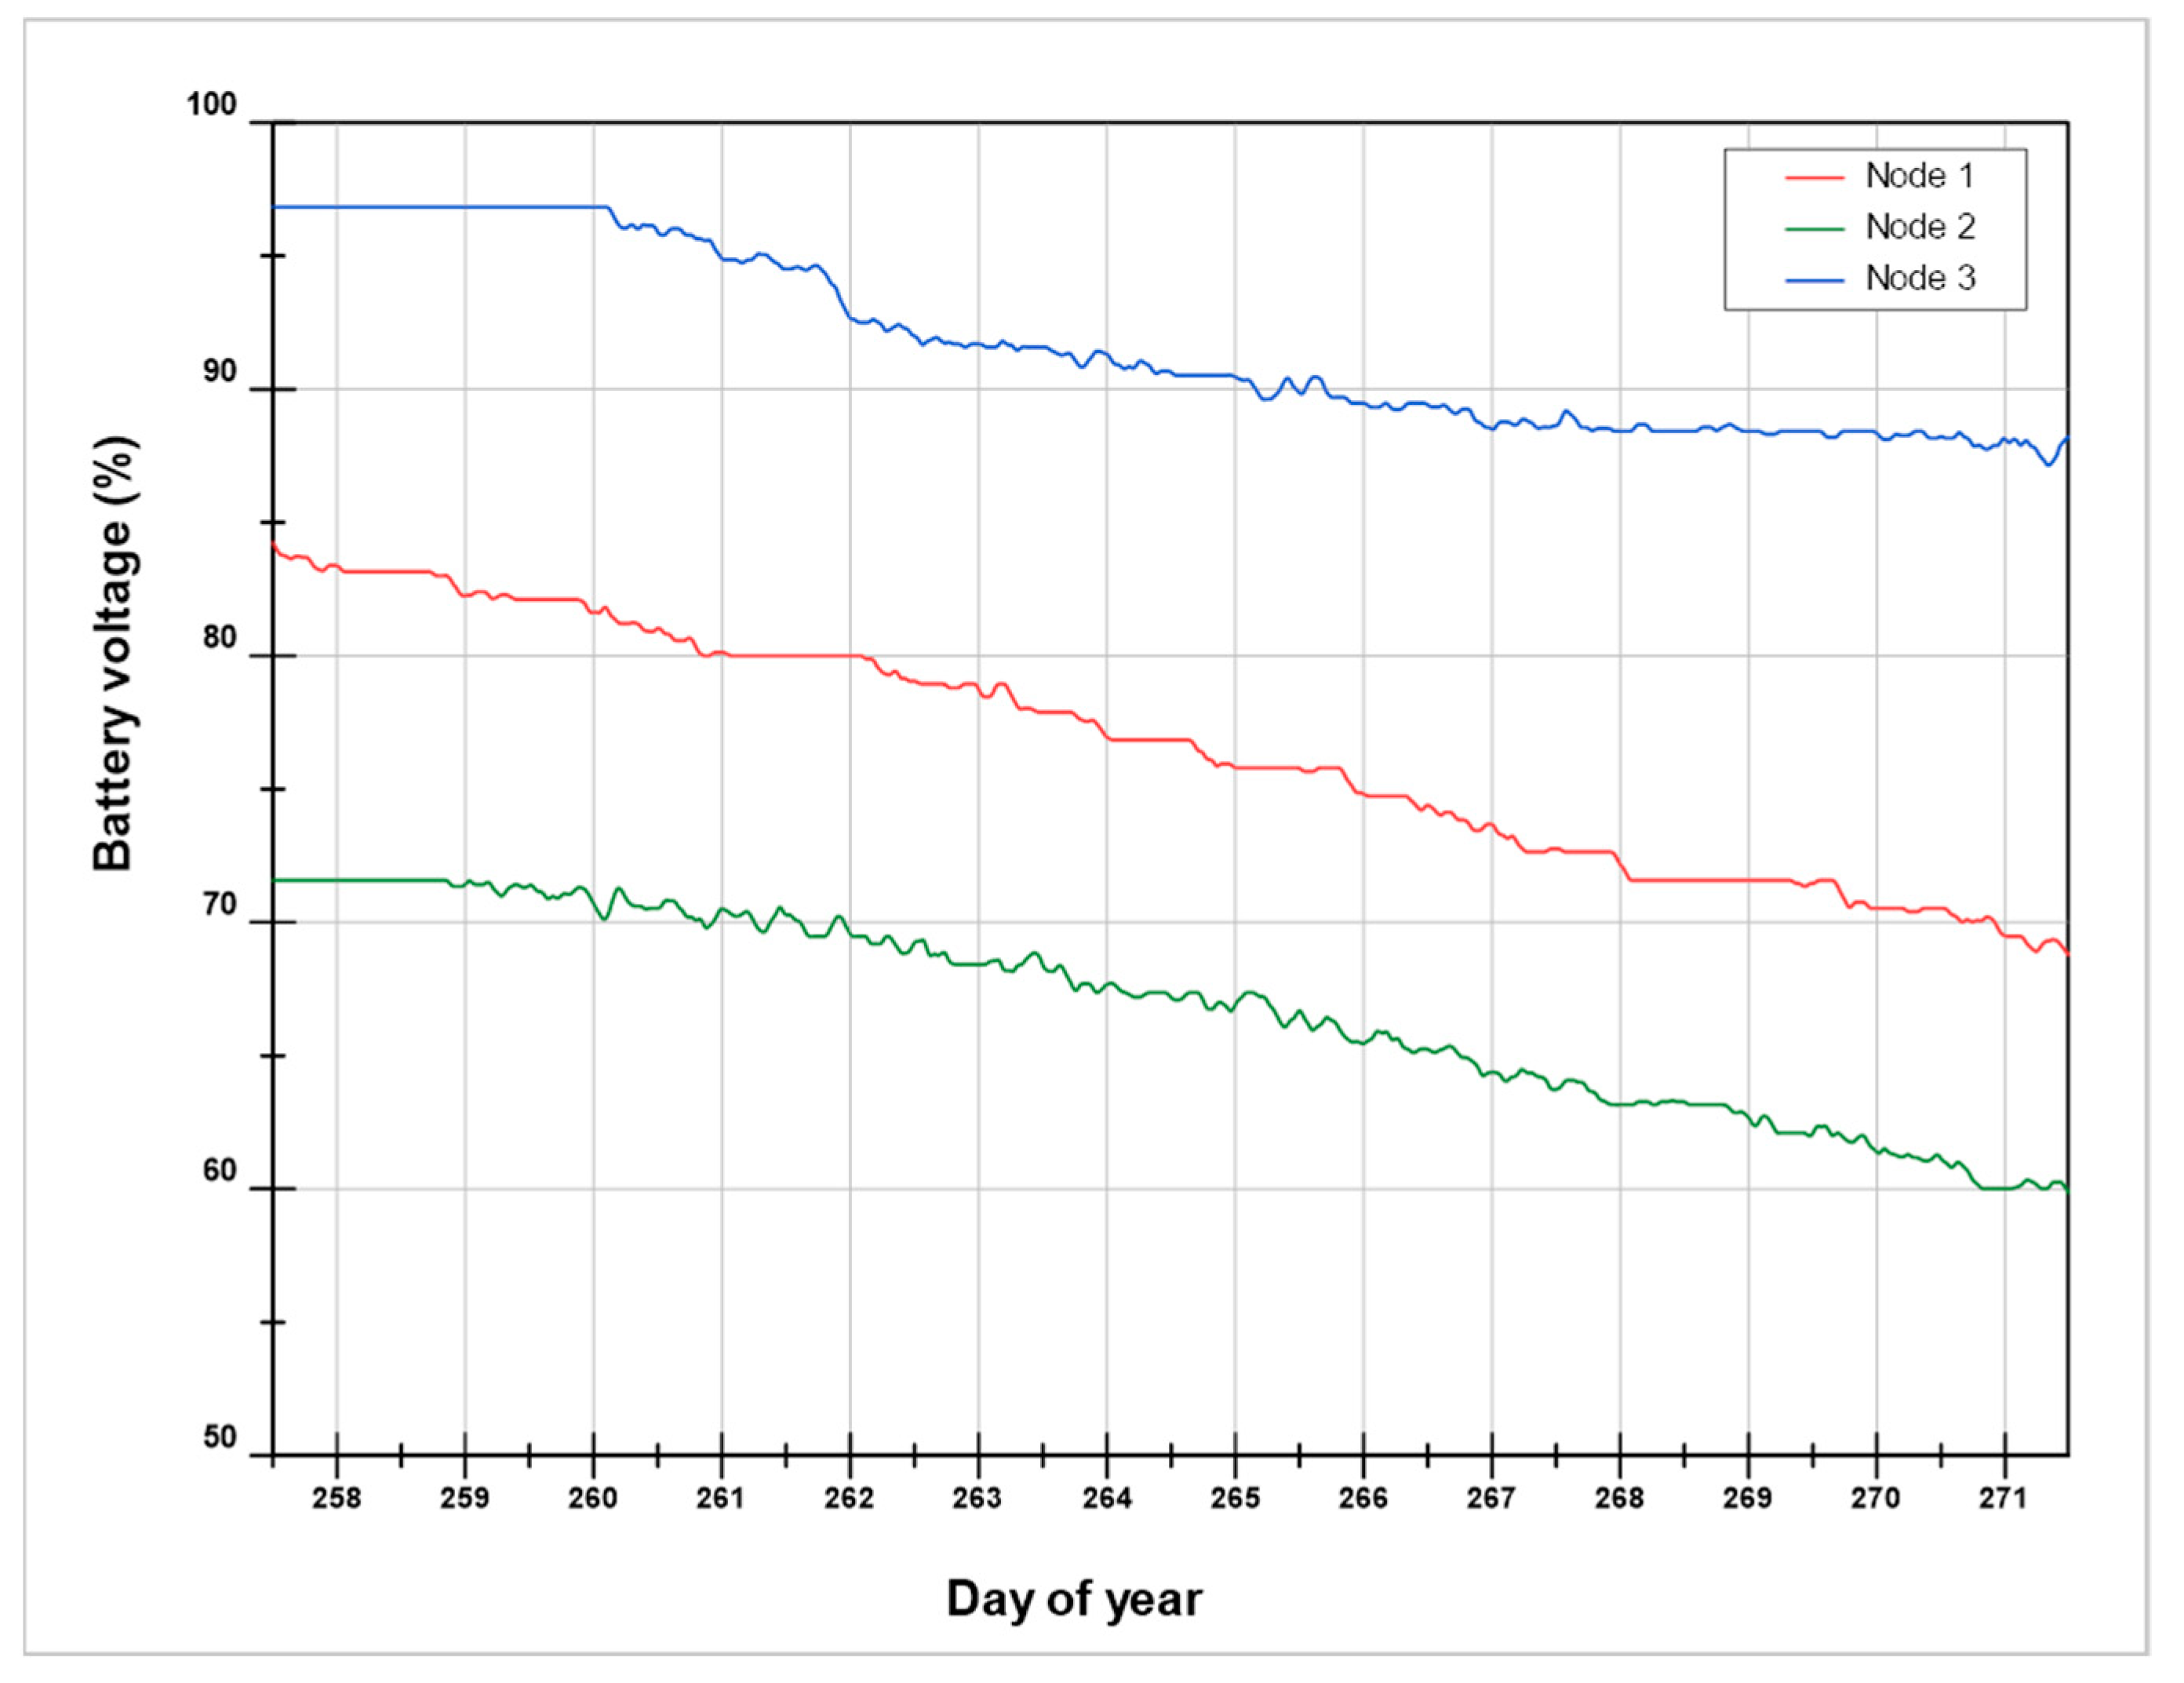
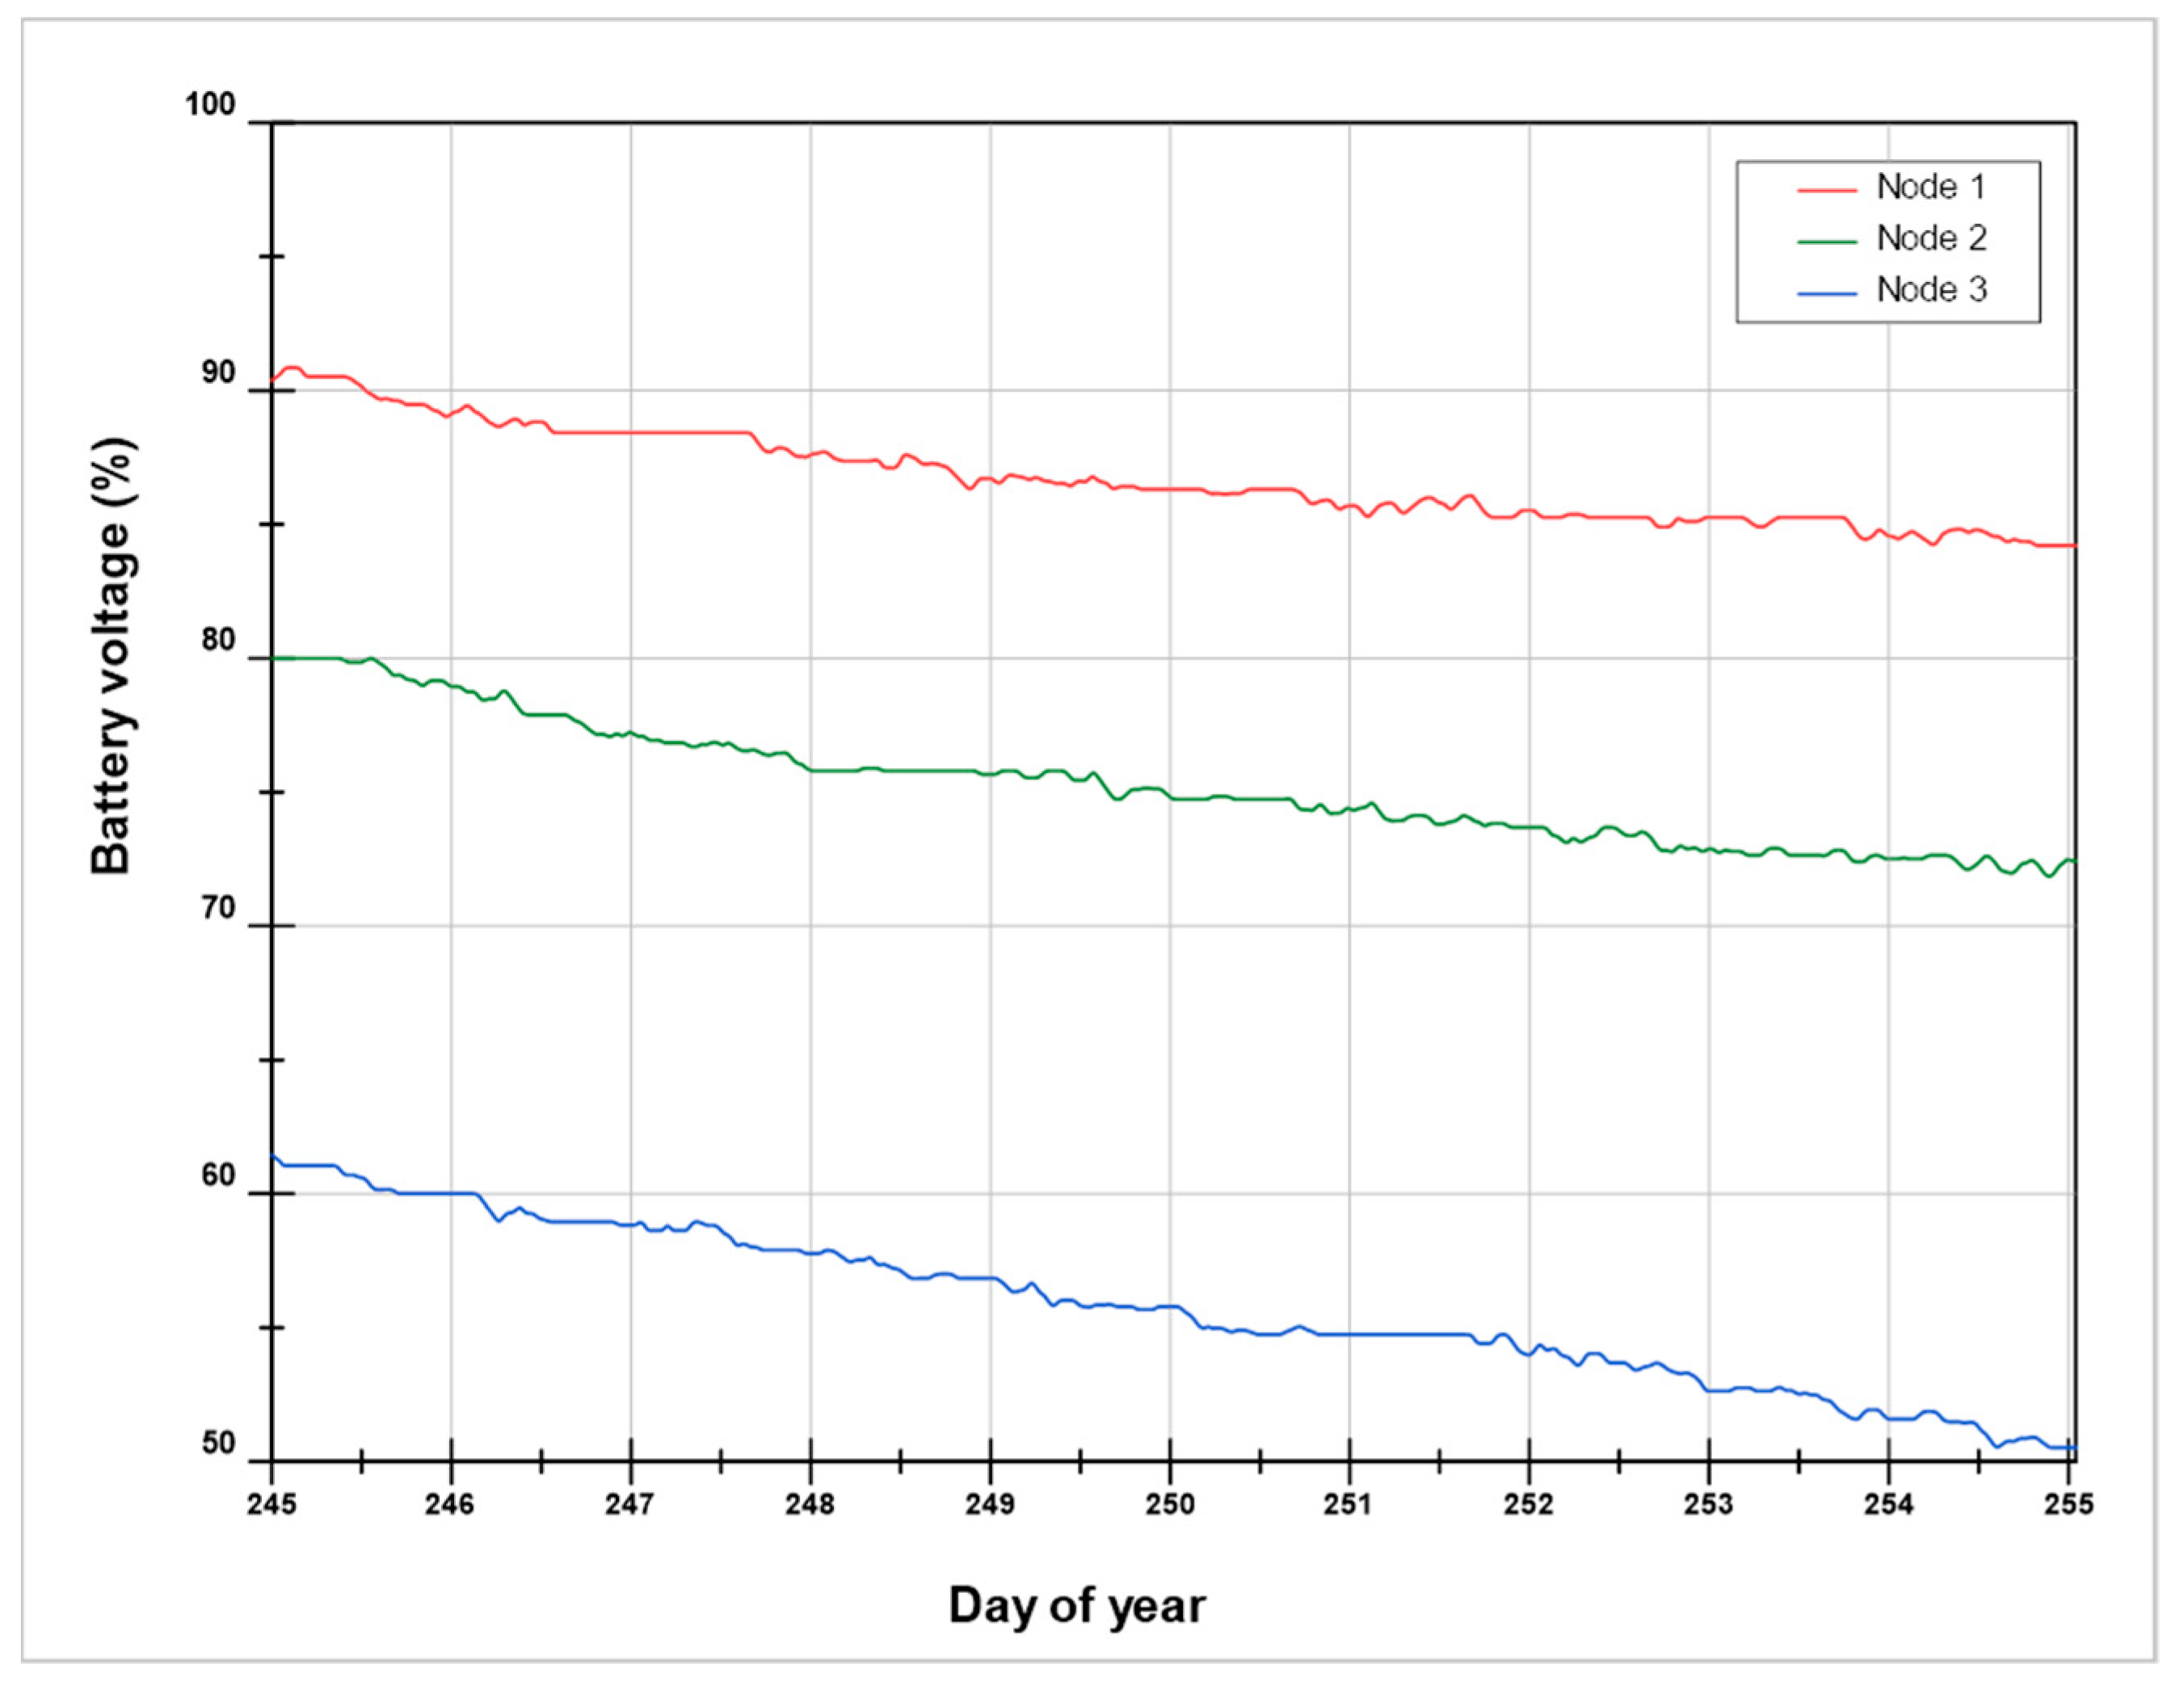
During the tests carried out at land transport, different conditions of communication losses with the gateway were observed, as shown in
Table 2. The environmental conditions and the location of each node within the transport cabin influence the communication quality and the power consumption.
Figure 13 and
Figure 14 show the results of the evolution of the voltage during trials 5 and 6, where the different slopes and voltage variations can be seen in accordance with the communication packets lost due to not being able to connect to the first network and trying to connect to the five access points available in the list.
7.3. Temperature Measuring Performance
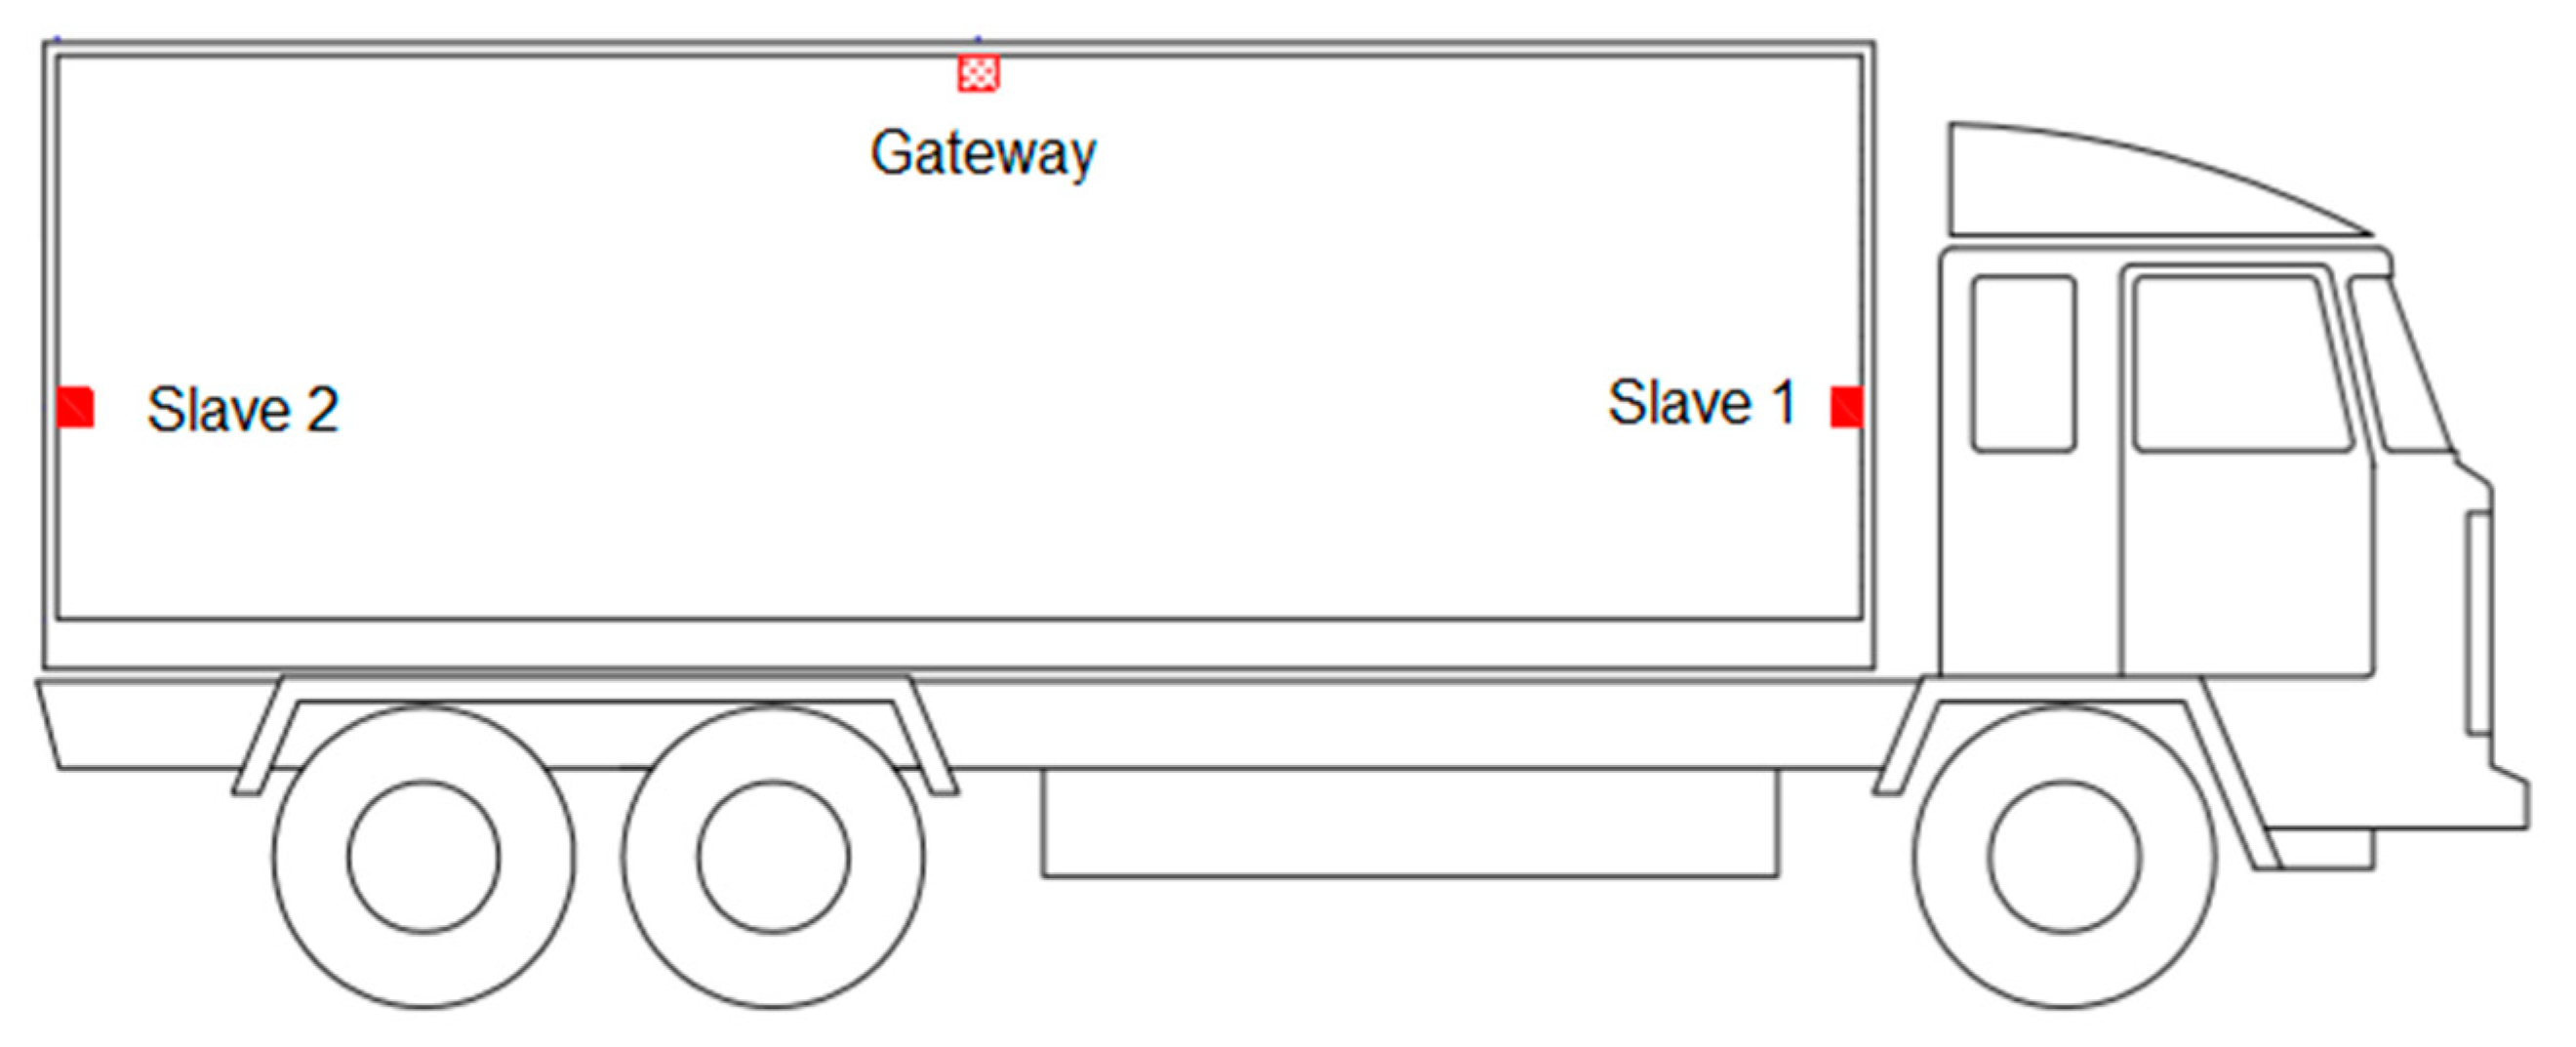
The system was tested in real conditions for one month. The commodities were placed in a cold storage room and a land transport container. Three different setpoint temperatures, at 10, 5 and 2 °C, were selected for system performance purposes. Two slave nodes placed in different locations inside the container were used. Position 1 was placed just below the evaporator of the freezer, and position 2 was placed at the back of the container on the opening doors. A gateway node was used to communicate the data (see
Figure 15).
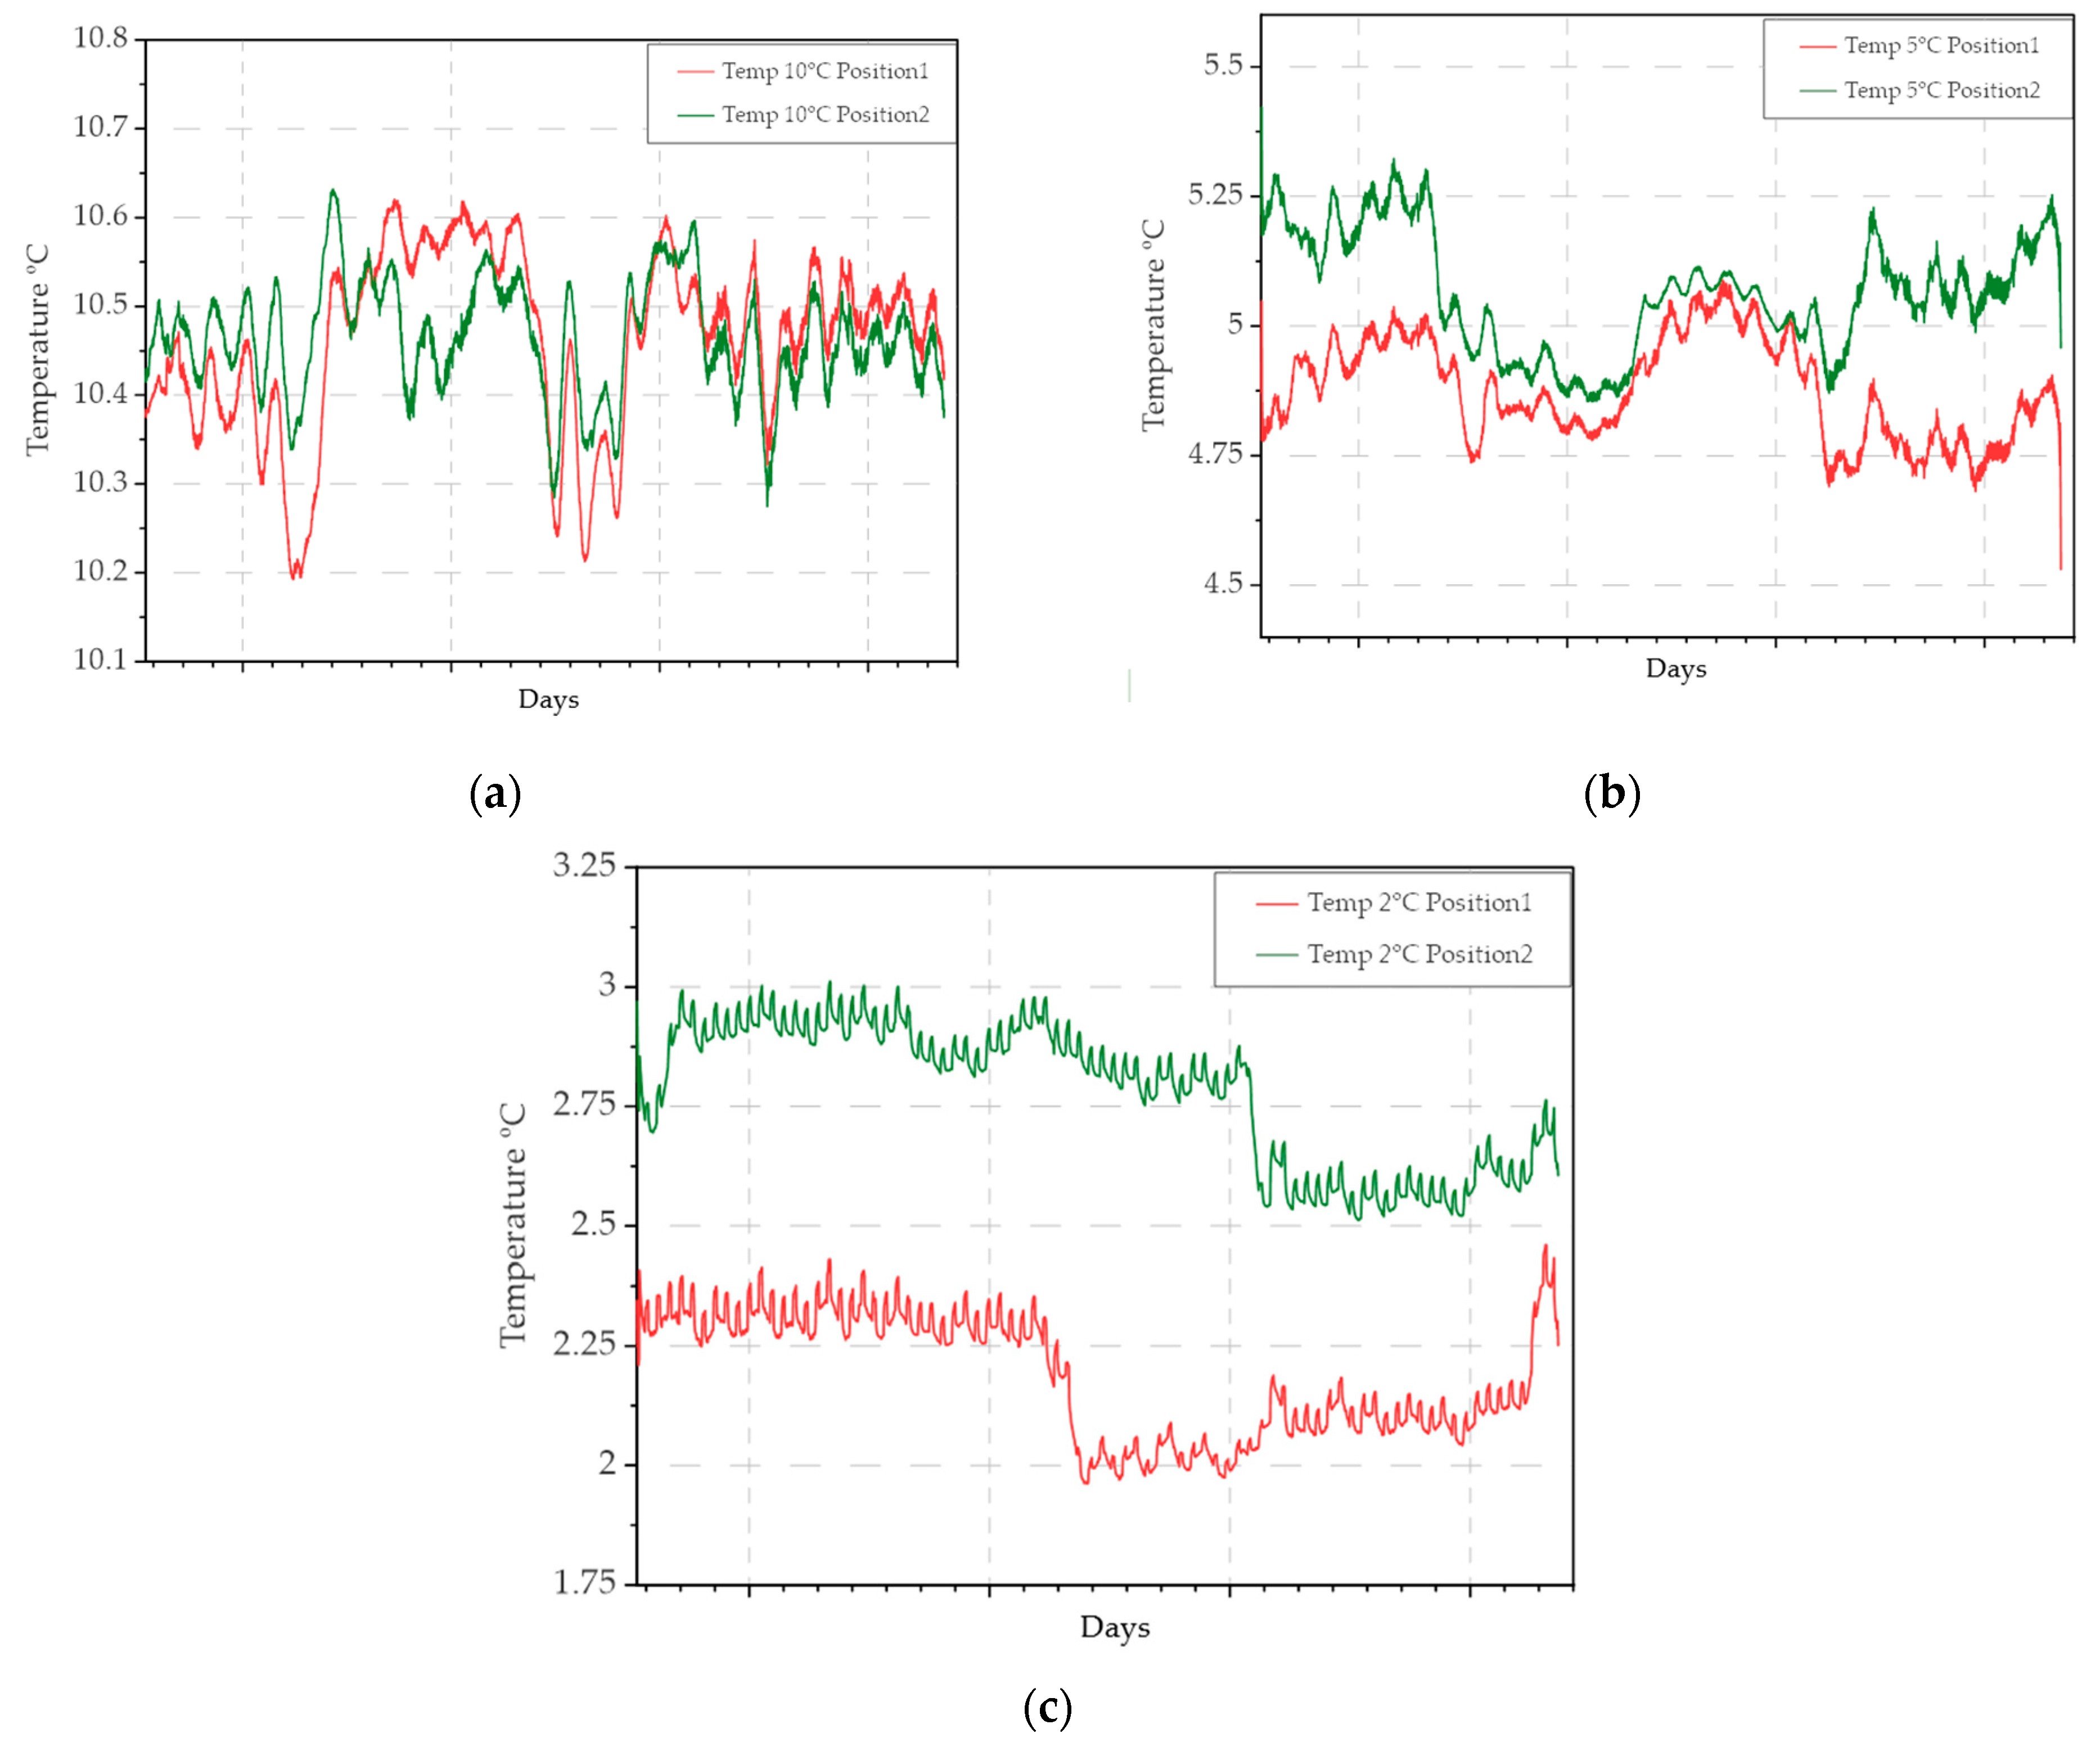
Charts in
Figure 16 show the performance of the system. A temperature difference can be observed between the node positions. This difference is due to the different storage and transport conditions of the pallets containing the commodities.
8. Conclusions
During storage and transportation of perishable commodities, several environmental factors should be kept within recommended thresholds to preserve quality throughout the supply chain, maximizing their shelf life. Temperature is the most important environmental factor affecting quality; however, most of the temperature control systems used in transportation media do not have multi-point measurement and temperature-recording systems, which are based on temperature cards or tags, and also do not have real-time communication protocols to know the conditions in which the commodities are being stored.
Due to the thermal differences observed in the tests, the real-time knowledge of such conditions during storage and transportation can be used not only as a warning mechanism, but also as a tool for predicting shelf life.
In this sense, a portable, multi-configurable system with real-time communication is presented in this paper.
The main advantages of the designed system over other similar devices are that it combines the measurement of multiple parameters with the flexibility of sending the measured information through Wi-Fi networks, whose infrastructure is widespread and easy to install. However, the Wi-Fi infrastructure is a broadband network, and therefore, its energy consumption is higher than other wireless technologies such as SigFox, LoRa or ZigBee. Therefore, to be able to use this technology taking advantage of the aforementioned advantages with sufficient autonomy, specific time synchronization algorithms were developed to allow for device usage ranges greater than 28 days.
On the other hand, the temperature and humidity conditions of the different stages of the supply chain affect the quality of data transmission, with tests showing data loss rates of less than 10% even in unfavorable conditions. Temporary storage of unsent data allows data to be sent when transmission conditions are favorable.
The main disadvantage is that the devices cannot be used for maritime transport as designed. The metal containers typically used in this type of transport affect the data transmission capacity. This could be solved by installing external antennas, although this would affect the ease of installation of the nodes. On the other hand, in the ocean there is no coverage for networks such as Sigfox, LoRa or NB-IoT, but ships usually have Wi-Fi communication (with satellite networks such as Iridium), so the nodes described in this article could be valid for this type of transport.
Regarding the use of the system by the agents involved in the supply chain, the main drawback observed was the programming of the nodes with the different networks (SSIDs and passwords) that the commodities were going to travel through during the journey from the harvest to the warehouse. This problem was solved by means of the APP, which allows the nodes to be programmed in an intuitive way with the different configurations. However, the input of the information is manual, and errors can be made that can cause the system to malfunction. For this reason, in future work, we proposed to improve the configuration system by using QR coding associated with the product and the route it will follow to the destination, making it unlikely that errors will be made when entering the information of the different Wi-Fi networks. On the other hand, the QR coding will allow for access to the traceability of the product conditions during the whole process. As future research, further experiments will be conducted to compare our proposal with other systems using different communication technologies.
9. Patents
The system has been patented in Spain (Registration number: ES201730301A). ‘Dispositivo, sistema y método de monitorización en tiempo real de las variables físicas y ambientales durante el transporte de mercancías perecederas’.


 ,
, 


