
Severe Reduction of Energy Availability in Controlled Conditions Causes Poor Endurance Performance, Impairs Explosive Power and Affects Hormonal Status in Trained Male Endurance Athletes


Abstract
:Featured Application
Abstract
1. Introduction
2. Materials and Methods
2.1. Participants
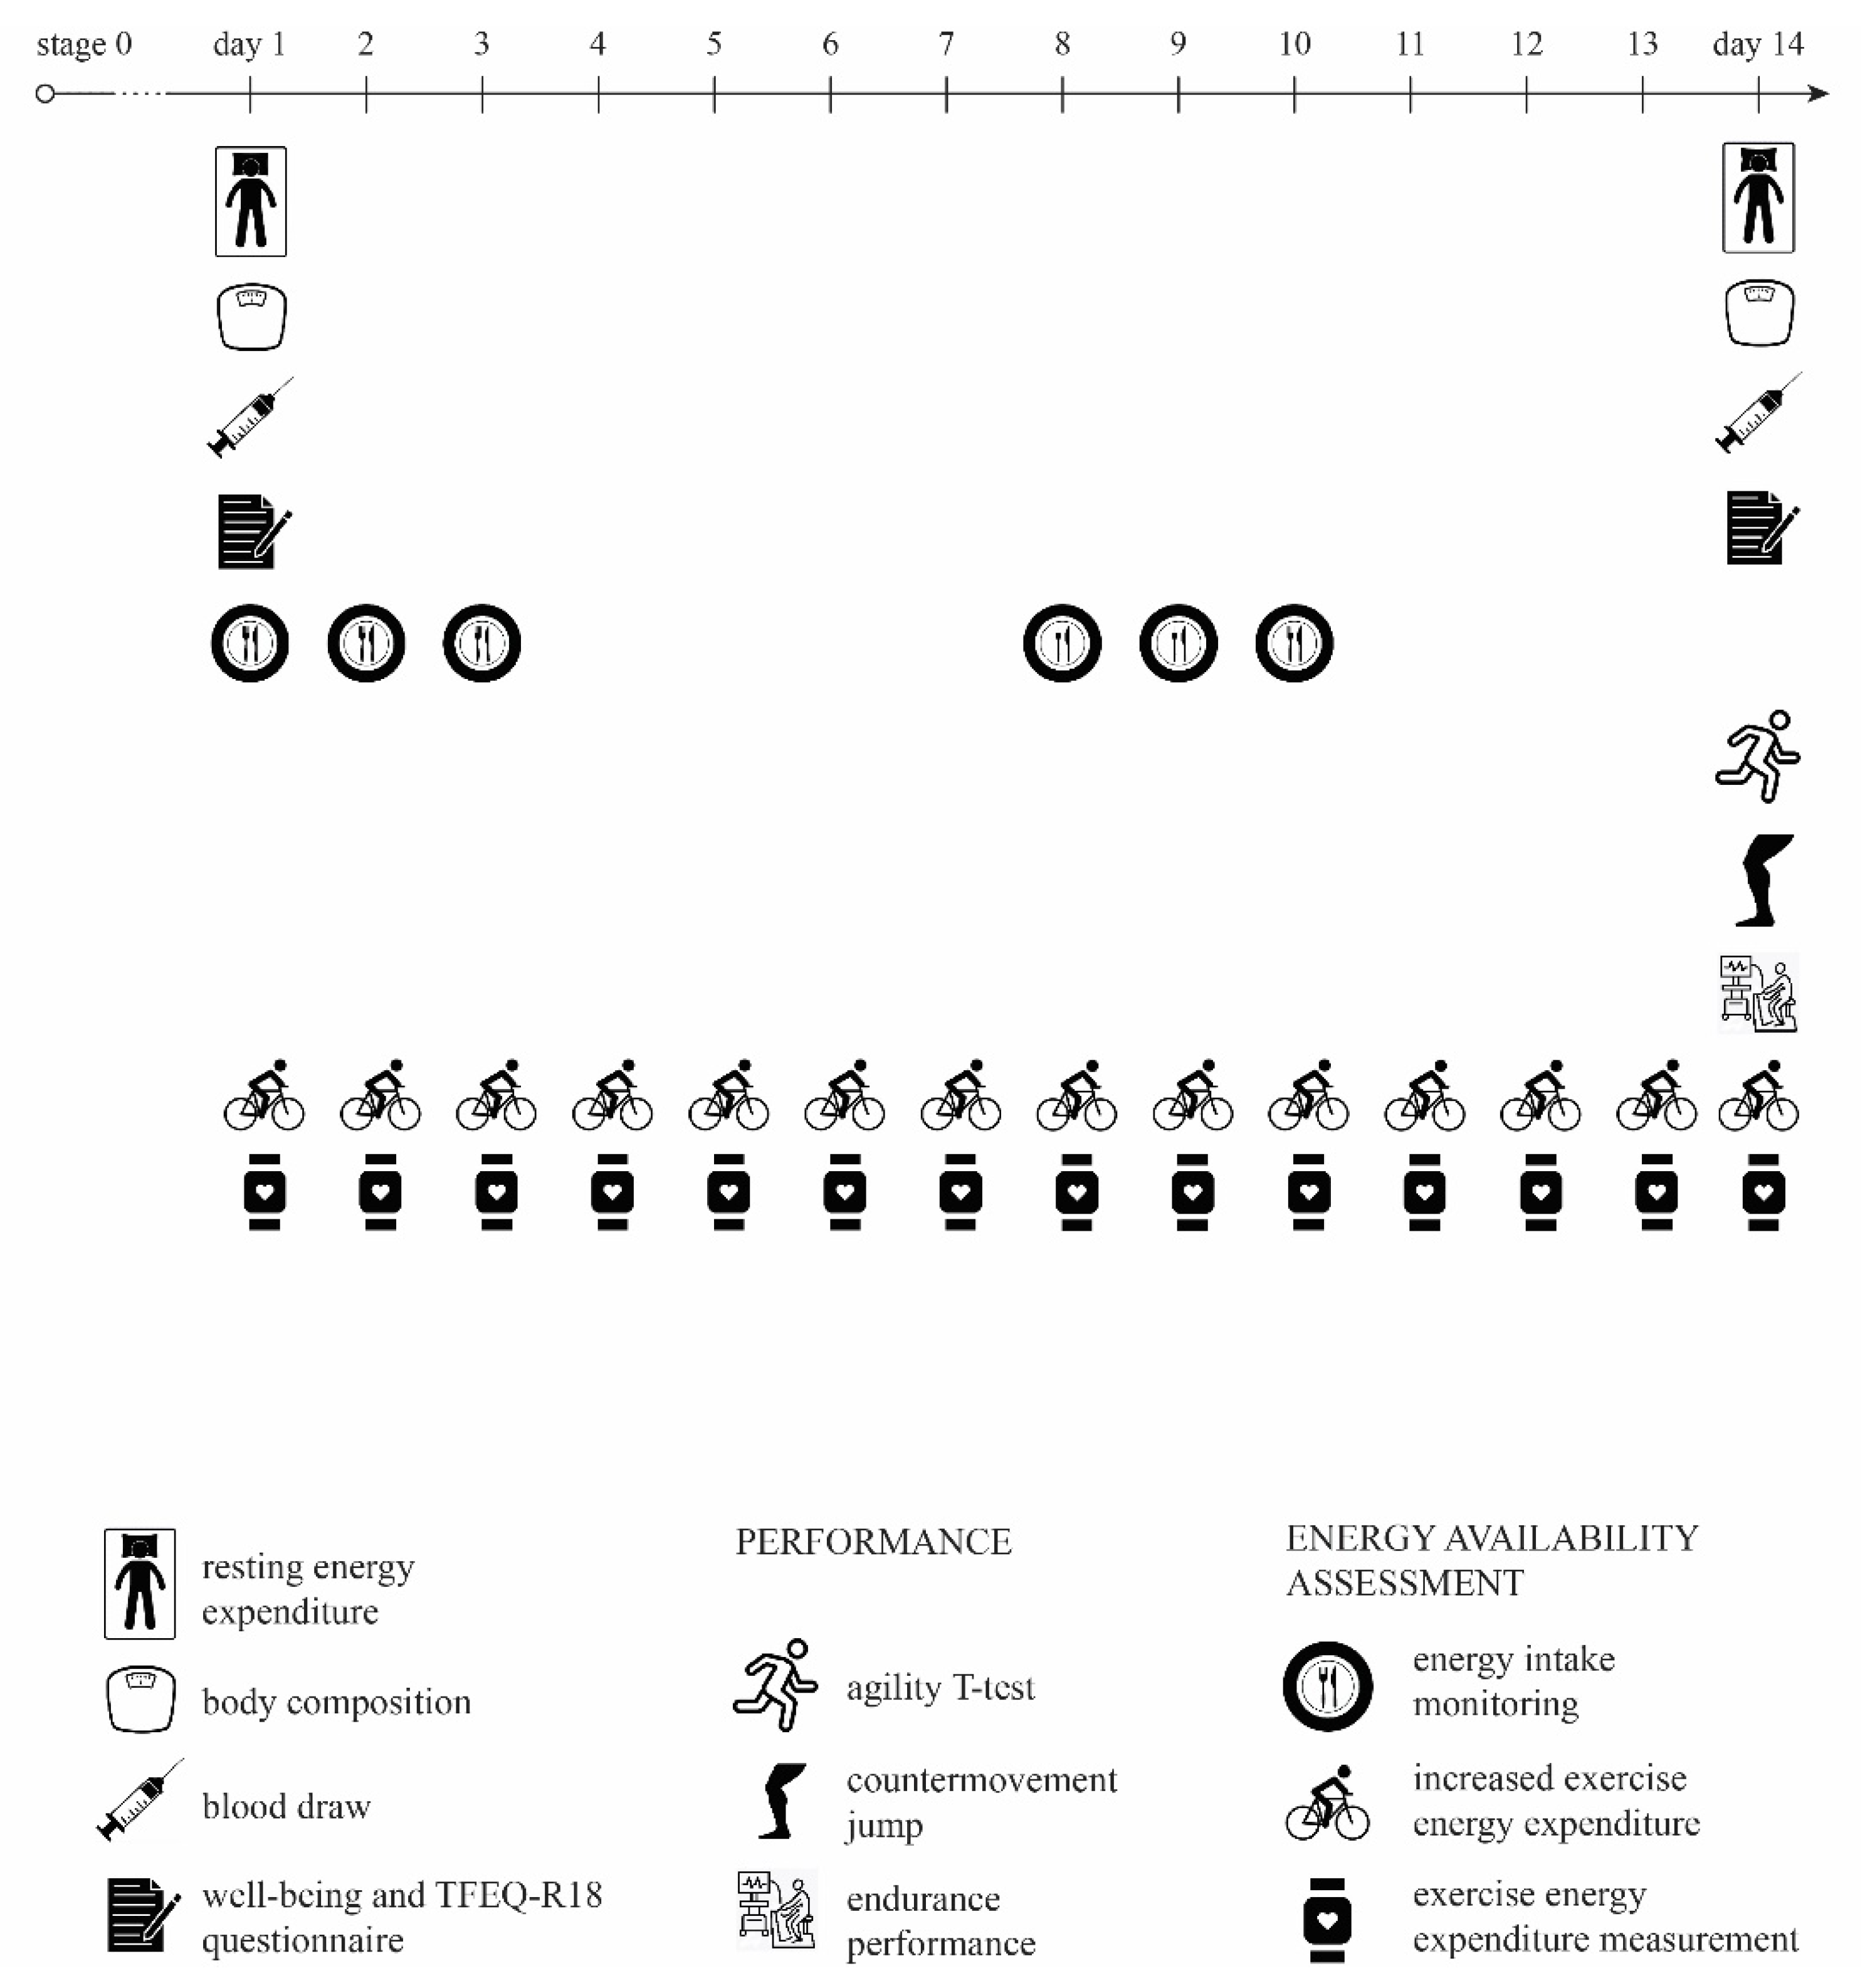
2.2. Study Design
2.3. Procedures
2.3.1. Energy Availability Calculation
2.3.2. Performance Testing, Blood Samples, Body Composition and Psychological Assessment
2.4. Data Analysis
3. Results
4. Discussion
4.1. Changes in Blood Values
4.2. Performance
4.3. Energy Conservation
4.4. Psychological Changes
4.5. The Threshold for Low Energy Availability
4.6. Limitations
5. Conclusions
Supplementary Materials
Author Contributions
Funding
Institutional Review Board Statement
Informed Consent Statement
Data Availability Statement
Conflicts of Interest
References
- Mountjoy, M.; Sundgot-Borgen, J.; Burke, L.; Carter, S.; Constantini, N.; Lebrun, C.; Meyer, N.; Sherman, R.; Steffen, K.; Budgett, R.; et al. The IOC consensus statement: Beyond the Female Athlete Triad—Relative Energy Deficiency in Sport (RED-S). Br. J. Sports Med. 2014, 48, 491–497. [Google Scholar] [CrossRef]
- Mountjoy, M.; Sundgot-Borgen, J.; Burke, L.; Ackerman, K.E.; Blauwet, C.; Constantini, N.; Lebrun, C.; Lundy, B.; Melin, A.; Meyer, N.; et al. International Olympic Committee (IOC) Consensus Statement on Relative Energy Deficiency in Sport (RED-S): 2018 Update. Int. J. Sport Nutr. Exerc. Metab. 2018, 28, 316–331. [Google Scholar] [CrossRef] [Green Version]
- Burke, L.M.; Lundy, B.; Fahrenholtz, I.L.; Melin, A.K. Pitfalls of Conducting and Interpreting Estimates of Energy Availability in Free-Living Athletes. Int. J. Sport Nutr. Exerc. Metab. 2018, 28, 350–363. [Google Scholar] [CrossRef] [PubMed]
- Logue, D.M.; Madigan, S.M.; Melin, A.; Delahunt, E.; Heinen, M.; Donnell, S.M.; Corish, C.A. Low Energy Availability in Athletes 2020: An Updated Narrative Review of Prevalence, Risk, Within-Day Energy Balance, Knowledge, and Impact on Sports Performance. Nutrients 2020, 12, 835. [Google Scholar] [CrossRef] [Green Version]
- Jurov, I.; Keay, N.; Hadzic, V. Relationship between energy availability, energy conservation and cognitive restraint with performance measures in male endurance athletes. J. Int. Soc. Sports Nutr. 2021, 18, 24. [Google Scholar] [CrossRef] [PubMed]
- Capling, L.; Beck, K.; Gifford, J.; Slater, G.; Flood, V.; O’Connor, H.; Capling, L.; Beck, K.L.; Gifford, J.A.; Slater, G.; et al. Validity of Dietary Assessment in Athletes: A Systematic Review. Nutrients 2017, 9, 1313. [Google Scholar] [CrossRef] [PubMed] [Green Version]
- Loucks, A.B.; Thuma, J.R. Luteinizing hormone pulsatility is disrupted at a threshold of energy availability in regularly menstruating women. J. Clin. Endocrinol. Metab. 2003, 88, 297–311. [Google Scholar] [CrossRef] [Green Version]
- Magkos, F.; Yannakoulia, M. Methodology of dietary assessment in athletes: Concepts and pitfalls. Curr. Opin. Clin. Nutr. Metab. Care 2003, 6, 539–549. [Google Scholar] [CrossRef]
- Syed-Abdul, M.M.; Soni, D.S.; Barnes, J.T.; Wagganer, J.D. Comparative analysis of BIA, IBC and DXA for determining body fat in American Football players. J. Sports Med. Phys. Fit. 2021, 61, 687–692. [Google Scholar] [CrossRef]
- Heikura, I.A.; Stellingwerff, T.; Bergland, D.; Mero, A.A.; Burke, L.M. Low Energy Availability Is Difficult to Assess but Outcomes Have Large Impact on Bone Injury Rates in Elite Distance Athletes. Int. J. Sport Nutr. Exerc. Metab. 2018, 28, 403–411. [Google Scholar] [CrossRef] [Green Version]
- Elliott-Sale, K.J.; Tenforde, A.S.; Parziale, A.L.; Holtzman, B.; Ackerman, K.E. Endocrine Effects of Relative Energy Deficiency in Sport. Int. J. Sport Nutr. Exerc. Metab. 2018, 28, 335–349. [Google Scholar] [CrossRef]
- Geesmann, B.; Gibbs, J.C.; Mester, J.; Koehler, K. Association Between Energy Balance and Metabolic Hormone Suppression During Ultra-Endurance Exercise. Int. J. Sports Physiol. Perform. 2017, 12, 984–989. [Google Scholar] [CrossRef]
- Hagmar, M.; Berglund, B.; Brismar, K.; Hirschberg, A.L. Body Composition and Endocrine Profile of Male Olympic Athletes Striving for Leanness. Clin. J. Sport Med. 2013, 23, 197–201. [Google Scholar] [CrossRef]
- Mäestu, J.; Eliakim, A.; Jürimäe, J.; Valter, I.; Jürimäe, T. Anabolic and Catabolic Hormones and Energy Balance of the Male Bodybuilders During the Preparation for the Competition. J. Strength Cond. Res. 2010, 24, 1074–1081. [Google Scholar] [CrossRef]
- Chan, J.L.; Heist, K.; DePaoli, A.M.; Veldhuis, J.D.; Mantzoros, C.S. The role of falling leptin levels in the neuroendocrine and metabolic adaptation to short-term starvation in healthy men. J. Clin. Investig. 2003, 111, 1409–1421. [Google Scholar] [CrossRef] [PubMed] [Green Version]
- Berg, U.; Enqvist, J.K.; Mattsson, C.M.; Carlsson-Skwirut, C.; Sundberg, C.J.; Ekblom, B.; Bang, P. Lack of sex differences in the IGF-IGFBP response to ultra endurance exercise. Scand. J. Med. Sci. Sports 2008, 18, 706–714. [Google Scholar] [CrossRef] [PubMed]
- McColl, E.M.; Wheeler, G.D.; Gomes, P.; Bhambhani, Y.; Cumming, D.C. The effects of acute exercise on pulsatile LH release in high-mileage male runners. Clin. Endocrinol. 1989, 31, 617–621. [Google Scholar] [CrossRef] [PubMed]
- Hackney, A.C.; Sinning, W.E.; Bruot, B.C. Reproductive hormonal profiles of endurance-trained and untrained males. Med. Sci. Sports Exerc. 1988, 20, 60–65. [Google Scholar] [CrossRef] [PubMed]
- Hackney, A.C.; Fahrner, C.L.; Gulledge, T.P. Basal reproductive hormonal profiles are altered in endurance trained men. J. Sports Med. Phys. Fit. 1998, 38, 138–141. [Google Scholar]
- Hooper, D.R.; Kraemer, W.J.; Saenz, C.; Schill, K.E.; Focht, B.C.; Volek, J.S.; Maresh, C.M. The presence of symptoms of testosterone deficiency in the exercise-hypogonadal male condition and the role of nutrition. Eur. J. Appl. Physiol. 2017, 117, 1349–1357. [Google Scholar] [CrossRef]
- Jurov, I.; Hadžić, V.; Rauter, S. Markers of Energy Metabolism Affect Lactate Metabolism and Aerobic Performance in Competitive Female Cyclists. Appl. Sci. 2020, 10, 7563. [Google Scholar] [CrossRef]
- Koehler, K.; Hoerner, N.R.; Gibbs, J.C.; Zinner, C.; Braun, H.; De Souza, M.J.; Schaenzer, W. Low energy availability in exercising men is associated with reduced leptin and insulin but not with changes in other metabolic hormones. J. Sports Sci. 2016, 34, 1921–1929. [Google Scholar] [CrossRef] [PubMed] [Green Version]
- De Pauw, K.; Roelands, B.; Cheung, S.S.; de Geus, B.; Rietjens, G.; Meeusen, R. Guidelines to classify subject groups in sport-science research. Int. J. Sports Physiol. Perform. 2013, 8, 111–122. [Google Scholar] [CrossRef] [PubMed] [Green Version]

| Mean_a | Mean_b | Mean Difference | Std. Deviation | Std. Error Mean | 95% CI Lower | 95% CI Upper | t | df | Sig. (2-Tailed) | |
|---|---|---|---|---|---|---|---|---|---|---|
| Haemoglobin (g/L) | 146.4 | 143.92 | 2.50 | 4.81 | 1.39 | −0.56 | 5.56 | 1.80 | 11 | 0.100 |
| S-Iron (μmol/L) | 22.94 | 22.62 | 0.32 | 8.79 | 2.54 | −5.26 | 5.91 | 0.13 | 11 | 0.900 |
| S-TSH (mIU/L) | 2.28 | 2.16 | 0.12 | 0.55 | 0.16 | −0.23 | 0.47 | 0.74 | 11 | 0.475 |
| S-T3 (pmol/L) | 4.78 | 4.60 | 0.19 | 0.40 | 0.12 | −0.07 | 0.44 | 1.63 | 11 | 0.132 |
| S-Testosterone (nmol/L) | 19.22 | 18.86 | 0.35 | 5.46 | 1.58 | −3.11 | 3.82 | 0.22 | 11 | 0.827 |
| S-cortisol (nmol/L) | 408.80 | 408.81 | −0.01 | 92.47 | 26.69 | −58.76 | 58.74 | 0.00 | 11 | 1.000 |
| S-ferritin (μg/L) | 140.40 | 138.81 | 1.59 | 21.01 | 6.07 | −11.76 | 14.94 | 0.26 | 11 | 0.798 |
| Insulin (mE/L) | 2.80 | 2.85 | −0.05 | 1.98 | 0.57 | −1.31 | 1.21 | −0.09 | 11 | 0.932 |
| IGF-1 (μg/L) | 187.75 | 170.83 | 16.92 | 28.60 | 8.25 | −1.25 | 35.09 | 2.05 | 11 | 0.065 * |
| IGF-1 SD | −0.085 | −0.277 | 0.192 | 0.811 | 0.234 | −0.324 | 0.707 | .819 | 11 | 0.430 |
| Haemoglobin_b | S-Iron_b | S-TSH_b | S-T3_b | S-Testosterone_b | S-Cortisol_b | S-Ferritin_b | Insulin_b | IGF-1_b | IGF-1 SD_b | ||
|---|---|---|---|---|---|---|---|---|---|---|---|
| EA_2 real | r | 0.557 * | 0.242 | 0.307 | 0.048 | 0.532 * | −0.384 | 0.094 | 0.318 | −0.335 | 0.056 |
| p | 0.030 * | 0.224 | 0.166 | 0.441 | 0.037 * | 0.109 | 0.386 | 0.157 | 0.144 | 0.431 | |
| N | 12 | 12 | 12 | 12 | 12 | 12 | 12 | 12 | 12 | 12 | |
| Mean Difference | SD | Std. Error Mean | 95% CI Lower | 95% CI Upper | t | df | Sig. (2-Tailed) | |
|---|---|---|---|---|---|---|---|---|
| VO2max (mL/min/kg) | −0.86 | 6.29 | 1.82 | −4.86 | 3.14 | −0.47 | 11 | 0.646 |
| AT (mL/min/kg) | −2.94 | 6.06 | 1.75 | −6.79 | 0.91 | −1.68 | 11 | 0.121 |
| RC (mL/min/kg) | −3.93 | 8.31 | 2.40 | −9.20 | 1.35 | −1.64 | 11 | 0.130 |
| [La]max (mmol/L) | 3.38 | 2.63 | 0.76 | 1.71 | 5.05 | 4.45 | 11 | 0.001 * |
| [La]5min (mmol/L) | 2.89 | 2.25 | 0.65 | 1.46 | 4.32 | 4.44 | 11 | 0.001 * |
| t-test (s) | 0.09 | 0.32 | 0.09 | −0.11 | 0.30 | 1.008 | 11 | 0.335 |
| CMJ (m) | 0.035 | 0.019 | 0.005 | 0.023 | 0.047 | 6.416 | 11 | 0.000 * |
| [La]5min (mmol/L) | [La]max (mmol/L) | t-Test (s) | CMJ (m) | VO2max (mL/min/kg) | PO (W) | RPO (W/kg) | AT (mL/min/kg) | RC (mL/min/kg) | ||
|---|---|---|---|---|---|---|---|---|---|---|
| mREE/pREE | r | −0.134 | −0.409 | −0.149 | −0.088 | 0.518 * | 0.016 | 0.090 | 0.431 | 0.348 |
| p | 0.339 | 0.094 | 0.322 | 0.393 | 0.042 | 0.480 | 0.391 | 0.081 | 0.134 | |
| N | 12 | 12 | 12 | 12 | 12 | 12 | 12 | 12 | 12 | |
| mREE (kcal/day) | r | −0.066 | −0.370 | −0.218 | −0.143 | 0.425 | 0.010 | −0.030 | 0.343 | 0.243 |
| p | 0.419 | 0.118 | 0.248 | 0.329 | 0.084 | 0.487 | 0.464 | 0.138 | 0.223 | |
| N | 12 | 12 | 12 | 12 | 12 | 12 | 12 | 12 | 12 | |
| EA achieved | r | 0.058 | 0.039 | 0.534 * | −0.346 | −0.457 | −0.001 | −0.171 | −0.597 * | −0.575 * |
| p | 0.430 | 0.452 | 0.037 | 0.135 | 0.067 | 0.499 | 0.297 | 0.020 | 0.025 | |
| N | 12 | 12 | 12 | 12 | 12 | 12 | 12 | 12 | 12 | |
Publisher’s Note: MDPI stays neutral with regard to jurisdictional claims in published maps and institutional affiliations. |
© 2021 by the authors. Licensee MDPI, Basel, Switzerland. This article is an open access article distributed under the terms and conditions of the Creative Commons Attribution (CC BY) license (https://creativecommons.org/licenses/by/4.0/).
Share and Cite
Jurov, I.; Keay, N.; Rauter, S. Severe Reduction of Energy Availability in Controlled Conditions Causes Poor Endurance Performance, Impairs Explosive Power and Affects Hormonal Status in Trained Male Endurance Athletes. Appl. Sci. 2021, 11, 8618. https://doi.org/10.3390/app11188618
Jurov I, Keay N, Rauter S. Severe Reduction of Energy Availability in Controlled Conditions Causes Poor Endurance Performance, Impairs Explosive Power and Affects Hormonal Status in Trained Male Endurance Athletes. Applied Sciences. 2021; 11(18):8618. https://doi.org/10.3390/app11188618
Chicago/Turabian StyleJurov, Iva, Nicola Keay, and Samo Rauter. 2021. "Severe Reduction of Energy Availability in Controlled Conditions Causes Poor Endurance Performance, Impairs Explosive Power and Affects Hormonal Status in Trained Male Endurance Athletes" Applied Sciences 11, no. 18: 8618. https://doi.org/10.3390/app11188618
APA StyleJurov, I., Keay, N., & Rauter, S. (2021). Severe Reduction of Energy Availability in Controlled Conditions Causes Poor Endurance Performance, Impairs Explosive Power and Affects Hormonal Status in Trained Male Endurance Athletes. Applied Sciences, 11(18), 8618. https://doi.org/10.3390/app11188618