Abstract
The effectiveness of adding plantar-surface texture to improve balance has been demonstrated in a variety of demographics. It is critical to investigate whether textured insoles can improve balance in people with knee osteoarthritis (OA), who have compromised the somatosensory function of the affected joint and, as a result, are at a higher risk of falling. Thus, this study investigated the degree of benefit from the use of textured insoles for improving balance and compared the balance of people with knee OA to healthy matched peers. This study included eighteen people with knee OA and eighteen healthy, aged, gender, height, weight, and BMI matched controls who were assessed on balance using the sensory organization test and the motor control test. Balance was improved in both groups when the textured insoles were worn, and the healthy knee group demonstrated significantly better balance performance than the knee OA group. The benefits of this study for individuals with knee OA are that it may lead to the development of an evidence-based footwear intervention that is noninvasive, simple to use, and inexpensive, in addition to allowing the user to self-manage and the ability to reduce the risk of falls, thereby improving their quality of life.
1. Introduction
Fifty-two percent of adults 45 years of age and older in the United States have arthritis [1]. Osteoarthritis (OA) is the most prevalent form of arthritis among the various forms, and as a prevailing source of disabilities, it often results in a loss in function with a high risk of falls [2,3].
In order to maintain appropriate balance, the inflow of sensory information from the visual, somatic and vestibular sensory systems should be integrated into the central nervous system to produce the optimal motion [4]. The visual system supplies information on the body position and the intensity and difficulty of the movements to enable individuals to change posture in consideration of the relation between them and their environment [5]. The somatosensory systems and vestibular systems also play a role in the postural responses, body scheme, postural muscle tone, and maintaining balance [6].
Furthermore, the somatosensory system is primarily used for maintaining the balance, safely accomplishing the majority of activities in daily life [7,8]. The knee with OA is characterized by pain, decreasing muscle strength in the lower limbs and abnormal somatosensations [9,10,11] and the abnormal somatosensory function can result in balance problems; previous research has demonstrated that loss of somatosensation has been linked to abnormal balance [12]. The combination of the factors such as pain, muscular weakness, and abnormal somatosensory function in individuals with knee OA reduce the capability of general balance function, and ability in initiating and correcting movements, resulting in limitation of the ability to perform functional activities of daily living such as rising from a chair, standing, walking, or climbing stairs [11,13,14].
This confirms that individuals with knee OA have problems with their balance [15,16,17] and are often at risk of falling [3]. Although various approaches and interventions have been used to improve the balance of individuals with knee OA, individuals with knee OA still suffer more falls than people without knee OA in daily life [18]. Therefore, consideration should be given to additional strategies for intervention to improve the balance in individuals with knee OA. The capacity to improve cutaneous information on the skin of the plantar sole has been reported to be effective in counteracting these specific symptoms [19,20,21,22].
The plantar sole is an exceptional body part because it contains a dense area of mechanoreceptors and is the primary location on the body directly connecting humans to their environment [23]. Research has found that somatosensory information from the plantar sole can help sense support surface characteristics by relaying information about pressure changes and associated body sway [24]. Additionally, somatosensory information that emanates from the plantar sole prompts reflexes that help us maintain balance [25,26]. Additionally, previous studies have been conducted on how modifying the quality of the somatosensory information transmitted from plantar sole determines balance is affected. In some studies, for instance, the somatosensory input from the foot was altered by ischemia, initiated by desensitizing the foot through cooling or numbing it, to expose postural instability [27,28]. Therefore, through anesthetizing the plantar sole, the significance of somatosensory information to the maintenance of balance is revealed. Several studies, therefore, have continued investigating how balance can be improved through somatosensory feedback. Specifically, an enhancement to the feet’s cutaneous feedback has been found to be efficacious. Artificially enhancing cutaneous feedback through vibratory stimulation devices has been shown to improve symptoms in older adults, patients with diabetes and patients with stroke [20,22,29]. Additionally, mechanical stimulation by changing pressure to the skin of the plantar surface can modify neuromuscular activity, alter walking, and attenuate muscle atrophy [30,31]. De-Doncker, Picquet, and Falempin [32] showed that such mechanical stimulation of the cutaneous mechanoreceptors in the sole of rat feet prevents the decrease in muscle weight and the cross-sectional area of the soleus muscle as well as prevents the reduction in strength.
In contrast to vibratory and pressure devices that can be expensive and difficult to use in daily life, other simple and inexpensive interventions are available that could potentially enhance somatosensory feedback and counteract the lack of balance for those who have difficulty maintaining balance such as elders, individuals with the disease, and individuals with a previous injury. Orth et al. [33] exhibited that, by adding a textured surface to stimulate the plantar sole by way of the skin’s sensory receptors, this simple mechanical deformation works to improve balance. This same finding has been demonstrated using a variety of people with differing conditions, including persons with Parkinson’s disease, multiple sclerosis, chronic ankle instability and other instability issues, the elderly, and the young, using different balance tests (i.e., dynamic balance, proprioception, gait analysis, and static balance tests) [33]. This was further researched by Qiu et al. [34] who found that textured material could improve the balance of elderly persons even on unstable surfaces. Textured material can consequently be said to enhance the somatosensation in the skin of the planter sole. Therefore, this study suggests that insoles that are textured help increase somatosensory feedback and, thus, help maintain balance by stimulating receptors that are otherwise not being stimulated and improve balance functionality.
However, little work has been conducted to test the efficacy of enhanced somatosensory input on balance in the individuals with knee OA. Furthermore, it is not certain if individuals with knee OA may benefit from enhanced somatosensory information stimulated by textured insoles compared to other populations that have previously been studied. It is imperative to investigate the effects of textured insoles on this population, though, OA compromises the knee joint, which causes these individuals to have an increased risk of falling [11,35]. Due to OA effects on the somatosensory system, it was expected that textured insole attenuation effects on balance were likely to be greater in the knee OA group, compared to healthy knee group. If it can be substantiated that balance in individuals with knee OA can be improved by adding textured insoles, simple and inexpensive interventions can be developed for use in their daily activities to improve somatosensory feedback and benefit balance to prevent falls. Therefore, the purpose of this study was to firstly compare the balance between individuals with knee OA and their matched healthy individuals, then, determine if the enhanced somatosensory input provided by a textured insole would benefit not only healthy individuals but would enhance to a greater degree the balance of corresponding individuals with knee OA.
2. Materials and Methods
A cross-sectional design was used to determine if the presence of textured insoles produces greater improvements in balance outcomes displayed by individuals with knee OA compared to the improvement demonstrated by healthy, matched individuals and to explore the balance differences between individuals with knee OA and matched-healthy knee controls with smooth insole conditions. Statistical analyses were selected to detect group differences on tasks of the Sensory Organization Test (SOT) and Motor Control Test (MCT).
2.1. Participants
Nineteen individuals with knee OA (17 females and 2 males) who met the inclusion criteria were enrolled in the study. A given control participant was recruited to match a corresponding knee OA participant, based on the same gender, age (±3 years). The study was approved by the university’s Institutional Review Board and written informed consent was obtained from all participants. Nineteen participants in each group were calculated via an a priori power analysis to provide 97.5% power with an effect size of 1.33 at α = 0.05 to detect differences. The data used for the estimates were the result of comprehensive equilibrium scores reported in a study that was conducted by Jones and colleagues on postural control of individuals with fibromyalgia [36].
All participants in both groups were free of the following: (1) concurrent medical conditions that could impair balance, such as neurological or significant musculoskeletal disease, inner ear disease, or permanent lower-limb injury; (2) inability to walk without assistance; and (3) an abnormal optometric or ophthalmic examination within the preceding six months. The diagnosis of knee OA was made based on a mild to moderate diagnosis of knee OA in one knee. The following conditions were excluded from this study: asymptomatic osteoarthritis of one or both knees, inflammatory arthritis, major lower extremity joint surgery (e.g., knee arthrotomy within the previous six months), any condition that significantly limits local ambulation (e.g., amputation or stroke), use of gait aids for ambulation, and dementia or inability to understand and follow directions.
On the basis of gender, age, height, weight and BMI, participants with knee OA were matched to asymptomatic control participants (healthy knee group). Control participants with rheumatoid or any other type of arthritis, a history of lower extremity injury, or prolonged knee pain requiring medication or knee surgery were excluded from the control group. Additionally, control participants with recurrent or prolonged knee pain within the previous month were excluded, even if they were pain-free on the day of testing. Participant characteristics are presented in Table 1. Demographic variables assessed for this study included (a) age, (b) height, (c) mass and (d) body mass index (BMI). These data results were analyzed using independent t-test to evaluate differences among variables and there were no statistically significant differences between knee OA group and healthy knee group in demographics.

Table 1.
Participant demographics.
2.2. Materials
The textured insoles (flexible, polyvinyl chloride (PVC), 3 mm thickness, transparent) featured small, round peaks separated by approximately 4 mm center to center (Figure 1). Insoles were customized for both left and right feet based on the width and length of the participant’s feet. This textured insole was deemed adequate for sensory stimulation without being too rough on the skin.
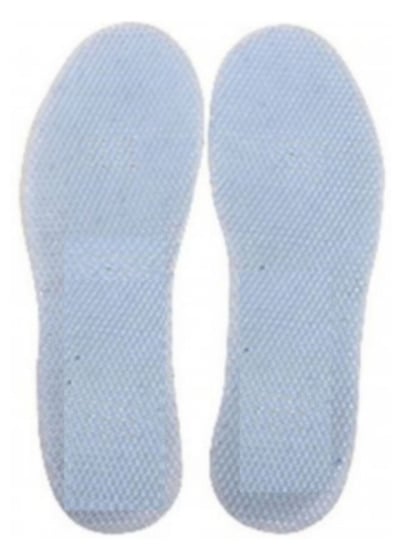
Figure 1.
The textured insoles used in this study.
2.3. Computerized Posturography Assessments
To obtain the center of pressure data required to calculate measures of balance, Computerized Dynamic Posturography tests were administered using the NeuroCom EquiTest® (NeuroCom International, Clackamas, OR, USA). This device is composed of movable dual forceplates on a medial-lateral rotational axis capable of measuring the vertical forces applied by a person’s feet and a movable surrounding visual screen within which the participant’s stand. Four transducers mounted symmetrically on a central plate and a fifth transducer bracketed to the central plate below the pin joint were used to measure the pressure of force. This enabled the right and left foot forces to be measured independently. The forceplates and a visual screen could both be angled in response to the participants’ sway. The participant’s anterior–posterior sway was recorded by measuring vertical force. Electrical signals from the forceplate were sampled at 100 Hz and filtered using a second order Butterworth filter (cutoff frequency = 0.85 Hz). The NeuroCom System has been used in clinical and scientific research related to the balance control [37,38]. Additionally, the validity and internal consistency and test–retest reliability of the Sensory Organization Test (SOT) from Computerized dynamic posturography have been documented for older adults [39]. Additionally, Jeffrey, Hebert and Mark (2016) [40] concluded that the Sensory Organization Test (SOT) performed by individuals with multiple sclerosis (MS) had good to excellent reliability, and excellent reliability for composite and the SOT is a reliable and valid measurement of the disease-related progression of impaired balance related to sensory integration.
2.4. Procedures
When a potential participant arrived at the testing facility, he or she was informed in writing and verbally about the testing procedures and asked to sign a consent form in accordance with Institutional Review Board protocol. The potential participant was then asked to complete the WOMAC (Western Ontario and McMaster University Arthritis) questionnaire, an in-house medical history and health status assessment. Testing was continued for participants who met the criteria. The participant warmed up prior to data collection and practice testing. To prevent falls, the participant wore a safety harness that was connected to two straps extending down from an overhead bar. The participant stood on the NeuroCom forceplate and then the safety harness was attached to the straps. Then, the participant’s feet were positioned on the forceplate by the investigator (Figure 2). The medial malleolus of each foot was centered directly over a thick line on the dual forceplate positioned perpendicularly to the participant. The lateral heel part of the shoes was positioned according to the participant’s height. The forceplate was marked with lines “S”, “M” and “T”, where
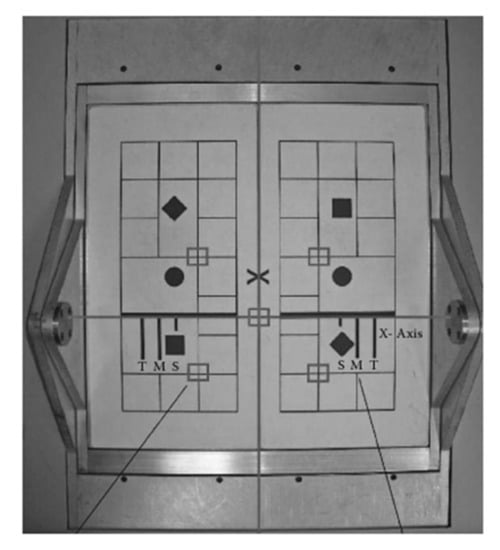
Figure 2.
Dual forceplate.
S = Short 76–140 cm (30–55 inches);
M = Medium 141–165 cm (56–65 inches);
T = Tall 166–203 cm (66–80 inches).
Following this, the participant practiced the two balance tests described below. The individual with knee OA who wore smooth insoles then completed the NeuroCom EquiTest SOT (sensory organization test) and MCT (motor control test) protocols. There was a ten-minute rest period during which insoles could be changed. After wearing the textured insoles, the participant was tested again using the NeuroCom Equi Test SOT and MCT protocols.
2.5. Test Tasks
2.5.1. Sensory Organization Test (SOT)
The sensory organization test (SOT) challenges postural control through sway referencing by changing the availability and/or accuracy of sensory information from three systems: visual, vestibular, and somatosensory. Sway referencing synchronizes the platform’s and/or surrounding room’s rotation with the person’s anterior–posterior postural sway; that is, as the person sways forward, the platform and/or surrounding area sways forward as well. The skew platform reduces or modifies the accuracy of somatosensory information, whereas the sway-referenced surroundings, extending beyond the visual periphery, provide inaccurate visual sensory information. These strategies challenge postural control by lowering the quality of sensory feedback on postural sway. The six sensory conditions of the SOT are as follows (Figure 3): (1) eyes open with fixed platform (condition 1); (2) eyes closed with fixed platform (condition 2); (3) eyes opened with sway-referenced surroundings (condition 3); (4) eyes opened with sway-referenced platform (condition 4); (5) eyes closed with sway-referenced platform (condition 5); and (6) eyes open with sway-referenced platform and surroundings (condition 6). Three trials for each sensory condition were presented in the order recommended by the manufacturer, with increasing difficulty from condition 1 to condition 6 (Table 2). Each SOT lasted approximately 10 min.
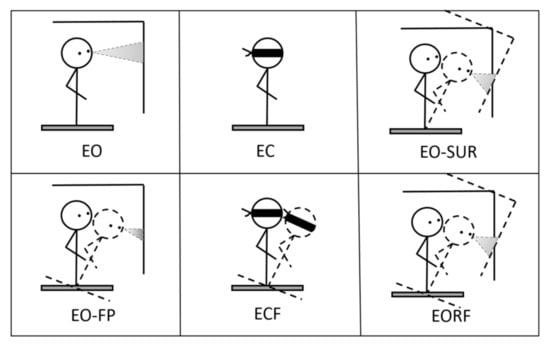
Figure 3.
Six conditions of sensory organization test.
Table 2.
Description of the six sensory organization test tasks.
2.5.2. Motor Control Test (MCT)
The MCT measured participants’ automatic reactions in response to support surface translations. Throughout the MCT, each participant kept their eyes open, and the surroundings remained stationary. The MCT had six conditions: three graded backward (3) and three graded forward (3) translations (Figure 4). The translations were scaled based on the participant’s height, but the durations were the same. Small, medium, and large translations produced translations of 1.25 cm for 250 ms, 3.14 cm for 300 ms, and 5.7 cm for 400 ms, respectively. Small translations represented threshold stimulation, large translations produced the maximum response, and medium translations were halfway between the small and large. Each translation took place at a constant velocity, transferring constant forward or backward angular momentum to the participant’s body [41]. The MCT lasted approximately 2 min.
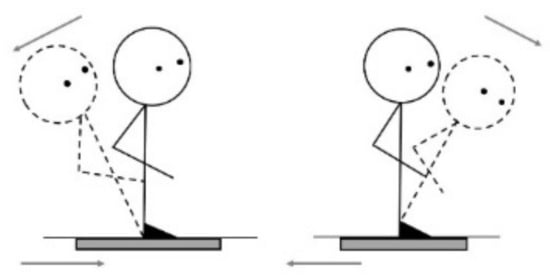
Figure 4.
Forward/backward translations.
2.6. Dependent Variables
The SOT’s dependent variables included equilibrium and strategy scores for each trial and condition. During SOT trials, the equilibrium score (ES) indicates how well the participant’s sway remains within the expected angular limits of stability. The ES was calculated using NeuroCom software from forceplate data from each trial (20 s @ 100 Hz, 2000 data points) (NeuroCom, Clackamas, OR, USA). ES was calculated using the following equation:
where θmax is the maximum anterior sway angle in degrees during a trial and θmin is the maximum posterior sway angle in degrees during the same trial. Additionally, the angular difference between participants’ measured maximum anterior to posterior center of gravity (COG) and theoretical sway stability limit of 12.5 degrees was compared. A value of 12.5 degrees is commonly regarded as the theoretical limit of stability for healthy individuals. The outcome is given as an inverse percentage ranging from 0 to 100. A fall results in an ES of 0, whereas no movement results in an ES of 100. The composite equilibrium score was calculated by averaging the scores from conditions 1 and 2, adding these two scores to the equilibrium scores from each trial of conditions 3, 4, 5, and 6, and then dividing the total by the number of trials.
2.6.1. Sensory Analysis
The NeuroCom EquiTest software computes sub-equilibrium scores which include the somatosensory (SOM), visual (VIS), vestibular (VEST), and the management (PMAN) ratios between the average equilibrium scores for specified pairings of sensory test conditions to describe the finding in the different perspectives (Table 3 and Table 4). They determined the importance of each sensory system influencing the balance allowing the identification of the use of somatisensory (SOM), visual (VIS), and vestibular (VEST) information, as well as the ability to manage altered proprioceptive inputs (PMAN).
Table 3.
Descriptions of sensory analysis [42].
Table 4.
Comparison of the effects of textured insoles.
2.6.2. Latency (LAT)
The latency (LAT) is defined as the time interval in milliseconds between the onset of translation during the MCT (motor control test) and the onset of the participants’ response to the translation movement of the support surface. Latencies were calculated as the average of the right and left feet’s performances. Throughout the MCT, all participants kept their eyes open and their surroundings remained stationary. Six conditions were required for the MCT: graded backward (3) and forward (3) translations. Each translation occurred at a constant velocity and imparted the participant’s body with constant forward or backward angular momentum.
2.7. Statistical Analysis
The interaction between groups was evaluated using regression to determine whether textured insoles resulted in greater improvements in the knee OA groups. This analysis applied two groups of subjects (knee OA and healthy knee groups) to the variables of equilibrium scores, sensory analysis ratio, and latency (difference scores between the smooth and textured insoles). The difference between smooth and textured insoles was the dependent (Y) variable. Predictor variables (X) included the presence of knee OA (a grouping variable), as well as covariates such as participant age and smooth insole scores. The following equation was used to determine group interactions:
where intercept is the change in the control group by assuming they have the same smooth insole scores and same ages, and b1 is the group difference of differences, which is the interaction. If b1 is significantly different, then there is an interaction, if it is not significant, the textured insole effects are parallel for these two groups. In addition, an effort was made to control the factor that accounts for variation in the outcome not due to balance. The covariates selected included age and smooth insole scores. The age, as one of the covariates, was chosen based on empirical evidence that has shown deterioration of balance performance associated with aging [43].
Y_Texrued insole-Y_Smooth insole = intercept + b1 × grouping variable (knee OA = 1 and healthy knee group = 0) + b2 × age + b3 × Y_Smooth insole + e
Additionally, paired t-tests (Appendix A) were used to determine whether the textured insole improved balance performance in each group, and an independent t-test was used to determine whether there were differences in balance between the knee OA and healthy control groups when using smooth insole conditions. To conduct the normality test, a Shapiro–Wilk analysis was performed to determine whether the assumption of normality was met, and homogeneity was determined using Levene’s test for equality of variances. If the data violated the normality test assumptions, the Wilcoxon signed-rank test was used for paired t-tests and the Mann–Whitney U test was used for independent t-tests. The significance coefficient (p) was used to represent the results of the difference evaluation. “*” denotes statistical significance—p < 0.05.
3. Results
3.1. Comparison of the Effects of Textured Insoles
A regression was conducted to evaluate the interaction between groups to investigate if textured insoles produce greater improvements in knee OA groups. To describe condition 1 as an example, a significant regression equation was found (F(3, 34) = 5.484, p = 0.003), with an R2 of 0.326. The textured insole scores and smooth insole scores (dependent variable) are equal to 57 − 0.890 + 0.025 (age) − 0.620 (the smooth insole score). Additionally, the interaction between the knee groups was not significantly different, indicating that the textured insoles had similar effects on both groups. Like condition 1, there were no statistically significant interactions in all regression analyses, indicating that the textured insoles had similar effects on all participants in all test scores (Table 4).
3.2. Comparison between Knee OA Group and Health Knee Group
Independent t-tests and Mann–Whitney U tests were conducted to compare the individuals with knee OA and healthy knee controls. An analysis of the sensory organization test (Figure 5) showed significant differences in condition 3 (p = 0.019), condition 5 (p = 0.003), condition 6 (p = 0.046), and COMP values (p = 0.011) between groups with textured insoles. This parameter was higher for the healthy knee group. Additionally, the presence of the textured insole affected condition 5 (p = 0.000), condition 6 (p = 0.004), and COMP (p = 0.000) in the knee OA group and condition 4 (p = 0.002), condition 6 (p = 0.048), and COMP (p = 0.000) in the healthy knee group.
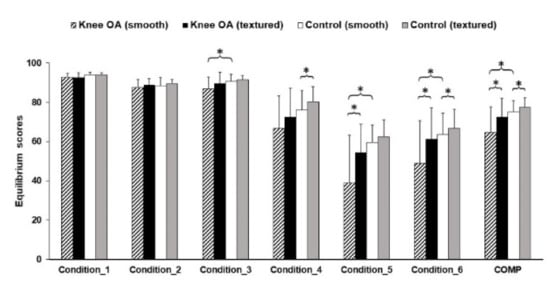
Figure 5.
Equilibrium scores in the sensory organization test. * Statistically significant mean difference (p < 0.05).
Figure 6 shows the sensory analysis ratio results for both groups. There was statistically significance of VEST (p = 0.004) and PMAN (p = 0.008) between groups. This parameter was higher for healthy knee group as well. Additionally, the presence of the textured insole affected VEST (p = 0.000) in the knee OA group, VIS (p = 0.021) in the healthy knee group, and PMAN (p = 0.014 in healthy, p = 0.001 in knee OA) in both groups.
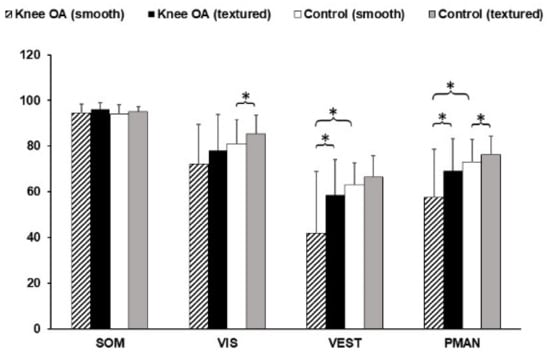
Figure 6.
Results of sensory analysis ratios. * Statistically significant mean difference (p < 0.05).
Figure 7 shows the Latency results for both groups. There was statistically significance of M_BACK (p = 0.037), L_FWD (p = 0.025) and COMP_latency (p = 0.008) between groups. This parameter was higher for the healthy knee group as well. Additionally, there were no significantly effects of the textured insole in both groups for latencies.
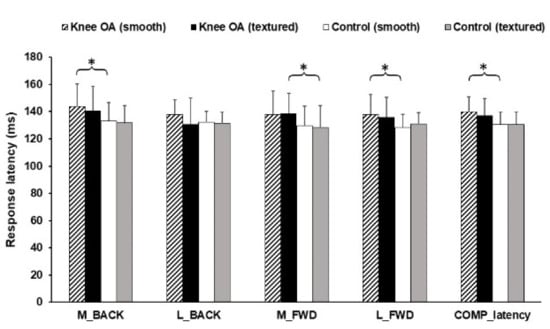
Figure 7.
Results of latencies. * Statistically significant mean difference (p < 0.05).
4. Discussion
4.1. Comparison of the Effects of Textured Insoles
Although it was expected that a textured insole intervention would result in greater improvements in the knee OA group than in the healthy group, no statistically significant interactions between groups were found, indicating that textured insoles had similar effects for people with knee OA and healthy knees. However, there were minor interactions between groups when it came to the paired-t test results. This discrepancy in results could be due to a small sample size or to the fact that covariates are only used in regression models and not t-tests.
4.2. Comparison between the Knee OA Group and Health Knee Group
The findings of the balance performances with smooth insoles comparing the individuals with knee OA and the healthy knee controls showed that conditions 3, 5, and 6, Comp, VEST, and PMAN were significantly higher for healthy knee controls than individuals with knee OA. Lower EQ values in the knee OA group indicated greater forward–backward displacements of the center of gravity. The Comp score indicated both groups’ overall performance, and a lower score indicates that the OA group was unable to maintain balance and a stable position during the SOT test procedure, in comparison to the healthy knee group. In conditions 5 and 6, when participants were required to compensate for visual deprivation and inaccurate somatosensory information by increasing their reliance on vestibular information, there was an increase in the number of falls and a decrease in equilibrium scores. Furthermore, individuals with knee OA also had decreased VEST and PMAN ratios, according to sensory analysis data. In comparison to healthy knee controls, these findings suggest a reduced usage of vestibular and somatosensory afferents. The VEST ratio revealed the usefulness of the signal from a vestibular system to maintain balance, traditionally indicating the quality of the vestibular afferent [42]. All individuals had to compensate for the visual loss and inaccurate somatosensory information in conditions 5 and 6 by increasing their use of vestibular information [44]. A previous study found that poor balance function was associated with a lower reliance on vestibular afferents [36]. According to Figueiro and colleagues [45], people with vestibular system deficits rely heavily on visual cues, and they lose balance if the visual information is removed by closing their eyes [46]. When visual input was removed and somatosensory inputs were altered (condition 5), EQ scores decreased significantly. However, the increased number of falls and decreased equilibrium scores observed in conditions where visual and somatosensory information was distorted or removed could also indicate a sensorimotor processing deficit rather than vestibular system dysfunction [47]. To maintain balance, the central nervous system (CNS) must be able to select appropriate sensory information while ignoring insufficient sensory information. The CNS then compares them to an internal model before sending motor commands to the muscles [48]. However, based on the sensory information available, this central processing may provide inappropriate responses, resulting in a loss of balance [49]. In this study, the function of the vestibular system or central processing in persons with knee OA is unknown, and whether these balance deficiencies represent decreased functionality in individuals with knee OA is also unknown. However, various possible processes could explain the OA group’s balance deficit, although this cross-sectional investigation does not allow these to be confirmed. Individuals with knee OA frequently exhibit several factors that negatively affect their balance, including muscle weakness [50,51,52], impaired somatosensory function [11,51,53,54], and joint contracture [55], as well as significant decline of mechanoreceptors compared to age-matched healthy peers [9].
Additionally, individuals with knee OA had a slower neuromuscular response latency to balance perturbations, indicating a reduced ability to begin in recovering balance rapidly after an unexpected disturbance. The previous research has demonstrated that the triggering of the automatic balance corrections is dependent on hip and trunk proprioceptive inputs, and knee inputs provide a supplementary trigger signal that allows the generation of the very early part of the triceps surae responses [42,56]. The current study showed that the presence of OA in the knee joint might inhibit the onset of an adequate strategy, resulting in longer latency compared to the healthy knee controls.
According to previous research, this long latency response could also be due to a lack of reliance on somatosensory and vestibular information [44,57], which are used to activate and modulate balance correcting responses [58]. In addition, joint pain associated with knee OA may contribute to slower latency, resulting in a reduced ability to maintain balance. Joint pain alters responses and has an impact on muscle activity during the automatic response [59]. Pain is the most common symptom of knee OA and is included in the American College of Rheumatology’s criteria for clinical diagnosis of knee OA [60]. All participants with knee OA in this study had mild-moderate knee joint pain. Thigh pain caused an increase in sway area, sway displacement, electromyographic (EMG) activity, and time required to return to an equilibrium position following an unexpected perturbation [61]. Arvidsson, Eriksson, Knutsson, and Arner [62] concluded that pain could inhibit voluntary muscle activation around the knee, impairing efficient and timely motor responses necessary for balance maintenance. These observations should be considered in fall prevention, particularly when participants are placed in dynamic situations with a conflicted sensory environment, such as those found in daily life.
4.3. Effects of Textured Insoles on Each Group
Although there were no interactions, paired t-tests were conducted to find out whether the textured insoles improved the balance of each group. In knee OA group, there were significant improvements in conditions 5 and 6, Comp, VEST, and PMAN when wearing the textured insoles. In the healthy knee control group, there were statistically significant improvements in condition 6, Comp, VIS, and PMAN when wearing the textured insoles.
Condition 6, in which the visual and somatosensory information was altered, was the only condition in which both groups affected by textured insoles. This finding is consistent with previous research by Qui et al. [34], who demonstrated that textured insoles improved balance even in a more challenging situation with conflicting visual and somatosensory inputs. It is important to note, however, that Qui and collegues’ study [34] did not attempt to embed textured insoles into shoes, but rather investigated the effects of a textured standing surface in older adults. Considering the improvement of VEST in the knee OA group, it seems to be due to an improvement of condition 5, because the improved condition 5 is thought to be due to a higher reliance on somatosensory information by the use of textured insole, not by functional improvement of the vestibular system. Significant improvements in the PMAN in both groups could be of interest. All participants who wore the textured insoles were able to better maintain their balance in inaccurate somatosensory situations, leading to a higher reliance on somatosensory orientation, which would not have been possible without the textured insoles. This could be attributed to increased cutaneous afferent receptor activity while wearing the textured insoles due to hyperesthesia of the plantar surfaces of the feet. More specifically, the physiological mechanisms by which textured insoles can cause changes in balance suggest that textured insoles provide enough stimulation to change the rate of discharge from mechanoreceptors or the firing patterns of sensory afferents located in the skin of the plantar surface [63]. This effect would result in enhanced neural feedback from the cutaneous receptors to the central nervous system, potentially contributing to improved balance.
The textured insoles enhanced balance in the knee OA group, most likely due to the increase in somatosensory input from the plantar surfaces. These findings add to current understanding of the research by complementing the existing data. For example, our findings are consistent with those of Priplata et al. [20], who investigated the use of vibration insoles and found that improved somatosensory feedback can improve balance while standing. Providing vibrational stimulation to the plantar surface of the feet has been proposed as a potential mechanism through which footwear intervention could improve balance [19,21,22] by altering sensorimotor function. The distinction between previous and current research was in the characteristics of the foot stimulation. The plantar surface remained in contact with the indentations of the textured insole in this study. When cutaneous afferents continually respond to prolonged indentations, they are classified as slow adapting mechanoreceptors [25]. In comparison, vibratory interventions allow for the manipulation of the stimulation’s frequency, intensity, phase, and duration. These interventions may have an effect on fast-adapting mechanoreceptors that respond to stimulation with bursts [64]. As the textured insoles used in this study did not deliver electrical stimulation, they did not act on the same concept. Furthermore, such vibration devices may be costly and difficult to employ as an effective intervention to improve balance in daily life. Textured insoles may be a viable alternative and a cost-effective technique to improve balance. A systematic review of the effects of textured interventions found that stimulating sensory receptors in the skin via simple mechanical deformation of the plantar surface by added texture can improve balance performance in a variety of populations, including young people, the elderly, fallers, people with Parkinson’s disease, multiple sclerosis, and people with chronic ankle instability [33]. In this regard, the textured insoles’ effects may result in an increase in proprioceptive sensitivity and an increased reliance on somatosensory information. Although the structural integrity and functional capabilities of sensory receptors in the superficial plantar tissues of individuals with knee OA are unknown, it is surmised that textured insoles can successfully stimulate sensory receptors to increase their output, as is known to occur in healthy adults and other clinical populations, thereby improving balance. In addition, one of the critical aspects of future research in this area is habituation to the textured insoles. Participants in Palluel et al.’s [65,66] studies were instructed to stand or walk for 5 min while wearing textured insoles. However, the effects of textured insoles on perceptual-motor function need to be studied over a much longer period of time, possibly several months [67]. Although our participants testified that the textured insoles were comfortable during the assessments, it is critical to assess over extended periods of time to ensure the long-term adherence will be comforted.
5. Conclusions
The findings suggest that a textured insole intervention can improve overall balance. The benefits of this study for individuals with knee OA are that it may result in the development of an evidence-based footwear intervention that is noninvasive, simple to use, affordable, enables self-management, and can reduce the risk of falls, thereby improving quality of life. We believe this study has clinical relevance because falling is one of the leading causes of injury in the knee OA population. Future research examining the effects of prolonged use of textured insoles is necessary to determine whether a textured insole intervention can result in significant changes in balance and function in the knee OA population.
Funding
This research received no external funding.
Institutional Review Board Statement
The study was conducted according to the guidelines of the Declaration of Helsinki and approved by the Institutional Review Board of UGA (IRB00001440, February 2017).
Informed Consent Statement
Informed consent was obtained from all subjects involved in the study.
Data Availability Statement
The data presented in this study are available upon request from the corresponding author.
Conflicts of Interest
The authors declare no conflict of interest.
Appendix A
In Appendix A are presented Table A1,Table A2,Table A3,Table A4 and Table A5, reporting the Independent t-test, Mann–Whitney U-test, paired t-test, Wilcoxon Signed-Ranks tests analysis results.
Table A1.
Comparison between knee OA group and health knee group. (Null hypothesis: both knee OA and healthy knee groups will have the same scores from balance tests.)
Table A1.
Comparison between knee OA group and health knee group. (Null hypothesis: both knee OA and healthy knee groups will have the same scores from balance tests.)
| Task Condition | Group | Mean | SD | Std. Error Mean | t | p | Decision |
|---|---|---|---|---|---|---|---|
| Condition 1 | Health | 93.88 | 1.38 | 0.32 | 1.967 | 0.058 | Not Reject |
| knee OA | 92.68 | 2.25 | 0.52 | ||||
| Condition 2 | Health | 88.23 | 4.26 | 0.98 | 0.495 | 0.624 | Not Reject |
| knee OA | 87.54 | 4.25 | 0.98 | ||||
| Condition 3 | Health | 90.84 | 3.39 | 0.78 | 2.476 | 0.019 * | Reject |
| knee OA | 86.93 | 5.99 | 1.37 | ||||
| Condition 5 | Health | 59.33 | 9.02 | 2.07 | 3.342 | 0.003 * | Reject |
| knee OA | 38.93 | 25.04 | 5.75 | ||||
| COMP | Health | 75.15 | 5.64 | 1.29 | 0.002 | 0.011 * | Reject |
| knee OA | 64.68 | 13.23 | 3.03 | ||||
| SOM | Health | 129.8 | 9.51 | 2.46 | −0.367 | 0.716 | Not Reject |
| knee OA | 138.37 | 11.58 | 2.99 | ||||
| VEST | Health | 63.18 | 9.50 | 2.18 | 3.234 | 0.004 * | Reject |
| knee OA | 41.96 | 26.99 | 6.19 | ||||
| PMAN | Health | 73.03 | 9.90 | 2.27 | 2.867 | 0.008 * | Reject |
| knee OA | 57.71 | 21.08 | 4.84 | ||||
| M_BACK | Health | 133.16 | 13.36 | 3.06 | −2.163 | 0.037 * | Reject |
| knee OA | 143.68 | 16.49 | 3.78 | ||||
| L_BACK | Health | 132.11 | 8.05 | 1.85 | −1.883 | 0.068 | Not Reject |
| knee OA | 137.89 | 10.71 | 2.46 | ||||
| M_FWD | Health | 129.74 | 14.48 | 3.32 | −1.570 | 0.125 | Not Reject |
| knee OA | 137.89 | 17.43 | 4.00 | ||||
| L_FWD | Health | 128.42 | 9.73 | 2.23 | −2.348 | 0.024 * | Reject |
| knee OA | 137.89 | 14.65 | 3.36 | ||||
| latency | Health | 130.63 | 9.01 | 2.07 | −2.804 | 0.008 * | Reject |
| knee OA | 139.76 | 10.97 | 2.52 |
* Statistically significant mean difference (p < 0.05).
Table A2.
Comparison between knee OA group and health knee group with textured insoles. (Null hypothesis: both knee OA and healthy knee group with textured insoles will have the same scores from balance tests.)
Table A2.
Comparison between knee OA group and health knee group with textured insoles. (Null hypothesis: both knee OA and healthy knee group with textured insoles will have the same scores from balance tests.)
| Task Condition | Group | Mean | SD | Std. Error Mean | t | p | Decision |
|---|---|---|---|---|---|---|---|
| Condition 1 | Health | 93.95 | 1.05 | 0.24 | 2.159 | 0.041 * | Reject |
| knee OA | 92.63 | 2.44 | 0.56 | ||||
| Condition 2 | Health | 89.46 | 2.10 | 0.48 | 0.503 | 0.619 | Not Reject |
| knee OA | 89.02 | 3.18 | 0.73 | ||||
| Condition 3 | Health | 91.53 | 2.03 | 0.47 | 1.264 | 0.219 | Not Reject |
| knee OA | 89.77 | 5.69 | 1.31 | ||||
| Condition 5 | Health | 62.32 | 8.87 | 2.03 | 1.983 | 0.057 | Not Reject |
| knee OA | 54.49 | 14.74 | 3.38 | ||||
| Condition 6 | Health | 66.86 | 9.55 | 2.19 | 1.274 | 0.211 | Not Reject |
| knee OA | 61.32 | 16.38 | 3.76 | ||||
| EQ Comp | Health | 77.58 | 4.71 | 1.08 | 2.015 | 0.054 | Not Reject |
| knee OA | 72.58 | 9.75 | 2.24 | ||||
| SOM | Health | 95.22 | 1.93 | 0.44 | −1.102 | 0.279 | Not Reject |
| knee OA | 96.12 | 2.97 | 0.68 | ||||
| VEST | Health | 66.34 | 9.46 | 2.17 | 1.833 | 0.077 | Not Reject |
| knee OA | 58.74 | 15.40 | 3.53 | ||||
| PMAN | Health | 76.18 | 8.11 | 1.86 | 1.862 | 0.073 | Not Reject |
| knee OA | 69.22 | 14.15 | 3.25 | ||||
| M_BACK | Health | 131.84 | 12.82 | 2.94 | −1.787 | 0.082 | Not Reject |
| knee OA | 140.79 | 17.66 | 4.05 | ||||
| L_BACK | Health | 131.32 | 8.47 | 1.94 | 0.140 | 0.890 | Not Reject |
| knee OA | 130.63 | 19.52 | 4.48 | ||||
| M_FWD | Health | 128.16 | 16.35 | 3.75 | −2.093 | 0.043 * | Reject |
| knee OA | 138.68 | 14.61 | 3.35 | ||||
| L_FWD | Health | 130.79 | 8.54 | 1.96 | −1.378 | 0.177 | Not Reject |
| knee OA | 136.05 | 14.30 | 3.28 | ||||
| latency | Health | 130.39 | 9.36 | 2.15 | −1.960 | 0.058 | Not Reject |
| knee OA | 137.32 | 12.22 | 2.80 |
* Statistically significant mean difference (p < 0.05).
Table A3.
Mann–Whitney U tests results. (Null hypothesis: both knee OA and healthy knee group will have the same scores from balance tests.)
Table A3.
Mann–Whitney U tests results. (Null hypothesis: both knee OA and healthy knee group will have the same scores from balance tests.)
| Sole Condition | Task | Mann–Whitney U | Wilcoxon W | Z | p | Median (Healthy) | Median (Knee OA) | Effect Size r |
|---|---|---|---|---|---|---|---|---|
| Smooth | Condition 4 | 117 | 307 | −1.855 | 0.065 | 78.00 | 69.67 | −0.301 |
| Condition 6 | 112.5 | 302.5 | −1.985 | 0.046 * | 64.00 | 60.33 | −0.322 | |
| VIS | 122 | 312 | −1.708 | 0.091 | 84.45 | 76.75 | −0.277 | |
| Textured | Condition 4 | 141 | 331 | −1.154 | 0.258 | 80.00 | 78.67 | −0.187 |
| VIS | 142 | 332 | −1.124 | 0.271 | 85.36 | 83.69 | −0.182 |
* Statistically significant mean difference (p < 0.05).
Table A4.
Paired t tests results. (Null hypothesis: there are no textured insole effects in the balance.)
Table A4.
Paired t tests results. (Null hypothesis: there are no textured insole effects in the balance.)
| Smooth Insole | Texture Insole | 95% CI for Mean Difference | t | df | p | |||||
|---|---|---|---|---|---|---|---|---|---|---|
| M | SD | M | SD | |||||||
| Condition 1 | Healthy | 93.88 | 1.38 | 93.95 | 1.05 | −0.80 | 0.66 | −0.204 | 18 | 0.841 |
| Knee OA | 92.68 | 2.25 | 92.63 | 2.44 | −1.18 | 1.29 | 0.091 | 18 | 0.928 | |
| Condition 2 | Healthy | 88.23 | 4.26 | 89.46 | 2.10 | −2.91 | 0.45 | −1.536 | 18 | 0.142 |
| Knee OA | 87.54 | 4.25 | 89.02 | 3.18 | −3.10 | 0.16 | −1.899 | 18 | 0.074 | |
| Condition 3 | Healthy | 90.84 | 3.39 | 91.53 | 2.03 | −2.04 | 0.67 | −1.059 | 18 | 0.304 |
| Knee OA | 86.93 | 5.99 | 89.77 | 5.69 | −5.74 | 0.05 | −2.059 | 18 | 0.054 | |
| Condition 5 | Healthy | 59.33 | 9.02 | 62.32 | 8.87 | −6.44 | 0.48 | −1.812 | 18 | 0.087 |
| Knee OA | 38.93 | 25.04 | 54.49 | 14.74 | −22.98 | −8.15 | −4.410 | 18 | 0.000 * | |
| Condition 6 | Healthy | 63.70 | 10.79 | 66.86 | 9.55 | −6.29 | −0.03 | −2.118 | 18 | 0.048 * |
| Knee OA | 48.00 | 22.04 | 61.32 | 16.38 | −20.19 | −4.45 | −3.289 | 18 | 0.004 * | |
| EQ Comp | Healthy | 75.15 | 5.64 | 77.58 | 4.71 | −3.61 | −1.25 | −4.337 | 18 | 0.000 * |
| Knee OA | 64.68 | 13.23 | 72.58 | 9.75 | −11.62 | −4.18 | −4.462 | 18 | 0.000 * | |
| SOM | Healthy | 93.97 | 4.07 | 95.22 | 1.93 | −2.87 | 0.37 | −1.617 | 18 | 0.123 |
| Knee OA | 94.46 | 4.08 | 96.12 | 2.97 | −3.90 | 0.59 | −1.550 | 18 | 0.138 | |
| VEST | Healthy | 63.18 | 9.50 | 66.34 | 9.46 | −6.96 | 0.65 | −1.743 | 18 | 0.098 |
| Knee OA | 41.96 | 26.99 | 58.74 | 15.40 | −24.68 | −8.89 | −4.466 | 18 | 0.000 * | |
| PMAN | Healthy | 73.03 | 9.90 | 76.18 | 8.11 | −5.57 | −0.73 | −2.734 | 18 | 0.014 * |
| Knee OA | 57.71 | 21.08 | 69.22 | 14.15 | −17.27 | −5.74 | −4.196 | 18 | 0.001 * | |
| M_BACK | Healthy | 133.16 | 13.36 | 131.84 | 12.82 | −2.26 | 4.89 | 0.773 | 18 | 0.450 |
| Knee OA | 143.68 | 16.49 | 140.79 | 17.66 | −2.69 | 8.48 | 1.089 | 18 | 0.290 | |
| L_BACK | Healthy | 132.11 | 8.05 | 131.32 | 8.47 | −3.84 | 5.42 | 0.358 | 18 | 0.725 |
| Knee OA | 137.89 | 10.71 | 130.63 | 19.52 | −1.65 | 16.17 | 1.713 | 18 | 0.104 | |
| M_FWD | Healthy | 129.74 | 14.48 | 128.16 | 16.35 | −3.57 | 6.73 | 0.645 | 18 | 0.527 |
| Knee OA | 137.89 | 17.43 | 138.68 | 14.61 | −7.71 | 6.13 | −0.240 | 18 | 0.813 | |
| L_FWD | Healthy | 128.42 | 9.73 | 130.79 | 8.54 | −5.72 | 0.98 | −1.486 | 18 | 0.155 |
| Knee OA | 137.89 | 14.65 | 136.05 | 14.30 | −2.02 | 5.71 | 1.000 | 18 | 0.331 | |
| Latency | Healthy | 130.63 | 9.01 | 130.53 | 9.07 | −1.79 | 2.01 | 0.116 | 18 | 0.909 |
| Knee OA | 139.76 | 10.97 | 137.32 | 12.22 | −0.57 | 5.46 | 1.704 | 18 | 0.105 | |
* Statistically significant mean difference (p < 0.05).
Table A5.
Wilcoxon signed-ranks tests results. (Null hypothesis: there are no textured insole effects in the balance.)
Table A5.
Wilcoxon signed-ranks tests results. (Null hypothesis: there are no textured insole effects in the balance.)
| Groups | Task | T | Z | p | Median (Smooth Insole) | Median (Textured Insole) | Effect Size |
|---|---|---|---|---|---|---|---|
| Knee OA | Condition 4 | 120 | −1.006 | 0.332 | 69.67 | 78.67 | −0.163 |
| VIS | 124 | −1.167 | 0.258 | 76.75 | 83.69 | −0.189 | |
| Healthy knee | Condition 4 | 171 | −3.060 | 0.001 * | 78.00 | 80.00 | −0.496 |
| VIS | 161 | −2.656 | 0.006 * | 84.45 | 85.36 | −4.031 |
* Statistically significant mean difference (p < 0.05).
References
- CDC. Prevalence of doctor-diagnosed arthritis and arthritis-attributable activity limitation—United States, 2010–2012. MMWR Morb. Mortal. Wkly. Rep. 2013, 62, 869–873. [Google Scholar]
- CDC. Prevalence of disabilities and associated health conditions among adults—The United States, 1999. MMWR Morb. Mortal. Wkly. Rep. 2001, 50, 120–125. [Google Scholar]
- Dore, A.L.; Golightly, Y.M.; Mercer, V.S.; Shi, X.A.; Renner, J.B.; Jordan, J.M.; Nelson, A.E. Lower-extremity osteo-arthritis and the risk of falls in a community-based longitudinal study of adults with and without osteoarthritis. Arthritis Care Res. 2015, 67, 633–639. [Google Scholar] [CrossRef]
- Kejonen, P. Body Movements during Postural Stabilization. Measurements with a Motion Analysis System. Academic Dissertation, The Faculty of Medicine, University of Oulu, Oulu, Finland, 2002. [Google Scholar]
- Galley, P.M.; Forster, A.L. Human Movement: An Introductory Text for Physiotherapy Students; Churchill Livingstone: Edinburgh, Scotland; New York, NY, USA, 1982. [Google Scholar]
- Lane, S.J. Sensory modulation. In Sensory integration: Theory and Practice; Bundy, A.C., Ed.; F.A. Davis Company: Philadelphia, PA, USA, 2002; pp. 101–120. [Google Scholar]
- Bronstein, A.M. Clinical Disorders of Balance, Posture, and Gait, 2nd ed.; Arnold Distributed in the U.S. of America by Oxford University Press: London, UK; New York, NY, USA.
- Horak, F.B.; Nashner, L.M.; Diener, H.C. Postural strategies associated with somatosensory and vestibular loss. Exp. Brain Res. 1990, 82, 167–177. [Google Scholar] [CrossRef]
- Tarigan, T.J.E.; Kasjmir, Y.I.; Atmakusuma, D.; Lydia, A.; Bashiruddin, J.; Kusumawijaya, K.; Prihartono, J. The degree of radiographic abnormalities and postural instability in patients with knee osteoarthritis. Acta Medica Indones. 2009, 41, 15–19. [Google Scholar]
- van der Pas, S.; Castell, M.V.; Cooper, C.; Denkinger, M.; Dennison, E.M.; Edwards, M.H.; Deeg, D.J. European project on osteoarthritis: Design of a six-cohort study on the personal and societal burden of osteoarthritis in an older European population. BMC Musculoskelet. Disord. 2013, 14, 138. [Google Scholar] [CrossRef]
- Wylde, V.; Palmer, S.; Learmonth, I.D.; Dieppe, P. Somatosensory abnormalities in knee OA. Rheumatology 2012, 51, 535–543. [Google Scholar] [CrossRef]
- Tanaka, T.; Noriyasu, S.; Ino, S.; Ifukube, T.; Nakata, M. Objective method to determine the contribution of the great toe to standing balance and preliminary observations of age-related effects. IEEE Trans. Rehabil. Eng. 1996, 4, 84–90. [Google Scholar] [CrossRef]
- Eyigör, S.; Hepguler, S. A comparison of muscle training methods in patients with knee osteoarthritis. Clin. Rheumatol. 2004, 23, 192. [Google Scholar] [CrossRef][Green Version]
- Steultjens, M.P.; Dekker, J.; Van Baar, M.E.; Oostendorp, R.A.; Bijlsma, J.W. Muscle strength, pain and disability in patients with osteoarthritis. Clin. Rehabil. 2001, 15, 331–341. [Google Scholar]
- Hatfield, G.; Hammond, C.; Hunt, M. Clinical tests of balance in the knee osteoarthritis population: A systematic review. Osteoarthr. Cartil. 2015, 23, A374. [Google Scholar] [CrossRef][Green Version]
- Hinman, R.; Bennell, K.; Metcalf, B.; Crossley, K. Balance impairments in individuals with symptomatic knee osteoarthritis: A comparison with matched controls using clinical tests. Rheumatology 2002, 41, 1388–1394. [Google Scholar] [CrossRef]
- Khalaj, N.; Abu Osman, N.A.; Mokhtar, A.H.; Mehdikhani, M.; Wan Abas, W.A. Balance and risk of fall in indi-viduals with bilateral mild and moderate knee osteoarthritis. PLoS ONE 2014, 9, e92270. [Google Scholar]
- Barbour, K.E.; Stevens, J.A.; Helmick, C.G.; Luo, Y.-H.; Murphy, L.B.; Hootman, J.M.; Theis, K.; Anderson, L.A.; Baker, N.A.; Sugerman, D.E. Falls and Fall Injuries Among Adults with Arthritis—United States, 2012. MMWR. Morb. Mortal. Wkly. Rep. 2014, 63, 379–383. [Google Scholar]
- Collins, J.J.; Priplata, A.A.; Gravelle, D.C.; Niemi, J.; Harry, J.; Lipsitz, L.A. Noise-enhanced human sensorimotor function. IEEE Eng. Med. Boil. Mag. 2003, 22, 76–83. [Google Scholar] [CrossRef]
- Priplata, A.A.; Niemi, J.; Salen, M.; Harry, J.; Lipsitz, L.A.; Collins, J.J. Noise-Enhanced Human Balance Control. Phys. Rev. Lett. 2002, 89, 238101. [Google Scholar] [CrossRef]
- Priplata, A.A.; Niemi, J.B.; Harry, J.D.; Lipsitz, L.A.; Collins, J.J. Vibrating insoles and balance control in elderly people. Lancet 2003, 362, 1123–1124. [Google Scholar] [CrossRef]
- Priplata, A.A.; Patritti, B.L.; Niemi, J.B.; Hughes, R.; Gravelle, D.C.; Lipsitz, L.A.; Collins, J.J. Noise-enhanced bal-ance control in patients with diabetes and patients with stroke. Ann. Neurol. 2006, 59, 4–12. [Google Scholar] [CrossRef]
- Park, H. The Effects of Textured Insoles on Balance in Individuals with Knee Osteoarthritis. Int. J. Hum. Mov. Sports Sci. 2018, 6, 10–18. [Google Scholar] [CrossRef]
- Zhang, S.; Li, L. The differential effects of foot sole sensory on plantar pressure distribution between balance and gait. Gait Posture 2013, 37, 532–535. [Google Scholar] [CrossRef] [PubMed]
- Kennedy, P.M.; Inglis, J.T. Distribution and behaviour of glabrous cutaneous receptors in the human foot sole. J. Physiol. 2002, 538, 995–1002. [Google Scholar] [CrossRef]
- Perry, S.D. Evaluation of age-related plantar-surface insensitivity and onset age of advanced insensitivity in older adults using vibratory and touch sensation tests. Neurosci. Lett. 2006, 392, 62–67. [Google Scholar] [CrossRef]
- Hong, S.L.; Manor, B.; Li, L. Stance and sensory feedback influence on postural dynamics. Neurosci. Lett. 2007, 423, 104–108. [Google Scholar] [CrossRef]
- Lowrey, C.R.; Strzalkowski, N.D.J.; Bent, L.R. Cooling reduces the cutaneous afferent firing response to vibratory stimuli in glabrous skin of the human foot sole. J. Neurophysiol. 2013, 109, 839–850. [Google Scholar] [CrossRef] [PubMed]
- Wu, G.; Chiang, J.-H. The significance of somatosensory stimulations to the human foot in the control of postural reflexes. Exp. Brain Res. 1997, 114, 163–169. [Google Scholar] [CrossRef]
- Layne, C.; Mulavara, A.; Pruett, C.; McDonald, P.; Kozlovskaya, I.; Bloomberg, J. The use of in-flight foot pressure as a countermeasure to neuromuscular degradation. Acta Astronaut. 1998, 42, 231–246. [Google Scholar] [CrossRef]
- Layne, C.S.; Forth, K.E.; Baxter, M.F.; Houser, J.J. Voluntary neuromuscular activation is enhanced when paired with a mechanical stimulus to human plantar soles. Neurosci. Lett. 2002, 334, 75–78. [Google Scholar] [CrossRef]
- De-Doncker, L.; Picquet, F.; Falempin, M. Effects of cutaneous receptor stimulation on muscular atrophy developed in hindlimb unloading condition. J. Appl. Physiol. 2000, 89, 2344–2351. [Google Scholar] [CrossRef] [PubMed]
- Orth, D.; Davids, K.; Wheat, J.; Seifert, L.; Liukkonen, J.; Jaakkola, T.; Kerr, G. The role of textured material in supporting perceptual-motor functions. PLoS ONE 2013, 8, e60349. [Google Scholar] [CrossRef]
- Qiu, F.; Cole, M.; Davids, K.; Hennig, E.; Silburn, P.; Netscher, H.; Kerr, G. Enhanced somatosensory information decreases postural sway in older people. Gait Posture 2012, 35, 630–635. [Google Scholar] [CrossRef]
- Roos, E.M.; Herzog, W.; Block, J.; Bennell, K. Muscle weakness, afferent sensory dysfunction and exercise in knee osteoarthritis. Nat. Rev. Rheumatol. 2010, 7, 57–63. [Google Scholar] [CrossRef] [PubMed]
- Jones, K.D.; King, L.A.; Mist, S.D.; Bennett, R.M.; Horak, F.B. Postural control deficits in people with fibromyalgia: A pilot study. Arthritis Res. Ther. 2011, 13, R127. [Google Scholar] [CrossRef]
- Cavanaugh, J.T.; Mercer, V.S.; Stergiou, N. Approximate entropy detects the effect of a secondary cognitive task on postural control in healthy young adults: A methodological report. J. Neuroeng. Rehabil. 2007, 4, 42. [Google Scholar] [CrossRef]
- Wrisley, D.M.; Stephens, M.J.; Mosley, S.; Wojnowski, A.; Duffy, J.; Burkard, R. Learning effects of repetitive ad-ministrations of the sensory organization test in healthy young adults. Arch. Phys. Med. Rehabil. 2007, 88, 1049–1054. [Google Scholar] [CrossRef] [PubMed]
- Ford-Smith, C.D.; Wyman, J.F.; Elswick, R.; Fernandez, T.; Newton, R.A. Test-retest reliability of the sensory organization test in noninstitutionalized older adults. Arch. Phys. Med. Rehabil. 1995, 76, 77–81. [Google Scholar] [CrossRef]
- Hebert, J.R.; Manago, M.M. Reliability and Validity of the Computerized Dynamic Posturography Sensory Organization Test in Persons with Multiple Sclerosis. Int. J. MS Care 2016, 19, 151–157. [Google Scholar] [CrossRef]
- Vanicek, N.; Strike, S.; McNaughton, L.; Polman, R. Postural Responses to Dynamic Perturbations in Amputee Fallers versus Nonfallers: A Comparative Study with Able-Bodied Subjects. Arch. Phys. Med. Rehabil. 2009, 90, 1018–1025. [Google Scholar] [CrossRef] [PubMed]
- Gauchard, G.C.; Vançon, G.; Meyer, P.; Mainard, D.; Perrin, P.P. On the role of knee joint in balance control and postural strategies: Effects of total knee replacement in elderly subjects with knee osteoarthritis. Gait Posture 2010, 32, 155–160. [Google Scholar] [CrossRef]
- Cohen, H.; Heaton, L.G.; Congdon, S.L.; Jenkins, H.A. Changes in Sensory Organization Test Scores with Age. Age Ageing 1996, 25, 39–44. [Google Scholar] [CrossRef] [PubMed]
- Vouriot, A.; Gauchard, G.C.; Chau, N.; Benamghar, L.; Lepori, M.-L.; Mur, J.-M.; Perrin, P.P. Sensorial organisation favouring higher visual contribution is a risk factor of falls in an occupational setting. Neurosci. Res. 2004, 48, 239–247. [Google Scholar] [CrossRef] [PubMed]
- Figueiro, M.G.; Plitnick, B.; Rea, M.S.; Gras, L.Z.; Rea, M.S. Lighting and perceptual cues: Effects on gait measures of older adults at high and low risk for falls. BMC Geriatr. 2011, 11, 49. [Google Scholar] [CrossRef]
- Paulus, W.; Straube, A.; Brandt, T.H. Visual postural performance after loss of somatosensory and vestibular function. J. Neurol. Neurosurg. Psychiatry 1987, 50, 1542–1545. [Google Scholar] [CrossRef] [PubMed]
- Wolfson, L.; Whipple, R.; Derby, C.A.; Amerman, P.; Murphy, T.; Tobin, J.N.; Nashner, L. A dynamic posturography study of balance in healthy elderly. Neurology 1992, 42, 2069–2075. [Google Scholar] [CrossRef] [PubMed]
- Mergner, T.; Huber, W.; Becker, W. Vestibular-neck interaction and transformation of sensory coordinates. J. Vestib. Res. 1997, 7, 347–367. [Google Scholar] [CrossRef] [PubMed]
- Peterka, R.J.; Black, F.O. Age-related changes in human posture control: Sensory organization tests. J. Vestib. Res. 1990, 1, 73–85. [Google Scholar] [CrossRef]
- Hassan, B.S.; Mockett, S.; Doherty, M. Static postural sway, proprioception, and maximal voluntary quadriceps contraction in patients with knee osteoarthritis and normal control subjects. Ann. Rheum. Dis. 2001, 60, 612–618. [Google Scholar] [CrossRef]
- Hurley, M.V.; Scott, D.L.; Rees, J.; Newham, D. Sensorimotor changes and functional performance in patients with knee osteoarthritis. Ann. Rheum. Dis. 1997, 56, 641–648. [Google Scholar] [CrossRef]
- Slemenda, C.; Brandt, K.D.; Heilman, D.K.; Mazzuca, S.; Braunstein, E.M.; Katz, B.P.; Wolinsky, F. Quadriceps Weakness and Osteoarthritis of the Knee. Ann. Intern. Med. 1997, 127, 97–104. [Google Scholar] [CrossRef]
- Barrett, D.S.; Cobb, A.G.; Bentley, G. Joint proprioception in normal, osteoarthritic and replaced knees. J. Bone Jt. Surg. 1991, 73, 53–56. [Google Scholar] [CrossRef]
- Knoop, J.; Steultjens, M.P.; van der Leeden, M.; van der Esch, M.; Thorstensson, C.A.; Roorda, L.D.; Dekker, J. Proprioception in knee osteoarthritis: A narrative review. Osteoarthr. Cartil. 2011, 19, 381–388. [Google Scholar] [CrossRef]
- Clavet, H.; Hébert, P.C.; Fergusson, D.; Doucette, S.; Trudel, G. Joint contracture following prolonged stay in the intensive care unit. Can. Med Assoc. J. 2008, 178, 691–697. [Google Scholar] [CrossRef]
- Bloem, B.; Allum, J.H.J.; Carpenter, M.; Verschuuren, J.; Honegger, F. Triggering of balance corrections and com-pensatory strategies in a patient with total leg proprioceptive loss. Exp. Brain Res. 2002, 142, 91–107. [Google Scholar] [PubMed]
- Gauchard, G.C.; Gangloff, P.; Jeandel, C.; Perrin, P.P. Physical activity improves gaze and posture control in the elderly. Neurosci. Res. 2003, 45, 409–417. [Google Scholar] [CrossRef]
- Allum, J.H.; Shepard, N.T. An overview of the clinical use of dynamic posturography in the differential diagno-sis of balance disorders. J. Vestib. Res. 1999, 9, 223–252. [Google Scholar] [CrossRef]
- Takacs, J.; Carpenter, M.G.; Garland, S.J.; Hunt, M.A. The Role of Neuromuscular Changes in Aging and Knee Osteoarthritis on Dynamic Postural Control. Aging Dis. 2013, 4, 84–99. [Google Scholar]
- Altman, R.; Asch, E.; Bloch, D.; Bole, G.; Borenstein, D.; Brandt, K.; Christy, W.; Cooke, T.D.; Greenwald, R.; Hochberg, M.; et al. Development of criteria for the classification and reporting of osteoarthritis: Classification of osteoarthritis of the knee. Arthritis Rheum. 1986, 29, 1039–1049. [Google Scholar] [CrossRef] [PubMed]
- Hirata, R.P.; Ervilha, U.F.; Arendt-Nielsen, L.; Graven-Nielsen, T. Experimental muscle pain challenges the postural stability during quiet stance and unexpected posture perturbation. J. Pain Off. J. Am. Pain Soc. 2011, 12, 911–919. [Google Scholar] [CrossRef] [PubMed]
- Arvidsson, I.; Eriksson, E.; Knutsson, E.; Arnér, S. Reduction of Pain Inhibition on Voluntary Muscle Activation by Epidural Analgesia. Orthopedics 1986, 9, 1415–1419. [Google Scholar] [CrossRef]
- Hatton, A.L.; Dixon, J.; Rome, K.; Brauer, S.G.; Williams, K.; Kerr, G. The effects of prolonged wear of textured shoe insoles on gait, foot sensation and proprioception in people with multiple sclerosis: Study protocol for a randomised controlled trial. Trials 2016, 17, 208. [Google Scholar] [CrossRef] [PubMed]
- Hatton, A.L.; Dixon, J.; Rome, K.; Newton, J.L.; Martin, D.J. Altering gait by way of stimulation of the plantar surface of the foot: The immediate effect of wearing textured insoles in older fallers. J. Foot Ankle Res. 2011, 5, 11. [Google Scholar] [CrossRef] [PubMed]
- Palluel, E.; Nougier, V.; Olivier, I. Do spike insoles enhance postural stability and plantar-surface cutaneous sensitivity in the elderly? Age 2008, 30, 53–61. [Google Scholar] [CrossRef] [PubMed]
- Palluel, E.; Olivier, I.; Nougier, V. The lasting effects of spike insoles on postural control in the elderly. Behav. Neurosci. 2009, 123, 1141–1147. [Google Scholar] [CrossRef] [PubMed]
- Qiu, F.; Cole, M.H.; Davids, K.W.; Hennig, E.M.; Silburn, P.A.; Netscher, H.; Kerr, G.K. Effects of Textured Insoles on Balance in People with Parkinson’s Disease. PLoS ONE 2013, 8, e83309. [Google Scholar]
Publisher’s Note: MDPI stays neutral with regard to jurisdictional claims in published maps and institutional affiliations. |
© 2021 by the author. Licensee MDPI, Basel, Switzerland. This article is an open access article distributed under the terms and conditions of the Creative Commons Attribution (CC BY) license (https://creativecommons.org/licenses/by/4.0/).