Featured Application
The quantitative comparison of the dynamic characteristics between super-large and small diameter twin tunnels under train vibration is helpful to the design and construction of super-large diameter twin tunnels.
Abstract
Train vibration from closely aligned adjacent tunnels could cause safety concerns, especially given the soaring size of the tunnel diameter. This paper established a two-dimensional discrete element model (DEM) of small (d = 6.2 m) and super-large (D = 15.2 m) diameter cross-river twin tunnels and discussed the dynamic characteristics of adjacent tunnels during the vibration of a train that runs through the tunnel at a speed of 120 km/h. Results in the D tunnel showed that the horizontal walls have the same horizontal displacement (DH) and the vertical walls have the same vertical displacement (DV). The stress state of the surroundings of the D tunnel is the decisive factor for DH, and the distance from the vibration point to the measurement point is the decisive factor for DV. Results in the comparison of the d and D tunnels showed that the D tunnel is more stable than the d tunnel with respect to two aspects: the time the tunnel reaches the equilibrium state and the vibration amplitude of the structure’s dynamic and static responses. The dynamic characteristic of the d and D tunnel is significantly different. This research is expected to guide the design and construction of large diameter twin tunnels.
1. Introduction
With the increasing shortage of underground space in cities, large diameter twin tunnels with near distances (i.e., smaller than 0.25 times diameter) are becoming more common. During tunnel operation, the vibration of a high-speed train disturbs the tunnel where the train runs and affects the structural stability and the train operation safety of the near-spacing adjacent tunnel.
The diameter of the tunnel is the main characteristic that will affect the behavior of the tunnel. Therefore, the research of tunnels can classify various tunnels by the size of the tunnel’s diameter. There are many tunnels with a diameter of d1 = 5–10 m under train vibration [1,2,3]. Studies with diameters between 10 and 15 m mainly focus on the construction stage of the tunnel [4,5,6]. The research focused on diameter d3 ≥ 15 m tunnels is inadequate. Studies focus only on the construction process of d3 ≥ 15 m tunnels [7,8] and the seismic characteristics of d3 ≥ 15 m tunnels during their operation period [9,10,11]. The dynamic characteristics of d3 ≥ 15 m cross-river twin tunnels under train vibration are different from those of small diameter twin tunnels. However, there are still few pieces of research on the dynamic characteristics of a d3 ≥ 15 m tunnel under the vibration of a high-speed trains during tunnel operation. It is necessary to conduct specialized research on d3 ≥ 15 m twin tunnels, especially under train vibration.
In the study of train vibration in a single tunnel, Huang et al. [12] found that the final settlement of the subway tunnel in the saturated clay layer could reach 80 mm due to repeated train vibration. Yang et al. [13] found that the 2.5-dimensional numerical model of the soil-tunnel system under a moving train load was more accurate than the 2-dimensional model. He et al. [14,15] conducted a series of studies on the dynamic response of a single tunnel under train vibration load by using analytical methods and both 2.5-dimension and 3-dimension numerical methods. Yang et al. conducted a systematic study on the dynamic characteristics of single tunnel structure and its surroundings under train operation vibration [16,17]. Zhang et al. used DEM to study the dynamic characteristics of tunnel segments and surrounding rocks under train vibration in a single tunnel [1,18].
Studies on train vibration in twin tunnels are as follows. Ding et al. studied the influence of precision instruments in nearby laboratories under the vibration of Beijing Metro Line 8 and Line 15 [19]. He and Yan conducted a series of studies on the vibration response of trains under parallel-twin tunnels [20] and crossed twin tunnels [21]. Zhao et al. [22] studied the impact of high-speed train vibration loads on nearby damaged tunnels. It is necessary to re-construct and anchor the damaged tunnel to ensure the tunnel’s safety. He et al. [23] established a 2.5-dimensional model that can predict train-induced vibration in tunnels with any cross-section. After that, He et al. [24] further proposed a three-dimensional analytical model for the interaction of subway vibration in parallel double tunnels. Zhou et al. [25] found that adjacent tunnels and water saturation had significant effects on soil vibration under subway vibration.
From the research on train vibration in single and twin tunnels, closely spaced twin tunnels (smaller than 0.25 times diameter) have become more common. In contrast, the research on train vibration has mainly focused on single tunnels. The research on train vibration has rarely focused on twin tunnels, and has especially neglected twin tunnels with a distance smaller than 0.25 times diameter.
This paper took the San-yang Road cross-river twin tunnels as the project background and established the small diameter (d = 6.2 m) and super-large diameter (D = 15.2 m) twin tunnels model by DEM. A train vibration load of 120 km/h in the first tunnel was simulated by several functions changing with time. In the first part, displacement and velocity of smoke exhaust board (Wall_1), vehicle lane board (Wall_2), left and right partition of train track (Wall_3 and Wall_4) in D adjacent tunnel were discussed In the second part, the displacement and velocity of sleepers and liners between the d and D adjacent tunnels were compared. The above analysis can be used to quantitatively compare the dynamic characteristics of super-large (D = 15.2 m) and small (d = 6.2 m) diameter twin tunnels under train vibrations.
2. Project Background and Type A Train
The project background of super-large diameter (D = 15.2 m) twin tunnels is the cross-river twin tunnels of San-yang Road in Wuhan Metro Line 7, as shown in Figure 1 [26]. The San-yang Road cross-river twin tunnels are used for urban road, and rail transit line 7 is the largest shield tunnel in China. The primary parameters of super-large diameter twin tunnels are 0.5 D buried depths, 1.0 D water depths, and 0.25 D spacing between the twin tunnels. The tunnel surroundings are silty sand, whose physical and mechanical parameters are shown in Table 1.
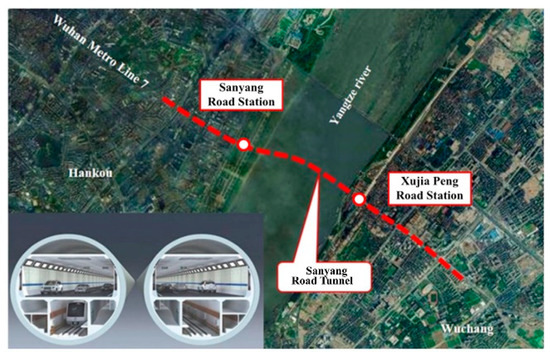
Figure 1.
San-yang Road Yangtze River tunnel in Wuhan Metro Line 7.

Table 1.
Physical and mechanical parameters of silty sand.
A supposed small diameter (d = 6.2 m) twin tunnels model was established compared with the D twin tunnels. The basic parameters are 0.5 d buried depths, 1.0 d water depths, and 0.25 d spacing between twin tunnels.
The primary parameter and the train vibration load of type A train are shown in Figure 2. The vibration load of carriages 2–5 is the same, and the load on the train head mirrors a load of train tail. The details of the train vibration load are shown in Formula (1) [3].
where F1 is the function of the front spindle box of the first wheel; F2 is a function of the distance between adjacent wheels; F3 is a function of the middle part of the train; F4 is the buoyancy box function of adjacent cars; f1, f2, f3, and f4 are the frequencies of these functions, and t is the running time of the train (considering the dynamic characteristics of train operation, F0 at 120 km/h is 31,221 N) [27].
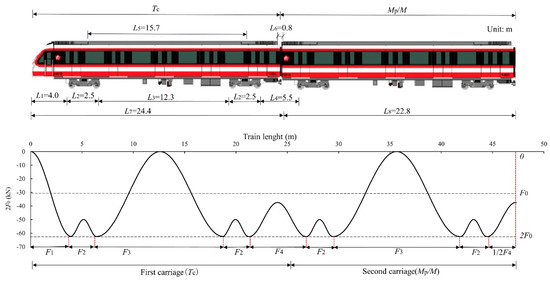
Figure 2.
Vibration load caused by type A trains running at 120 km/h.
3. Micro-Parameters of Silty Sand and C60 Concrete
The calibration process is necessary for determining the micro-parameters of tunnel structure and surroundings in DEM. The tunnel structure contains walls, sleepers, and liners constructed by C60 concrete and the surroundings are silty sand. The size of particles in DEM affects the micro-parameters of silty sand and C60 concrete. Three sizes of silty sand (Table 2) and two sizes of C60 concrete (Table 3) have been calibrated in this section.
Table 2.
Micro-parameters of silty sand in the DEM model.
Table 3.
Micro-parameters of C60 in the DEM model.
The calibration process of silty sand② is as follows. First, two kinds of sand were mixed for the laboratory direct shear test for the shear force-strain curve of silty sand. By trial and error, 35% of Sand_1 and 65% of Sand_2 were used to obtain silty sand’s physical and mechanical parameters (Figure 3). Second, the initial and final states of the shear test box were established in DEM (Figure 4) and normal stiffness, tangential stiffness, and coefficient of friction were adjusted to obtain the stress-shear displacement ratio curve, which coincides with the curve obtained by laboratory direct shear test as shown in Figure 5. Finally, the microscopic parameters of silty sand② were used in the twin tunnel model in Section 4. The calibration process of other sizes of silty sand are similar, and the micro-parameters of silty sand①–③ are shown in Table 2.
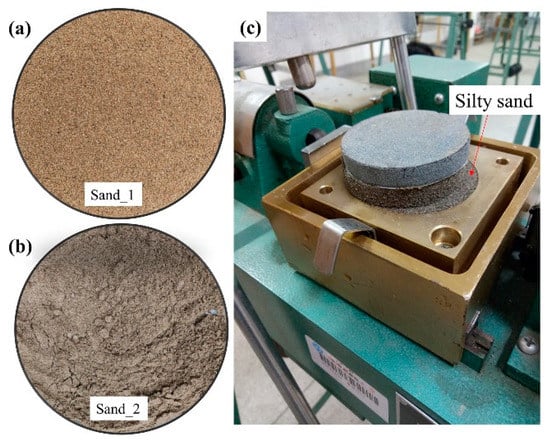
Figure 3.
Sand samples and laboratory direct shear test: (a) Sand_1; (b) Sand_2; (c) Laboratory direct shear test.
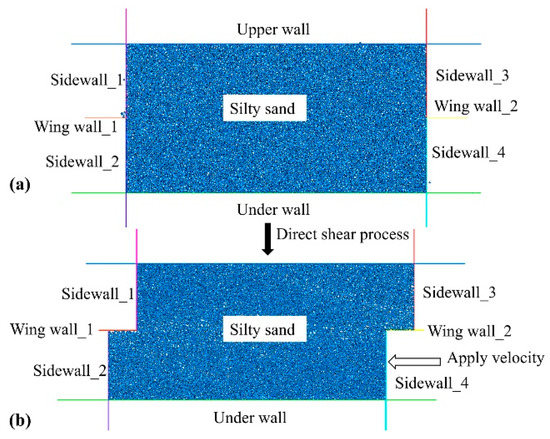
Figure 4.
Two states of the direct shear test in two-dimension DEM of silty sand: (a) Initial state; (b) Final state.
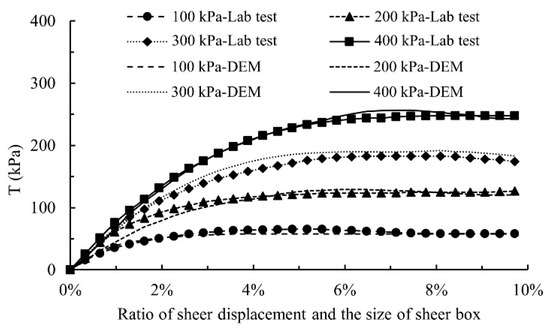
Figure 5.
Curve fitting of shear force and shear displacement ratio of silty sand under 100–400 kPa pressure obtained from laboratory direct shear tests and DEM direct shear tests.
C60 concrete was calibrated by triaxial test in DEM [28]. After calibration, the micro-parameters of C60① and C60② concrete are listed in Table 3 [18,29].
4. Twin Tunnels Model in DEM
The establishment process of the DEM model with small diameter (d = 6.2 m) and super-large diameter (D = 15.2 m) twin tunnels are similar. T1 and T2 represent the first and adjacent super-large (D) tunnels, and t1 and t2 are the first and adjacent small (d) tunnels. The outline of small and super-large diameter twin tunnels in DEM is shown in Figure 6. The size of the model is large enough to avoid the boundary effect. [3,28,30] The temperature influence is ignored since the whole time of the train passing the tunnel is 4.18 s. The parameters of the d and D twin tunnels are shown in Table 4. The steps of construction of super-large diameter (D = 15.2 m) twin tunnels model under train vibration is as follows:
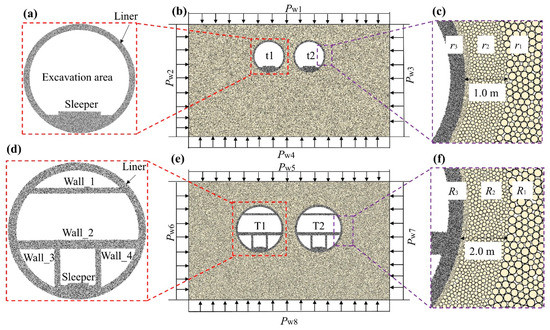
Figure 6.
Small and super-large diameter twin tunnels in DEM: (a) Cross section of small tunnel (d = 6.2 m); (b) Outline of small twin tunnels DEM model; (c) The size of particles in the small twin tunnels; (d) Cross section of super-large tunnel (D = 15.2 m); (e) Outline of super-large twin tunnels DEM model; (f) The size of particles in the super-large twin tunnels.
Table 4.
Parameters of small (d) and super-large (D) twin tunnels in the DEM model.
- Step 1:
- Four walls are generated as the model’s boundary, and the particles with R1 = 0.12–0.2 m, R2 = 0.06–0.1 m, and R3 = 0.02–0.03 m are created inside the area. The particles near the twin tunnels (smaller than 2.0 m) are generated with particles (R2 = 0.06–0.1 m). Different sizes of particles used in different areas can save calculation time and obtain accurate results. The larger distance between the walls and the tunnel can weaken the boundary effect of the wall to the maximum extent to obtain accurate calculation results. The initial balance state of the model is achieved through calculation, and the initial model is shown in Figure 7a. At this time, all particles in the model adopt the parameters of silty sand.
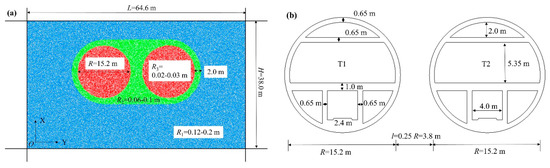
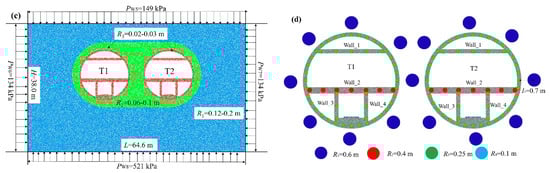 Figure 7. The process of DEM model setup of super-large diameter (D = 15.2 m) twin tunnels: (a) The initial model of super-large diameter twin tunnels; (b) the size of the geometry of super-large diameter twin tunnels; (c) the cross-section of super-large diameter twin tunnels; (d) detailed layout of monitoring points of the super-large diameter twin tunnels.
 - Step 2:
- The cross section of super-large diameter twin tunnels as shown in Figure 7b which will built in the red particle region in Figure 7a. First, the geometry, as shown in Figure 7b, was generated; second, redundancies particles inside the D twin tunnel liners are deleted according to the cross-section of the D twin tunnel (Figure 7b); third, micro-parameters of C60 concrete have been used in the red region, as shown in Figure 7c.
- Step 3:
- Gravity and water pressure are set. The lateral pressure coefficient is 0.4. The control conditions of the equilibrium state of the model will be stricter. If the maximum velocity of particles in the model is no more than 0.5 mm/s, the model is considered to reach a balanced state.
- Step 4:
5. Results and Discussion
This part is divided into two sections. In section one, the influence of the train vibration on the displacement and velocity of T2 is discussed, such as smoke exhaust board (Wall_1), vehicle lane board (Wall_2), and left and right partition of train track (Wall_3 and Wall_4). In section two, the displacement and velocity of sleepers and liners between t2 and T2 under train vibration are compared. DH and DV are horizontal and vertical displacements; VH and VV are horizontal and vertical velocities.
5.1. Walls of T2
5.1.1. Smoke Exhaust Board (Wall_1)
Figure 8 shows the displacement and velocity of five measurement points (A1, B1, C1, D1, 5and E1) of Wall_1 in T2. DH of the five measurement points from left to right along with the vibration process of the train (Figure 8a). A positive value of the DH represents that the Wall_1 moves to the right, while the negative value represents that the Wall_1 moves to the left. After reaching the peak value of horizontal oscillation at about 0.8 s, the amplitude of horizontal oscillation of Wall_1 gradually decreases.
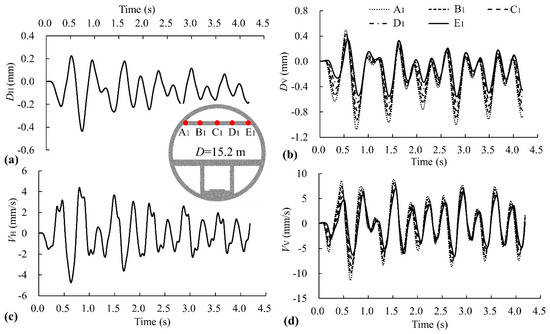
Figure 8.
Displacement and velocity of five measurement points (A1, B1, C1, D1 and E1) in Wall_1 of T2: (a) DH; (b) DV; (c) VH; (d) VV.
The DH of Wall_1 is the same, which is possibly related to the larger tension and compression stiffness of Wall_1. The elastic modulus of C60 concrete E = 3.65 MPa; the thickness of Wall_1 is 0.65 m, and the supposed width is 1.0 m (so, the cross-sectional area of Wall_1 is 0.65 m2). Wall_1 of larger tension and compression stiffness (EAW1 = 2.37 × 10⁶ N/m) has minor deformation so that each measurement point of Wall_1 has the same DH. The variation law of VH of the Wall_1 is shown in Figure 8c is very similar to that of DH, as shown in Figure 8a.
DV varies during train vibration (Figure 8b). Positive values indicate that the measurement points are moving upward, and the negative values indicate that measurement points are moving downward. After the peak value of vertical oscillation is reached at about 0.8 s, the amplitude of vertical oscillation of the Wall_1 decreases slightly. The negative of the DV is greater than the positive; this indicates that the downward displacement is larger than the upward displacement of Wall_1. The DV changes at different monitoring points of the Wall_1 are different, and the left monitoring point near the vibration point is greater than the right monitoring point. The DV of each measurement point is closely related to the distance between the measurement point and T1.
Compared to Figure 8c,d, the VV of the Wall_1 is greater than the VH of the Wall_1, and the VH and VV amplitude increases first and then decreases during the whole train operation. The inconsistency between the VH and VV of Wall_1 is due to the fact that the train vibration load is vertical, so the disturbance in the vertical direction of Wall_1 is more significant and lasts the whole train vibration process.
According to Figure 8a,d, the displacement and velocity of Wall_1 both reached the maximum at 0.8 s in the train vibration process, and then both decreased slightly with the train vibration process. Therefore, the time point of 0.8 s should be focused on. The stable condition of the model is changed during 0–0.8 s. As a result, the displacement and velocity of the Wall_1 are more significant. The surroundings of the twin tunnel model reach a new stable state gradually after that, which can support the T2 liner so that the displacement and velocity of the Wall_1 are small.
To further compare the differences between the DV and VV, the maximum and minimum values of the DV and VV of the five measurement points of the Wall_1 are shown in Figure 9. Maximum values of DV and VV of the monitoring points-from left to right-decreased slightly, while the minimum values of DV and VV increased significantly. Therefore, the maximum and minimum values of DV and VV decreased rapidly from left to right. This further validates the pattern found in Figure 8.
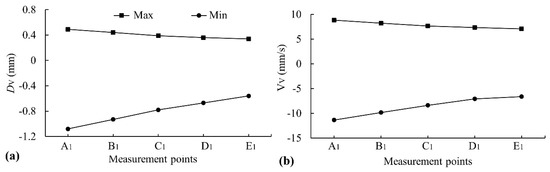
Figure 9.
Maximum and minimum value of the DV and VV of five measurement points (A1, B1, C1, D1 and E1) in Wall_1 of T2: (a) maximum and minimum value of the DV; (b) maximum and minimum value of the VV.
Figure 8 and Figure 9 quantitatively analyze the static and dynamic characteristics of Wall_1s from displacement and velocity in horizontal and vertical directions, respectively. The DV and VV of the Wall_1 are greater than the DH and DV. The variation law of VH and VV is similar to that of DH and DV, suggesting that the displacement of the structure can be used as an essential supplementary index for analyzing the dynamic characteristic of T2.
5.1.2. Vehicle Lane Board (Wall_2)
Figure 10 shows the displacement and velocity of seven measurement points (A2, B2, C2, D2, E2, F2 and G2) of Wall_2 in T2. The variation law of displacement and velocity of Wall_2 is basically the same as that of Wall_1. The DH of Wall_2 is the same, which means that the tension and compression deformation of Wall_2 is small for the larger tension and compression stiffness (EAW2 = 3.65 × 10⁶ N/m), which is similar to the law of Wall_1. The more extensive DV at the left side of Wall_2 is caused by the near distance to the train vibration position.
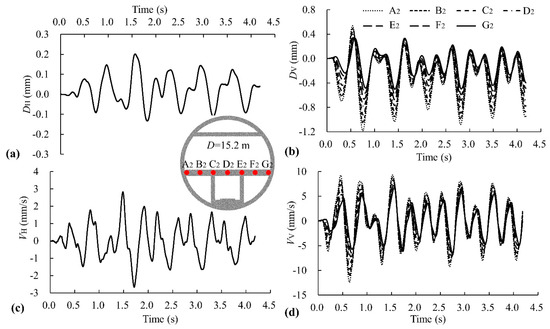
Figure 10.
Displacement and velocity of seven measurement points (A2, B2, C2, D2, E2, F2 and G2) in Wall_2 of T2: (a) DH; (b) DV; (c) VH; and (d) VV.
DH of Wall_1 is much larger than that of Wall_2 (Figure 8a and Figure 10a). Wall_1 is located in the upper part of the cross-section in T2, and Wall_2 is located in the middle part of the cross-section in T2. Soil stress in the horizontal direction (stress-xx) around the two sides of Wall_1 is 1.90 × 10⁵ and −1.28 × 10⁶, and soil stress in the horizontal direction (stress-xx) around the two sides of Wall_2 are 4.09 × 10⁶ and −3.57 × 10⁶. Soil stress in the vertical direction (stress-yy) around the two sides of Wall_1 is −1.16 × 10⁶ and −7.72 × 10⁵, and soil stress in the vertical direction (stress-yy) around the two sides of Wall_2 is 1.76 × 10⁶ and −4.46 × 10⁶. The stress around Wall_1 is smaller than Wall_2, so Wall_1 has larger DH for smaller limitations. The stress state of surroundings significantly affects the DH of Wall_1 and Wall_2.
The DV of Wall_2 is greater than that of Wall_1 at the midpoint (Figure 8b and Figure 10b) as Wall_2 is close to the train vibration in T1. Therefore, the DV of the walls is much affected by distance while less affected by surroundings extrusion.
Maximum and minimum values of the DV and VV of the seven measurement points of the Wall_2 are shown in Figure 11. The DV and VV decrease from point A2 to point G2. The variation law of DV and VV in Wall_2 conform to the law of “near is large and far is small”.
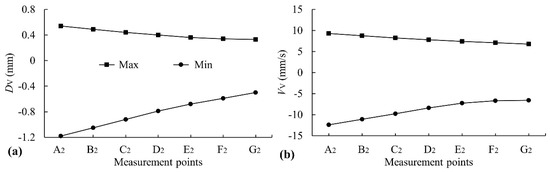
Figure 11.
Maximum and minimum value of the DV and VV of seven measurement points (A2, B2, C2, D2, E2, F2, and G2) in Wall_2 of T2: (a) maximum and minimum value of the DV; (b) maximum and minimum value of the VV.
5.1.3. Left and Right Partition of Train Track (Wall_3 and Wall_4)
Figure 12 compares the horizontal displacement and velocity of Wall_3 and Wall_4 in T2. The variation law of DH and VH of Wall_3 and Wall_4 is basically the same. The negative value of DH is basically the same at the monitoring points of different heights, but the positive DH gradually increases. The peak-peak value of DH of Wall_3 and Wall_4 decreases from top to bottom (Figure 12a), possibly related to the combined influence of the stress of surroundings around T2 and the distance between monitoring points and vibration position. The DH of Wall_3 and Wall_4 is smaller than that of Wall_1 and Wall_2, as Wall_3 and Wall_4 are lower and have more considerable surrounding stress.
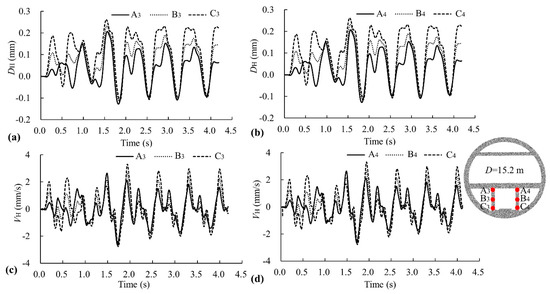
Figure 12.
Horizontal displacement and velocity of Wall_3 and Wall_4 in T2: (a) DH of Wall_3; (b) DH of Wall_4; (c) DV of Wall_3; and (d) DV of Wall_4.
Figure 13 shows the DV and VV of Wall_3 and Wall_4 in T2. The DV of Wall_3 is slightly larger than that of Wall_4, as Wall_3 is closer to the train vibration point of T1. Each measurement point of Wall_3 and Wall_4 has the same DV (Figure 13a,b) due to the larger tension and compression stiffness (EAW3 = EAW4 = 2.37 × 10⁶ N/m).
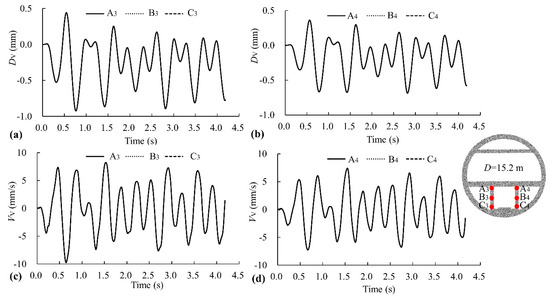
Figure 13.
Vertical displacement and velocity of Wall_3 and Wall_4 in T2: (a) DV of Wall_3; (b) DV of Wall_4; (c) VV of Wall_3; and (d) VV of Wall_4.
Figure 8, Figure 9, Figure 10, Figure 11, Figure 12 and Figure 13 show that all inner walls (Wall_1, Wall_2, Wall_3, and Wall_4) experienced oscillatory movement both in the horizontal and vertical direction during train vibration. Vertical displacement and velocity are more remarkable than horizontal displacement and velocity. The horizontal walls (Wall_1 and Wall_2) have the same horizontal displacement, and the vertical walls (Wall_3 and Wall_4) have the same vertical displacement. DH decreases gradually from top to bottom because the silty sand stress rises. DV increases gradually from top to bottom because the measurement point is closer to the train vibration point. The variation law of VH and VV is similar to that of DH and DV, suggesting that the displacement of the structure can be used as an essential supplementary index for analyzing the dynamic characteristic of T2.
5.2. Comparison of t2 and T2
5.2.1. Sleeper
Figure 14 compares the displacement and velocity of sleepers between t2 and T2. Monitoring points S2 and S4 are the points of trains load in T2. Displacement and velocity of the two monitoring points (S2 and S4) of the t2 sleeper basically coincide, and the displacement and velocity of the T2 sleeper also coincide. Therefore, four monitoring points are compared in this figure, while only two curves can be seen intuitively in each sub-figure.
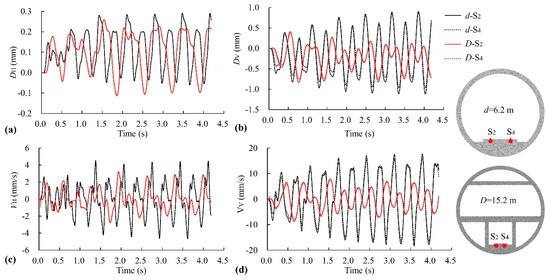
Figure 14.
Displacement and velocity of sleepers between t2 and T2: (a) DH; (b) DV; (c) VH; and (d) VV.
DH of t2 and T2 oscillates in the left and right directions during train vibration (Figure 14a). The amplitude of DH of t2 and T2 gradually increases between 0 s and 1.3 s, and then the amplitude of DH basically remains unchanged. After that, the peak-peak values of the DH of t2 and T2 are very similar. Therefore, the DH of t2 and T2 are basically not affected by the size of diameter, and the peak-peak value of t2 and T2 is less than 0.35 mm. The DH of t2 and T2 has a small response in the train vibration process.
Compared to Figure 14a,c, VH of T2 is smaller than that of t2. The dynamic response of T2 in the horizontal direction is smaller than that of t2, and T2 is more stable than t2 in the horizontal direction.
DV of t2 and T2 oscillates in the upward and downward directions during train vibration (Figure 14b). DV of t2 is much larger than that of T2. The peak-peak value of the DV of t2 is about 1.9 mm, and the peak-peak value of the DV of T2 is about 1.1 mm. Therefore, the vertical displacement of t2 is about two times that of T2.
The amplitude of the DV of the t2 gradually increases between 0 s and 2.7 s, and then the amplitude of the DV basically remains unchanged. Therefore, the t2 sleeper reaches a new equilibrium state at about 2.7 s, and the t2 tends to be in dynamic equilibrium. The vibration amplitude of the DV of the T2 increases gradually from 0 s to 0.8 s and decreases gradually from 0.8 to 1.7 s. Subsequently, the vibration amplitude of the DV of the T2 is stable in the region. It can be seen that the T2 gradually reaches the equilibrium state between 0.8 and 1.7 s. Compared with the small-diameter tunnel, the time needed to reach the new equilibrium state in the train vibration process in the super-large diameter tunnel is shorter (2.7 s) than that in the small-diameter tunnel. This shows that the super-large diameter tunnel is more stable than the small-diameter tunnel in the train vibration process. Therefore, it can be seen that T2 is more stable than t2 from two aspects: the time of the tunnel reaches the equilibrium state and the amplitude of DV.
Compared to Figure 14b,d, the laws of DV and VV of t2 and T2 are basically similar. The peak-peak of the VV of the t2 is about 37 mm/s, and the peak-peak of the VV of the T2 is about 17 mm/s, and the VV of the t2 is about two times that of the T2.
According to Figure 14a,d, the sleeper in t2 and T2 will occur the horizontal and vertical vibration displacement and velocity during the train running in T1. In general, the displacement and velocity of t2 are more significant than those of T2.
The responses of DV and VV in t2 and T2 are greater than those of horizontal directions. The vertical response of the structure should be paid more attention to the process of train vibration. T2 is more stable than t2 from two aspects: the time of the tunnel reaches the equilibrium state and the vibration amplitude of the structure’s dynamic and static response. The dynamic characteristics of the D twin tunnels are very different from those of the d twin tunnels, so the dynamic characteristics of the train vibration in the d twin tunnels cannot be directly applied to the D twin tunnels.
5.2.2. Liner
Figure 15 compares the resultant displacement of the t2 and T2 liner, and the measurement points are shown in Figure 15b,c. The resultant displacement is the arithmetic square root of the DH and DV. The resultant displacement on the left side of the t2 liner is greater than that on the right side; the maximum value on the left side is about 1.24 mm at 180°, and the minimum value on the right side is about 0.82 mm at 0°. The resultant displacement of the T2 liner is also greater on the left side than on the right side; the maximum value on the left side is about 1.2 mm at 180°, and the minimum value on the right side is about 0.25 mm at 0°. Therefore, the resultant displacement of the left liner of t2 and T2 is large, and the values are close to each other. The resultant displacement of the right side of the liner is small, while the difference of the resultant displacement of the right side of the liner in the t2 and T2 is large.
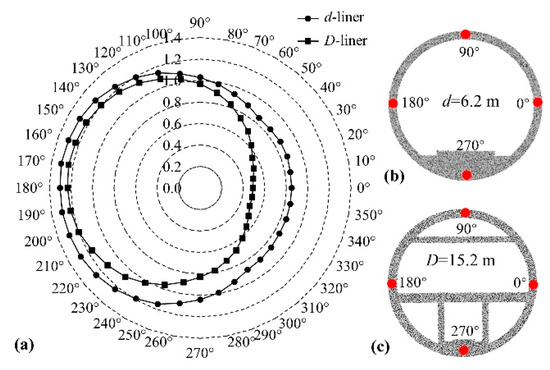
Figure 15.
Comparison of resultant displacement of t2 and T2: (a) maximum value of resultant displacement; (b) measurement points of t2; (c) measurement points of T2.
The resultant displacement on the right side of the t2 liner is much larger than that of the T2 liner. The possible reason for this is the fact that the distance between the monitoring point of the right-side liner of the T2 and the vibration point of the train in T1 is very large. The energy dissipation of the vibration wave of the train is basically completed. The research results of d tunnel can not be directly applied to the engineering of the D tunnel; it is necessary to strengthen the related research of the super-large diameter tunnel.
Figure 16 shows the comparison of maximum and average values of resultant velocities between t2 and T2. The maximum and average values of the velocity in t2 and T2 have basically the same variation rule, both of which are larger on the left side of the liner and smaller on the right side of the liner. Moreover, the velocity of the T2 is about 50% of that value of the t2; this indicates that the D twin tunnel is more stable than the d twin tunnel, which may be the result of the joint action of the larger space between the D twin tunnels and the greater water pressure around D twin tunnels. In addition, different sections of small and super-large diameter twin tunnels may also play an important role. The super-large twin tunnels have been stiffer due to the inner walls (Wall_1, Wall_2, Wall_3, and Wall_4) were added to them.
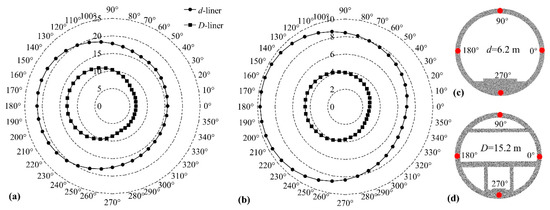
Figure 16.
Comparison of resultant velocity of t2 and T2: (a) maximum value of resultant velocity; (b) average value of resultant velocity; (c) measurement points of t2; (d) measurement points of T2.
Horizontal stress (σx) and vertical stress (σy) of liner in t2 and T2 can be seen in Figure 17. Positive values represent tensile stresses, and negative values represent compressive stresses. The absolute value of σx at 0° and 180° of T2 liner are greater than that of the t2 liner, and the variation amplitude of σx is smaller in the train vibration process (Figure 17a). The change of σy at 90° and 270°is similar to that of σy in t2 and T2 (Figure 17b). In addition, special attention needs to be paid to the monitoring points where the tunnel liner exhibits high tensile strength, as the concrete liner has a strong compressive strength and a weak tensile strength.
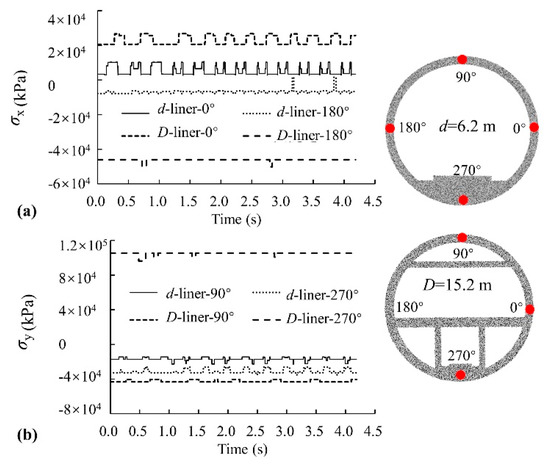
Figure 17.
Horizontal and vertical stress of liner in t2 and T2: (a) Horizontal stress (σx); (b) Vertical stress (σy).
Figure 18 shows the cloud of the resultant velocity of the liner in t2 and T2 at some key time points. The resultant velocity at each time point of the tunnel is related to the dynamic load of the train, and the resultant velocity on the left side of the liner is larger than the value on the left side both in t2 and T2. The resultant speed of the super-large diameter tunnel is obviously less than that of the small-diameter tunnel, which means the stability of the super-large diameter tunnel is better than the small-diameter tunnel.
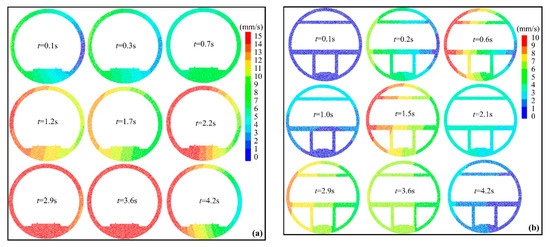
Figure 18.
Cloud of the resultant velocity of liner in t2 and T2: (a) Resultant velocity of t2 liner at key time points; (b) Resultant velocity of T2 liner at key time points.
6. Conclusions
This paper presents DEM dynamic analysis results of small (d = 6.2 m) and super-large (D = 15.2 m) diameter twin tunnels during a train’s vibration at a speed of 120 km/h in T1. Velocity and displacement of T2 walls are discussed, and the sleeper and liner of t2 and T2 are compared. The main conclusions are as follows:
- Four walls (Wall_1, Wall_2, Wall_3, and Wall_4) vibrate in horizontal and vertical directions. The DV and VV are more significant than the DH and VH. The horizontal structure (Wall_1 and Wall_2) has the same DH, and the vertical structure (Wall_3 and Wall_4) has the same DV. The stress state of the surroundings around T2 is a decisive factor for DH, and the distance from the vibration point to the measurement point is the decisive factor for the DV.
- The super-large and small tunnel sleepers will have oscillating displacement and velocity in the horizontal and vertical directions. The resultant displacement and velocity at the left side of t2 and T2 liners are more significant than on the right. The resultant displacement of the right side of the liner is small, and the difference of the resultant displacement of the right side of the liner in the t2 and T2 is significant. In general, the displacement and velocity of the d tunnel are more significant than those of the D tunnel. The DV and VV of t2 and T2 liners are greater than those of DH and VH. Therefore, the vertical response of the structure should be paid more attention to during the process of train vibration.
- The law of the VH and VV is similar to that of the DH and DV, indicating that displacement analysis can supplement dynamic structural analysis. T2 is more stable than t2 from two aspects, namely the time of the tunnel reaches the equilibrium state and the vibration amplitude of the structure’s dynamic and static response. This possibility is the result of super-large diameter twin tunnel spacing, high upper water pressure and more stable cross-section.
Dynamic characteristics of t2 and T2 during train vibration are significantly different, so the dynamic characteristics in d twin tunnels cannot be applied directly to the D twin tunnels. The two-dimensional DEM model can explore the dynamic characteristics of small and super-large twin tunnels under train vibration.
Author Contributions
Conceptualization, L.W. and X.Z.; methodology, W.W.; software, L.W.; validation, L.W., W.W., and X.M.; formal analysis, W.W.; investigation, H.G.; resources, H.G.; data curation, L.W.; writing—original draft preparation, L.W.; writing—review and editing, W.W.; visualization, X.M.; supervision, X.Z. All authors have read and agreed to the published version of the manuscript.
Funding
This research received no external funding.
Institutional Review Board Statement
Not applicable.
Informed Consent Statement
Not applicable.
Data Availability Statement
Not applicable.
Conflicts of Interest
The authors declare no conflict of interest.
References
- Zhang, Z.H.; Zhang, X.D.; Cui, Y.F.; Qiu, H.S. Discrete element modeling of a cross-river tunnel under subway train operation during peak and off-peak periods. Arab. J. Geosci. 2019, 12, 102. [Google Scholar] [CrossRef]
- Li, S.; Li, P.; Zhang, M.; Liu, Y. Influence of Approaching Excavation on Adjacent Segments for Twin Tunnels. Appl. Sci. 2020, 10, 98. [Google Scholar] [CrossRef] [Green Version]
- Wu, L.; Zhang, X.; Kuang, F.; Sui, J.; Xilong, Z.; Guo, H. Dynamic characteristics of adjacent tunnel and surroundings under the vibration of trains in the first tunnel with different buried depths. Arab. J. Sci. Eng. 2021, 46, 5105–5119. [Google Scholar] [CrossRef]
- Xie, X.; Yang, Y.; Ji, M. Analysis of ground surface settlement induced by the construction of a large-diameter shield-driven tunnel in Shanghai, China. Tunn. Undergr. Space Technol. 2016, 51, 120–132. [Google Scholar] [CrossRef]
- Ağbay, E.; Topal, T. Evaluation of twin tunnel-induced surface ground deformation by empirical and numerical analyses (NATM part of Eurasia tunnel, Turkey). Comput. Geotech. 2020, 119, 103367. [Google Scholar] [CrossRef]
- Yertutanol, K.; Akgün, H.; Sopacı, E. Displacement monitoring, displacement verification and stability assessment of the critical sections of the Konak tunnel, İzmir, Turkey. Tunn. Undergr. Space Technol. 2020, 101, 103357. [Google Scholar] [CrossRef]
- Zhang, F.; Gao, Y.; Wu, Y.; Wang, Z. Face stability analysis of large-diameter slurry shield-driven tunnels with linearly increasing undrained strength. Tunn. Undergr. Space Technol. 2018, 78, 178–187. [Google Scholar] [CrossRef]
- Fuyong, C.; Lin, W.; Wengang, Z. Reliability assessment on stability of tunnelling perpendicularly beneath an existing tunnel considering spatial variabilities of rock mass properties. Tunn. Undergr. Space Technol. 2019, 88, 276–289. [Google Scholar] [CrossRef]
- Zhang, J.; Yuan, Y.; Yu, H. Shaking table tests on discrepant responses of shaft-tunnel junction in soft soil under transverse excitations. Soil Dyn. Earthq. Eng. 2019, 120, 345–359. [Google Scholar] [CrossRef]
- Sun, B.; Deng, M.; Zhang, S.; Cui, W.; Wang, C.; Yu, L.; Cao, K. Inelastic dynamic analysis and damage assessment of a hydraulic arched tunnel under near-fault SV waves with arbitrary incoming angles. Tunn. Undergr. Space Technol. 2020, 104, 103523. [Google Scholar] [CrossRef]
- Yan, L.; Haider, A.; Li, P.; Song, E. A numerical study on the transverse seismic response of lined circular tunnels under obliquely incident asynchronous P and SV waves. Tunn. Undergr. Space Technol. 2020, 97, 103235. [Google Scholar] [CrossRef]
- Huang, Q.; Huang, H.-w.; Ye, B.; Zhang, D.-m.; Gu, L.-l.; Zhang, F. Dynamic response and long-term settlement of a metro tunnel in saturated clay due to moving train load. Soils Found. 2017, 57, 1059–1075. [Google Scholar] [CrossRef]
- Yang, Y.B.; Liang, X.; Hung, H.-H.; Wu, Y. Comparative study of 2D and 2.5D responses of long underground tunnels to moving train loads. Soil Dyn. Earthq. Eng. 2017, 97, 86–100. [Google Scholar] [CrossRef]
- He, C.; Zhou, S.; Di, H.; Shan, Y. A 2.5-D coupled FE–BE model for the dynamic interaction between saturated soil and longitudinally invariant structures. Comput. Geotech. 2017, 82, 211–222. [Google Scholar] [CrossRef]
- He, C.; Zhou, S.; Di, H.; Guo, P.; Xiao, J. Analytical method for calculation of ground vibration from a tunnel embedded in a multi-layered half-space. Comput. Geotech. 2018, 99, 149–164. [Google Scholar] [CrossRef]
- Yang, W.B.; Cui, G.; Xu, Z.Y.; Yan, Q.X.; He, C.; Zhang, Y.Y. An experimental study of ground-borne vibration from shield tunnels. Tunn. Undergr. Space Technol. 2018, 71, 244–252. [Google Scholar] [CrossRef]
- Yang, W.; Zhang, C.; Liu, D.; Tu, J.; Yan, Q.; Fang, Y.; He, C. The effect of cross-sectional shape on the dynamic response of tunnels under train induced vibration loads. Tunn. Undergr. Space Technol. 2019, 90, 231–238. [Google Scholar] [CrossRef]
- Zhang, Z.H.; Zhang, X.D.; Tang, Y.; Cui, Y.F. Discrete element analysis of a cross-river tunnel under random vibration levels induced by trains operating during the flood season. J. Zhejiang Univ. A 2018, 19, 346–366. [Google Scholar] [CrossRef]
- Ding, D.-Y.; Liu, W.-N.; Gupta, S.; Lombaert, G.; Degrande, G. Prediction of vibrations from underground trains on Beijing metro line 15. J. Cent. S. Univ. 2010, 17, 1109–1118. [Google Scholar] [CrossRef]
- Yan, Q.; Chen, H.; Chen, W.; Zhang, J.; Ma, S.; Huang, X. Dynamic Characteristic and Fatigue Accumulative Damage of a Cross Shield Tunnel Structure under Vibration Load. Shock Vib. 2018, 2018, 9525680. [Google Scholar] [CrossRef] [Green Version]
- Yan, Q.; Song, L.; Chen, H.; Chen, W.; Ma, S.; Yang, W. Dynamic Response of Segment Lining of Overlapped Shield Tunnels Under Train-Induced Vibration Loads. Arab. J. Sci. Eng. 2018, 43, 5439–5455. [Google Scholar] [CrossRef]
- Zhao, Y.; Shi, Y.; Yang, J. Study of the Influence of Train Vibration Loading on Adjacent Damaged Tunnel. Shock Vib. 2019, 2019, 3417598. [Google Scholar] [CrossRef] [Green Version]
- He, C.; Zhou, S.; Guo, P.; Di, H.; Zhang, X. Modelling of ground vibration from tunnels in a poroelastic half-space using a 2.5-D FE-BE formulation. Tunn. Undergr. Space Technol. 2018, 82, 211–221. [Google Scholar] [CrossRef]
- He, C.; Zhou, S.; Guo, P.; Di, H.; Zhang, X. Analytical model for vibration prediction of two parallel tunnels in a full-space. J. Sound Vib. 2018, 423, 306–321. [Google Scholar] [CrossRef]
- Zhou, S.; He, C.; Guo, P.; Di, H.; Zhang, X. Modeling of Vehicle-Track-Tunnel-Soil System Considering the Dynamic Interaction between Twin Tunnels in a Poroelastic Half-Space. Int. J. Geomech. 2020, 20, 04019144. [Google Scholar] [CrossRef]
- Zhou, C.; Luo, H.; Fang, W.; Wei, R.; Ding, L. Cyber-physical-system-based safety monitoring for blind hoisting with the internet of things: A case study. Automat. Constr. 2019, 97, 138–150. [Google Scholar] [CrossRef]
- Zhang, Z.H.; Zhang, X.D.; Qiu, H.S.; Daddow, M. Dynamic characteristics of track-ballast-silty clay with irregular vibration levels generated by high-speed train based on DEM. Constr. Build. Mater. 2016, 125, 564–573. [Google Scholar] [CrossRef]
- Wu, L.; Zhang, X.; Zhang, Z.; Sun, W. 3D Discrete Element Method Modelling of Tunnel Construction Impact on an Adjacent Tunnel. KSCE J. Civ. Eng. 2020, 24, 657–669. [Google Scholar] [CrossRef]
- Itasca. Particle Flow Code in 2 Dimensions (PFC2D). User’s Guide; Itasca Consulting Group: Minneapolis, MN, USA, 2004. [Google Scholar]
- Maynar, M.J.; Rodríguez, L.E. Discrete Numerical Model for Analysis of Earth Pressure Balance Tunnel Excavation. J. Geotech. Geoenviron. Eng. 2005, 131, 1234–1242. [Google Scholar] [CrossRef]
Publisher’s Note: MDPI stays neutral with regard to jurisdictional claims in published maps and institutional affiliations. |
© 2021 by the authors. Licensee MDPI, Basel, Switzerland. This article is an open access article distributed under the terms and conditions of the Creative Commons Attribution (CC BY) license (https://creativecommons.org/licenses/by/4.0/).