1. Introduction
This work presents an innovative process by which the health status of difficult-to-access structures (e.g., bridges) can be determined, utilizing a wireless sensor package for data acquisition, deployed by an Unmanned Aircraft System (UAS) (commonly known as a drone), which provides data for Dynamic Signature Response (DSR) techniques for damage detection. This sensor technology is a compact and low-cost sensor package with an onboard power supply that allows wireless acceleration data collection, eliminating the need for wired connection to the power grid. The sensor package is equipped with an electropermanent magnet that facilitates the rapid installation to various points on the underside of a metal structure or any structure outfitted with metal plates. The sensor package is deployed and retrieved using a drone designed to operate under structures and deliver the packages safely to regions that may not otherwise be readily accessible (such as the underside of bridges that cross rivers or busy highways). The data collected by the sensor package is then analyzed with damage detection algorithms that process the vibration data and extract the DSR, which depends only on the structural condition. Based on the correlation between data collected at a prior, known, and healthy, state and the current state, Level 1 damage detection (the presence of damage in the structure) can be determined [
1].
This paper is organized as follows:
Section 2 provides the relevant background on structural health assessment using drones and vibration-based sensing algorithms. In
Section 3, we present the development of the novel sensor package, the UAS for sensor deployment, and the data processing algorithm for the structural vibration data collected. The experimental validation of the proposed system along with experimental results are presented and discussed in
Section 4. Finally, in
Section 5, we conclude the paper and discuss future work.
2. Background
2.1. Accelerometer-Based Sensing
Accelerometers have countless uses, from flipping the screen orientation on smartphones to keeping planes on their trajectory in flight. Accelerometers also play a crucial role in Structural Health Monitoring (SHM). Researchers have created many methods of determining the condition of a structure using the vibration signature [
2]. However, hardware implementations of such methods are limited due to multiple factors including size, cost, and power requirements. The high-sensitivity, low-noise electronics required to make such measurements are relatively large, expensive, and require experienced personnel to operate [
2]. Attempts to make more compact systems and increase the resolution and sensitivity are included in the references of this work [
3,
4]. However, these compact systems can be labor-intensive and dangerous to deploy in remote areas. Such areas also make it impossible to connect these systems to the power grid, creating a need for wireless and power-independent sensor packages.
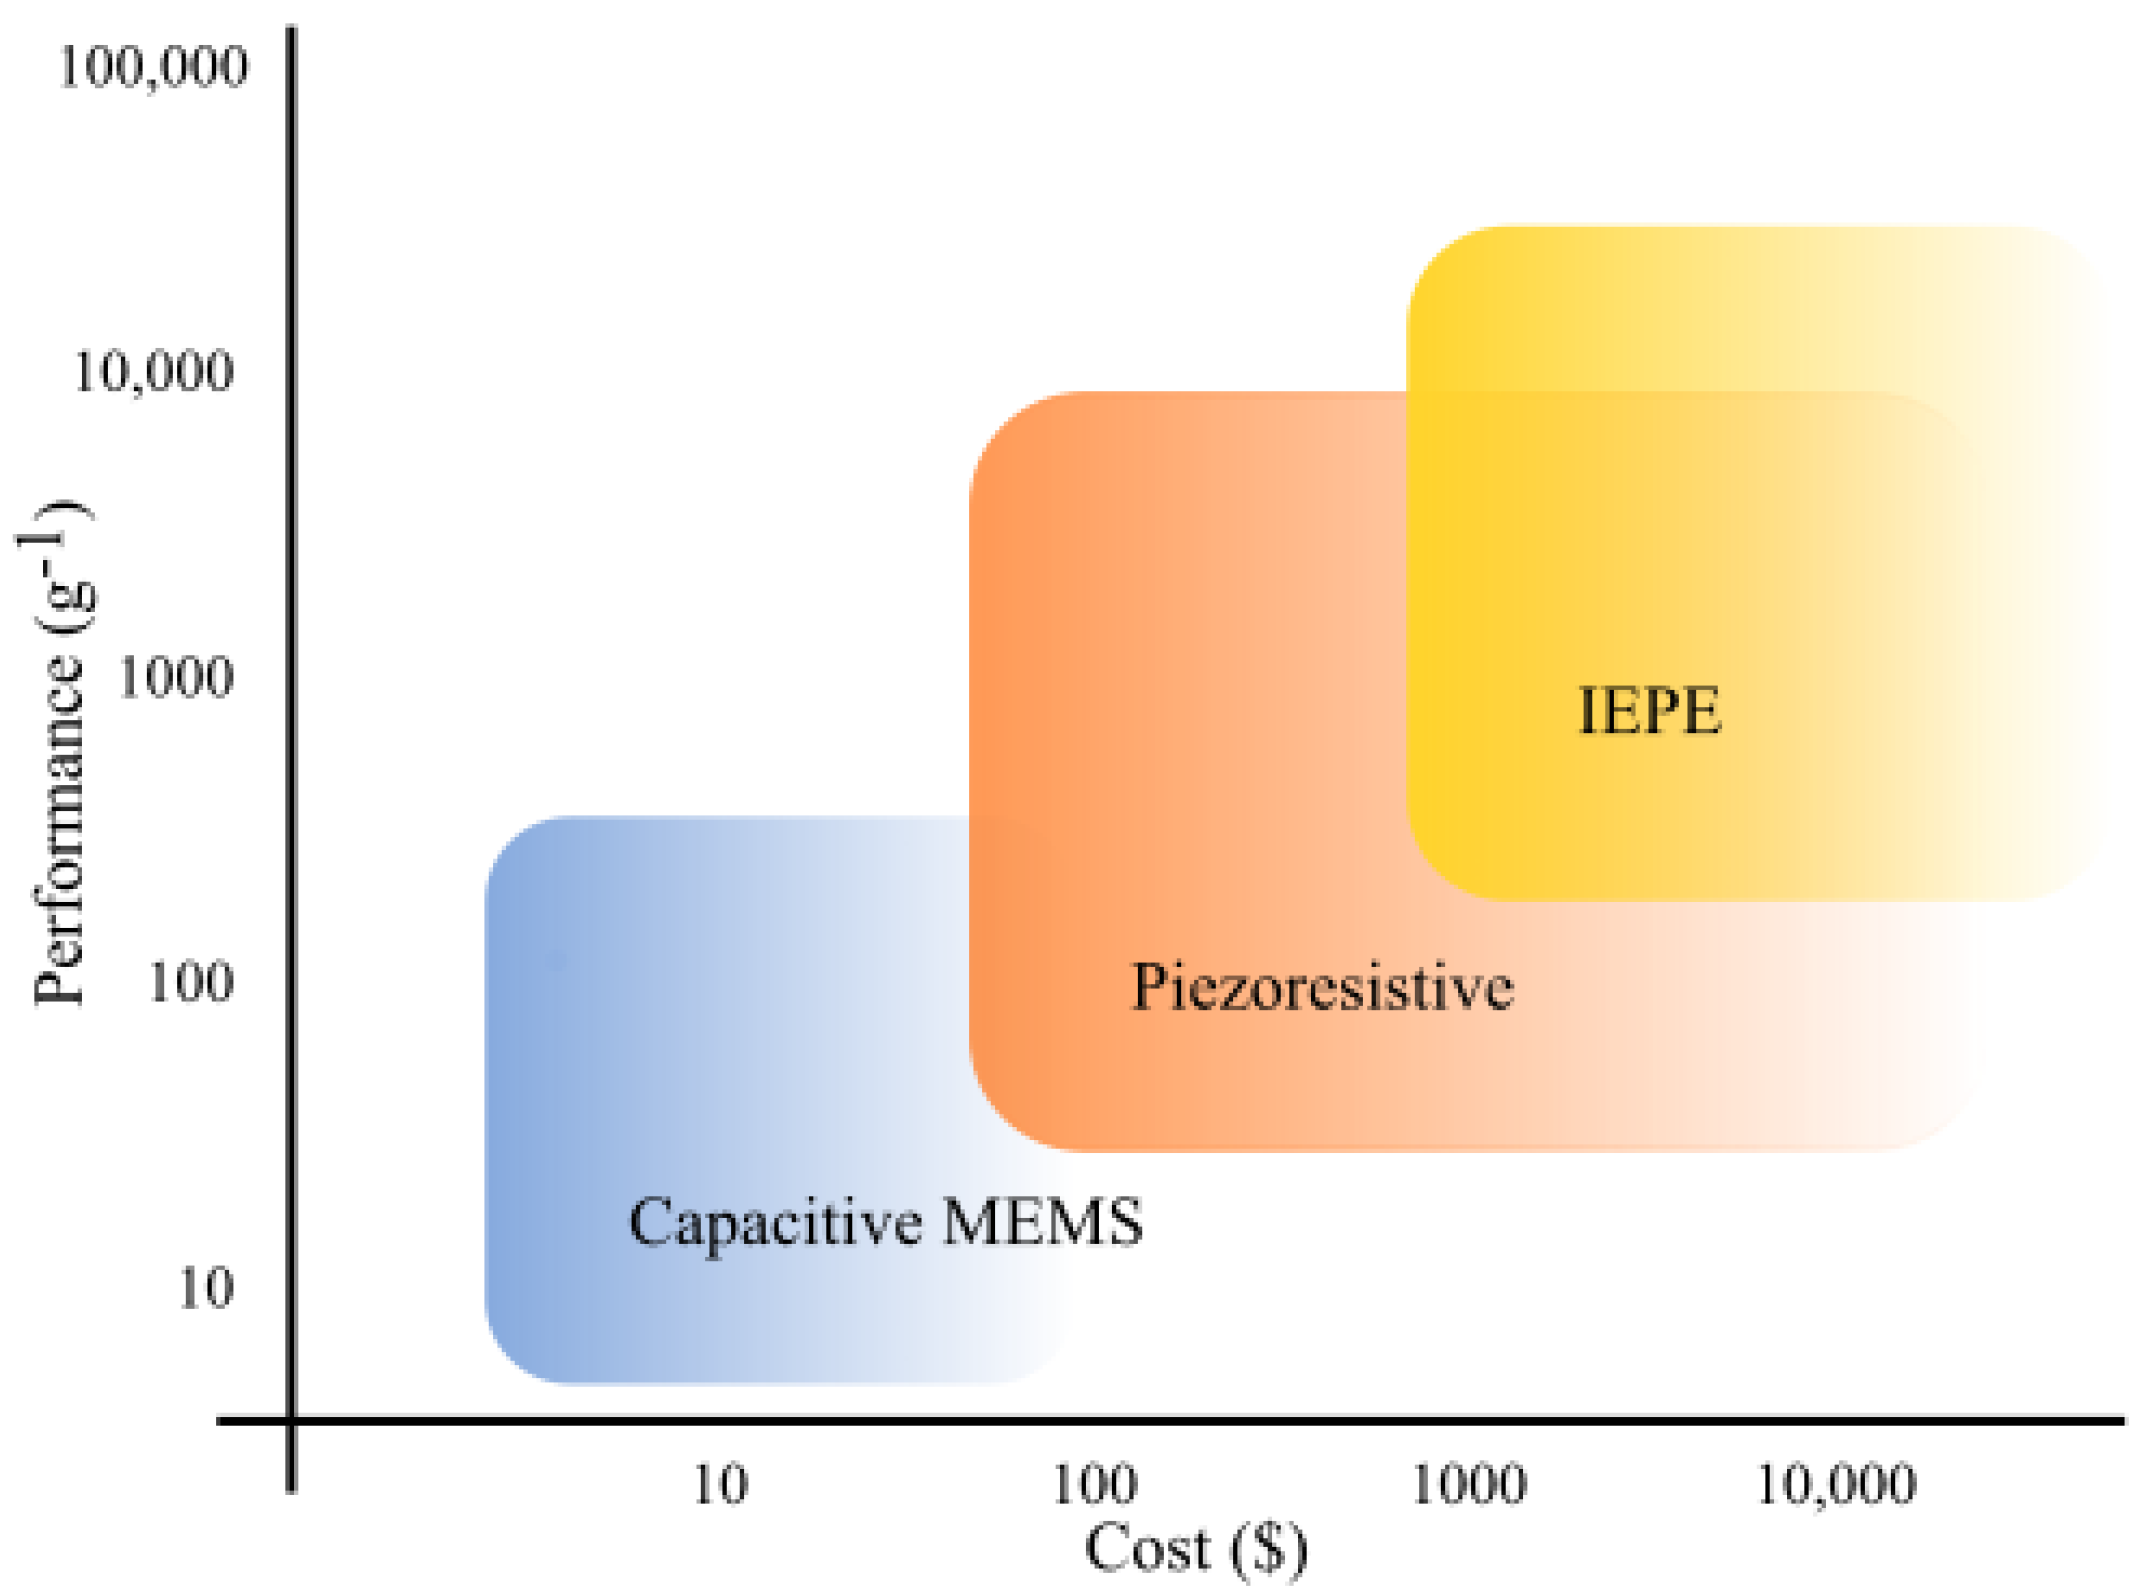
Accelerometers are electromechanical devices that detect the change in acceleration in a given direction. Piezoelectric (PE) and Integrated Electronics Piezoelectric (IEPE) accelerometers use internal crystals and the piezoelectric effect to generate a charge related to the acceleration introduced to the system. There are also piezoresistive accelerometers that vary their resistance in relation to an input acceleration. The third common type of accelerometers are the Capacitive Microelectromechanical Systems (MEMSs). These accelerometers have a suspended microstructure, embedded in the Integrated Circuit (IC), with a small mass that is free to vibrate and measure the change of capacitance of the microstructure due to acceleration [
5]. DC coupling of capacitive MEMS accelerometers allows for the detection of low-frequency signals, which is critical when measuring the vibration signature of large structures, which typically resonate at frequencies below 1 Hz. Furthermore, MEMSs are capable of detecting steady-state acceleration [
6,
7] in addition to allowing the integration and double integration of their outputs to determine velocity and displacement, which is important for quantifying the stresses and loads on structures.
Figure 1 compares performance versus qualitative cost estimates for the three main types of accelerometers. For this work, a MEMS accelerometer was chosen for its reliability, affordability, and ease-of-use.
2.2. Unmanned Aircraft Systems in SHM
One of the major challenges in SHM is accessing remote areas or difficult-to-access segments of structures. UAS (drones) are increasingly used as a solution to this problem. Thus far, much of the research considering drones in SHM applications has focused on the use of onboard cameras for image acquisition [
8,
9]. The assessment is then performed by a qualified engineer through visual inspection of the images with or without the use of image processing software. Another approach is to use a drone to hold a reflector prism against the bridge for total station measurements instead of holding the prism manually [
10]. In this case, the prism is affixed directly to the UAS in a configuration described as a
helping hand [
11]. Moreover, Unmanned Aerial Manipulators (UAMs) are a new type of drone that achieve higher precision by utilizing a gripper or multifingered end effector to provide additional degrees of freedom over
helping hands [
11].
Jimenez-Cano et al. [
10] presented an application of drones for SHM in which a dynamic model and controller were developed to achieve contact between the manipulator arm and the underside of a structure. They proposed to use an ultrasound sensor, attached to the end effector, to assess the depth of cracks in the structure. During the experiments, the proposed aerial manipulator was able to maintain continuous contact with the structure, which is necessary for the assessment; however, the experiments were performed without the actual ultrasound sensor. In another study by Bodie et al. [
12], a contact-based UAS measured the electrical potential difference between materials in a sample of concrete as a method of nondestructive testing.
In addition to these contact-based methods, there is ongoing research into the deployment and retrieval of sensors by drones. For SHM applications, these sensors can be any of the variety of options considered in the previous subsection. For example in [
13], a drone was developed with a hooked gripper able to attach a dummy package with a preprepared adhesive to a target by using the arm to apply pressure to the package against the desired surface. The package was then removed using a loop attached to the package, with which the hook can engage, and then, reverse thrust was used to remove it from the surface. Closer to this work, drones were attached directly to civil structures using electropermanent magnets for the collection of vibration data from civil structures [
14]. In this case, an electropermanent magnet was utilized to maintain contact between the drone and the underside of the structure until the onboard systems have completed the data collection. However, the sensor package was integrated with the UAS and not treated as a separate system for deployment.
2.3. Vibration-Based SHM
SHM refers to activities used to diagnose structures over time. Structural damage can be detected by investigating the dynamic properties of the structure. The change in the modal parameters (e.g., frequencies, mode shapes, and modal damping) indicates the change of the physical properties of the structure (e.g., mass, damping, stiffness) [
15]. Methods for SHM can be divided into local and global methods; local methods are used in locations where damage is expected, while global methods are used to detect damage through monitoring changes in the structure’s dynamic fingerprint [
16]. Vibration-based damage detection methods are classified into four levels based on what the method is able to do [
17]:
Level 1: indicates that damage is present;
Level 2: identifies the location of the damage;
Level 3: quantifies the severity of the damage;
Level 4: finds the remaining lifetime of the structure.
Research developments in early damage detection focus on model-based and data-based methods. Model-based methods assume that a detailed numerical model of the structure is available, and the model parameters are updated based on measurements obtained from the physical structure [
15,
18]. Data-driven methods use in situ monitoring to identify changes in the structure’s response characteristics and correlate those changes to the location (Level 2) and severity (Level 3) of damage [
18,
19,
20]. Contactless techniques are also being developed to capture the pure dynamic response of the structure without added masses or stiffening due to the attached sensors [
21].
In this work, a data-driven method is investigated to detect Level 1 damage using time-domain responses. The B-Spline Response Function (BIRF) technique [
22,
23,
24,
25] was implemented to extract the DSR of the structure from experimental vibration measurements. The DSR is a unique characteristic of the structure and will remain the same if the geometry, materials, and boundary conditions of the structure are not altered. The DSR is independent of the actual loads that caused the vibration. Therefore, the DSR represents the current state and condition of a structure. Comparing the DSR before and after damage can be used for damage detection.
3. System Development
The goal of this work was to develop a system that can identify structural damage using vibration data collected by wireless sensor packages deployed with drones. This section presents the three main elements of this system: sensor package, drone, and method for damage identification.
3.1. Sensor Package
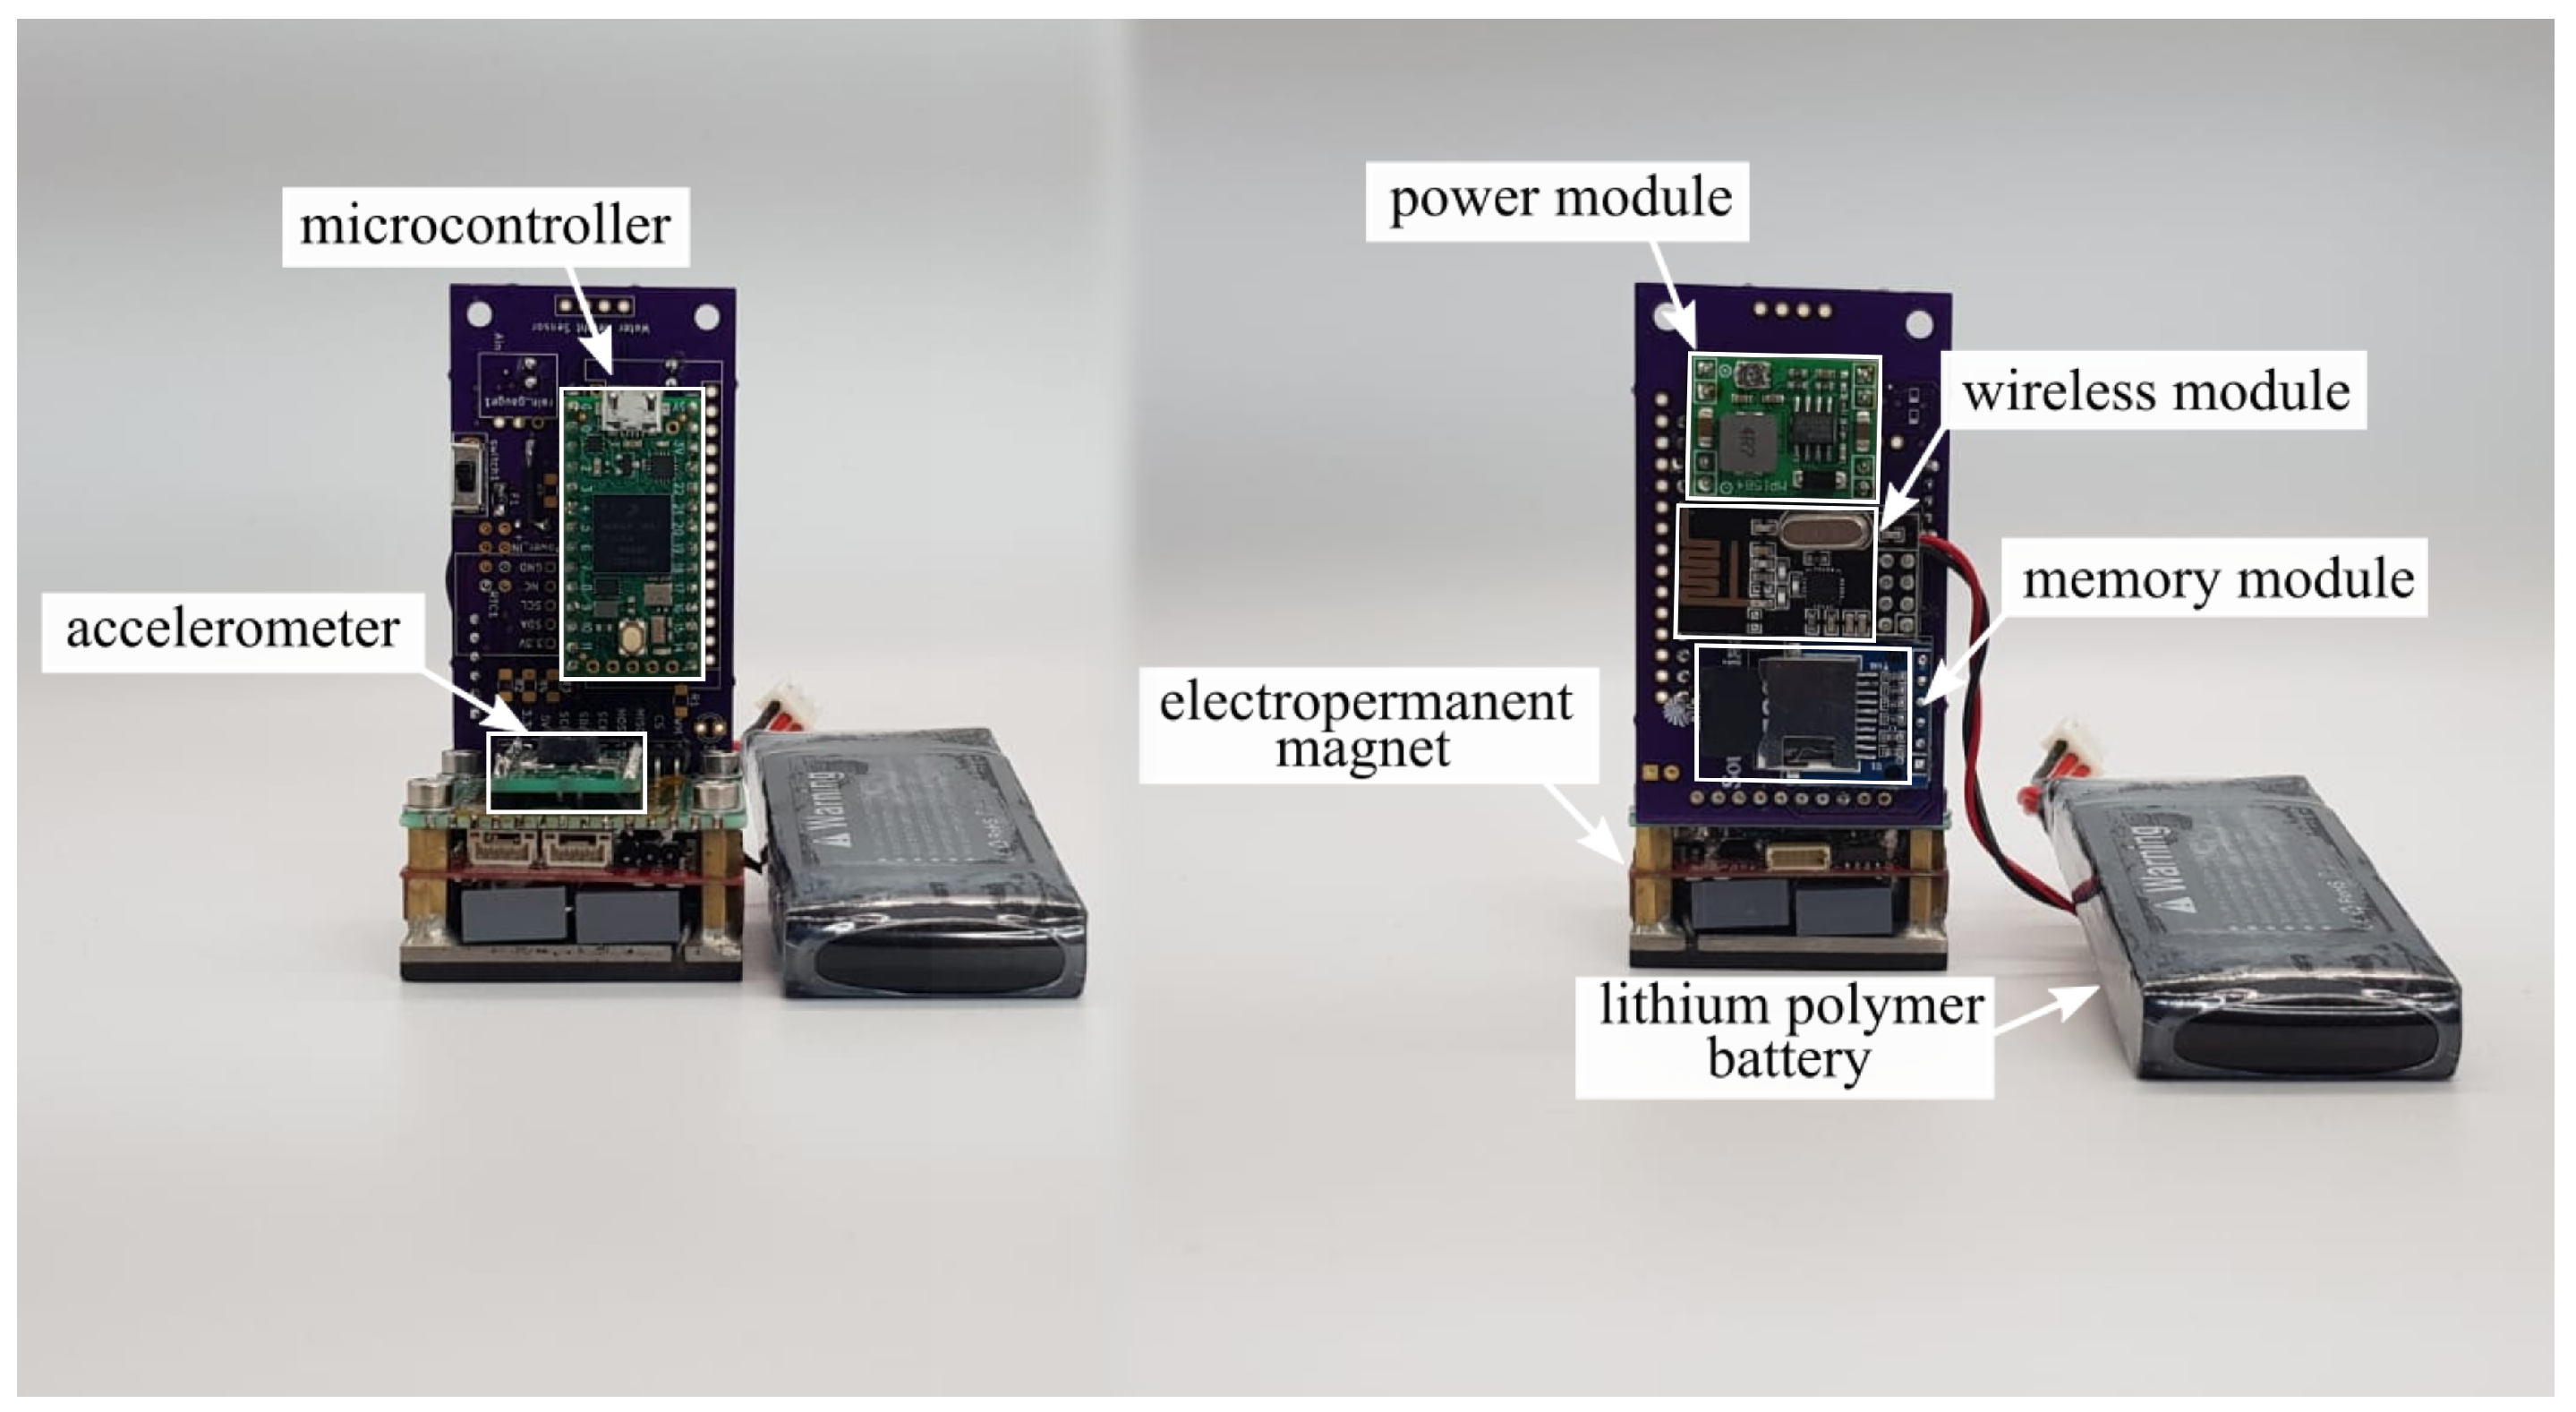
The sensor package consisted of three components: (i) electronics for data gathering, storage, and wireless control, (ii) a docking mechanism based on an electropermanent magnet, and (iii) the power supply (battery). These components are presented in
Figure 2 and
Figure 3, while
Table 1 summarizes the main features of the sensor package. A compact 3D-printed frame was built to house these components, forming the standalone sensor package shown in
Figure 4 (black box).
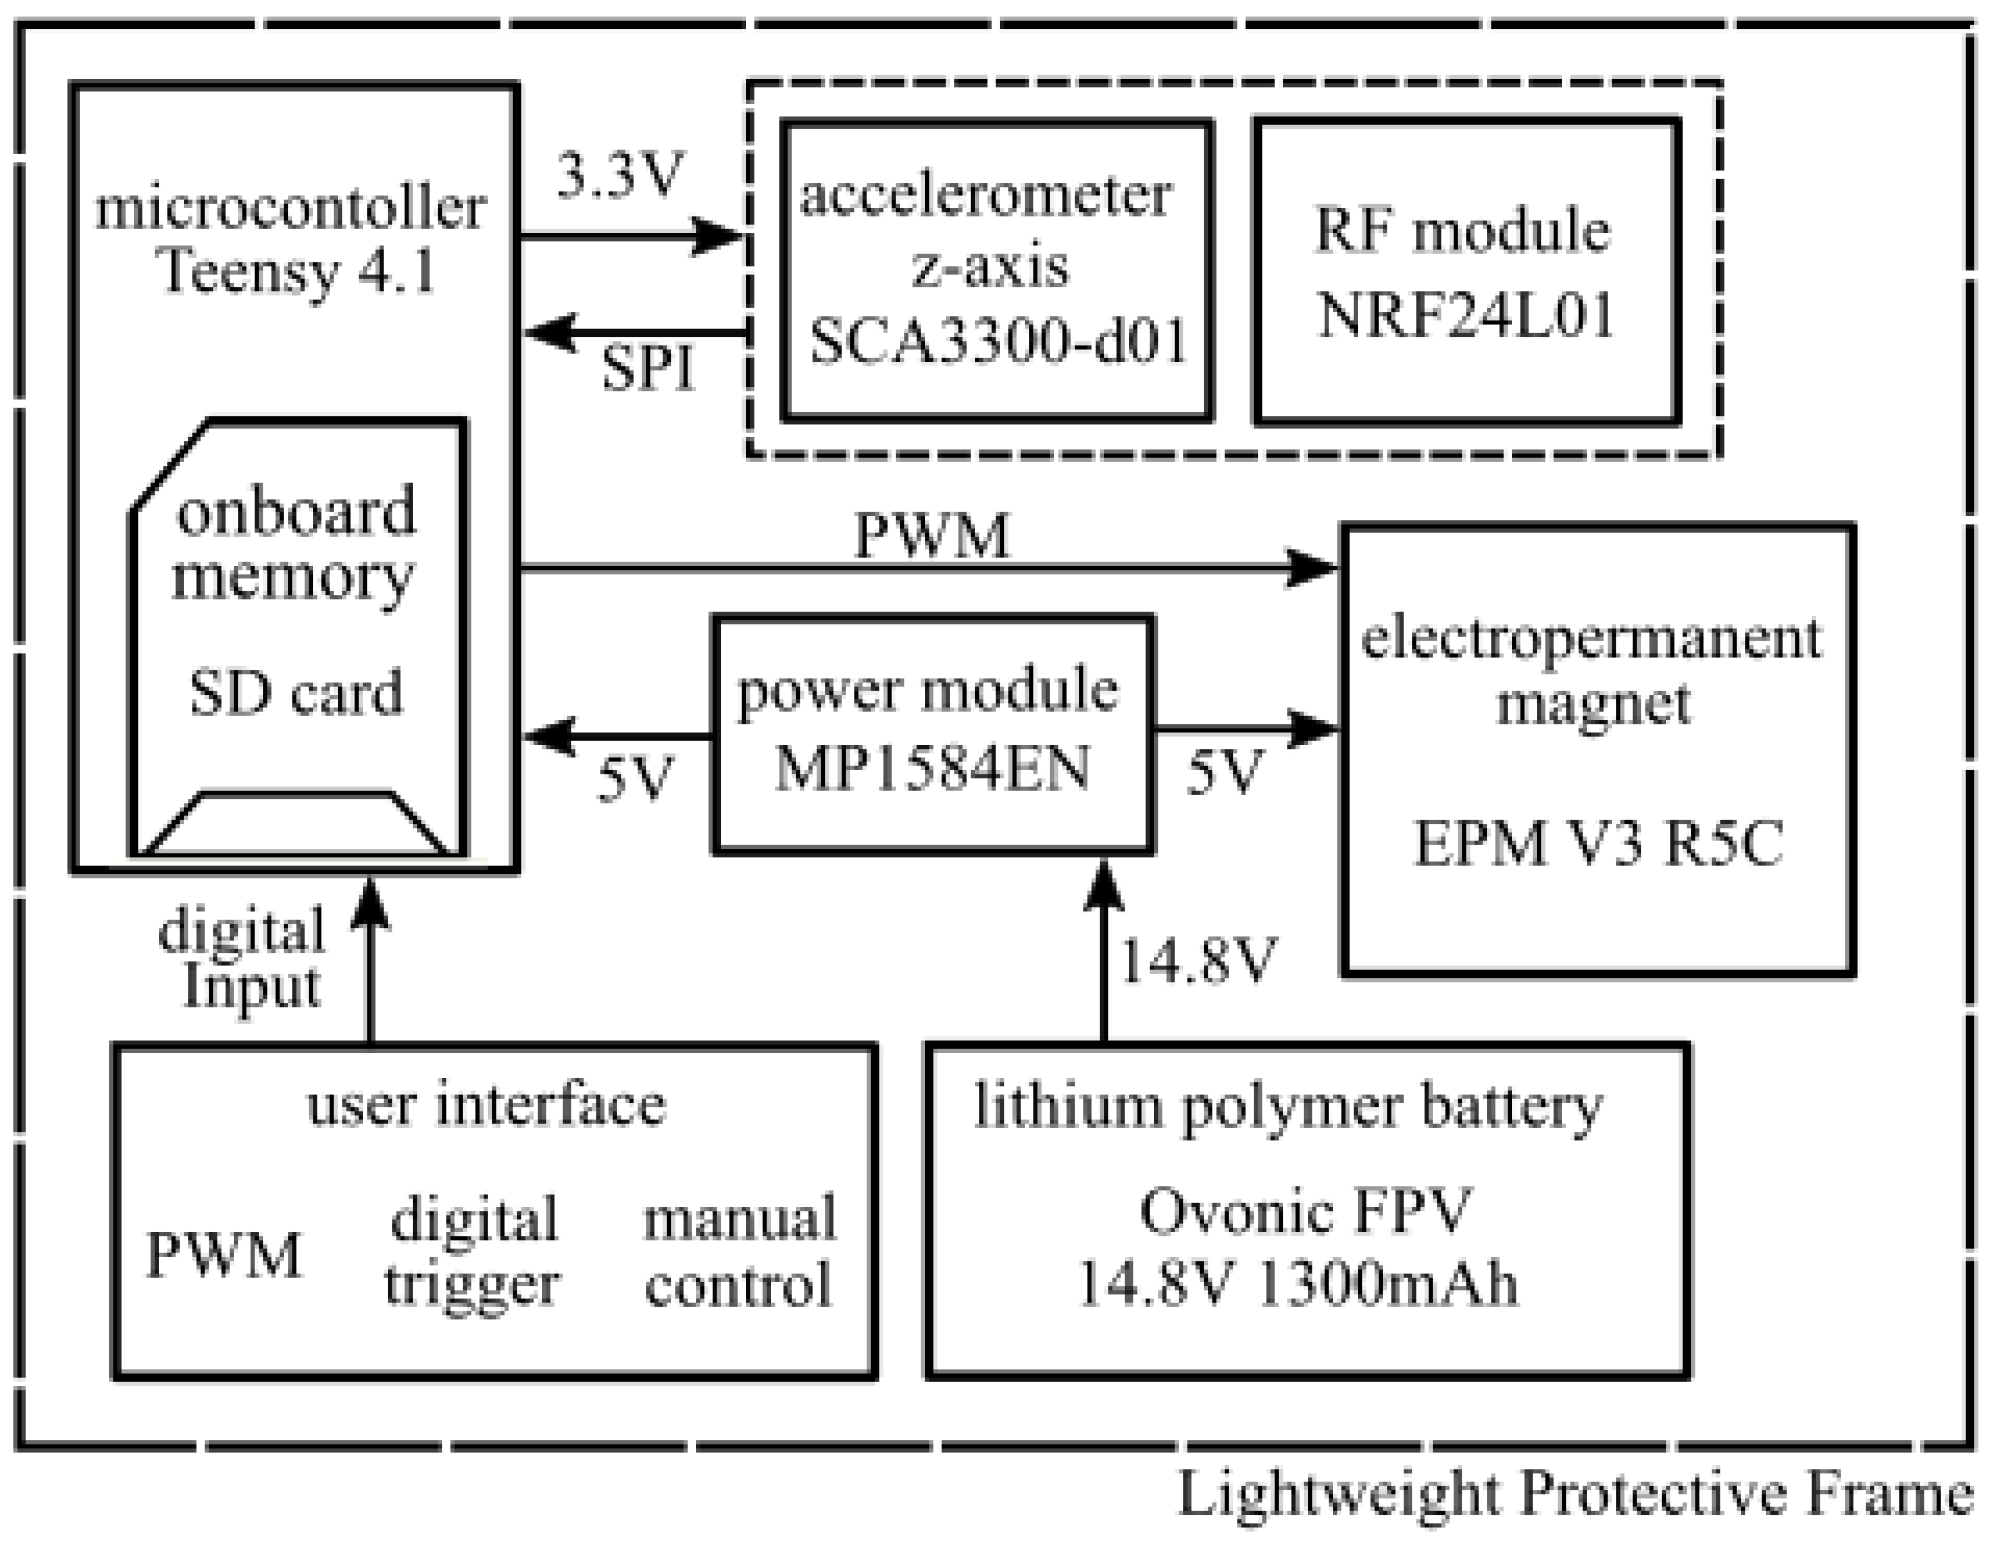
The sensor package features the ARM Cortex-M7 processor onboard the Teensy 4.0 high-performance microcontroller. The system utilizes the 600 MHz clock speed of the Teensy 4.0 and the Serial Communication Interface (SPI) to communicate between the modules and achieve a data collection rate up to 28 kHz. The sensor package also includes three control options (
Figure 2): a PWM port used for wireless control, a digital 5 V as a hard-wired trigger, and manual controls for testing and calibration purposes.
Power is supplied using a DC-DC buck converter (MP1584EN manufactured by Monolithic Power Systems) and a lithium polymer battery (Lumenier 7.4V 1000 mAh), as shown in
Figure 3. This battery currently runs the sensor package for about 11 h on a single charge. The deployment period can be prolonged by utilizing standby mode where unused modules are turned off to conserve energy. In cold weather though, testing has shown that batteries tend to discharge relatively faster, in turn requiring a more restrictive power conservation schedule, limiting the number of tests conducted per deployment.
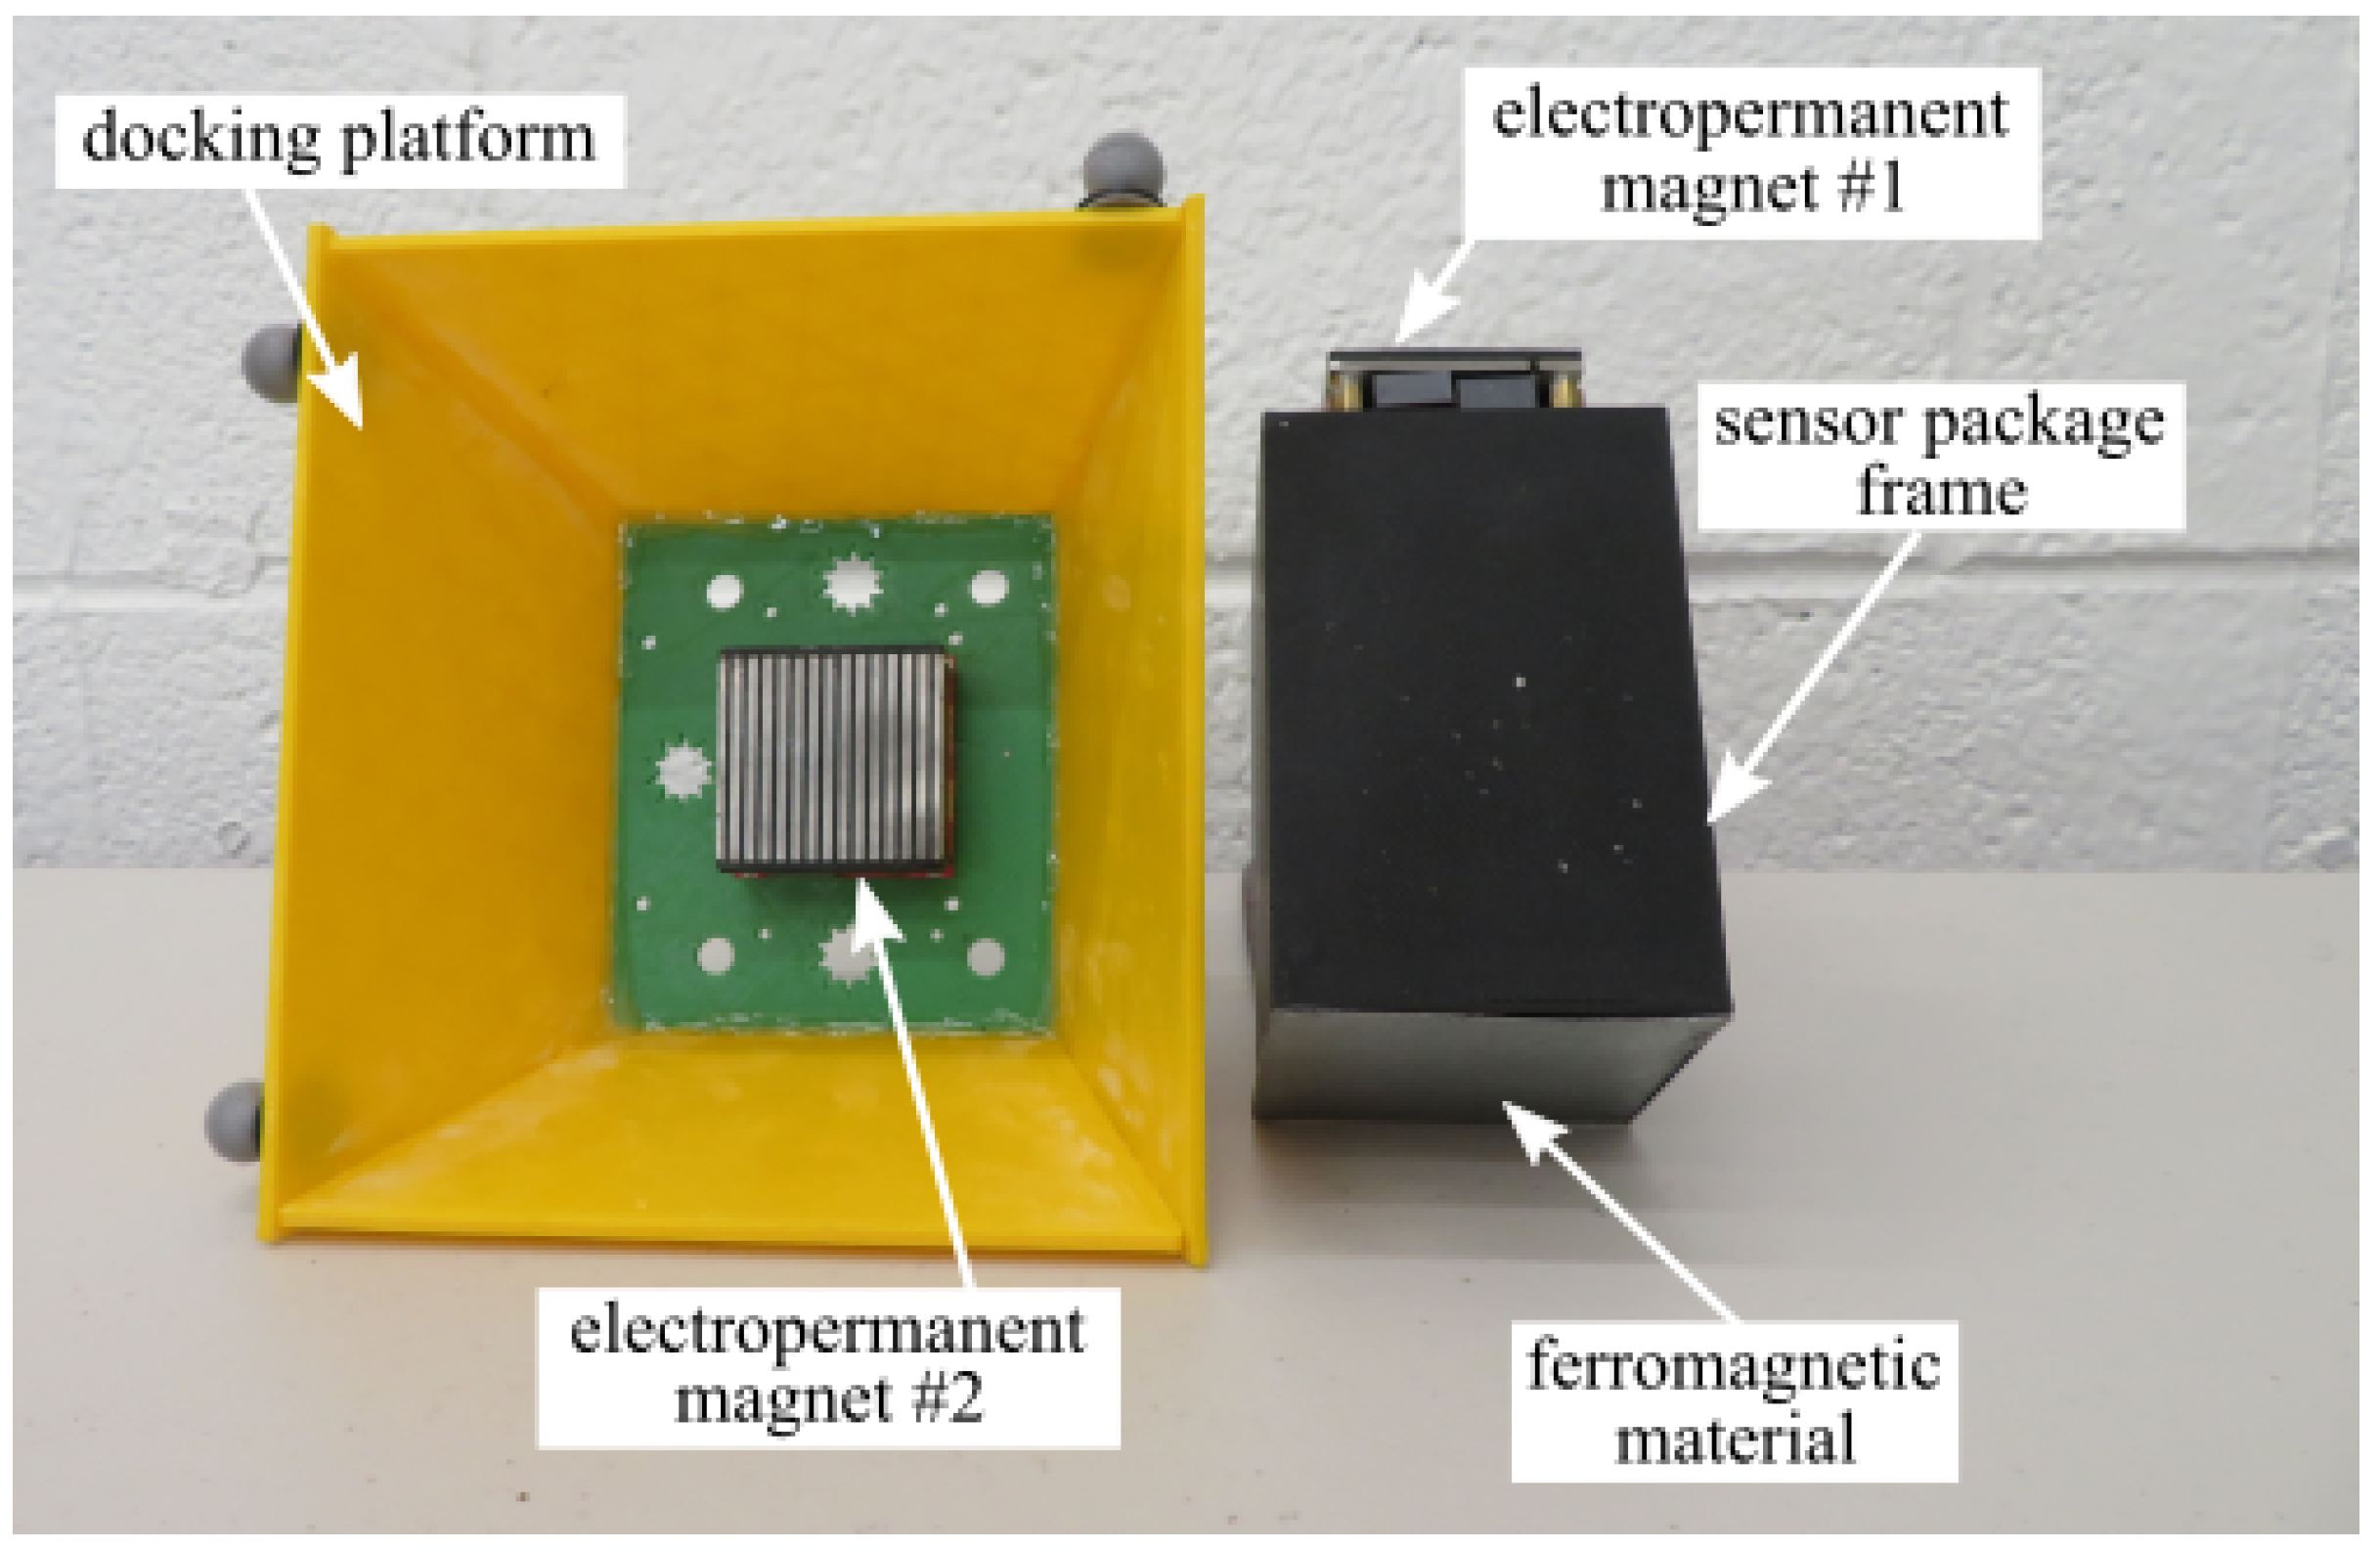
The docking mechanism consists of an electropermanent magnet (NicaDrone EPM V3 R5C) able to mount the sensor package onto metal surfaces (Electropermanent Magnet #1 in
Figure 4). The package collects acceleration data using a MEMS accelerometer (Murata SCA3300-d01) mounted to the metal frame of the electropermanent magnet to ensure contact with the structure being examined. The system can collect up to 74,000 samples as one continuous dataset, before having to transfer the data onto the onboard nonvolatile memory (SD card), a process that takes approximately 3.288 s.
3.2. UAS Platform
The standalone sensor package does not require connection to the power grid, so it can be deployed to any structure. Traditional (human operator) deployment and retrieval though may be challenging in remote locations. For example, in remote bridges, a lift from the ground is required to reach the underside (which may be impractical if the bridge crosses a body of water or a busy highway) or a crane on the topside of the bridge, which can position the operator underneath the structure. Both methods are risky and require costly equipment and roads to be shut down to make the underside of the structure accessible. A drone platform has been developed to overcome these limitations and securely deploy and retrieve sensor packages in difficult-to-access areas.
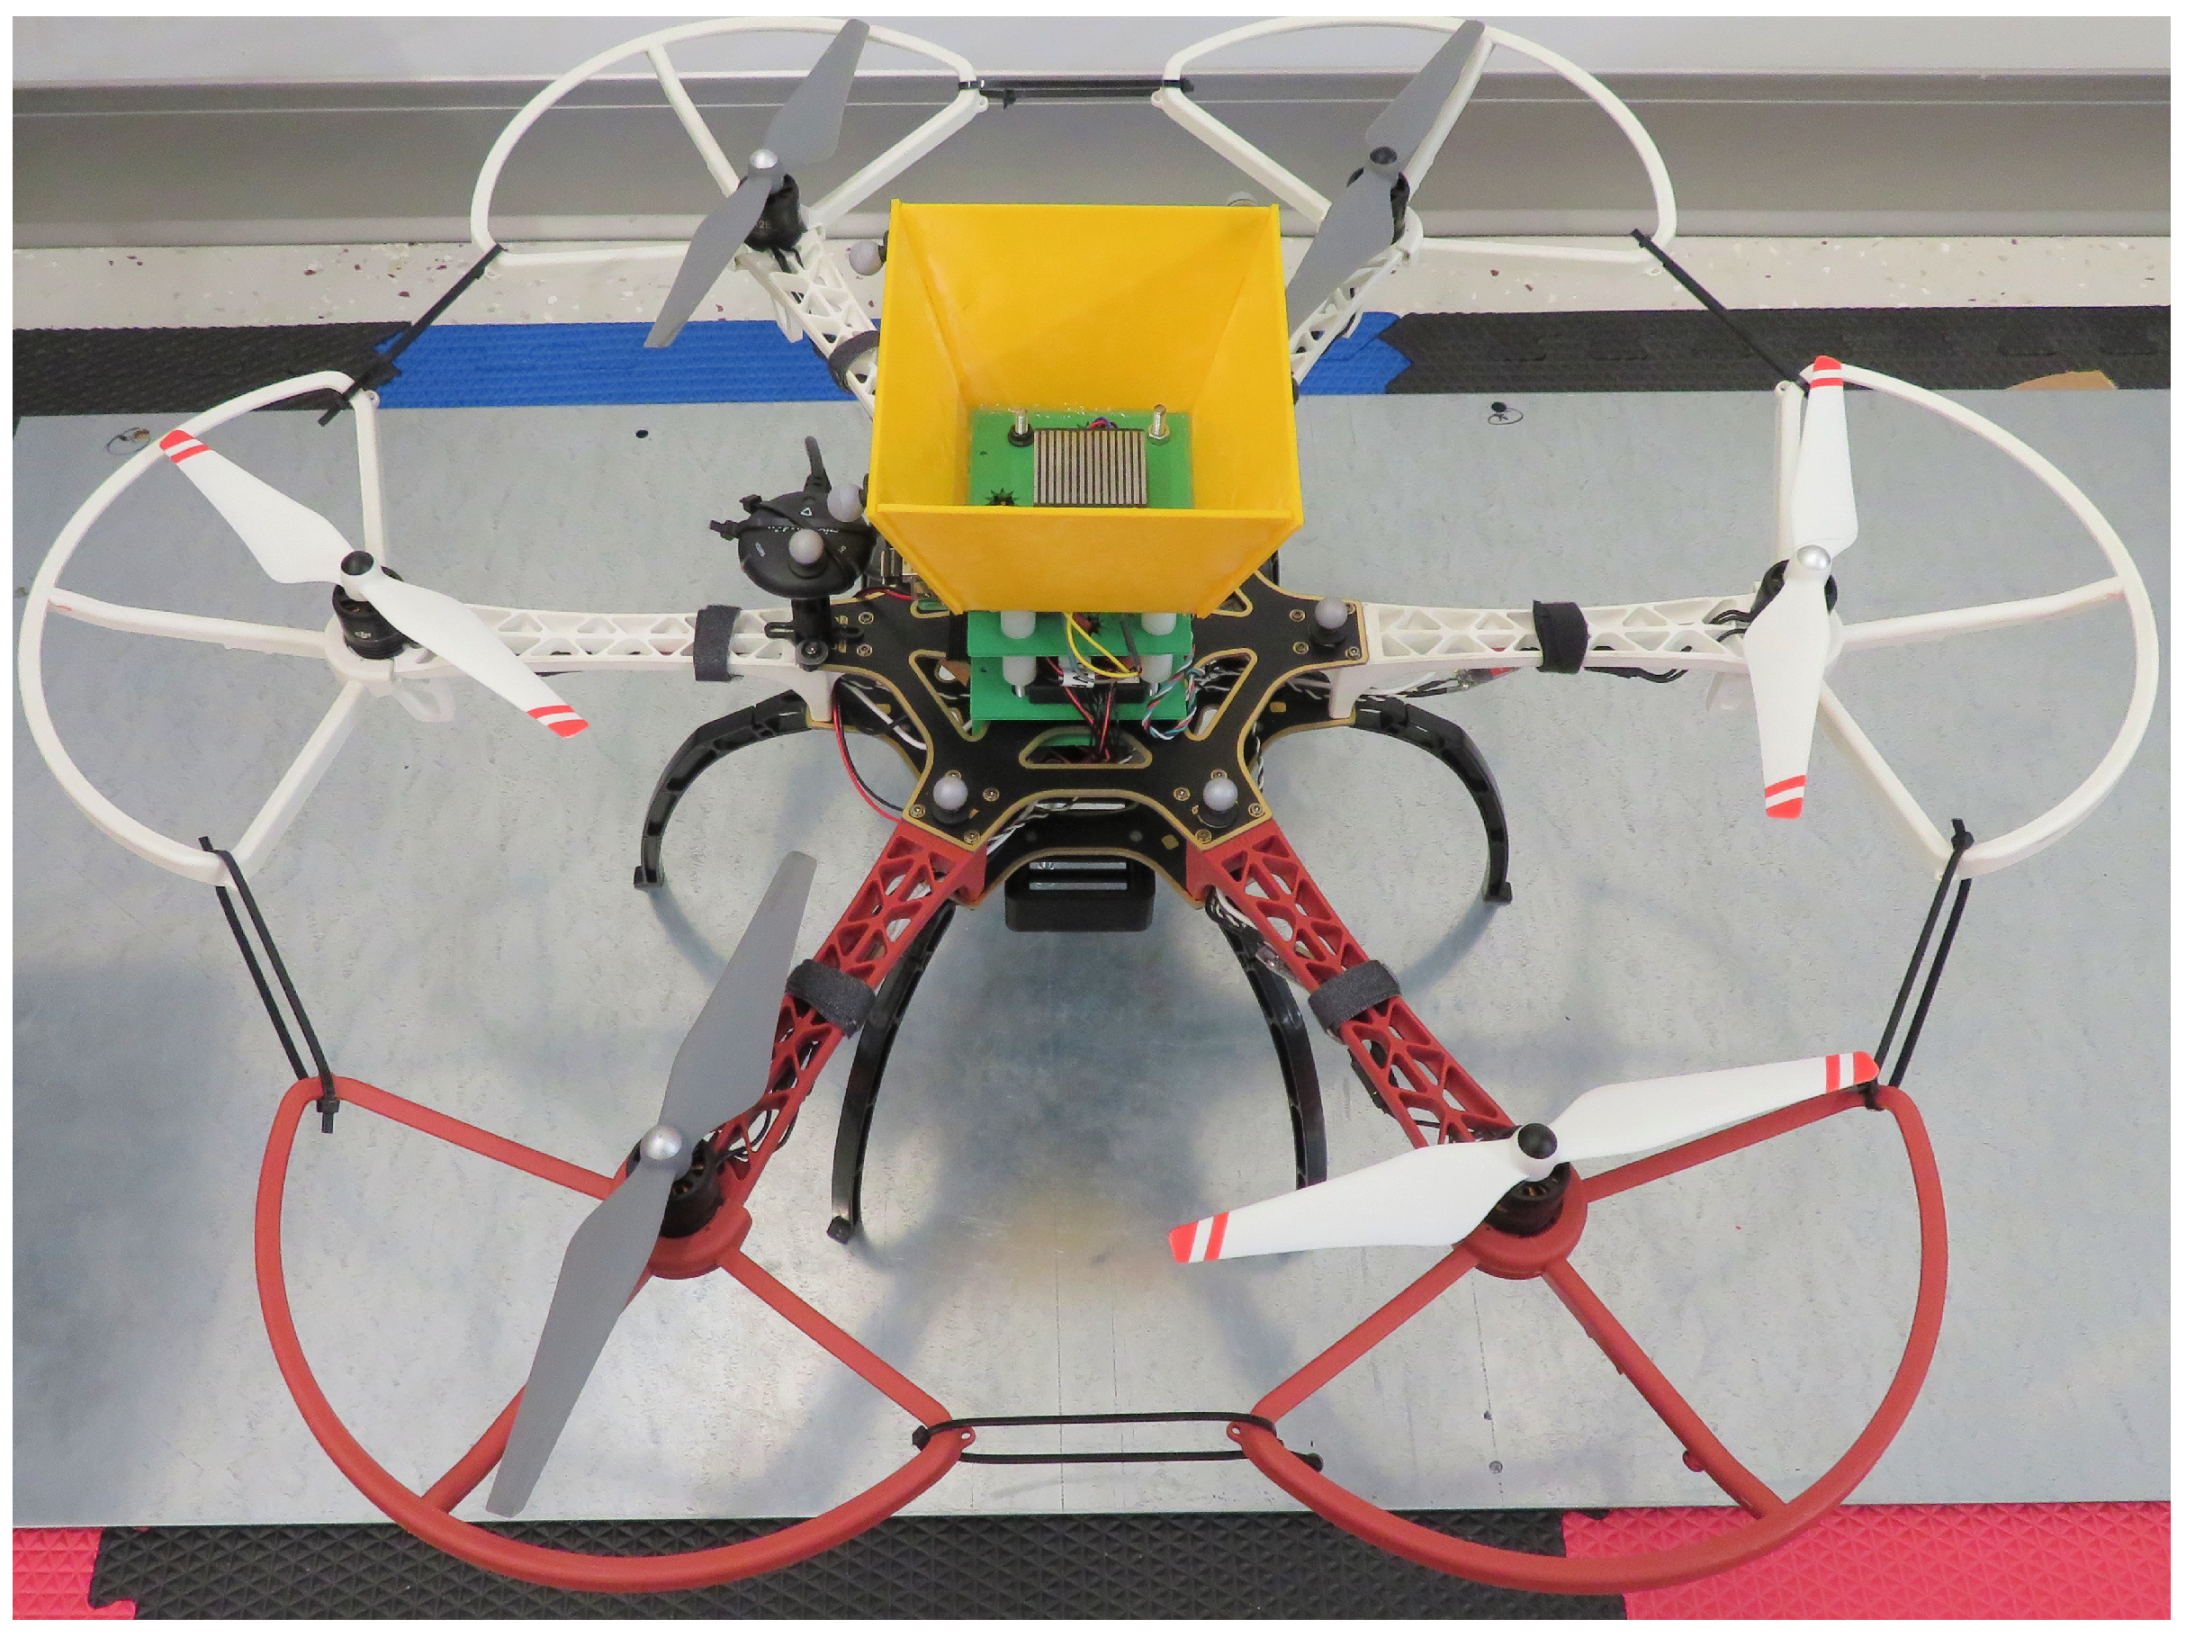
The drone platform was based on the DJI F550, a hexacopter with six standard 2312E motors, shown in
Figure 5 [
26]. Pixhawk 4 was used as the flight controller, and the system was operated via the ArduPilot Mission Planner. Onboard sensors included an IMU, accelerometers, gyroscope, magnetometer, and barometer to provide data for a variety of parameters including drone orientation and altitude. There was also an external GPS used for global positioning when the signal was available. The FrSky X8R radio was used as the onboard receiver to communicate with the FrSky 2.4 GHz Taranis X9D radio controller for manual flight commands. The sensor package, as previously described, was attached to the UAS via a second electropermanent magnet (#2 in
Figure 4), which was controlled using one of the RC servo ports available on the power management board of the Pixhawk 4.
The system was designed to work as follows: On the ArduPilot Mission Planner, two channels from the FrSky Taranis were set to send high, low, and neutral commands to the two magnets. During the high command, the magnet begins the charging sequence, which can only be completed once it is in contact with a ferromagnetic surface. Once the magnet is mounted on the metallic surface, this command can be shifted to neutral as the electropermanent magnet will remain magnetized until the low command is sent. When the low command is sent, it will disengage the magnet.
During operations, the sensor package is delivered onboard the drone (Magnet #2 engaged) to the desired point on the structure where Magnet #1 arms and connects the sensor package and drone to the structure. Once the package is secured in place, Magnet #2 disengages, and the drone detaches and flies away. The sensor package then periodically collects and stores acceleration data for DSR processing. When this operation is complete, the drone conducts a retrieval sequence by reversing the docking procedure. A summary of the status of both magnets in each phase of operations is given in
Table 2.
To assist with the retrieval of the sensor package, the UAS was outfitted with a 3D printed alignment tool (docking platform in
Figure 4). The alignment tool features angled walls, which help to center the sensor package over the electropermanent magnet and prevent the sensor package from coming into contact with the propellers.
3.3. Method of Damage Identification
The Dynamic Signature Response (DSR) of a system is a characteristic response of the system and was first introduced by Rizos et al. [
23] as the B-Spline Impulse Response Function (BIRF) for soil–structure interaction analysis. The BIRF is a time-varying function that is defined between any two points in a mechanical system. It represents the time history of the response of one of the two points due to a unit amplitude B-spline excitation applied to the other point [
23,
24,
27,
28]. The B-spline functions are piecewise smooth polynomials of order k and belong to a family of base functions used in data interpolation and approximation. They are defined with respect to a time knot sequence
, by the recursive formula,
The
-spline polynomials are of degree
and have
continuous derivatives. While the BIRFs are computed efficiently in numerical models of physical systems [
23,
28,
29], it is almost impossible to measure the BIRFs directly in physical systems due to the difficulty of accurately reproducing the B-spline loading on the physical system. The BIRF between two points of a mechanical system, however, can be extracted from vibration tests that acquire the time history record of a response,
R, and excitation,
f, at the two points. For example, the fourth-order-based BIRF is computed in a discrete form at a time step
N as:
where subscripts indicate the time step at which the corresponding functions are evaluated. Details of the method along with verification and validation studies were presented in Alkharousi et al. [
30,
31].
Structural assessment procedures through dynamic testing focus on identifying changes in the dynamic properties of the system through modal analysis and/or model updating techniques. In Equation (
3), the BIRFs are independent of any external excitations and are considered the DSRs that capture the current state of the dynamic system. Any changes in the current state of the structure are captured as changes in its DSRs. Therefore, if the response time history,
R, and the corresponding excitation,
f, are known through vibration test measurements conducted before and after a damage-inducing event, the difference in the corresponding DSR is an indication of damage [
30,
31].
The computation of the BIRF shown in Equation (
3) represents in essence a discrete deconvolution of the response signal, and the BIRF can be perceived as an equivalent time domain transfer function of the system that captures all frequencies in the range defined by the sampling time interval. It is noted and had been demonstrated that the analysis of only a short duration segment of the recorded response is adequate for change detection through the DSR algorithm, compared to mainstream methods that require, in most cases, the entire response record from multiple sensors. However, the noise inherent to the time history response records may have to be removed through filtering before the DSR is extracted. Nevertheless, the computing demand of the proposed method is very low, minimizing the postprocessing times, leading potentially to damage detection in real time, and facilitating the integration to the damage detection algorithms in the overall proposed system.
4. Experimental Validation and Results
In order to validate the developed system (drone, sensor package, damage detection algorithm), we created a laboratory experimental testbed and designed experiments to collect and analyze data. The goal was to show the feasibility of the drone-based deployment and retrieval of our sensor package, as well as the extraction of damage information from the collected vibration data.
4.1. Test Apparatus
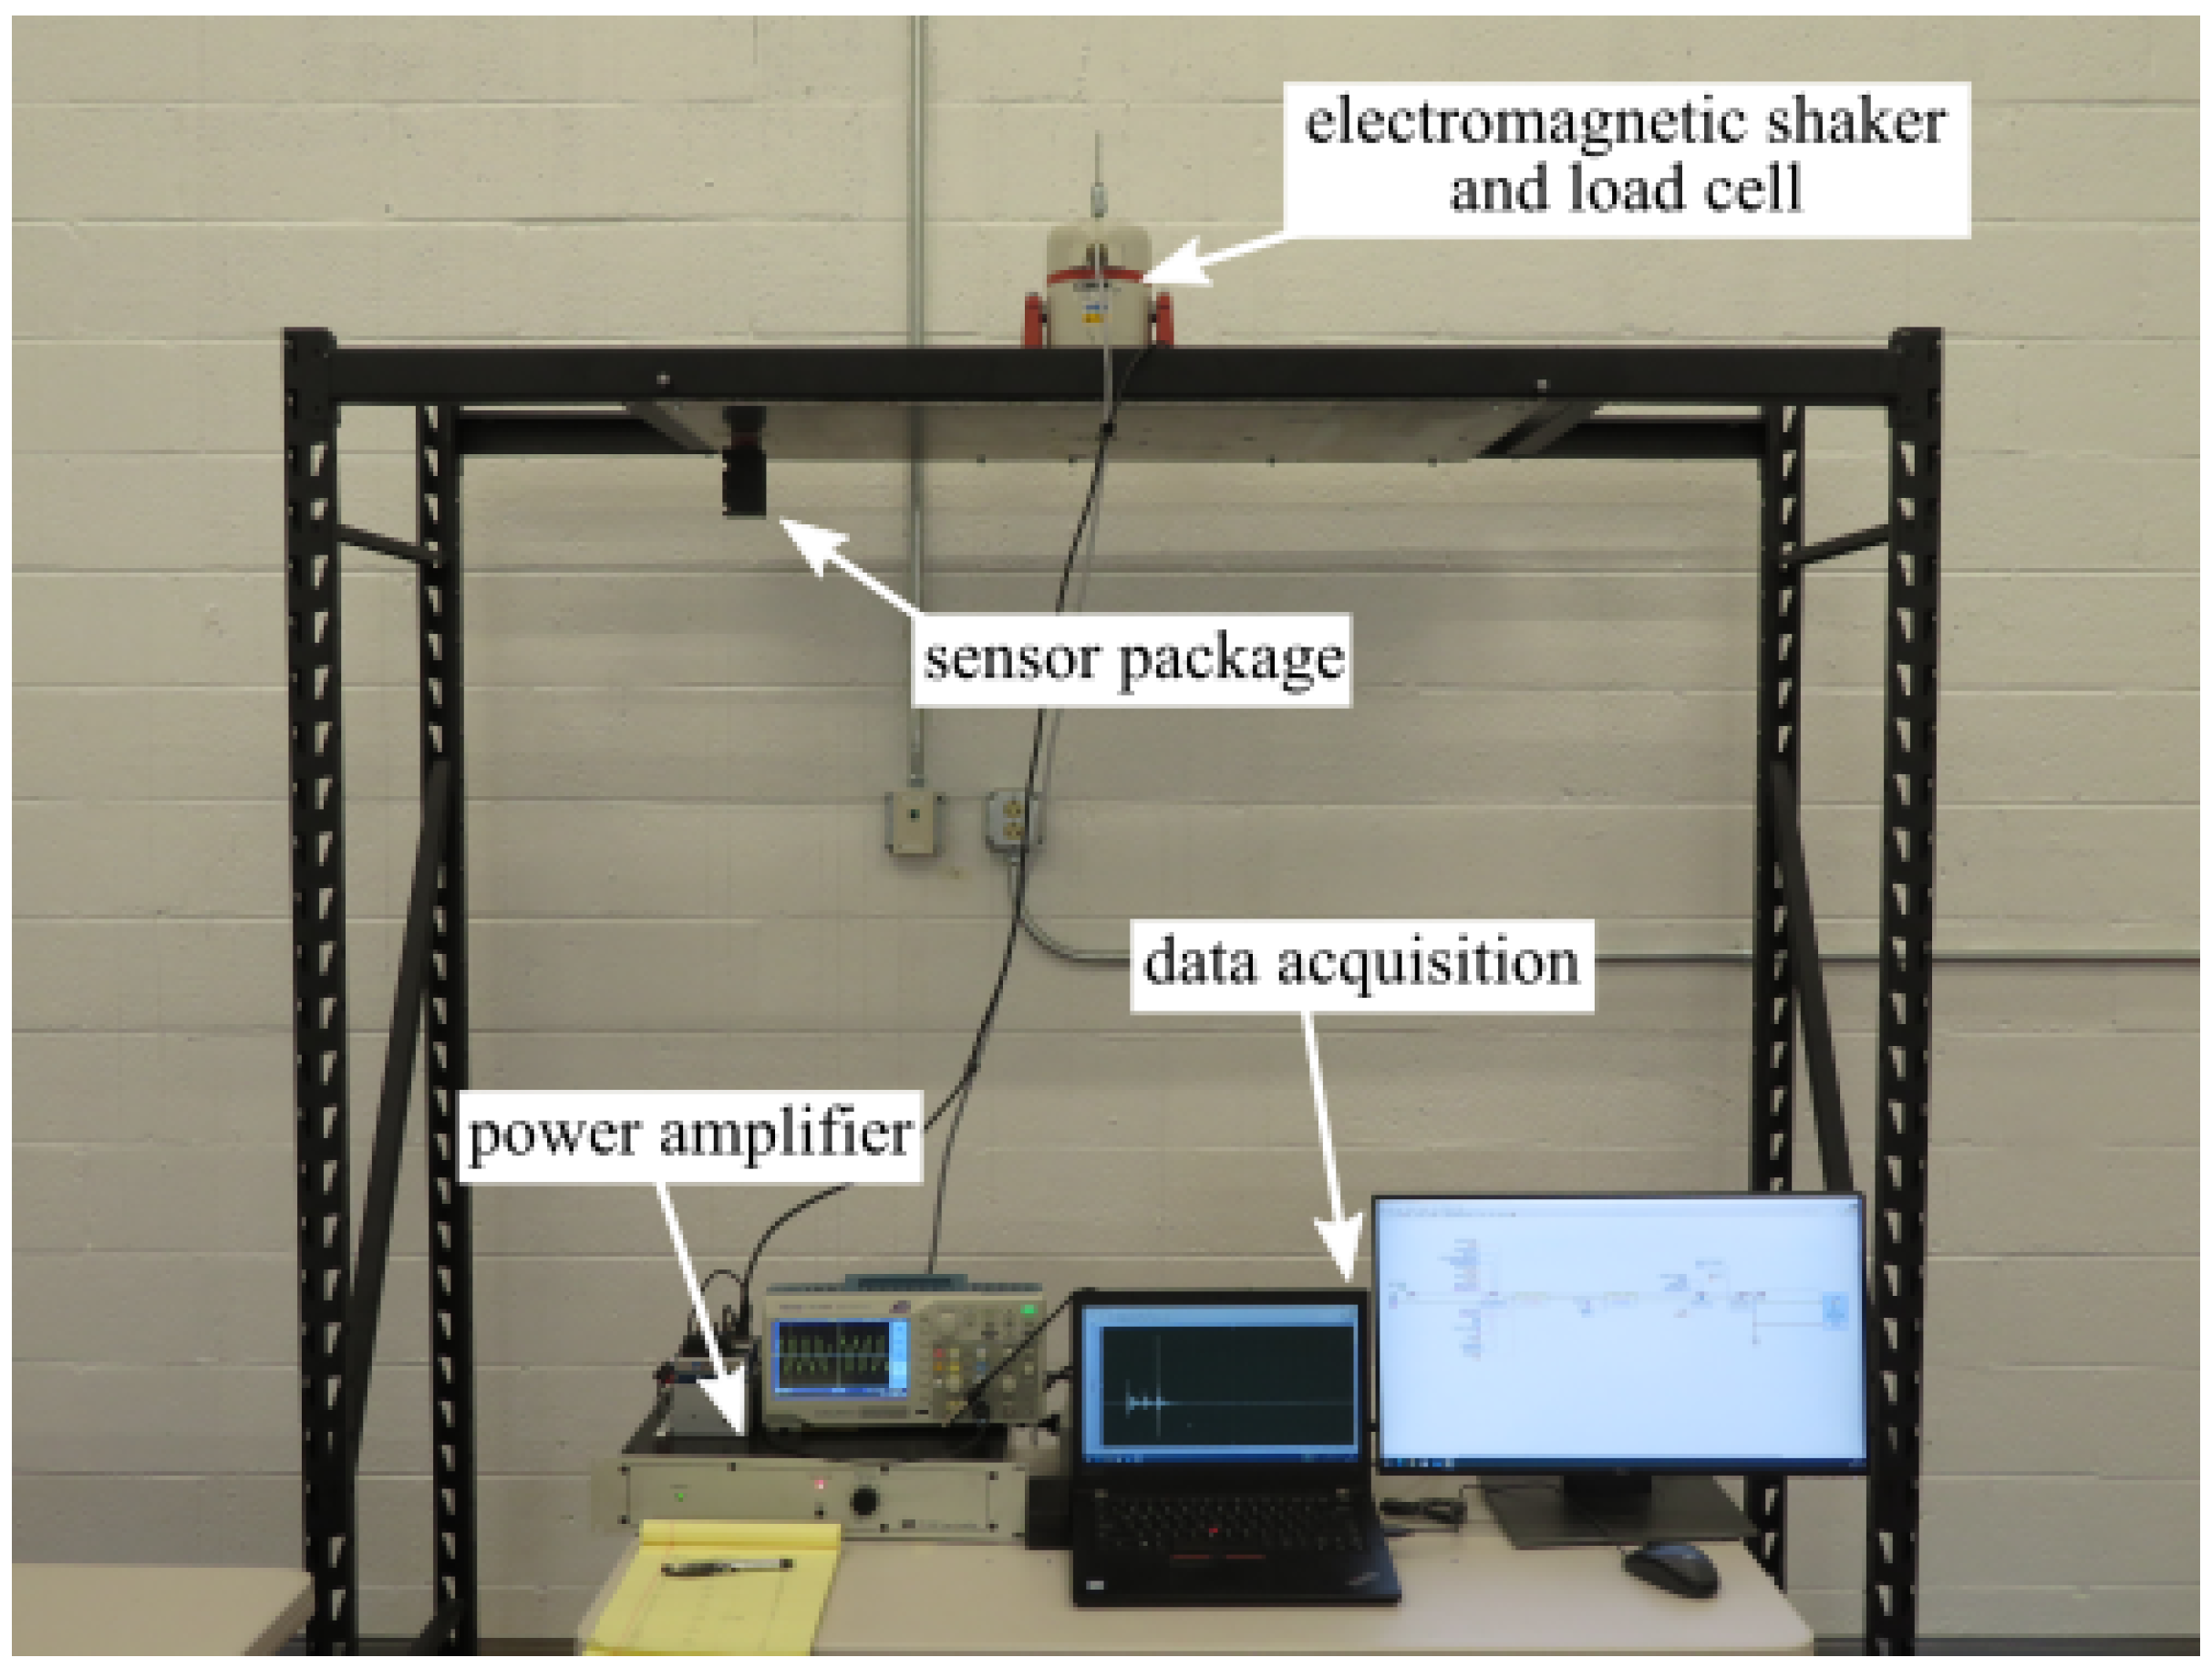
A test apparatus was constructed in the lab to replicate a bridge with a metallic surface, as shown in
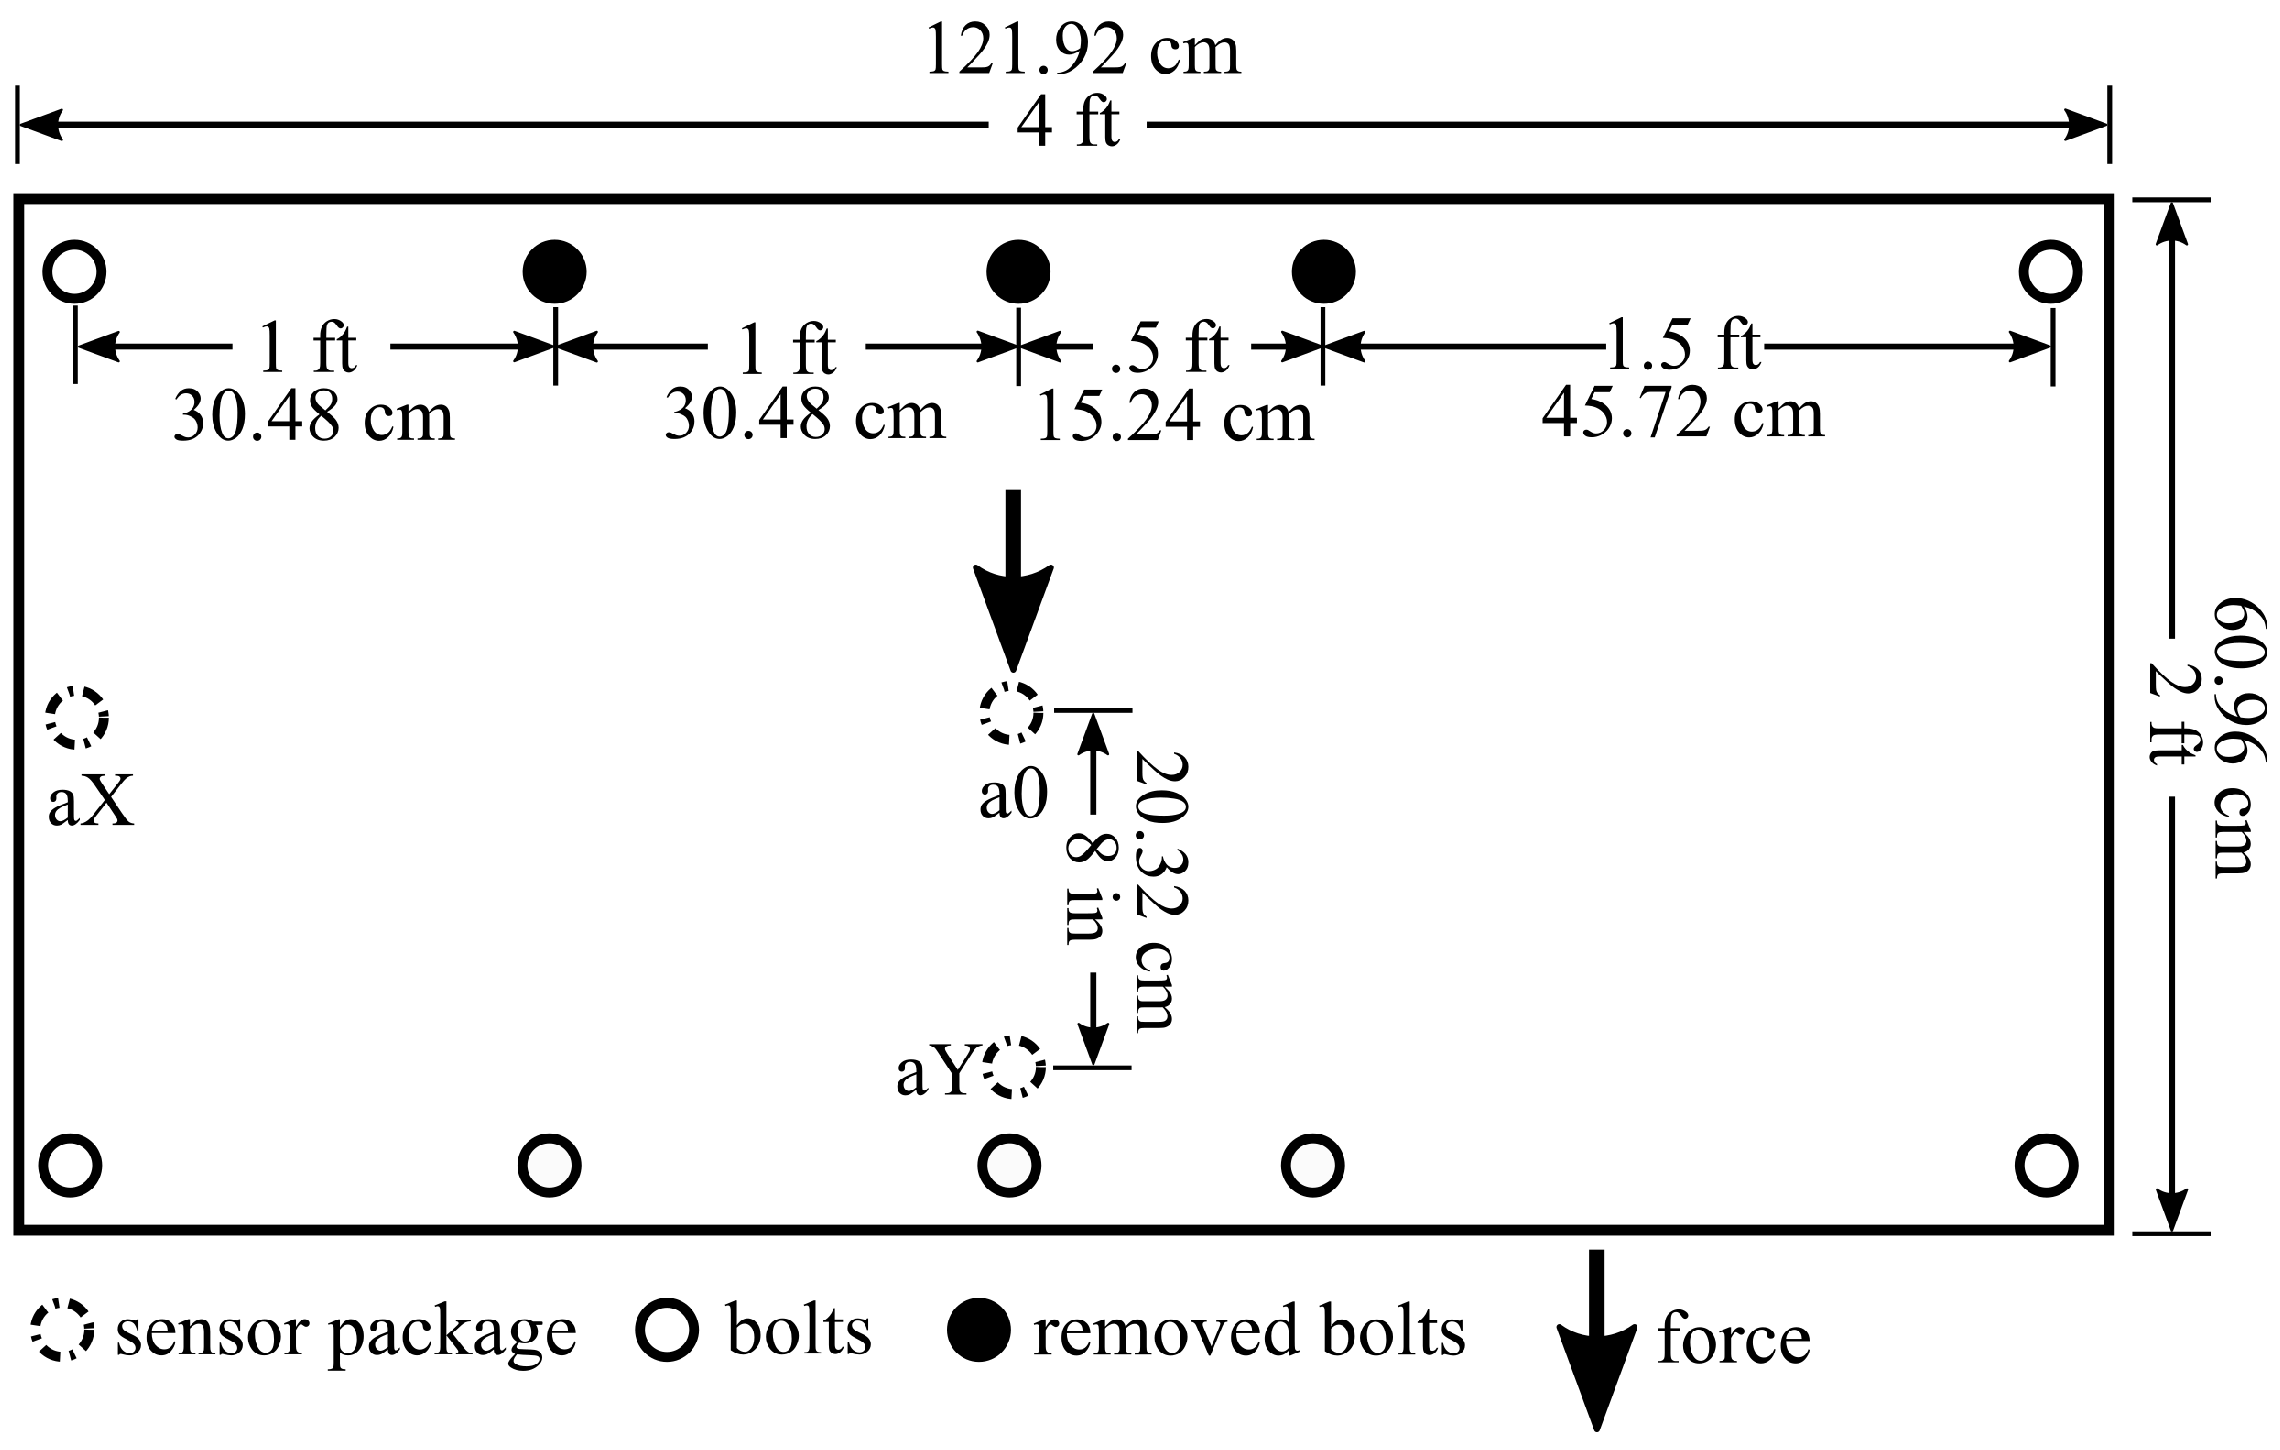
Figure 6. The structure was 6.5 ft tall and 6.5 ft wide (2 m × 2 m) with a 2 ft by 4 ft (60 cm × 120 cm) steel plate mounted in the center to serve as a docking platform.
Figure 7 shows a schematic of this plate. An electromagnetic shaker (Ling Dynamic Systems V408) was permanently mounted on top of the plate and used to excite the structure during our experiments. The test apparatus was placed inside a drone cage where the OptiTrack Motion Capture system was used for rigid body tracking. This system can provide accurate pose data (position and orientation) for our drone flights.
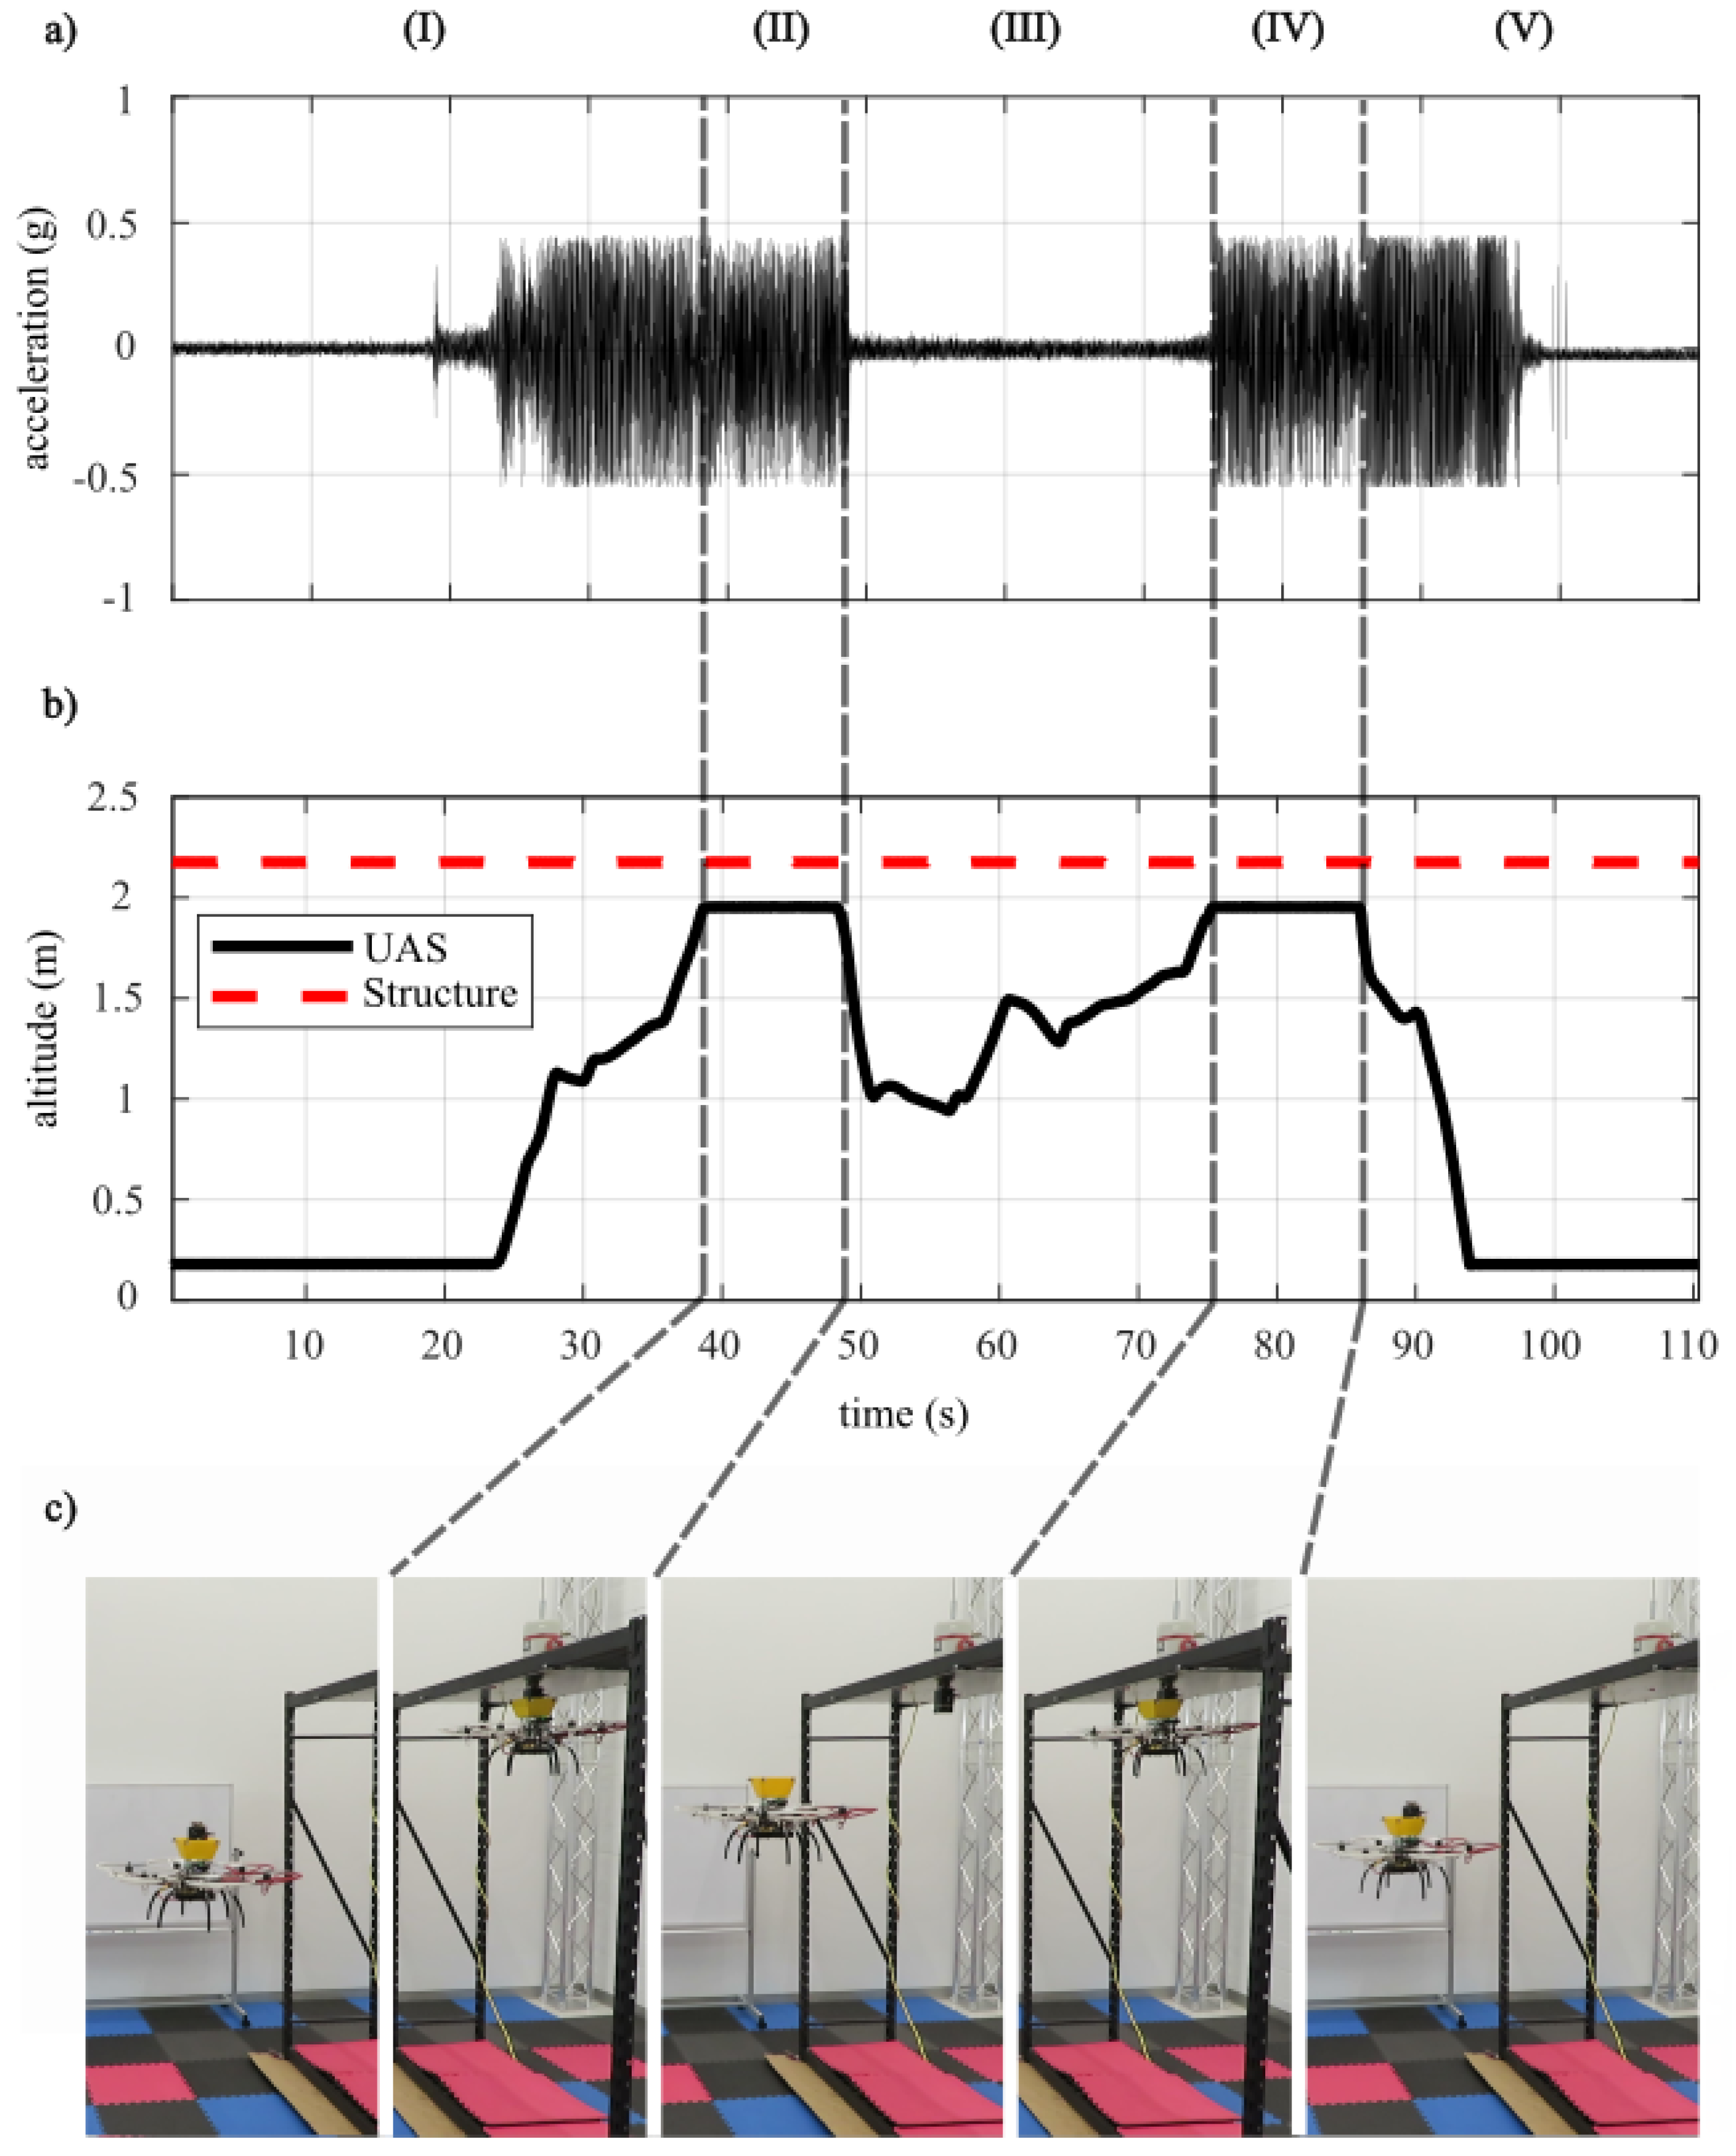
4.2. Drone-Based Deployment Validation
In this experiment, we aimed to validate the use of the drone for the sensor package deployment. The experiment was designed as follows: The drone approaches the structure and conducts the docking sequence described in
Section 3.2, then mounts the sensor package to the structure. After sufficient time for data collection has passed, the UAS approaches the structure again and reverses the docking sequence to retrieve the package. When the package has been retrieved, the entire system lands, and the test is complete. During this experiment, the electromagnetic shaker was set to excite the structure at 11.3 Hz while we collected acceleration data from the sensor package and displacement data from the OptiTrack Motion Capture system. Due to the underside of the structure being outside of the OptiTrack field of view, only the UAS position and orientation were tracked using the OptiTrack system.
The results are presented in
Figure 8. The first 25 s of the test were used to coordinate the data collection and ensure that the electropermanent magnets were properly set before takeoff. Adjustments were performed to properly align the UAS with the structure before making contact at 38 s, at which point, the UAS maintained contact until the 48 s mark (area II) to ensure the engagement of the electropermanent magnet on the sensor package and the disengaging of the electropermanent magnet on the UAS. Once the magnets were set, the UAS left the sensor package on the structure from the 38 s mark until the 75 s mark (area III). During this time, the UAS hovered near the structure to allow the sensor package to perform data collection without interference from the hanging mass of the UAS.
After allowing sufficient time for data collection, the UAS began the retrieval process by making contact with the package at 75 s. Contact was again maintained for 10 s to confirm the change in the electropermanent magnet state (area IV). For retrieval, the magnet on the UAS was engaged to maintain hold of the sensor package during landing prior to the magnet on the sensor package disengaging, allowing the system to begin its descent. This descent was performed immediately after securing the sensor package, and the drone landed at 94 s, completing the flight test.
The acceleration of the sensor package presented in
Figure 8 substantiated these movements showing intense vibration when the package was onboard the UAS and significantly smaller acceleration while in contact with a structure, indicating successful deployment. Experimental results showed the feasibility of the method, which can now be further developed [
26].
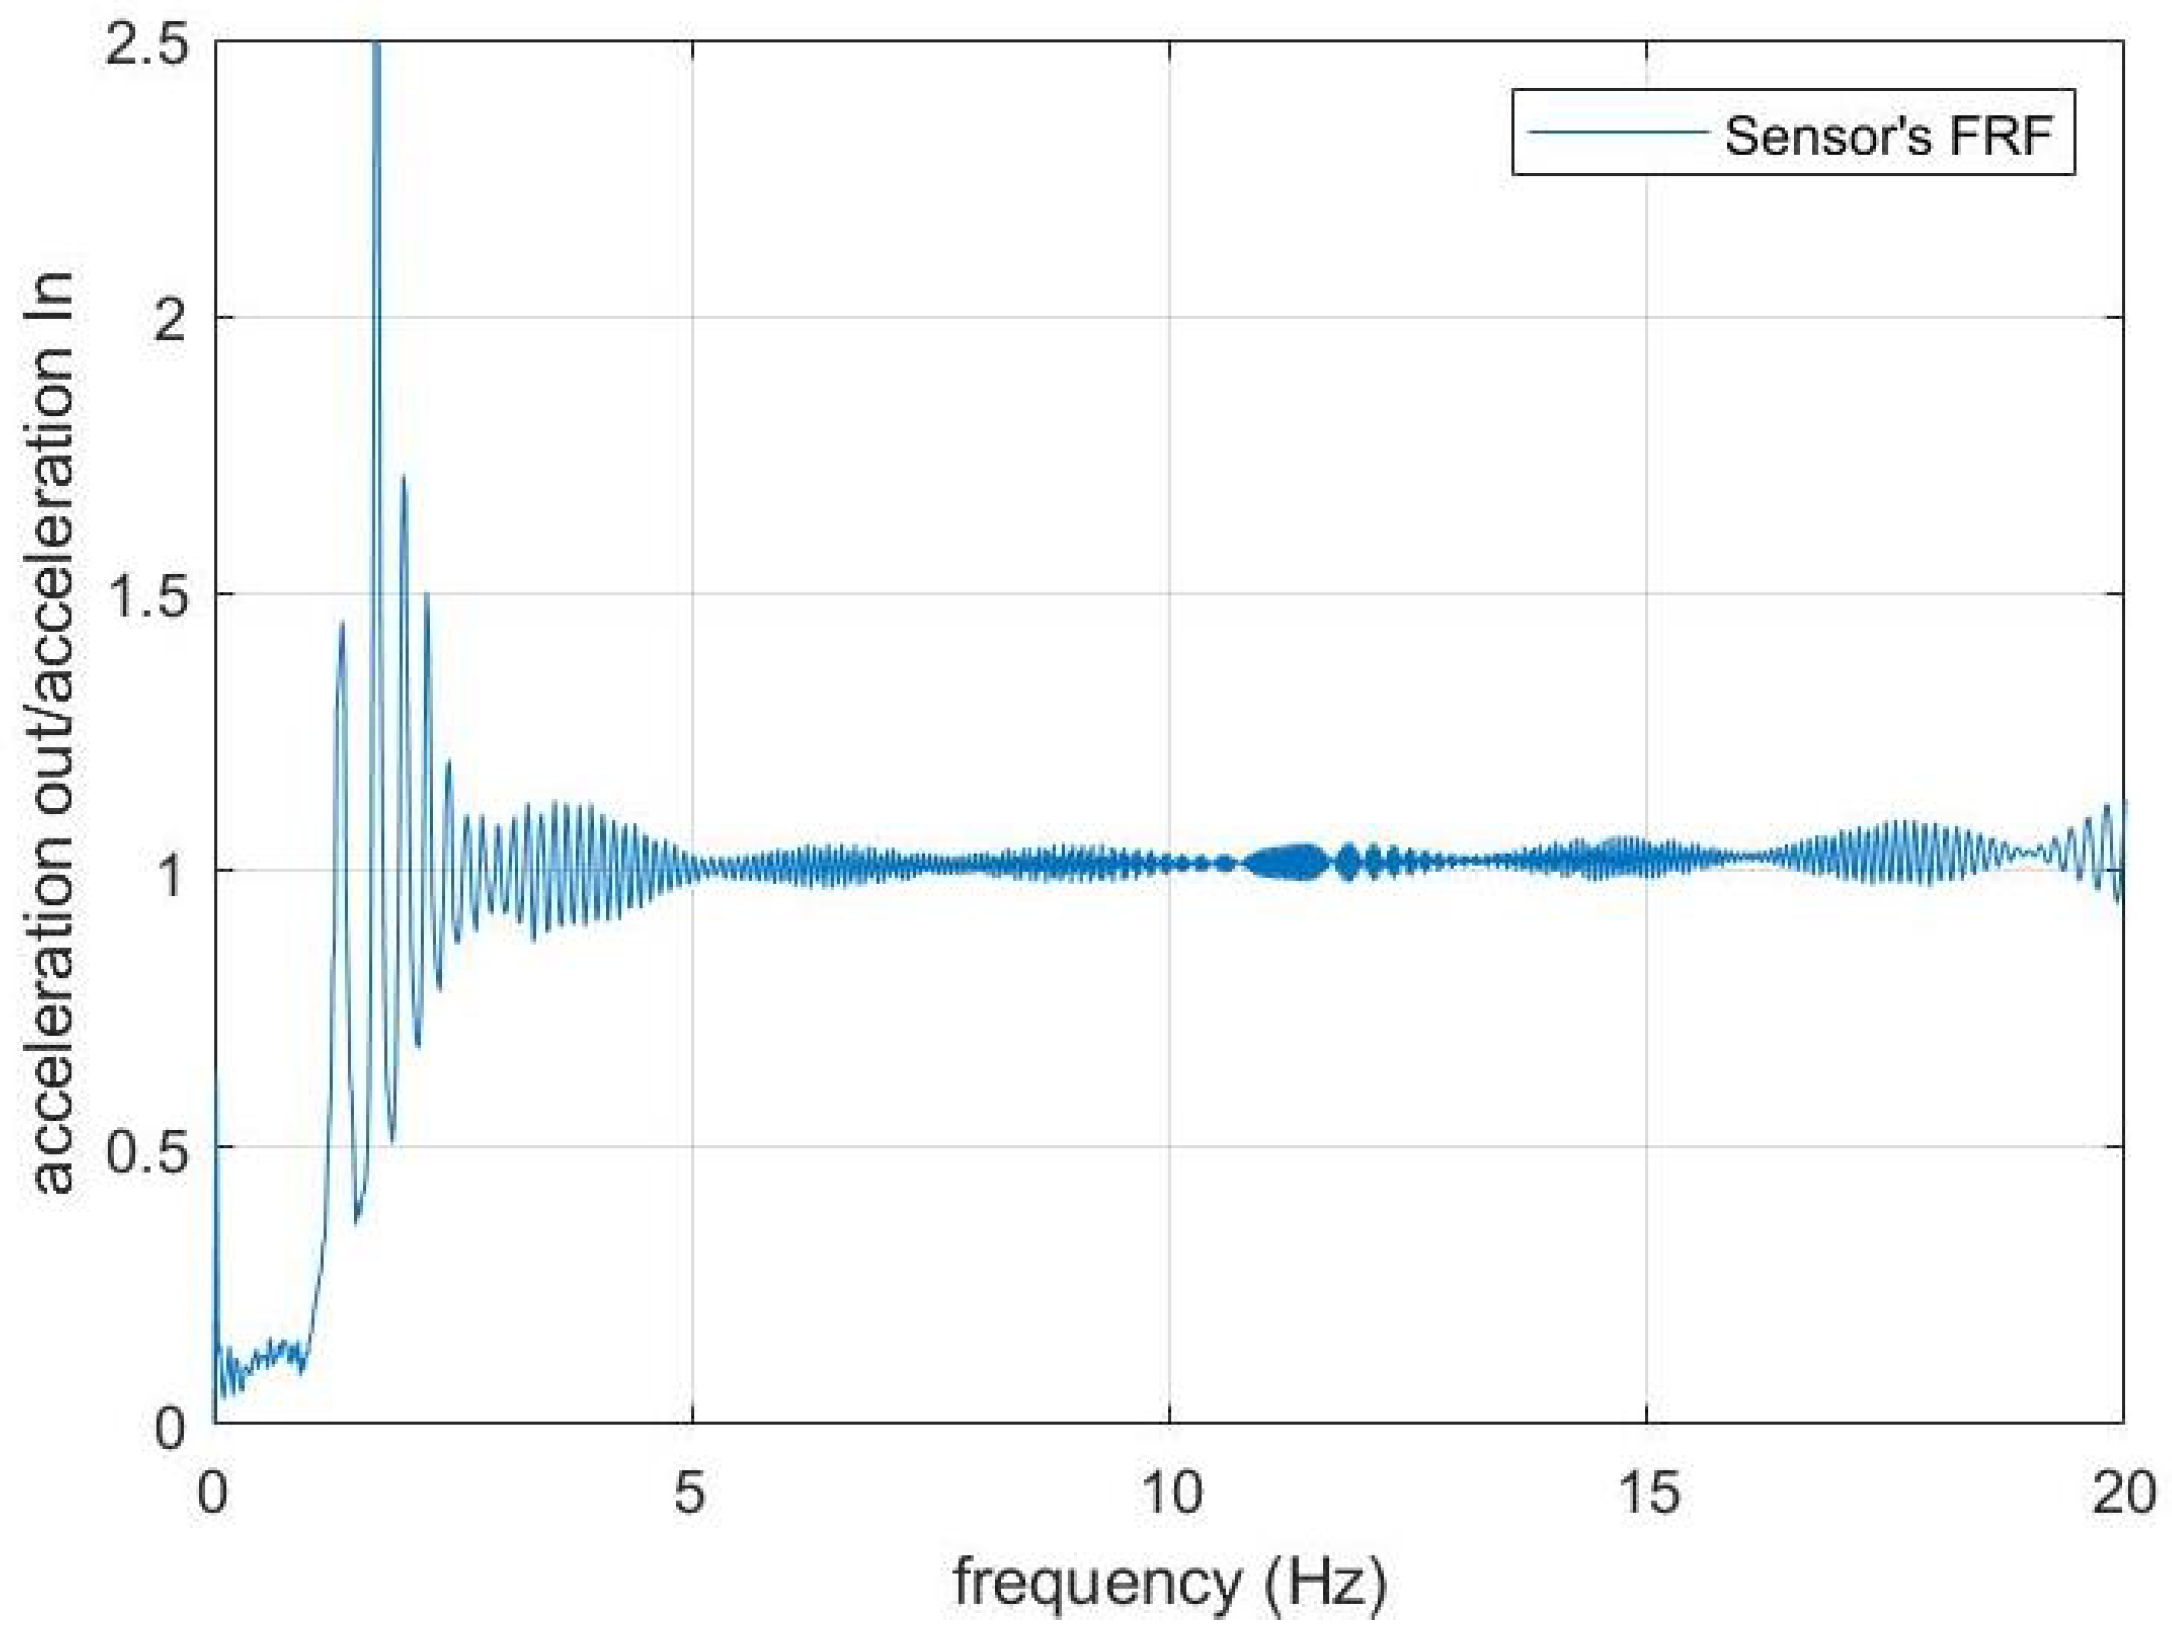
4.3. Sensor Package Validation
This experiment aimed at validating the accuracy of acceleration data collected by the sensor package. For this purpose, the sensor package was manually mounted along with a PCB accelerometer onto the steel plate, which was excited by the electromagnetic shaker (as shown in
Figure 6). Using a data acquisition module, the excitation signal was swept from 1–20 Hz over a test period of 50 s. Due to the limited sample size of the sensor package (74,000 samples), a sampling frequency of 1480 Hz was used as a result of the limited buffer size onboard the sensor package. The validation was conducted utilizing a frequency response function of the sensor package data over the reference PCB accelerometer, shown in
Figure 9. The results indicated an exponentially increasing error as the frequency approached zero. At lower frequencies (<5 Hz), the acceleration signal was below the sensitivity of the sensor package (5400 LSB/g), resulting in the large error shown. This could be mitigated in future designs by utilizing a higher accuracy accelerometer and decreasing the damping caused by the sensor package frame.
4.4. Damage Detection Validation
This experiment was designed to validate the ability of the sensor package to collect meaningful data for SHM applications. Since the system was developed to detect Level 1 damage, the sensor package needed to collect data before and after the structure had sustained damage. To simulate damage, three bolts supporting the steel plate were removed, as shown in
Figure 7. This experiment also utilized the electromagnetic shaker to generate harmonic excitation forces. Additionally, a load cell (Ling Dynamic Systems V408) was placed between the shaker and the plate to record the force transmitted to the structure to provide ground truth measurements. The sensor package was then manually mounted directly underneath the electromagnetic shaker and load cell, in the position a0 shown in
Figure 7. The shaker was first actuated at 7 Hz for 4 s and then stopped to allow the structure to vibrate freely. This was repeated at 14 Hz for both the undamaged and damaged structure.
The collected data underwent preprocessing in which the data from each experiment were smoothed through a 50-point rolling average and resampled to a total of 200 points to be considered as the response,
, in Equation (
3). The associated forcing function,
, in Equation (
3) can be either the load cell record or the voltage signal that drives the linear actuator [
31]. In this paper, the load cell record was utilized. Equation (
3) can now be implemented on each record to extract the DSR of the structure. It has been shown that damage can be detected by processing even a short segment of the record [
31], provided that the time step of the acquisition is adequate to capture the maximum desired frequency affecting the response.
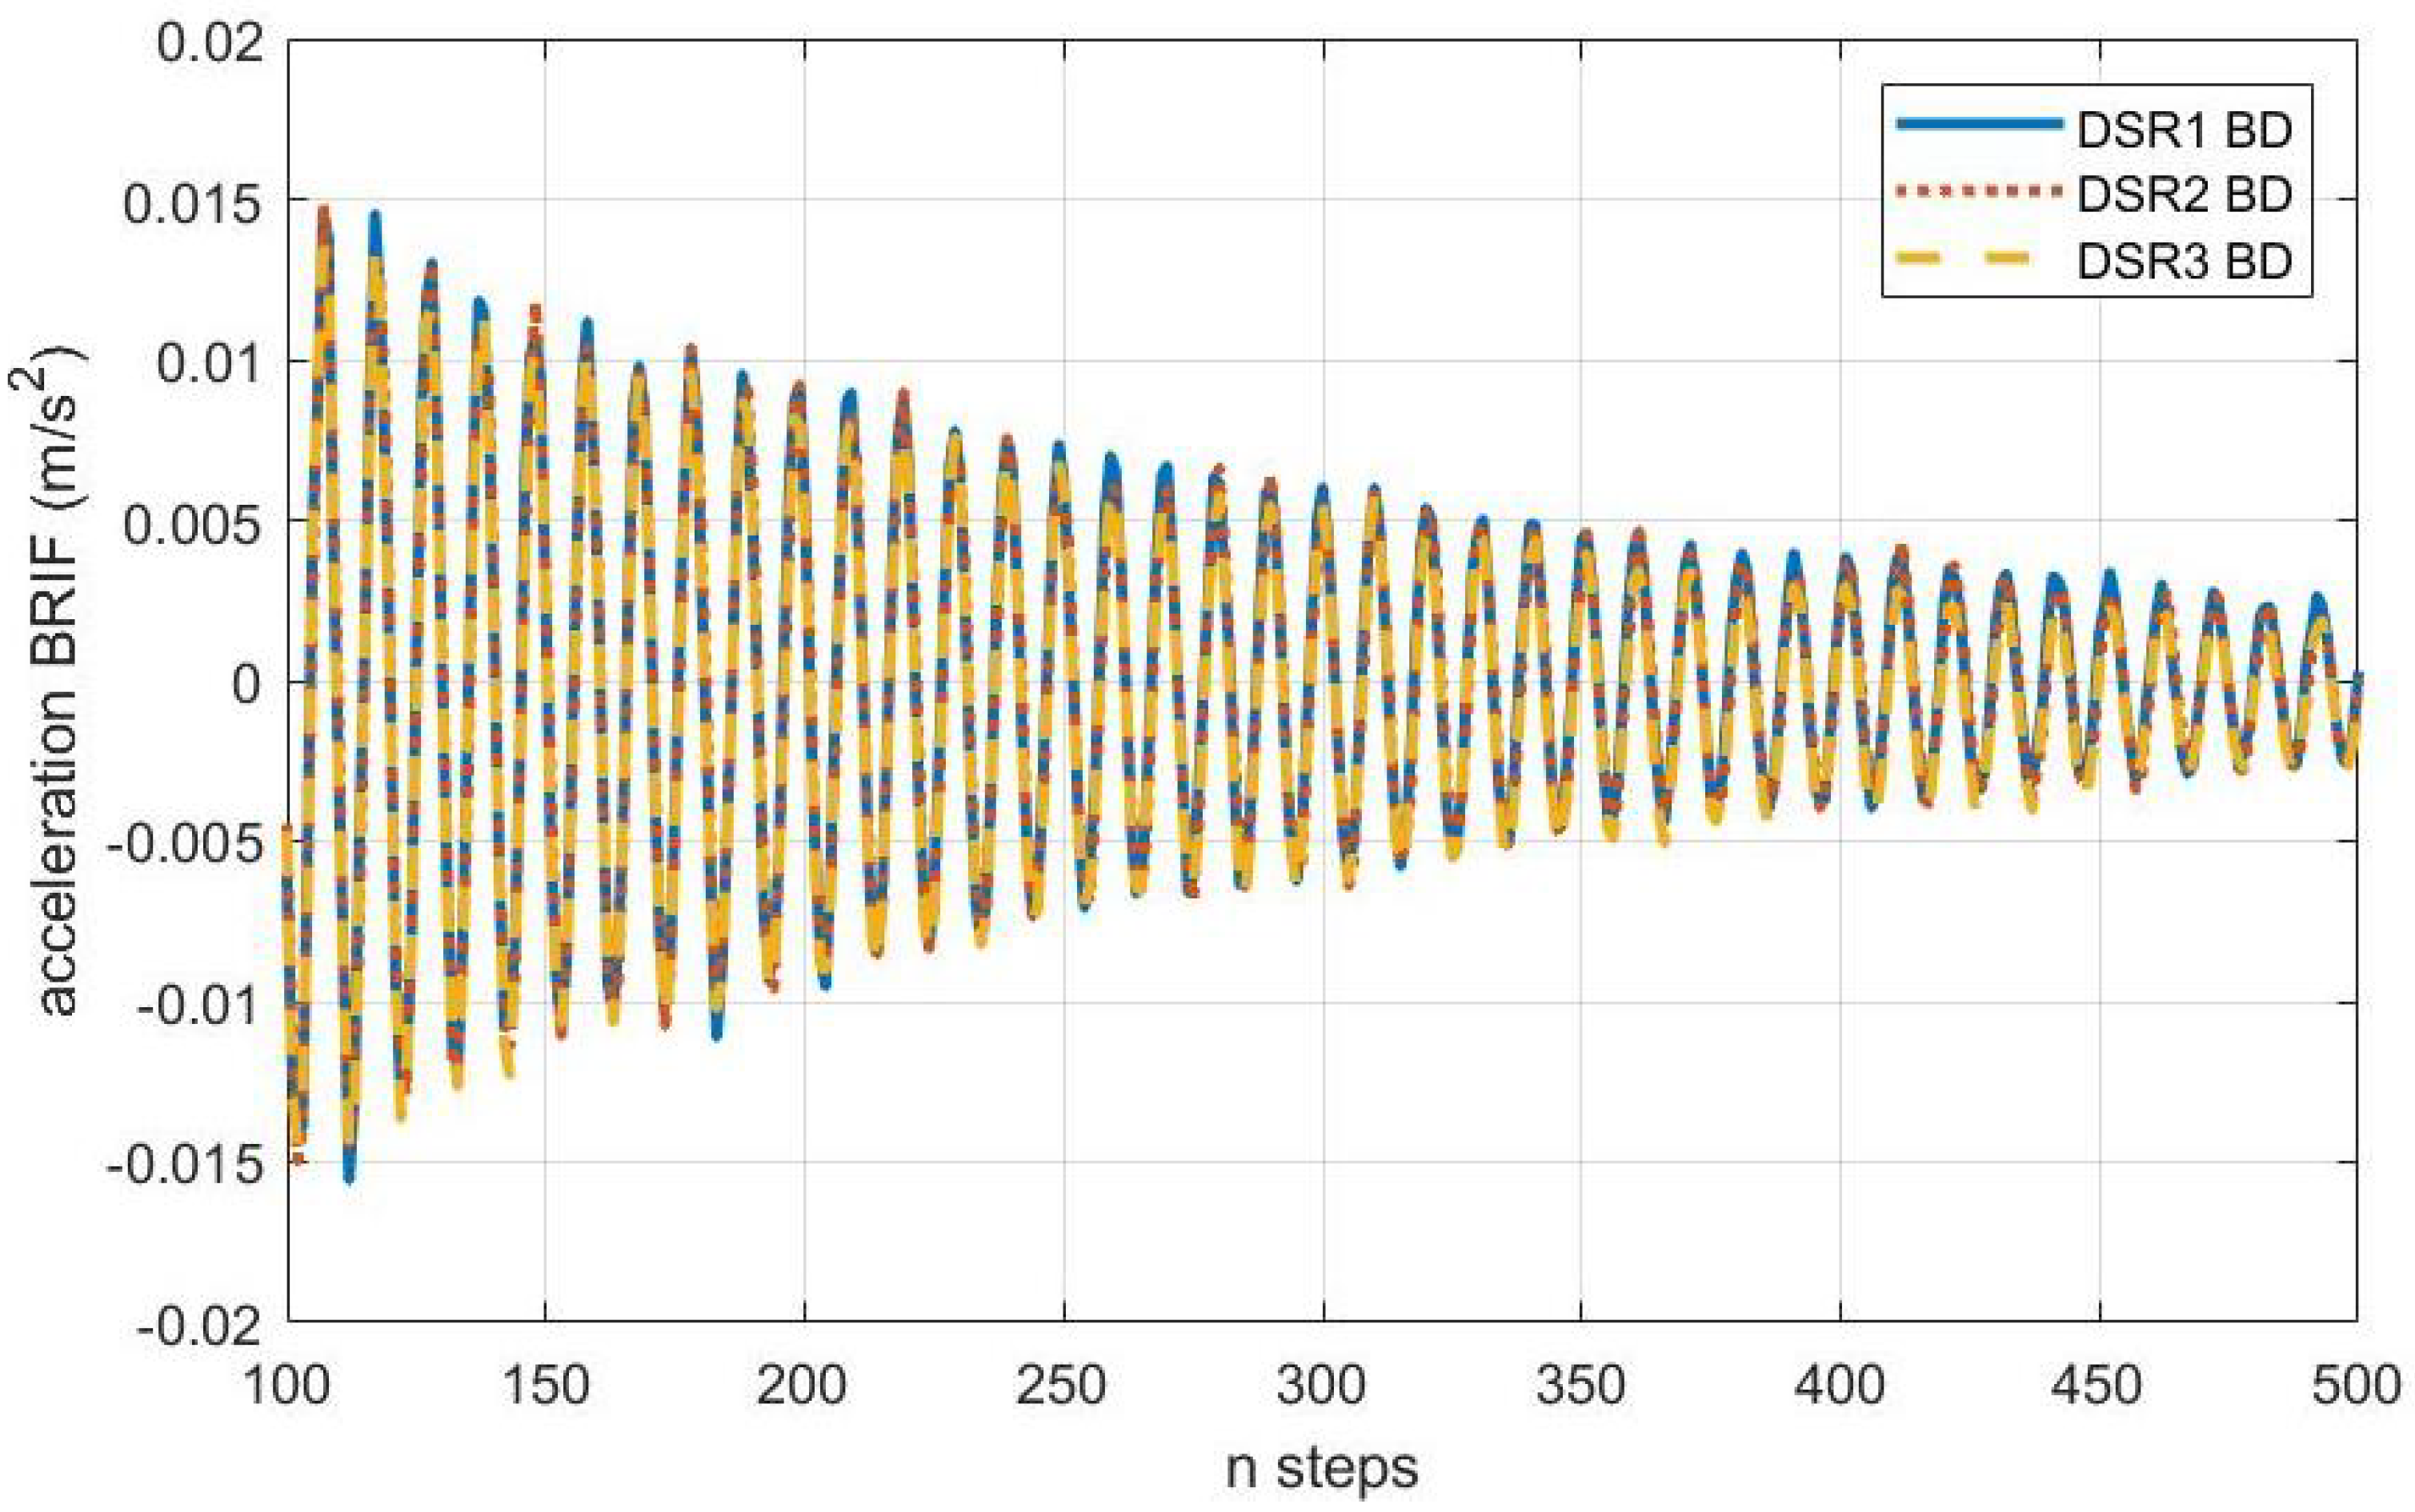
Figure 10 shows a 400-step segment of the DSR of the undamaged structure. Each DSR was extracted from the acceleration time history sampled in each of the three tests with the 14 Hz excitation force. As expected, the three DSR signals were almost identical and showed a high correlation (
= 0.989). This indicated that the state of the structure had not changed between acquisitions, and therefore, no damage was present.
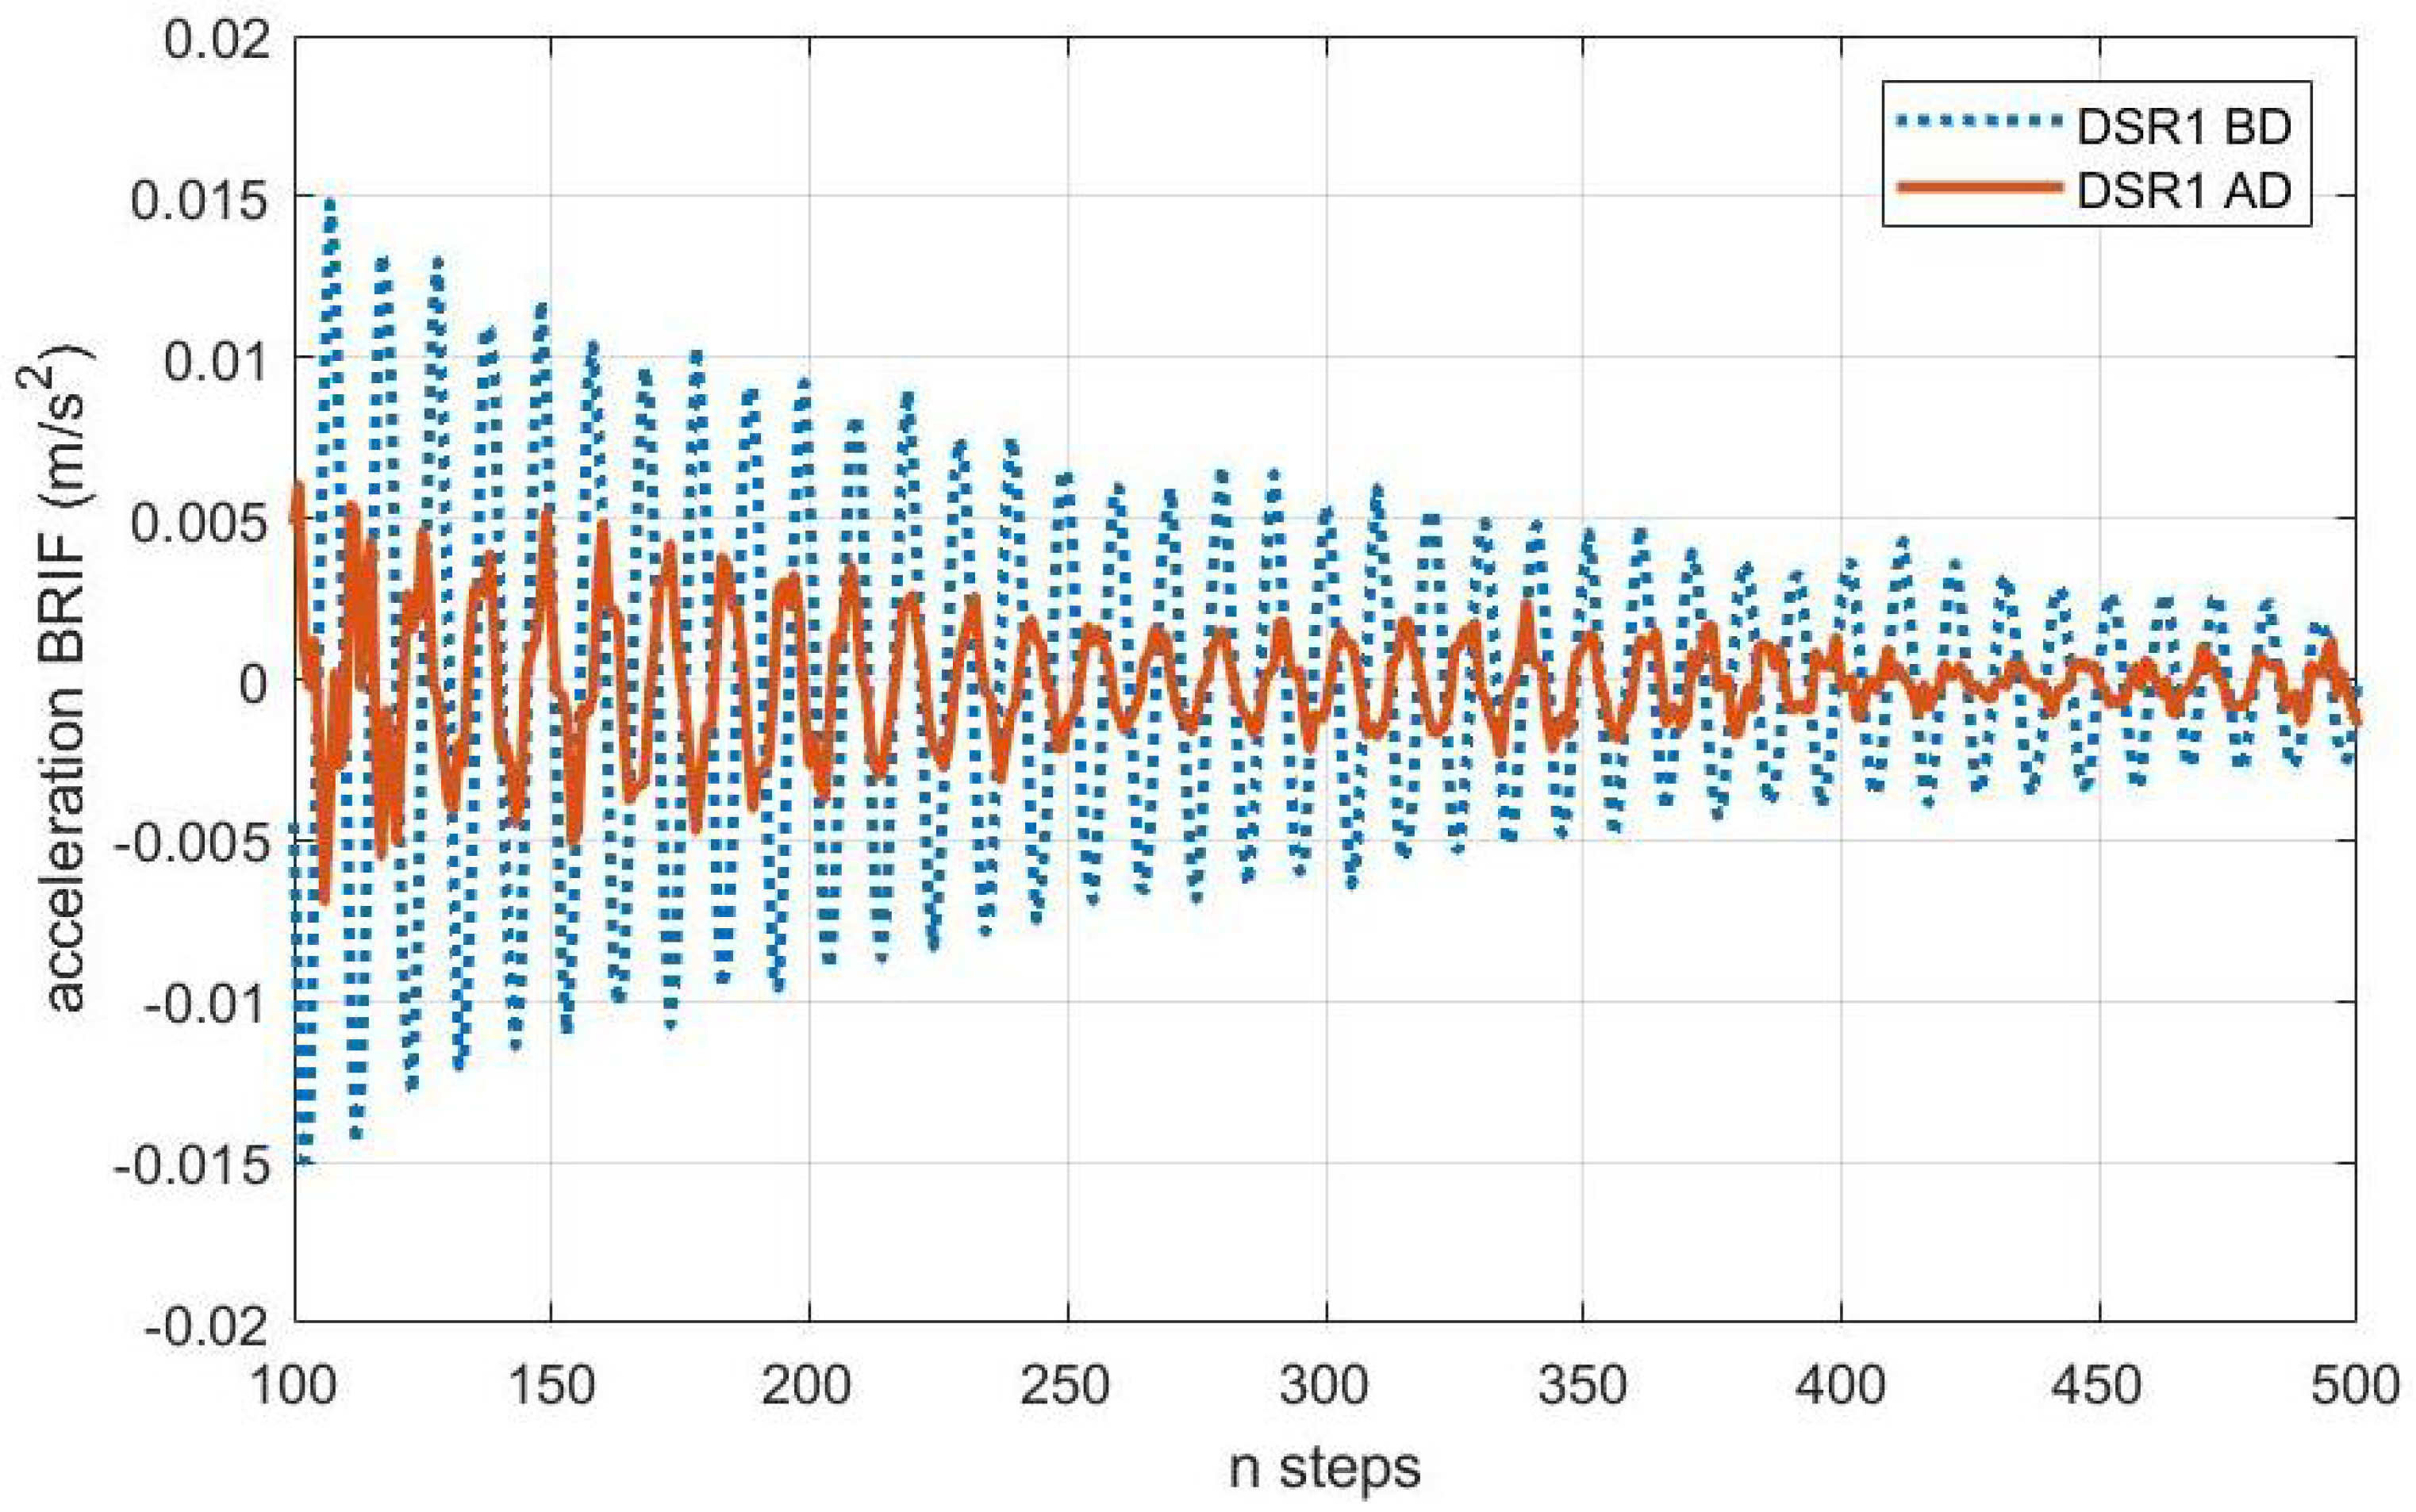
Figure 11 compares the DSR of the damaged and undamaged structure to the 14 Hz excitation force. These two BIRFs showed no correlation, indicating a change in the structural condition; thus, the presence of damage is detected.
In
Figure 10 and
Figure 11, the damage detection algorithm operated on a 0.8 s window of the free vibration structural response with an acquisition step of 2 × 10
−3 s. This allowed for approximately 10 sampling points within a response cycle, and thus, this was the minimum acquisition step required to capture frequencies up to approximately 300 Hz. It is noted that the structural response record was resampled to 1/4th of the original sampling frequency. It is also noted that an even shorter segment of the structural response could potentially be used in the damage detection algorithm.
Table 3 summarizes the
correlation coefficients of the BIRFs extracted from all tests for the two excitation frequencies on the undamaged and damaged structure. It was observed that all BIRFs correlated well (
> 0.8) when extracted from responses of either the undamaged or damaged structure, for both frequencies. However, the correlation was completely lost (
≈ 0) when the BIRFs of the undamaged and damaged structures were compared, regardless of the excitation.
5. Conclusions
This paper presented an initial prototype and the associated methodologies for a sensor package that can be deployed via a drone onto civil structures for structural health monitoring. Alongside this demonstration, Level 1 damage detection (the presence of damage in the structure) was performed using a novel BIRF technique to extract the DSR from data collected by reference accelerometers. Through manual flights, the feasibility of delivering and retrieving a sensor package from the underside of a structure was proven. Similarly, experimental validation showed that the BIRF method is an effective method for determining damage based on data collected from any sensor package.
In future work, the landing mechanism of the UAS system will be fully automated, instead of relying on manual flight controls. The sensitivity of the sensor package will be improved, and wireless communication and data transfer will be added. The use of elastomers will be considered in an effort to reduce the effect of drone vibrations on the measurements. As for the damage detection algorithm, future work will focus on expanding the methodology to include damage quantification and damage localization, which relate to Level 2 and 3 damage detection, respectively.
Author Contributions
The authors confirm the contributions to the paper as follows: study conception and design: N.V., A.D. and D.R.; data collection: S.C., J.S. and S.A.; analysis and interpretation of results: S.C., J.S., S.A., N.V., A.D. and D.R.; draft manuscript preparation: S.C., J.S., S.A., N.V., A.D. and D.R. All authors have read and agreed to the published version of the manuscript.
Funding
This work was partially supported by the University of South Carolina (UofSC) Office of Undergraduate Research (Magellan Awards 80003124 and 80003491), the UofSC College of Engineering and Computing startup fund and the Advanced Railway Technology Group at UofSC.
Institutional Review Board Statement
Not applicable.
Informed Consent Statement
Not applicable.
Conflicts of Interest
The authors declare no conflict of interest.
References
- Doebling, S.; Farrar, C.; Prime, M.; Shevitz, D. Damage Identification and Health Monitoring of Structural and Mechanical Systems from Changes in Their Vibration Characteristics: A Literature Review; Technical Report; Los Alamos National Laboratory (LANL): Los Alamos, NM, USA, 1996. [Google Scholar] [CrossRef] [Green Version]
- Ho, D.D.; Nguyen, K.D.; Yoon, H.S.; Kim, J.T. Multiscale Acceleration-Dynamic Strain-Impedance Sensor System for Structural Health Monitoring. Int. J. Distrib. Sens. Netw. 2012, 8, 709208. [Google Scholar] [CrossRef] [Green Version]
- Illinois Structural Health Monitoring Project. SHM-H Board High-Sensitivity Accelerometer Sensor Board Datasheet and User’s Guide. June 2009. Available online: https://shm.cs.illinois.edu/ (accessed on 1 August 2021).
- Smart Structure Systems Lab, University of Arizona. Structural Health Monitoring (SHM) Board Series for Imote2 Smart Sensor Platform. Technical Report. 2020. Available online: https://smartstructure.weebly.com/smart-sensor.html (accessed on 1 August 2021).
- Mohammed, Z.; Elfadel, I.; Rasras, M. Monolithic Multi Degree of Freedom (MDoF) Capacitive MEMS Accelerometers. Micromachines 2018, 9, 602. [Google Scholar] [CrossRef] [PubMed] [Green Version]
- Lent, B. Simple Steps to Selecting the Right Accelerometer. 2018. Available online: https://www.fierceelectronics.com/components/simple-steps-to-selecting-right-accelerometer-0 (accessed on 5 May 2020).
- Yoder, N.; Adams, D. Commonly used sensors for civil infrastructures and their associated algorithms. In Woodhead Publishing Series in Electronic and Optical Materials, Sensor Technologies for Civil Infrastructures; Woodhead Publishing: Cambridge, UK, 2014; pp. 57–85. [Google Scholar] [CrossRef]
- Sankarasrinivasan, S.; Balasubramanian, E.; Karthik, K.; Chandrasekar, U.; Gupta, R. Health Monitoring of Civil Structures with Integrated UAV and Image Processing System. Procedia Comput. Sci. 2015, 54, 508–515. [Google Scholar] [CrossRef] [Green Version]
- Sony, S.; Laventure, S.; Sadhu, A. A literature review of next-generation smart sensing technology in structural health monitoring. Struct. Control Health Monit. 2019, 26, e2321. [Google Scholar] [CrossRef]
- Jimenez-Cano, A.; Braga, J.; Heredia, G.; Ollero, A. Aerial manipulator for structure inspection by contact from the underside. In Proceedings of the 2015 IEEE/RSJ International Conference on Intelligent Robots and Systems (IROS), Hamburg, Germany, 28 September–2 October 2015; pp. 1879–1884. [Google Scholar] [CrossRef]
- Ruggiero, F.; Lippiello, V.; Ollero, A. Aerial Manipulation: A Literature Review. IEEE Robot. Autom. Lett. 2018, 3, 1957–1964. [Google Scholar] [CrossRef] [Green Version]
- Bodie, K.; Brunner, M.; Pantic, M.; Walser, S.; Pfndler, P.; Angst, U.; Siegwart, R.; Nieto, J. An Omnidirectional Aerial Manipulation Platform for Contact-Based Inspection. arXiv 2019, arXiv:1905.03502. [Google Scholar]
- Hamaza, S.; Georgilas, I.; Fernandez, M.; Sanchez, P.; Richardson, T.; Heredia, G.; Ollero, A. Sensor Installation and Retrieval Operations Using an Unmanned Aerial Manipulator. IEEE Robot. Autom. Lett. 2019, 4, 2793–2800. [Google Scholar] [CrossRef] [Green Version]
- Takeuchi, K.; Masuda, A.; Akahori, S.; Higashi, Y.; Miura, N. A close inspection and vibration sensing aerial robot for steel structures with an EPM-based landing device. In Proceedings of the Nondestructive Characterization and Monitoring of Advanced Materials, Aerospace, and Civil Infrastructure 2017, Portland, OR, USA, 26–29 March 2017; Volume 10169, p. 101692U. [Google Scholar] [CrossRef]
- Sabamehr, A.; Lim, C.; Bagchi, A. System identification and model updating of highway bridges using ambient vibration tests. J. Civ. Struct. Health Monit. 2018, 8, 755–771. [Google Scholar] [CrossRef]
- Fritzen, C.P.; Kraemer, P. Self-diagnosis of smart structures based on dynamical properties. Mech. Syst. Signal Process. 2009, 23, 1830–1845. [Google Scholar] [CrossRef]
- Liu, J.; Chen, S.; Bergés, M.; Bielak, J.; Garrett, J.H.; Kovačević, J.; Noh, H.Y. Diagnosis algorithms for indirect structural health monitoring of a bridge model via dimensionality reduction. Mech. Syst. Signal Process. 2020, 136, 106454. [Google Scholar] [CrossRef]
- Abdo, M. Structural Health Monitoring, History, Applications and Future. A Review Book; Open Science: New York, NY, USA, 2014. [Google Scholar]
- Farrar, C.R.; Doebling, S. An Overview Of Modal Based Damage Identification Methods, Engineering Analysis Group. In Proceedings of the Structural Damage Assessment Using Advanced Signal Processing Procedures (DAMAS), Sheffield, UK, 30 June–2 July 1997. [Google Scholar]
- Doebling, S.W.; Farrar, C.R.; Prime, M.B. A Summary Review of Vibration-Based Damage Identification Methods. Shock Vib. Dig. 1998, 30, 91–105. [Google Scholar] [CrossRef] [Green Version]
- Civera, M.; Zanotti Fragonara, L.; Surace, C. An experimental study of the feasibility of phase-based video magnification for damage detection and localisation in operational deflection shapes. Strain 2020, 56, e12336. [Google Scholar] [CrossRef]
- Rizos, D.C.; Karabalis, D.L. A time domain BEM for 3-D elastodynamic analysis using the B-spline fundamental solutions. Comput. Mech. 1998, 22, 108–115. [Google Scholar] [CrossRef]
- Rizos, D.C.; Loya, K.G. Dynamic and Seismic Analysis of Foundations based on Free Field B-Spline Characteristic Response Histories. J. Eng. Mech. 2002, 128, 438–448. [Google Scholar] [CrossRef]
- Stehmeyer, E.H.; Rizos, D.C. B-Spline impulse response functions (BIRF) for transient SSI analysis of rigid foundations. Soil Dyn. Earthq. Eng. 2006, 26, 421–434. [Google Scholar] [CrossRef]
- Leon, E.; Rizos, D.C.; Caicedo, J.M. A procedure to develop scalable models for the transient response of sleepers in conventional and high-speed railway lines and implementation to the vertical vibration mode. Soil Dyn. Earthq. Eng. 2011, 31, 502–511. [Google Scholar] [CrossRef]
- Carroll, S.; Kalaitzakis, M.; Vitzilaios, N. UAS Sensor Deployment and Retrieval to the Underside of Structures. In Proceedings of the 2021 International Conference on Unmanned Aircraft Systems (ICUAS), Athens, Greece, 15–18 June 2021; pp. 895–900. [Google Scholar] [CrossRef]
- Rizos, D.C. Advanced Time Domain Boundary Element Method for General 3-D Elastodynamic Problems. Ph.D. Thesis, Civil and Environmental Engineering, University of South Carolina, Columbia, SC, USA, 1993. [Google Scholar]
- Mulliken, J.; Rizos, D.C. A coupled computational method for multi-solver, multi-domain transient problems in elastodynamics. Soil Dyn. Earthq. Eng. 2012, 34, 78–88. [Google Scholar] [CrossRef]
- Karabalis, D.L.; Rizos, D. Dynamic analysis of 3-D foundations. Bound. Elem. Tech. Geomech. 1993, 6, 177–208. [Google Scholar]
- Alkharousi, S. Identification of Structural Signature Responses from Response Time Histories Using B-Spline Impulse Response Techniques. Master’s Thesis, Department of Civil & Environmental Engineering, University of South Carolina, Columbia, SC, USA, 2021. [Google Scholar]
- Alkharousi, S.; Rizos, D.C. Identification of Structural Signature Responses from Response Time Histories Using B Spline Impulse Response Techniques. Struct. Health Monit. 2022. in preparation. [Google Scholar]
Figure 1.
Comparison of performance versus cost for the three main types of accelerometers.
Figure 1.
Comparison of performance versus cost for the three main types of accelerometers.
Figure 2.
Block diagram of the sensor package circuit schematic.
Figure 2.
Block diagram of the sensor package circuit schematic.
Figure 3.
Constituent components of the sensor package.
Figure 3.
Constituent components of the sensor package.
Figure 4.
The docking and retrieval system of the sensor package featuring two electropermanent magnets: #1 on the top of the package, used to mount it to the underside of structures; and #2 on the drone docking platform, used to secure, transfer, deliver, and retrieve the package.
Figure 4.
The docking and retrieval system of the sensor package featuring two electropermanent magnets: #1 on the top of the package, used to mount it to the underside of structures; and #2 on the drone docking platform, used to secure, transfer, deliver, and retrieve the package.
Figure 5.
Overview of the custom Unmanned Aircraft System (UAS or drone) developed for sensor deployment and retrieval.
Figure 5.
Overview of the custom Unmanned Aircraft System (UAS or drone) developed for sensor deployment and retrieval.
Figure 6.
Overview of the test apparatus with key components annotated.
Figure 6.
Overview of the test apparatus with key components annotated.
Figure 7.
Schematic of the steel plate structure used in the experiments featuring the sensor package placement and the relative location of the supporting bolts used to simulate damage.
Figure 7.
Schematic of the steel plate structure used in the experiments featuring the sensor package placement and the relative location of the supporting bolts used to simulate damage.
Figure 8.
UAS deployment of the sensor package showing (a) acceleration of the sensor package, (b) displacement of the UAS, and (c) photos of the sensor deployment and retrieval experiment.
Figure 8.
UAS deployment of the sensor package showing (a) acceleration of the sensor package, (b) displacement of the UAS, and (c) photos of the sensor deployment and retrieval experiment.
Figure 9.
Frequency response function of the sensor package for 1–20 Hz excitation.
Figure 9.
Frequency response function of the sensor package for 1–20 Hz excitation.
Figure 10.
The Dynamic Signature Response (DSR) extracted from 400 steps of the free vibration phase of the response of the undamaged structure excited by a 14 Hz harmonic force.
Figure 10.
The Dynamic Signature Response (DSR) extracted from 400 steps of the free vibration phase of the response of the undamaged structure excited by a 14 Hz harmonic force.
Figure 11.
The DSR extracted from 400 steps of the free vibration phase of the response of the undamaged and damaged structure excited by a 14 Hz harmonic force.
Figure 11.
The DSR extracted from 400 steps of the free vibration phase of the response of the undamaged and damaged structure excited by a 14 Hz harmonic force.
Table 1.
Summary of the sensor package features.
Table 1.
Summary of the sensor package features.
| Sample Size | Rate of Data Collection | Resolution | Sensitivity | Steady-State Power | Package Weight |
|---|
| 74,000 Samples | 28 kHz | 16-bit | 5400 LSB/g | 0.296 W | 380 g |
Table 2.
Operation status for Electropermanent Magnets #1 and #2 for each sensor package and UAS position.
Table 2.
Operation status for Electropermanent Magnets #1 and #2 for each sensor package and UAS position.
| Electropermanent Magnet #1 | Electropermanent Magnet #2 | Sensor Package | UAS |
|---|
| Unmagnetized | Magnetized | Attached to UAS | At delivery |
| Magnetized | Unmagnetized | Attached to structure | Package deployed |
Table 3.
Correlation coefficients between BIRFs of the undamaged and damaged structure for the 7 Hz and 14 Hz excitation frequencies.
Table 3.
Correlation coefficients between BIRFs of the undamaged and damaged structure for the 7 Hz and 14 Hz excitation frequencies.
| | Before Damage | After Damage |
|---|
| | 7 Hz | 14 Hz | 7 Hz | 14 Hz |
| | Test | 1 | 2 | 3 | 1 | 2 | 3 | 1 | 2 | 3 | 1 | 2 | 3 |
| Before Damage | 7 Hz | 1 | 1.000 | 0.883 | 0.890 | 0.900 | 0.888 | 0.895 | 0.092 | 0.080 | 0.086 | 0.084 | 0.087 | 0.079 |
| | | 2 | | 1.000 | 0.891 | 0.909 | 0.898 | 0.905 | 0.098 | 0.086 | 0.090 | 0.083 | 0.087 | 0.086 |
| | | 3 | | | 1.000 | 0.865 | 0.864 | 0.865 | 0.086 | 0.078 | 0.079 | 0.083 | 0.096 | 0.078 |
| | 14 Hz | 1 | | | | 1.000 | 0.989 | 0.991 | 0.097 | 0.095 | 0.094 | 0.087 | 0.091 | 0.087 |
| | | 2 | | | | | 1.000 | 0.990 | 0.095 | 0.096 | 0.093 | 0.088 | 0.088 | 0.085 |
| | | 3 | | | | | | 1.000 | 0.099 | 0.098 | 0.096 | 0.092 | 0.088 | 0.081 |
| After Damage | 7 Hz | 1 | | | | | | | 1.000 | 0.879 | 0.892 | 0.813 | 0.798 | 0.815 |
| | | 2 | | | | | | | | 1.000 | 0.906 | 0.812 | 0.809 | 0.839 |
| | | 3 | | | | | | | | | 1.000 | 0.805 | 0.787 | 0.813 |
| | 14 Hz | 1 | | | | | | | | | | 1.000 | 0.921 | 0.927 |
| | | 2 | | | | | | | | | | | 1.000 | 0.910 |
| | | 3 | | | | | | | | | | | | 1.000 |
| Publisher’s Note: MDPI stays neutral with regard to jurisdictional claims in published maps and institutional affiliations. |
© 2021 by the authors. Licensee MDPI, Basel, Switzerland. This article is an open access article distributed under the terms and conditions of the Creative Commons Attribution (CC BY) license (https://creativecommons.org/licenses/by/4.0/).


 ,
, 


