Article

Investigation of Dispersion, Interfacial Adhesion of Isotropic and Anisotropic Filler in Polymer Composite

1
FZU-Institute of Physics of Czech Academy of Science, Prague 8, 18221 Prague, Czech Republic
2
Department of Civil Engineering and Architecture, University of Catania an UdR-Catania Consorzio INSTM, Viale Andrea Doria 6, 95125 Catania, Italy
*
Authors to whom correspondence should be addressed.
Appl. Sci. 2021, 11(18), 8561; https://doi.org/10.3390/app11188561
Submission received: 9 August 2021 / Revised: 7 September 2021 / Accepted: 10 September 2021 / Published: 15 September 2021
(This article belongs to the Special Issue Design, Synthesis and Characterization of Hybrid Composite Materials)

Abstract

:
The movement of isotropic and anisotropic particles of iron and graphite within the polymer matrix was predicted and examined by the COMSOL simulation method. The interfacial adhesion of filler particles within the matrix was investigated under surface features observation. Carbonyl Iron (CI) particles, considered to be regular with a uniform size of (1–5 µm), were mixed with irregular particles of graphite (20–150 µm) with 30 V% in quantity in a silicone rubber matrix. The particle–matrix and particle–particle interactions were analyzed from the inner surface features. The drag of non-spherical particles and particle Reynolds numbers (Rep) were taken into consideration in point force models for both the Stokes (Rep ≪ 1) and Newton regime for particle shape. Newton regime is based on the aspect ratio for particles with regular and irregular shapes. The boundary area of the irregular particles holds like an anchor inside the polymer matrix for strong adhesion; however, regular particles have partial attachment due to the gravitational pull of attraction from the bottom contact points. However, uniform distribution of isotropic particles has been observed in comparison to the anisotropic particles within the polymer matrix.

1. Introduction

Materials whose rheological properties can vary by the application of external stimulus belong to the class of smart materials [1]. Smart materials can respond rapidly and reversibly to changes in the surrounding environment. Magnetorheological elastomers (MRE) falls in the category of this branch, which is composed of filler particles within the elastomer matrix [2]. This material not only displays viscoelastic properties but also undergoes deformation during the transition process. The distribution, size and shape of the filler particles and the state of the interface between the particles and matrix affect the macroscopic behavior of the composite materials [3,4]. The composite filled with particles are typically exhibiting the Payne effect at small deformation and the Mullins effect at high deformation [5,6]. Moreover, debonding acts as a distinct failure phenomenon at critical stress levels due to polymer containing rigid inclusion. Therefore, particle–matrix interface is one of the key factors to investigate in the polymer composite.
The presence of an anisotropic particle in the fluid creates unsteady flows. The unsteadiness behind such a body consists of unordered eddies of all sizes that create drag on the body. In contrast, the turbulence in the thin boundary layers next to the isotropic or anisotropic body of filler creates only weak disturbances of flow [7,8]. It is important to predict the particle movement and speed within the volume of the matrix to study the effect of isotropic and anisotropic particle movements within the incompressible flow of a fluid. A key factor to understanding the nature of the flow is the Reynolds number, for values of which between 10 and 100 the flow are considered steady. The viscous forces of the fluid are proportional to the gradient of the velocity. The drag and lift forces are not of interest, as the dimensionless drag and lift coefficients. These depend only on the Reynolds number and by the object’s shape and not by its size [9,10]. The coefficients of drag (CD) and lift (CL) are defined as below:
C D = 2 F D ρ U m e a n 2 A
C L = 2 F L ρ U m e a n 2 A
where FD and FL are the drag and lift forces, ρ is the fluid’s density and Umean is the mean velocity. A is the projected area within the fluid.
As the size of the particles is not considered influential, the shapes’ variety, regular and/or irregular, has a significant effect with relation to particle Reynolds numbers (Rep). The trajectory averaged drag forces were discussed for both the Stokes regime (Rep ≪ 1) and Newton regime (Rep ≫ 1) with keeping constant drag coefficient [11,12]. The newton regime depends on the aspect ratio for spherical particles, such as surface area ratio for regular shape particles and min-med-max area for irregularly shaped particles. The particles with near-unity aspect ratios show a higher dependency on Reynold’s number; however, particles with non-circular cross-section exhibit weaker dependence on Reynolds number, which is attributed to the more rapid transition to flow separation and turbulent boundary layer conditions [13,14,15].

1.1. Movement of Spherical Particles within the Polymer Matrix

The drag force arises from pressure and viscous stresses applied to the particle surface and resists the relative velocity W. Assuming the flow is steady and uniform away from the particle, . U m e a n = 0 , the magnitude of drag is primarily represented by the particle Reynolds number (Rep), defined as: [16]
R e p = ρ f | W | d μ f
where d is the particle diameter, ρ f is the continuous-phase density and μ f is the continuous-phase viscosity. The drag force for a sphere is represented by: [17]
F D = 3 π d μ f W ,   for   R e p     1  
On increasing particle Reynolds numbers, the flow changes to laminar for Rep < 22, more towards unsteady Rep < 1000, and then towards turbulent. At higher Reynolds numbers for 2000 < Rep < 300,000, the boundary layer at the front of the particle becomes laminar with θ = 0° separate towards θ ~ 80°, creating a fully turbulent wake behind the particle. The drag coefficient CD as the function of drag force is: [18]
F D = π 8 d 2 C D ρ f w W
Based on Equations (4) and (5), drag coefficients for regular isotropic particles at various Reynolds numbers for incompressible flow conditions are reported in Figure 1. The Reynold’s number in the range of 2000 < Rep < 300,000 indicated that CD is approximately constant. The approximately constant CD value is called the critical drag coefficient, assuming values of about 0.4 to 0.45. This range often falls in the “Newton regime “on considering constant drag coefficient for ballistics. The drag force could be normalizing by the creeping flow solution to obtain stokes correction: [19,20]
f R e = F D ( R e p ) F D ( R e p 0 ) = C D ( R e p ) 24 / R e p
The ratio is unity for Rep ≪ 1 and it is proportional to Rep for the Newton regime (ca. 3000 < Rep < 200,000). There is no general analytical solution for intermediate Reynolds numbers; as a result, these conditions are prescribed by an empirical expression of the drag coefficient. An approximate expression is proposed for the subcritical regime [3] as below:
f R e = [ 1 + 0.4 R e p 24 ] 2   for   R e p   <   2   ×   10 5
A closer approximation for the sub-critical expression [4], falling within the experiments of Figure 1, is expressed as below: [21]
C D = [ 24 R e p ( 1 + 0.15 R e p 0.687 ) ] + 0.42 1 + 42 , 500 R e p 1.16   for   R e p   <   2   ×   10 5
The term represented in the square brackets is known as the Schiller–Naumann [5] drag coefficient for moderate Reynolds number. This can be written in terms of the Stokes correction as: [22]
f R e = 1 + 0.15 R e p 0.687 ,   for   R e p   <   800  

1.2. Movement of Non-Spherical Particles within Polymer Composite

The anisotropic particles are generally considered to be ellipsoid form with the following aspect ratio:
E = d I I d
where d I I   and   d   are the parallel and normal diameters, corresponding to the semi-minor and semi-major axis lengths respectively. The ellipsoid’s volume is proportional to the diameters of the three major axes, so the effective diameter is given by:
d = d E 1 / 3 = d I I E 2 / 3
E = 1, it reverts the geometry to a sphere.
Regular-shaped particles generally include simple cross-sections, which are made up of connecting orthogonal rectangles, which are traced back to crystallization. In contrast, irregular-shaped particles are from random coagulation or also generated from the fragmentation of bigger particles [23,24,25].
The drag of irregular particles generally depends on the degree of non-sphericity as well as their orientation to the flow. The Stokes correction for non-spherical particle ratio could be defined as:
f E = F D ( E , R e p 0 ) 3 π d μ f w
Thus, fE approaches unity as E approaches unity. The variations in E from 0.01 to 100 result in moderate changes in the overall drag correction. This arises because increases in friction drag for longer bodies are approximately balanced by decreases in pressure drag, while the reverse is true for shorter bodies [26,27]. Drag force for particles whose aspect ratio is unity can often be reasonably estimated by simply using Stokesian drag and the volume-based diameter. If the initial orientation is parallel or perpendicular to the relative velocity, no torque exists since the drag acts in opposite direction to the gravitational force. If the initial orientation is neither parallel nor perpendicular, the net drag force may be obtained based on a simple combination of the individual components,
F D = 3 π μ f ( w I I f E I I + w f E )   for   R e p     1  
where w I I and w are the components of relative velocity, which are parallel and perpendicular to the particles axis of symmetry. If both velocity components are non-zero, drag force is not parallel to w so that particles will have an angle with respect to g. If the particles have three axis of direction, becomes orthotropic in nature, the drag force generates from combination of all the components is: [28]
F D = 3 π μ f ( w 1 f E 1 + w 2 f E 2 + w 3 f E 3 ) ,   for   R e p     1
In Brownian motion, all orientations are assumed equally possible since molecular interaction is random. By integrating all factors for average force, the drag one could be represented by:
3 f E = 1 f E 1 + 1 f E 2 + 1 f E 3   for   R e p     1  
The drag coefficients for irregular particles are shown in Figure 2. In addition to the orientation of the filler particles, the minor effect of roughness and turbulence affects significantly on particles boundary layer to convert into turbulence flow than a steady flow. As a result, a drag crisis occurs at lower Reynolds numbers in the presence of turbulence, due to the effect of particles roughness [29,30]. The drag coefficient for regular and irregular shapes is based on the Reynolds numbers. The aspect ratio plays a crucial role in determining the shape of the particles; thus, the surface area ratio is the optimum for regular particles, whilst max-med-min ratio is considered for irregular particles [31,32]. Adhesion is defined as the strength of a bond uniting two different components often made of two different materials. Adhesion forces are divided into three kinds such as (a) mechanical forces (b) secondary, van der Waals forces (cause physical adsorption) and primary valence forces (chemical bonding such as ionic, covalent, metallic). Table 1 represents various adhesive forces.
Total adhesion is the result of a summation of contributions from the various types of interaction, thus:
W A = W d + W x + W i + W a b + W h
where adhesive force = dispersion forces + dipole/dipole interactions + induced/dipole interactions + acid/base interactions + hydrogen bonding [33].
In the perspective of developing a good tactile interface, this work investigates the interfacial adhesion between filler particles and the polymer matrix. The distribution of the filler particles within the polymer matrix is considered here worthy of study. Therefore, different fillers of graphite with lower density, irregular shape, and regular carbonyl iron particles with higher density are considered here for incorporation in the polymer matrix. These samples are compared under scanning electron microscope for microscopical observation. The main purpose of this work is to investigate the effect of the shape of the filler particles movement inside the polymer matrix. The interfacial adhesion of filler particles within polymer matrix has been investigated using both simulation and experimental analysis. The role of drag and lift forces act on the particles with contrary to gravitational forces that could act as internal forces for particle attachment within the matrix of the polymer. The particle–matrix and particle–particle interactions of filler particles within the polymer matrix have been observed from the theoretical and experimental observations.

2. Materials and Methods

Here, graphite particles of irregular shape, oblate types are considering in the polymer matrix for the movement, distribution, agglomeration and interface adhesion within filler–matrix and filler–filler adhesion. To compare the interfacial adhesion, circular particles of Carbonyl Iron (CI), with spherical shape and medium sizes, are considered in the polymer matrix. The polymer matrix is prepared from silicone rubber (liquid) mixed with its binder catalyst in the weight ratio of 1:1. The fillers of volume fraction 30% were added into the matrix. The mixture was well blended in a container for 10 min and placed in a vacuum chamber for 15 min to eliminate the air bubbles. The mixture was transferred into mold and placed inside a vacuum chamber for next 10 min to stabilize the process. Finally, the composite was cured for 24 h at room temperature for a good dispersion of particles within the composite.
The volume fraction of 30 V% of particles is mixed with polymer matrix, using silicon oil (2 V%) as an additive to improve the particles dispersion within the polymer matrix. The simulation was carried out by means of COMSOL Multiphysics 5.3 Software (USA). The simulation was performed by using COMSOL software for fluid flow in single-phase model with laminar section in time-dependent mode. The input parameters are density; dynamic viscosity is considered for mean inflow velocity. The time-dependent solver use time-stepping mode to track particle movement within the polymer matrix.
The surface morphology of the samples was examined by SEM (Hitachi-model TM-3000, Hitachi High-Technologies Corporation, Tokyo, Japan), with a Secondary Electron Detector (Hitachi High-Technologies Corporation, Tokyo, Japan) and field emission source using 10 kV acceleration voltages. Sample fragments were mounted onto aluminum stubs and out-gassed in a desiccator over 48 h before being coated with a 4-nm layer of platinum prior to imaging in the SEM.
The SEM images of irregular particles, with the size of 10–150 μm, were plotted as a function of the volume fraction in Figure 3a,b. The morphology describes the filler particles of non-uniform shapes with the elliptical form and an aspect ratio of less than 1. However, the uniform spherical particles show the morphology of regular sizes with a particle aspect ratio of 1 and the particle sizes range from 1 to 5 μm. Figure 3c,d displays the morphology of the carbonyl iron filler particles and the cumulative distribution of the particle sizes as a function of their volumetric distribution [14,15]. The filler of non-isotropic and isotropic particles distribution shows the size of the particles as a function of volume fraction. The non-isotropic particles show the maximum range of distribution falling within 50–150 µm size range; however, the isotropic particles fell within the range of 1–5 µm. The polymer matrix of silicone rubber, an elastomer composed of silicon together with carbon, hydrogen, and oxygen, showed no porosity. The density of the silicone rubber was 1.20 g/cm3, offering such low viscosity high strength. The filler distribution within the composite was determined by the simple mixture rule such as follows:
ρ c = ρ f V f + ρ m V m
The elastomer of the matrix was ZA 22 (polyaddition matrix) with microstructural image that shows smooth surface with uniformity without any porosity.

3. Results

The movement of the filler particles within the polymer matrix was determined by the relative magnitude of the attractive and separating forces act between filler–filler interaction and filler–matrix adhesion. Adhesion forces depends upon the shape and size of the particle with regard to surface tension. The repulsive forces act on the filler particles depend on the viscosity and mixing forces leading to shear forces. Also, the additional gravitational forces act on the filler, thus leading towards the drag forces based on the density of the particles. The shape of filler particles plays a crucial role in the interfacial adhesion of filler–filler and filler–matrix attachment and interaction.

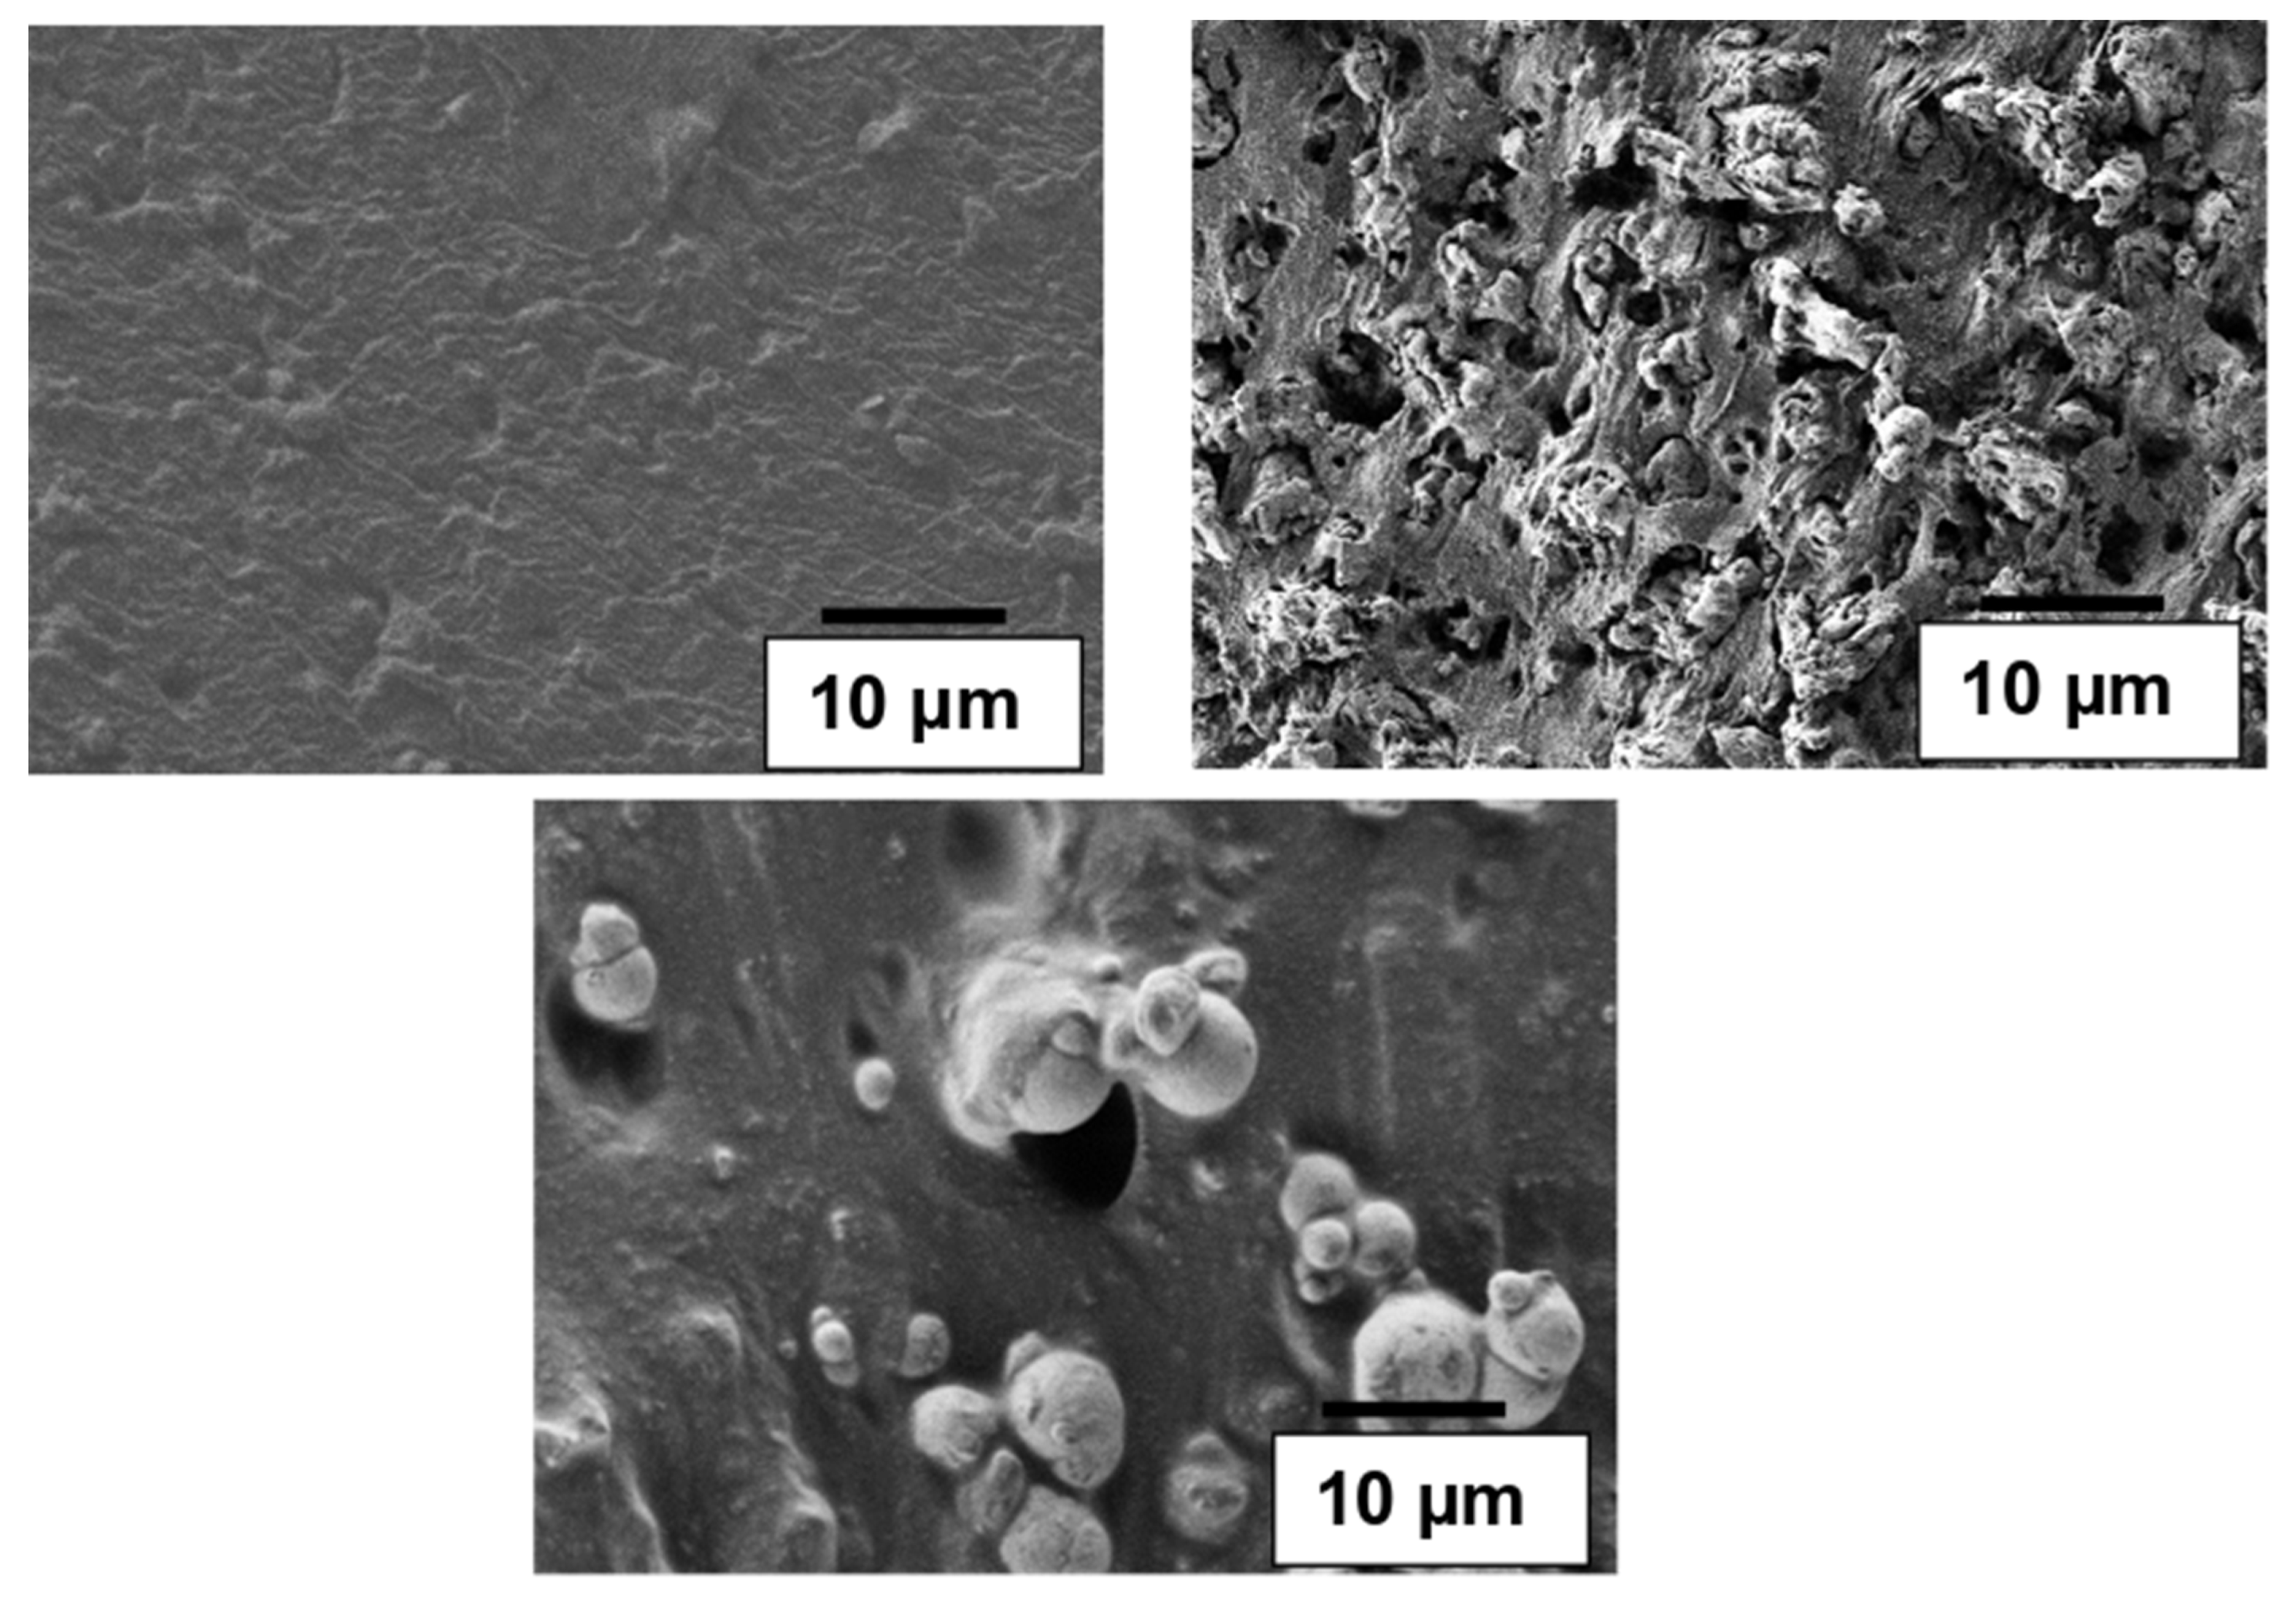
3.1. Surface Feature Analysis of the Filler within Polymer Matrix

Figure 4 shows interfacial adhesion of graphite filler within the polymer matrix. The graphite filler is irregular shape entangled within the matrix as an interlocking pattern. The irregular boundary region acts as a hook with the matrix, allowing channeling of the polymer within filler surroundings.
However, the addition of spherical particles of carbonyl iron of regular shapes within the polymer matrix shows well dispersion of the particles. The polymer matrix as it is, particles dispersion within the matrix and particles–polymer interfacial adhesion are shown in Figure 5.
Although the good dispersion of the spherical particles seems to avoid any agglomeration, some agglomerations are visible by investigating the zoom view of the particles within the matrix. On observing the interfacial adhesion, the spherical particle shows weak partial adhesion that may arise from the non-contact area of polymer matrix at the gravity pull of attraction. As a result, there is a weak adhesion of the filler at the bottom of the particle towards the matrix. In addition, the boundary surface of the spherical particle is smooth, resulting in a lack of interlocking pattern of the matrix into the filler surface [34].

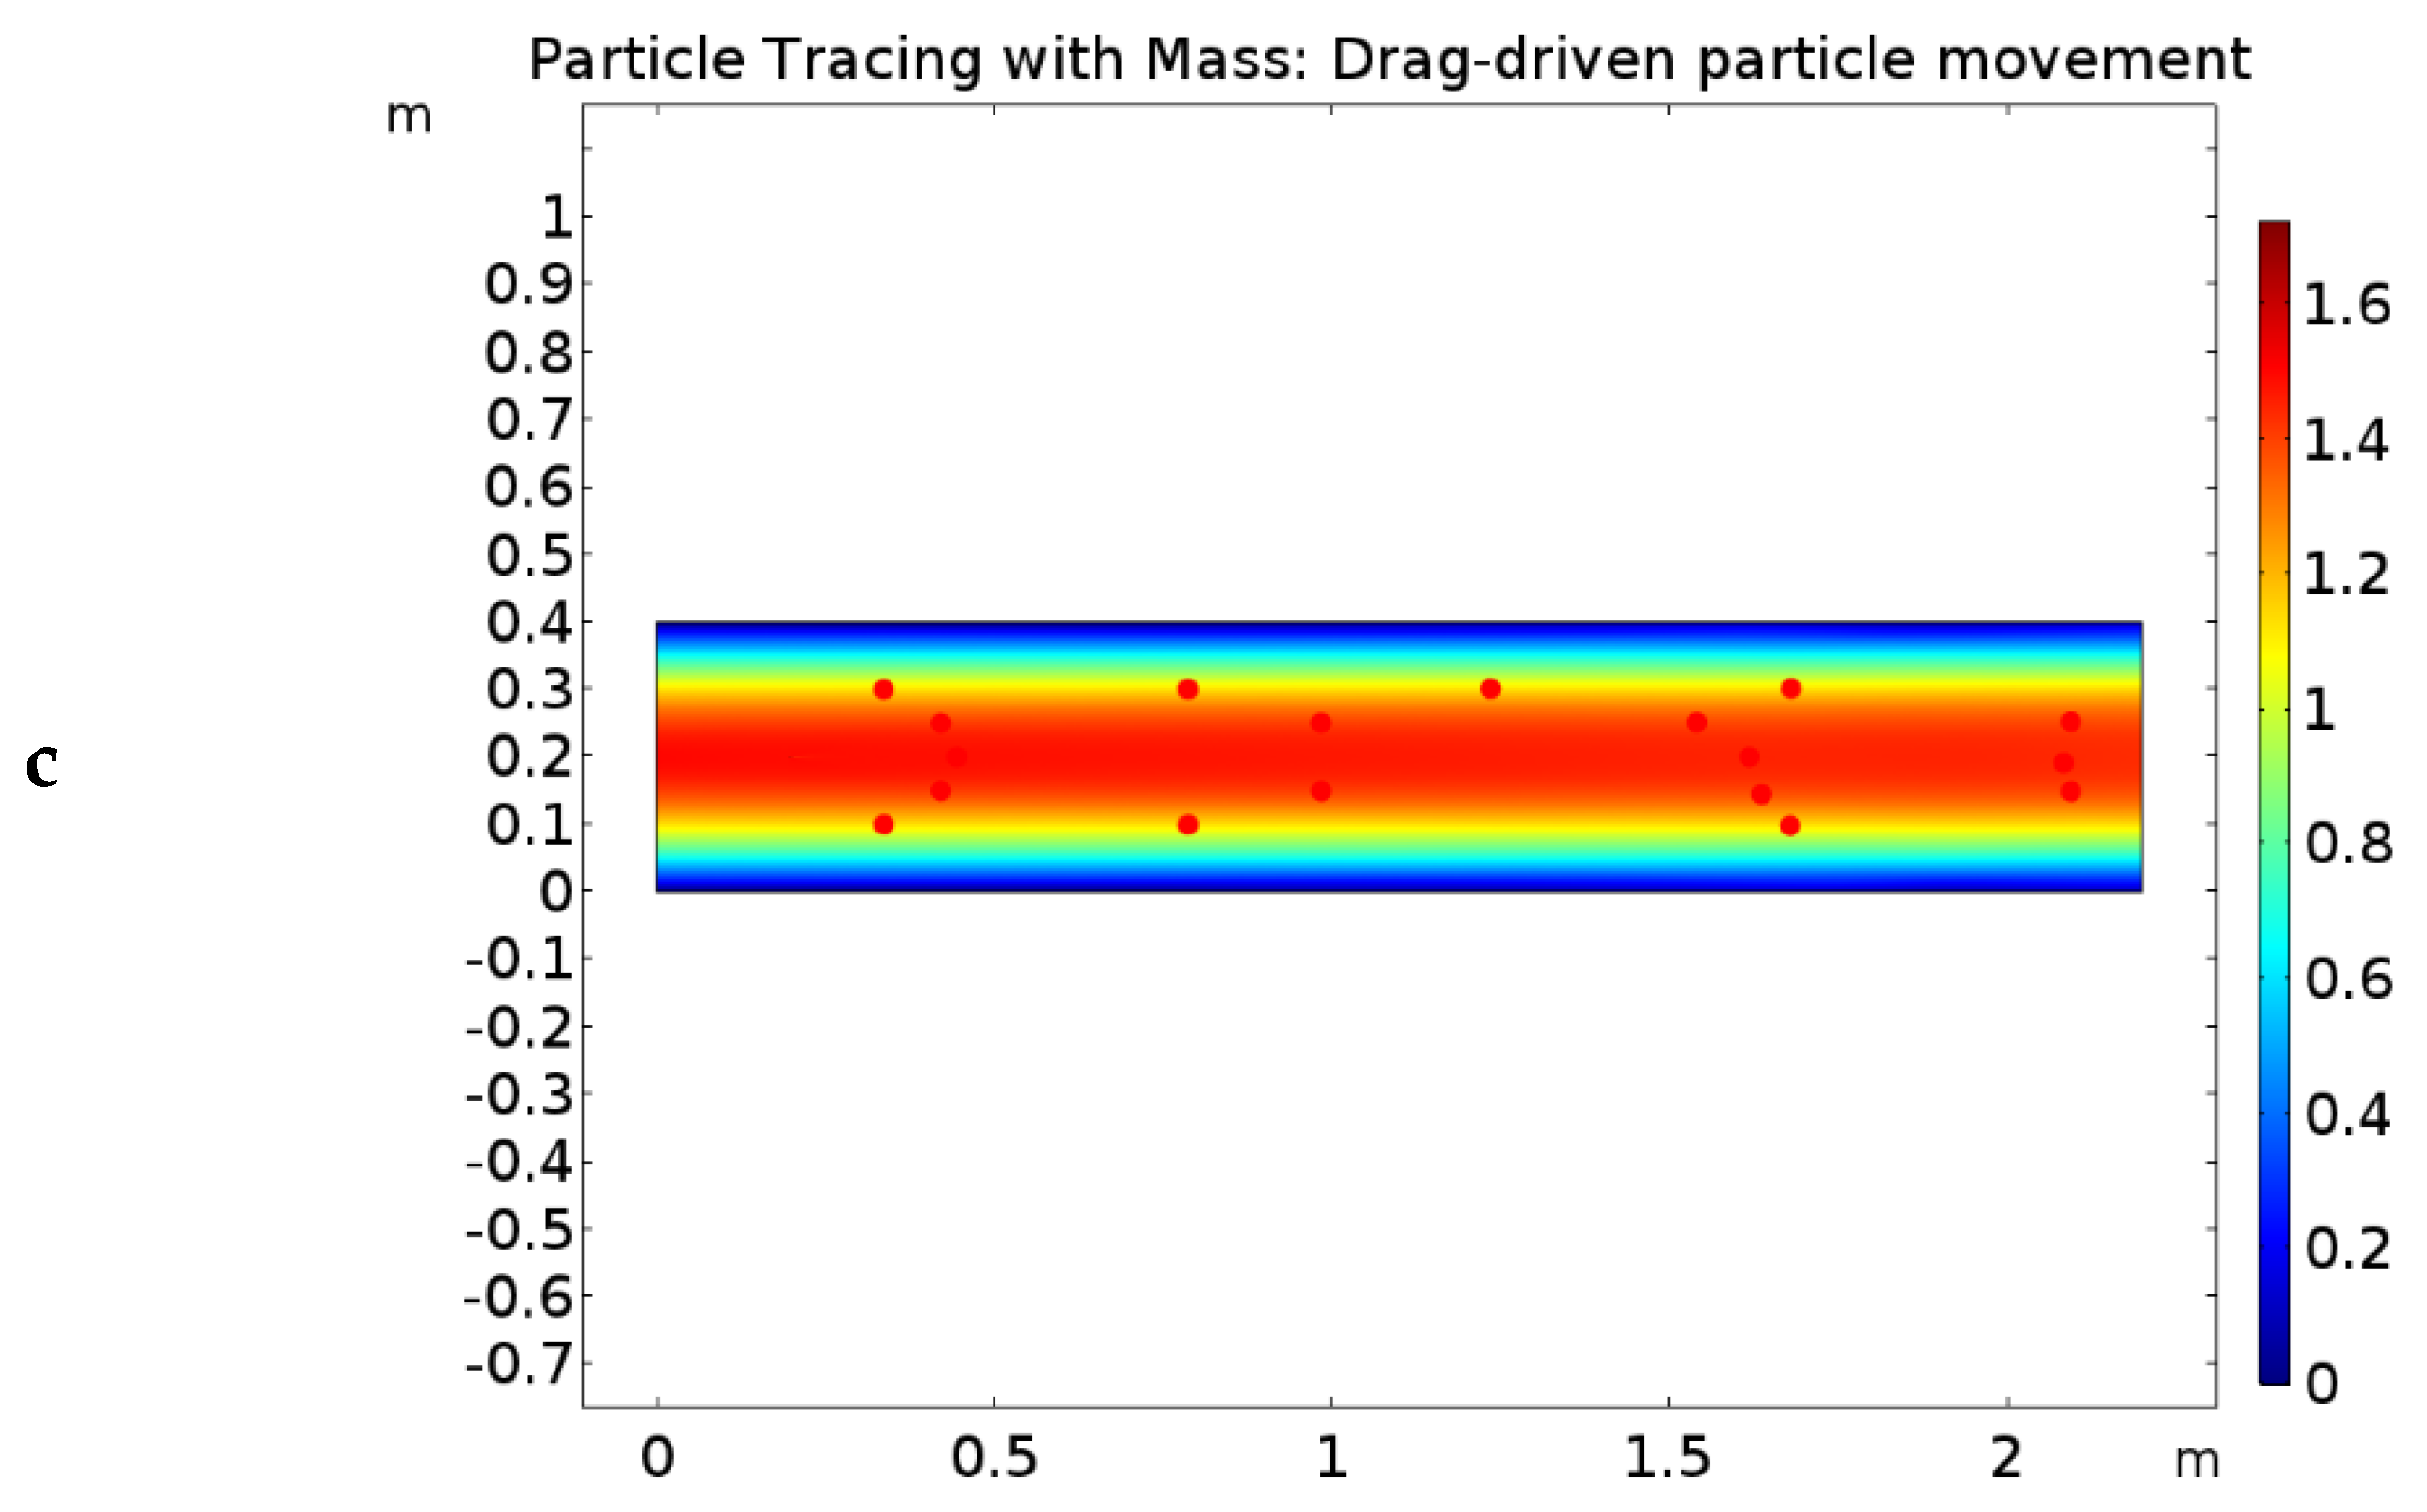
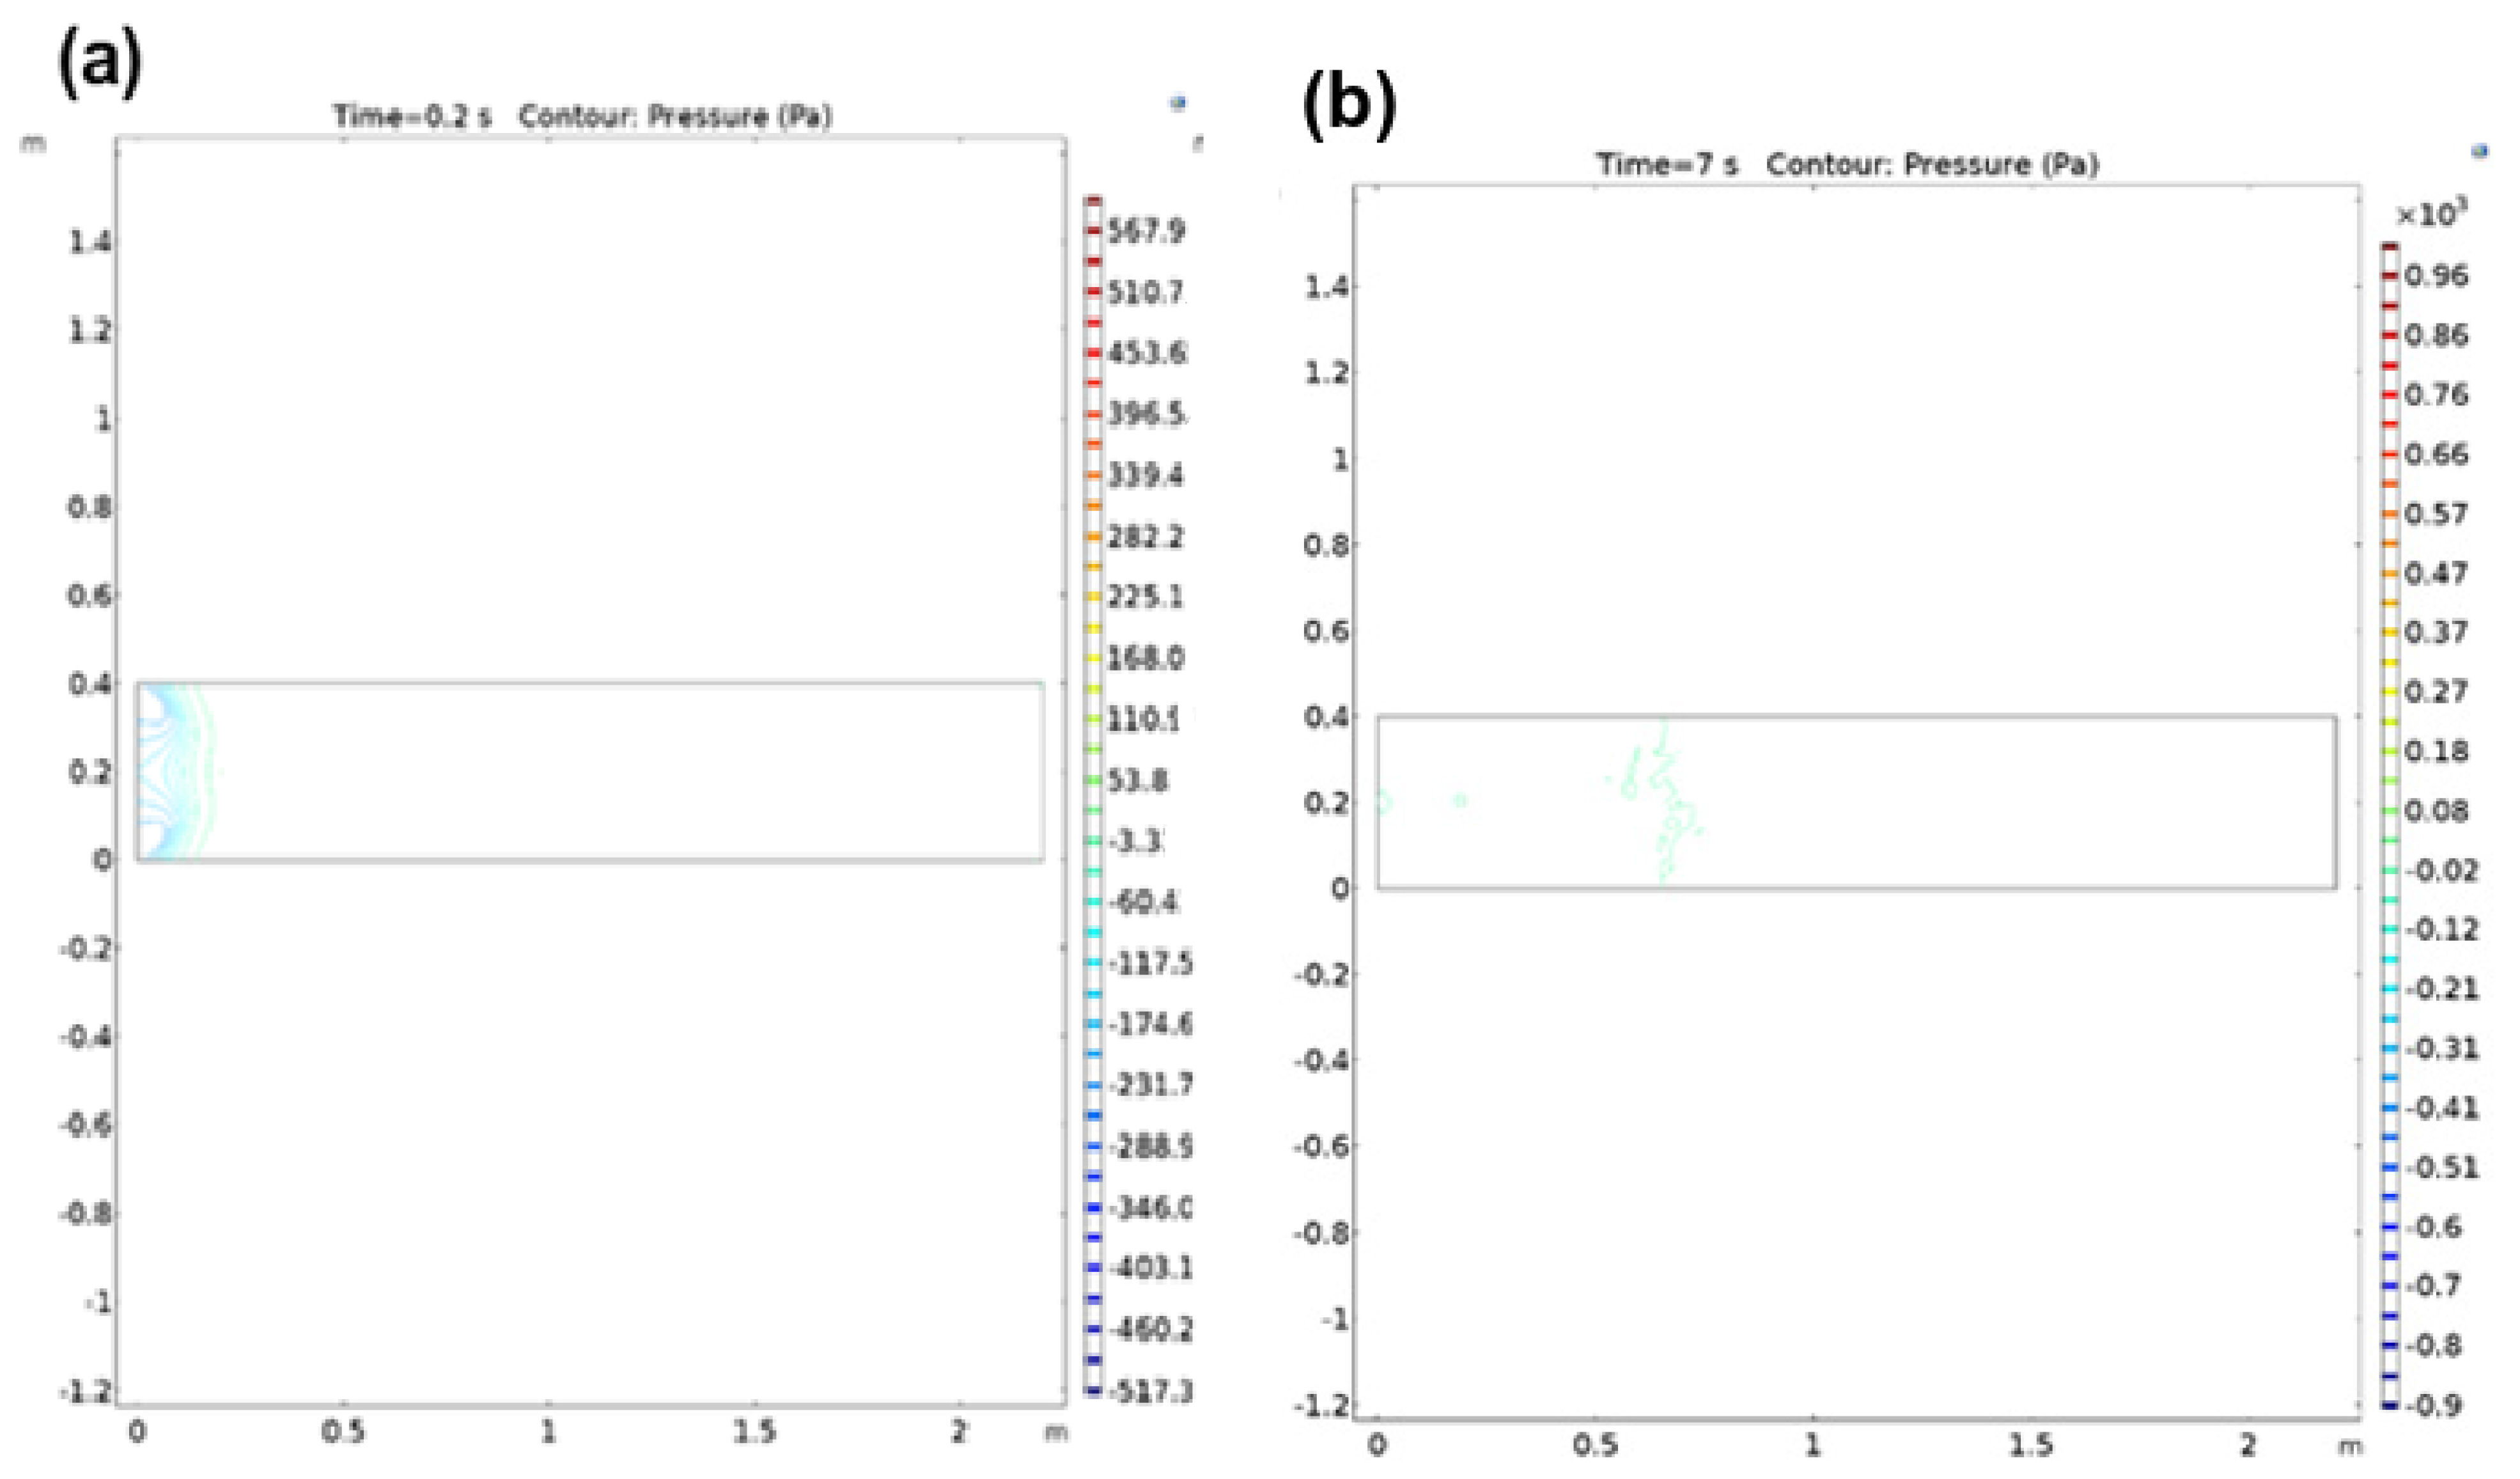
3.2. Simulation Studies on the Movement of Irregular and Regular Particles within Polymer Matrix

To interpret the particles’ adhesion and the influence of their shape in allowing the channeling of the polymer matrix, the movement of the particles within the matrix was studied. Figure 6 portrays the movement of anisotropic particles within the polymer, which was more vigorous, with strong adhesion within the matrix. The movement of particles with some turbulence effects as a function of the time is shown in Figure 6a–d. Considering times from 0.4 to 2 s, the surface, as a function of drag-driven particle movement, for the anisotropic one covers a larger area of the polymer. Simultaneously the adhesion is stronger as a function of the time. There are some negligible effects from turbulence within the matrix arises that may create some voids inside it [35]. The comparison of the contour pressure during filler particle movement within the polymer matrix as a function of the time, at lower and higher values, is shown in Figure 7a,b.
On considering the movement of regular particles within the polymer matrix, well dispersion of the particles within the volume of the polymer is detectable. As the shape of the particle is smooth and the boundary curves in nature, thus adhesion of polymer matrix is less intact. As a result, this leads to weaker adhesion of filler particles within the polymer matrix considering both drag and lift forces. In addition to these ones, gravitational forces act as counterparts and result in voids on the lower boundary of particles, which was confirmed by the images (Figure 8).
The contour pressure effect as a function of the time of the particle movement within the polymer is represented in Figure 9a,b. It is possible to observe that the movement is uniform, without any effect of turbulence.

4. Discussion

The non-isotropic and isotropic filler distribution within the polymer matrix is displayed in Figure 10a. The particle’s shape plays a crucial role in the filler distribution. Non-isotropic particles create eddies in the matrix, resulting in some porosity within the volume; however, filler adhesion with polymer resulted stronger. For the isotropic particle, uniform distribution of the filler within the polymer matrix was observed. The mechanism of the filler particle movement within the matrix is explained in terms of simulation and surface images. The adhesion of the filler particles is shown in Figure 11 and Figure 12. It is possible to observe the sedimentation of filler particles towards the bottom of the matrix that may arise from the gravitational pull of attraction. This results in the sedimentation of the larger particles towards the bottom of the polymer matrix. However, regular size particles show uniform distribution without any agglomeration that leads to sedimentation. Spherical shape particles are well dispersed [35,36], whilst irregularly shaped particles showed an interlocking mechanism of allowing the polymer to enter along the non-uniform edges of the boundary [37]. The boundary area acts as a hook for strong polymer–particle adhesion.
In the case of regular-shaped particles, the boundary is smooth, thus resulting in weaker adhesion within the matrix. Some voids towards the bottom of the particles were observed, which could be due to the gravitational force attraction [38]. Some particles have good wettability; however, interfacial adhesion of irregular particles has stronger adhesion than regular ones. The inter-particle bonding is stronger that result in agglomeration of the particles in irregularly shaped filler [39]. The irregular particles dispersed in the polymer matrix showed higher apparent viscosity than the case of nearly spherical filler suspension. The viscosity of irregular particles depends not only on the dispersing ability of the medium but also on itself viscosity [40]. Mechanical properties are associated with the resistance of a material to deformation under load. The mechanical properties of polymers are complex due to their viscoelastic nature, which is demonstrated by a strong dependence of the mechanical properties on time and temperature. The mechanical properties of polymers are dependent on many factors, including microstructure, chemical composition, residual stresses, reinforcing particles. In polymer composite reinforced with particles of graphite and carbonyl iron also influence the microstructure, hardness of the material. The influence of the dispersion state of the particles such as graphite and Carbonyl iron shows well dispersion and distribution in polymer composite. The polymer reinforced with graphite particles shows very softly in structures in compare to CI particles. The lower rigidity of the composite structure may lead to the lower density of the graphite particles (2.26 g/cm3). However, CI iron shows better response in mechanical properties that is proved by many researchers [23,24,25,26]. Improving the durability of composite material, an insight view need to develop into the influence of microstructure on the distribution of filler particles and its contribution towards mechanical properties [27,28,29,30,31].
The supplementary files (Video S1) displays the graphite and iron filler distribution in the polymer composite. The micro computed tomography investigates the filler distribution within volume of the composite. The inner volume of the composite shows the filler distribution in one by one frame with various planes of distribution. The quality of the composite displays the filler distribution and some voids in the interior areas.

5. Conclusions

A comprehensive study in numerical, simulation and experimental approaches of the shape of the filler particles in the dispersion within the polymer matrix was carried out, by examining the interfacial adhesion of irregular and regular particles within the polymer matrix and their respective movement in the dispersion medium. The movement of regular and irregular particles as the function of time shows the dispersion within the polymer matrix. The particle arrangement within the polymer matrix is examined from microstructural observation. The filler–matrix, filler–filler bonding is observed from the surface image. The irregular-shaped particle exhibits anchor type of attachment within the surrounding matrix. The adhesion is stronger; however, some agglomeration that may arise due to particle–particle interaction. The interfacial adhesion of irregular-shaped filler particles within polymer for irregular particles are stronger than regular-shaped particles. However uniform distribution of particles is observed in regular-shaped particles within polymer composite.

Supplementary Materials

Author Contributions

Conceptualization, S.S.; methodology, S.S.; formal analysis, S.S.; investigation, S.S.; data curation, S.S.; writing—original draft preparation, S.S.; writing—review and editing, I.B.; supervision, I.B. All authors have read and agreed to the published version of the manuscript.

Funding

This research was funded by project Solid-21 for the support within the Institute of Physics, Prague, Czech Republic (SOLID21: CZ.02.1.01/0.0/0.0/16_019/0000760, SOLID21-Fyzika pevných látek pro 21. Století, Fyzikální ústav AV ČR, v. v. i. (2018–2023) and by Operational Programme Research, Development and Education financed by European Structural and Investment Funds and the Czech Ministry of Education, Youth and Sports (Project No. SOLID21—CZ.02.1.01/0.0/0.0/16_019/0000760).

Institutional Review Board Statement

Not applicable.

Informed Consent Statement

Not applicable.

Data Availability Statement

Publicly available datasets were analyzed in this study. This data can be found in the cited references.

Conflicts of Interest

The authors declare no conflict of interest.

References

  1. Ahmed, S.; Jones, F.R. A review of particulate reinforcement theories for polymer composites. J. Mater. Sci. 1990, 25, 4933–4942. [Google Scholar] [CrossRef]
  2. Leblanc, J. Rubber–filler interactions and rheological properties in filled compounds. Prog. Polym. Sci. 2002, 27, 627–687. [Google Scholar] [CrossRef]
  3. Payne, A.R. The dynamic properties of carbon black loaded natural rubber vulcanizates. Part II. J. Appl. Polym. Sci. 1962, 6, 368–372. [Google Scholar] [CrossRef]
  4. Dorfmann, A.; Ogden, R. A constitutive model for the Mullins effect with permanent set in particle-reinforced rubber. Int. J. Solids Struct. 2004, 41, 1855–1878. [Google Scholar] [CrossRef]
  5. Diani, J.; Fayolle, B.; Gilormini, P. A review on the Mullins effect. Eur. Polym. J. 2009, 45, 601–612. [Google Scholar] [CrossRef] [Green Version]
  6. Gent, A.N.; Park, B. Failure processes in elastomers at or near a rigid spherical inclusion. J. Mater. Sci. 1984, 19, 1947–1956. [Google Scholar] [CrossRef]
  7. White, F.M. Fluid Mechanics; McGraw-Hill: New York, NY, USA, 1991. [Google Scholar]
  8. Loth, E. Drag of non-spherical solid particles of regular and irregular shape. Powder Technol. 2008, 182, 342–353. [Google Scholar] [CrossRef]
  9. Dallavalle, J.M. Micrometrics; Pitman Publishing: New York, NY, USA, 1948. [Google Scholar]
  10. Clift, R.; Gauvin, W.H. Proc. CHEMECA ’70; Butterworth: Melbourne, Australia, 1970; Volume 1, pp. 14–28. [Google Scholar]
  11. Schiller, L.; Naumann, A.Z. Über die grundlegenden Berechungen bei der Schwerkraftaufbereitung. Ver. Deut. Ing. 1933, 77, 318–320. [Google Scholar]
  12. Jayaweera, K.O.L.F.; Mason, B.J. The behavior of freely falling cylinders, and cones in viscous fluid. J. Fluid Mech. 1965, 22, 709–720. [Google Scholar] [CrossRef]
  13. Stringham, G.; Simons, D.; Guy, H. The behavior of large particles falling in quiescent liquids. Prof. Paper 1969, 562, 1–36. [Google Scholar] [CrossRef]
  14. Beard, K.V.; Pruppacher, H.R. A Determination of the Terminal Velocity and Drag of Small Water Drops by Means of a Wind Tunnel. J. Atmos. Sci. 1969, 26, 1066–1072. [Google Scholar] [CrossRef] [Green Version]
  15. List, R.; Schemenauer, R.S. Free-fall behavior of planar snow crystals, conical graupel and small hail. J. Atmos. Sci. 1971, 28, 110–115. [Google Scholar] [CrossRef] [Green Version]
  16. Samal, S. Effect of shape and size of filler particle on the aggregation and sedimentation behaviour of the polymer composite. Powder Technol. 2020, 366, 43–51. [Google Scholar] [CrossRef]
  17. Samal, S.; Škodová, M.; Blanco, I. Effects of Filler Distribution on Magnetorheological Silicon-Based Composites. Materials 2019, 12, 3017. [Google Scholar] [CrossRef] [Green Version]
  18. Samal, S.; Vlach, J.; Kolinova, M.; Kavan, P. Micro-Computed Tomography Characterization of Isotropic Filler Distribution in Magnetorheological Elastomeric Composites. In Advanced Processing and Manufacturing Technologies for Nanostructured and Multifunctional Materials; Ohji, T., Singh, M., Halbig, M., Moon, K., Eds.; Wiley: Hoboken, NJ, USA, 2017; pp. 57–69. [Google Scholar]
  19. Samal, S.; Vlach, J.; Kavan, P. Improved mechanical properties of magneto rheological elastomeric composite with isotropic iron filler distribution. Ciênc. Tecnol. Mater. 2016, 28, 155–161. [Google Scholar] [CrossRef]
  20. Samal, S.; Kolinova, M.; Blanco, I. The Magneto-Mechanical Behavior of Active Components in Iron-Elastomer Composite. J. Compos. Sci. 2018, 2, 54. [Google Scholar] [CrossRef] [Green Version]
  21. Samal, S.; Kim, S.; Kim, H. Effects of Filler Size and Distribution on Viscous Behavior of Glass Composites. J. Am. Ceram. Soc. 2012, 95, 1595–1603. [Google Scholar] [CrossRef]
  22. Samal, S.; Škodová, M.; Abate, L.; Blanco, I. Magneto-Rheological Elastomer Composites. A Review. Appl. Sci. 2020, 10, 4899. [Google Scholar] [CrossRef]
  23. Schmidt, M.; Munstedt, H. Rheological behavior of concentrated mono-disperse suspensions as a function of preshear conditions and temperature: An experimental study. Rheol. Acta 2002, 41, 193–204. [Google Scholar] [CrossRef]
  24. Smith, P.O.; Ven, T.G.M.V.D. Shear-induced deformation and rupture of suspended solid/liquid clusters. Colloid Surf. 1985, 15, 131–211. [Google Scholar] [CrossRef]
  25. Usui, H. Rheological Model for Agglomerative Slurry of Mono-modal Silica Particles. Kagaku Kogaku Ronbunshu 1999, 25, 459–465. [Google Scholar] [CrossRef] [Green Version]
  26. Usui, H.; Kishimoto, K.; Suzuki, H. Non-Newtonian viscosity of dense slurries prepared by spherical particles. Chem. Eng. Sci. 2001, 56, 2979–2989. [Google Scholar] [CrossRef]
  27. Usui, H.; Li, L.; Kinoshita, S.; Suzuki, H. Viscosity Prediction of Dense Slurries Prepared by Non-Spherical Solid Particles. J. Chem. Eng. Jpn 2001, 34, 360–368. [Google Scholar] [CrossRef]
  28. Fu, S.-Y.; Feng, X.-Q.; Lauke, B.; Mai, Y.-W. Effects of particle size, particle/matrix interface adhesion and particle loading on mechanical properties of particulate–polymer composites. Compos. Part B Eng. 2008, 39, 933–961. [Google Scholar] [CrossRef]
  29. Jung, H.S.; Kwon, S.H.; Choi, H.J.; Jung, J.H.; Gil Kim, Y. Magnetic carbonyl iron/natural rubber composite elastomer and its magnetorheology. Compos. Struct. 2016, 136, 106–112. [Google Scholar] [CrossRef]
  30. Dargahi, A.; Sedaghati, R.; Rakheja, S. On the properties of magnetorheological elastomers in shear mode: Design, fabrication and characterization. Compos. Part B Eng. 2019, 159, 269–283. [Google Scholar] [CrossRef]
  31. Lokander, M.; Stenberg, B. Performance of isotropic magnetorheological rubber materials. Polym. Test. 2003, 22, 245–251. [Google Scholar] [CrossRef] [Green Version]
  32. Boczkowska, A.; Awietjan, S.F.; Pietrzko, S.; Kurzydłowski, K.J. Mechanical properties of magnetorheological elastomers under shear deformation. Compos. Part B Eng. 2012, 43, 636–640. [Google Scholar] [CrossRef]
  33. Allen, K.W. Current theories of adhesion and their relevance to adhesive technology. J. Phys. Colloq. 1993, 3, C7-1511–C7-1516. [Google Scholar] [CrossRef]
  34. Kumar, V.; Lee, D.-J. Iron particle and anisotropic effects on mechanical properties of magneto-sensitive elastomers. J. Magn. Magn. Mater. 2017, 441, 105–112. [Google Scholar] [CrossRef]
  35. Hapipi, N.M.; Mazlan, S.A.; Khairi, M.H.A.; Mohamad, N. The Damping Properties of Plate-Like Magnetorheological Elastomer. Key Eng. Mater. 2018, 772, 56–60. [Google Scholar] [CrossRef]
  36. Jolly, M.R.; Carlson, J.D.; Muñoz, B.C.; Bullions, T.A. The magnetoviscoelastic response of elastomer composites consisting of ferrous particles embedded in a polymer matrix. J. Intell. Mater. Syst. Struct. 1996, 7, 613–622. [Google Scholar] [CrossRef]
  37. Upadhyay, R.V.; Laherisheth, Z.; Shah, K. Rheological properties of soft magnetic flake shaped iron particle based magnetorheological fluid in dynamic mode. Smart Mater. Struct. 2014, 23, 015002. [Google Scholar] [CrossRef]
  38. Shilan, S.T.; Mazlan, S.A.; Ido, Y.; Hajalilou, A.; Jeyadevan, B.; Choi, S.-B.; Yunus, N.A. A comparison of field-dependent rheological properties between spherical and plate-like carbonyl iron particles-based magneto-rheological fluids. Smart Mater. Struct. 2016, 25, 095025. [Google Scholar] [CrossRef]
  39. Laherisheth, Z.; Upadhyay, R.V. Influence of particle shape on the magnetic and steady shear magnetorheological properties of nanoparticle based MR fluids. Smart Mater. Struct. 2017, 26, 054008. [Google Scholar] [CrossRef]
  40. Shah, K.; Phu, D.X.; Seong, M.-S.; Upadhyay, R.; Choi, S.-B. A low sedimentation magnetorheological fluid based on plate-like iron particles, and verification using a damper test. Smart Mater. Struct. 2014, 23, 027001. [Google Scholar] [CrossRef]
Figure 1. Drag coefficient for a smooth solid sphere at various Reynolds numbers for incompressible Figure 1. Reprinted from [8] with permission from Elsevier.
Applsci 11 08561 g001
Figure 2. Normalized drag relationships for various forms of precipitation shapes based on data reported in various theories and fits [1]. Reprinted from [8] with permission from Elsevier.
Applsci 11 08561 g002
Figure 3. (a,b) SEM image of the graphite filler and its volume distribution of graphite particle size (20–150 μm) (c,d) SEM image of the carbonyl iron filler and its volume distribution of particle size (1–5 μm).
Applsci 11 08561 g003
Figure 4. Graphite filler reinforced in polymer matrix shown in (a) BSE; and (b) SE mode; (c) zoom view of enlarged particle shows interfacial adhesion within a polymer matrix; (d) another location shows agglomeration of particles with contact surface in polymer matrix.
Applsci 11 08561 g004
Figure 5. Regular carbonyl iron particle within elastomer matrix: (top right) elastomer polymer; (top left) Particles within the polymer; (down) zoom view of the adhesion of the particles within polymer.
Applsci 11 08561 g005
Figure 6. Anisotropic particle movement within polymer leads to some turbulence as a function of the time. (a) Time = 0.4; (b) Time = 0.6; (c) Time 1; (d) Time = 2.
Applsci 11 08561 g006
Figure 7. Scheme of the contour pressure at (a) lower and (b) higher time range.
Applsci 11 08561 g007
Figure 8. Regular particles movement within the polymer matrix as a function of time (ac) for surface: velocity of particle tracing.
Applsci 11 08561 g008aApplsci 11 08561 g008b
Figure 9. Scheme of the contour pressure (a) at lower and (b) higher time range for isotropic particle distribution in the polymer matrix.
Applsci 11 08561 g009
Figure 10. Non-isotropic (Top) and isotropic (Down) filler distribution in polymer composite.
Applsci 11 08561 g010aApplsci 11 08561 g010b
Figure 11. Anisotropic particle distribution within the matrix of the sample. The matrix shows the turbulence with voids. However, the particles show better attachment within the matrix.
Applsci 11 08561 g011
Figure 12. Isotropic filler distribution shows uniform movement within polymer composite, zoom view shows particle adhesion with voids towards the gravitational depth.
Applsci 11 08561 g012
Table 1. Types of various forces on adhesive bonds.
Bond TypeEquilibrium Length (Å)Energy KJ/MoleDirectionMaterial Category
Mechanical Forces10−6–10−10-noPaper, cloth, leather or wood
Secondary, van der Waals
Debye induction2–4~20YesLiquid and solid surface
London dispersion4–8~40No
Hydrogen bonds~3~60Yes
Primary Forces
Ionic2–4600–1200NoAdhesive and substrate
Covalent0.8–360–800Yes
Metallic2–6100–350No
Publisher’s Note: MDPI stays neutral with regard to jurisdictional claims in published maps and institutional affiliations.

