
Influence of Roll Diameter on Material Deformation and Properties during Wire Flat Rolling


Abstract
:1. Introduction
2. FE Analysis and Model Validation
2.1. FE Analysis and Boundary Conditions
2.2. Experimental Procedures
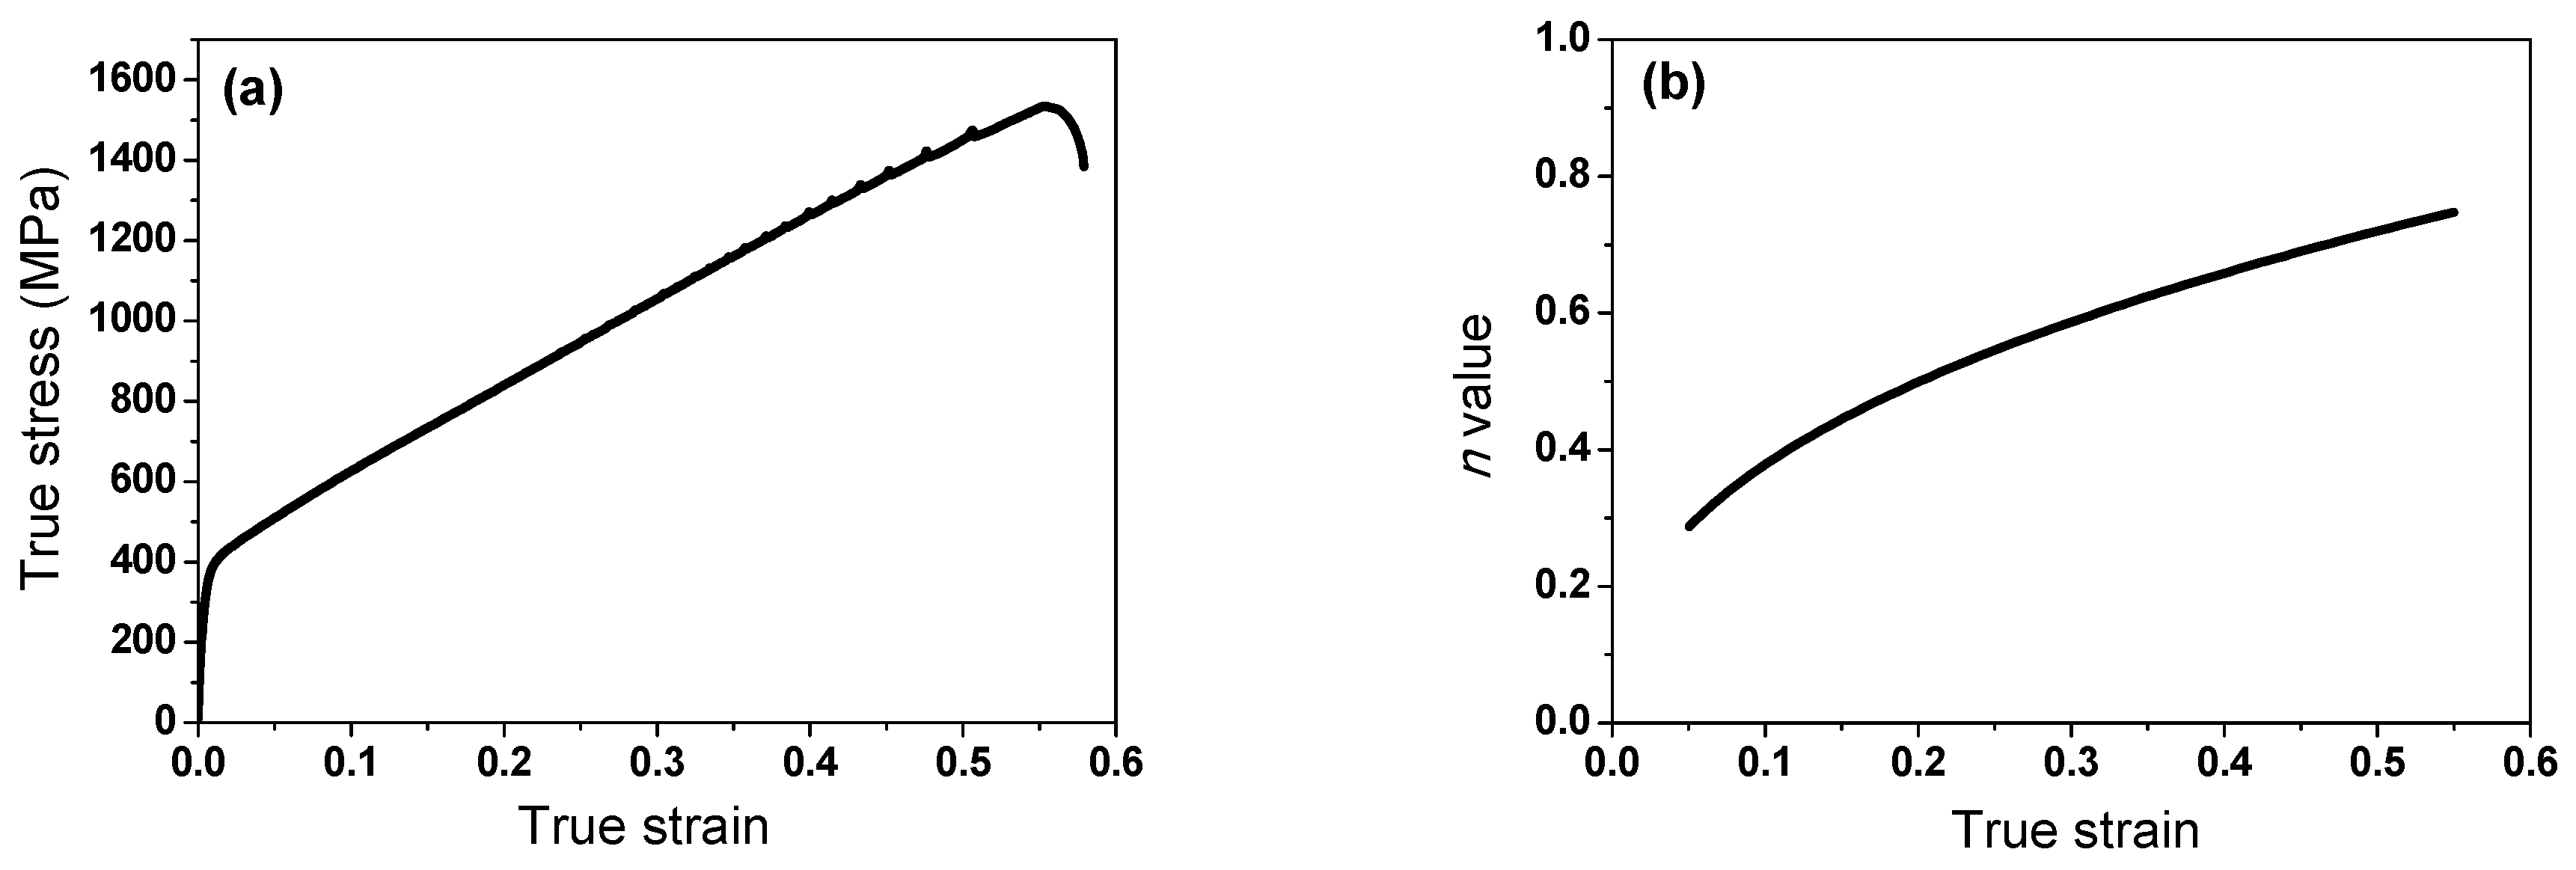
2.3. Flow Stress Model
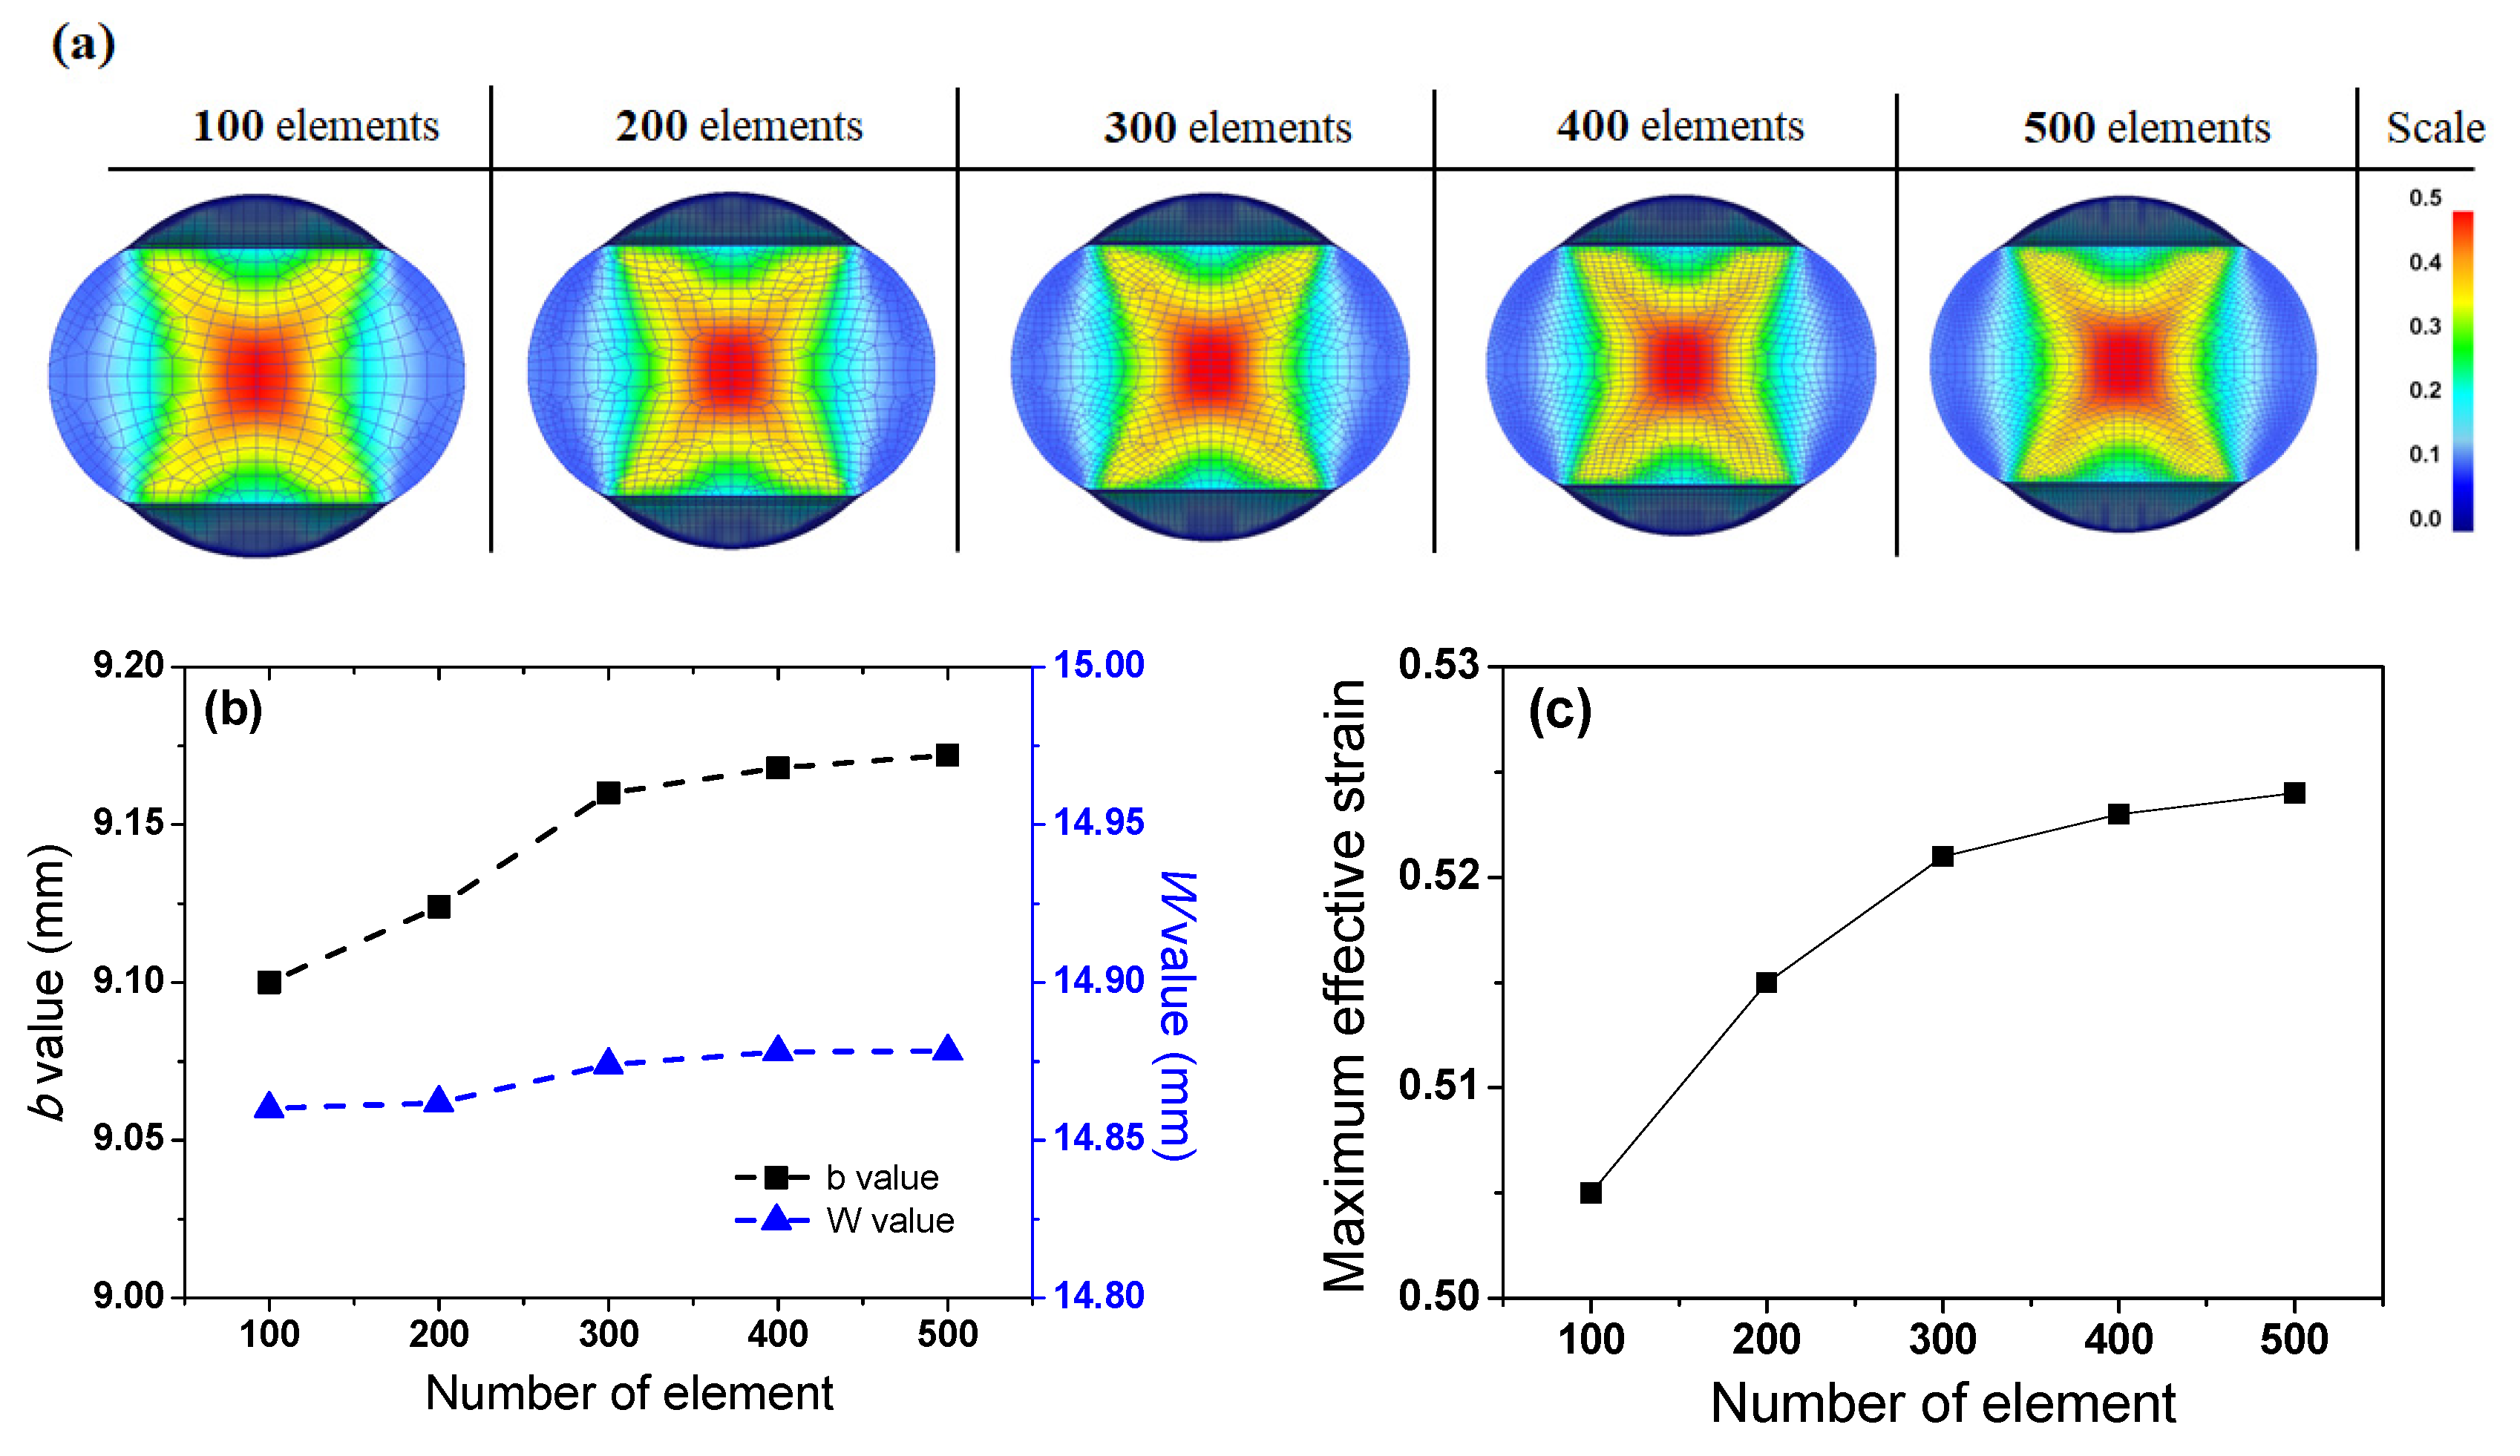
2.4. Convergence Analysis of FE Mesh
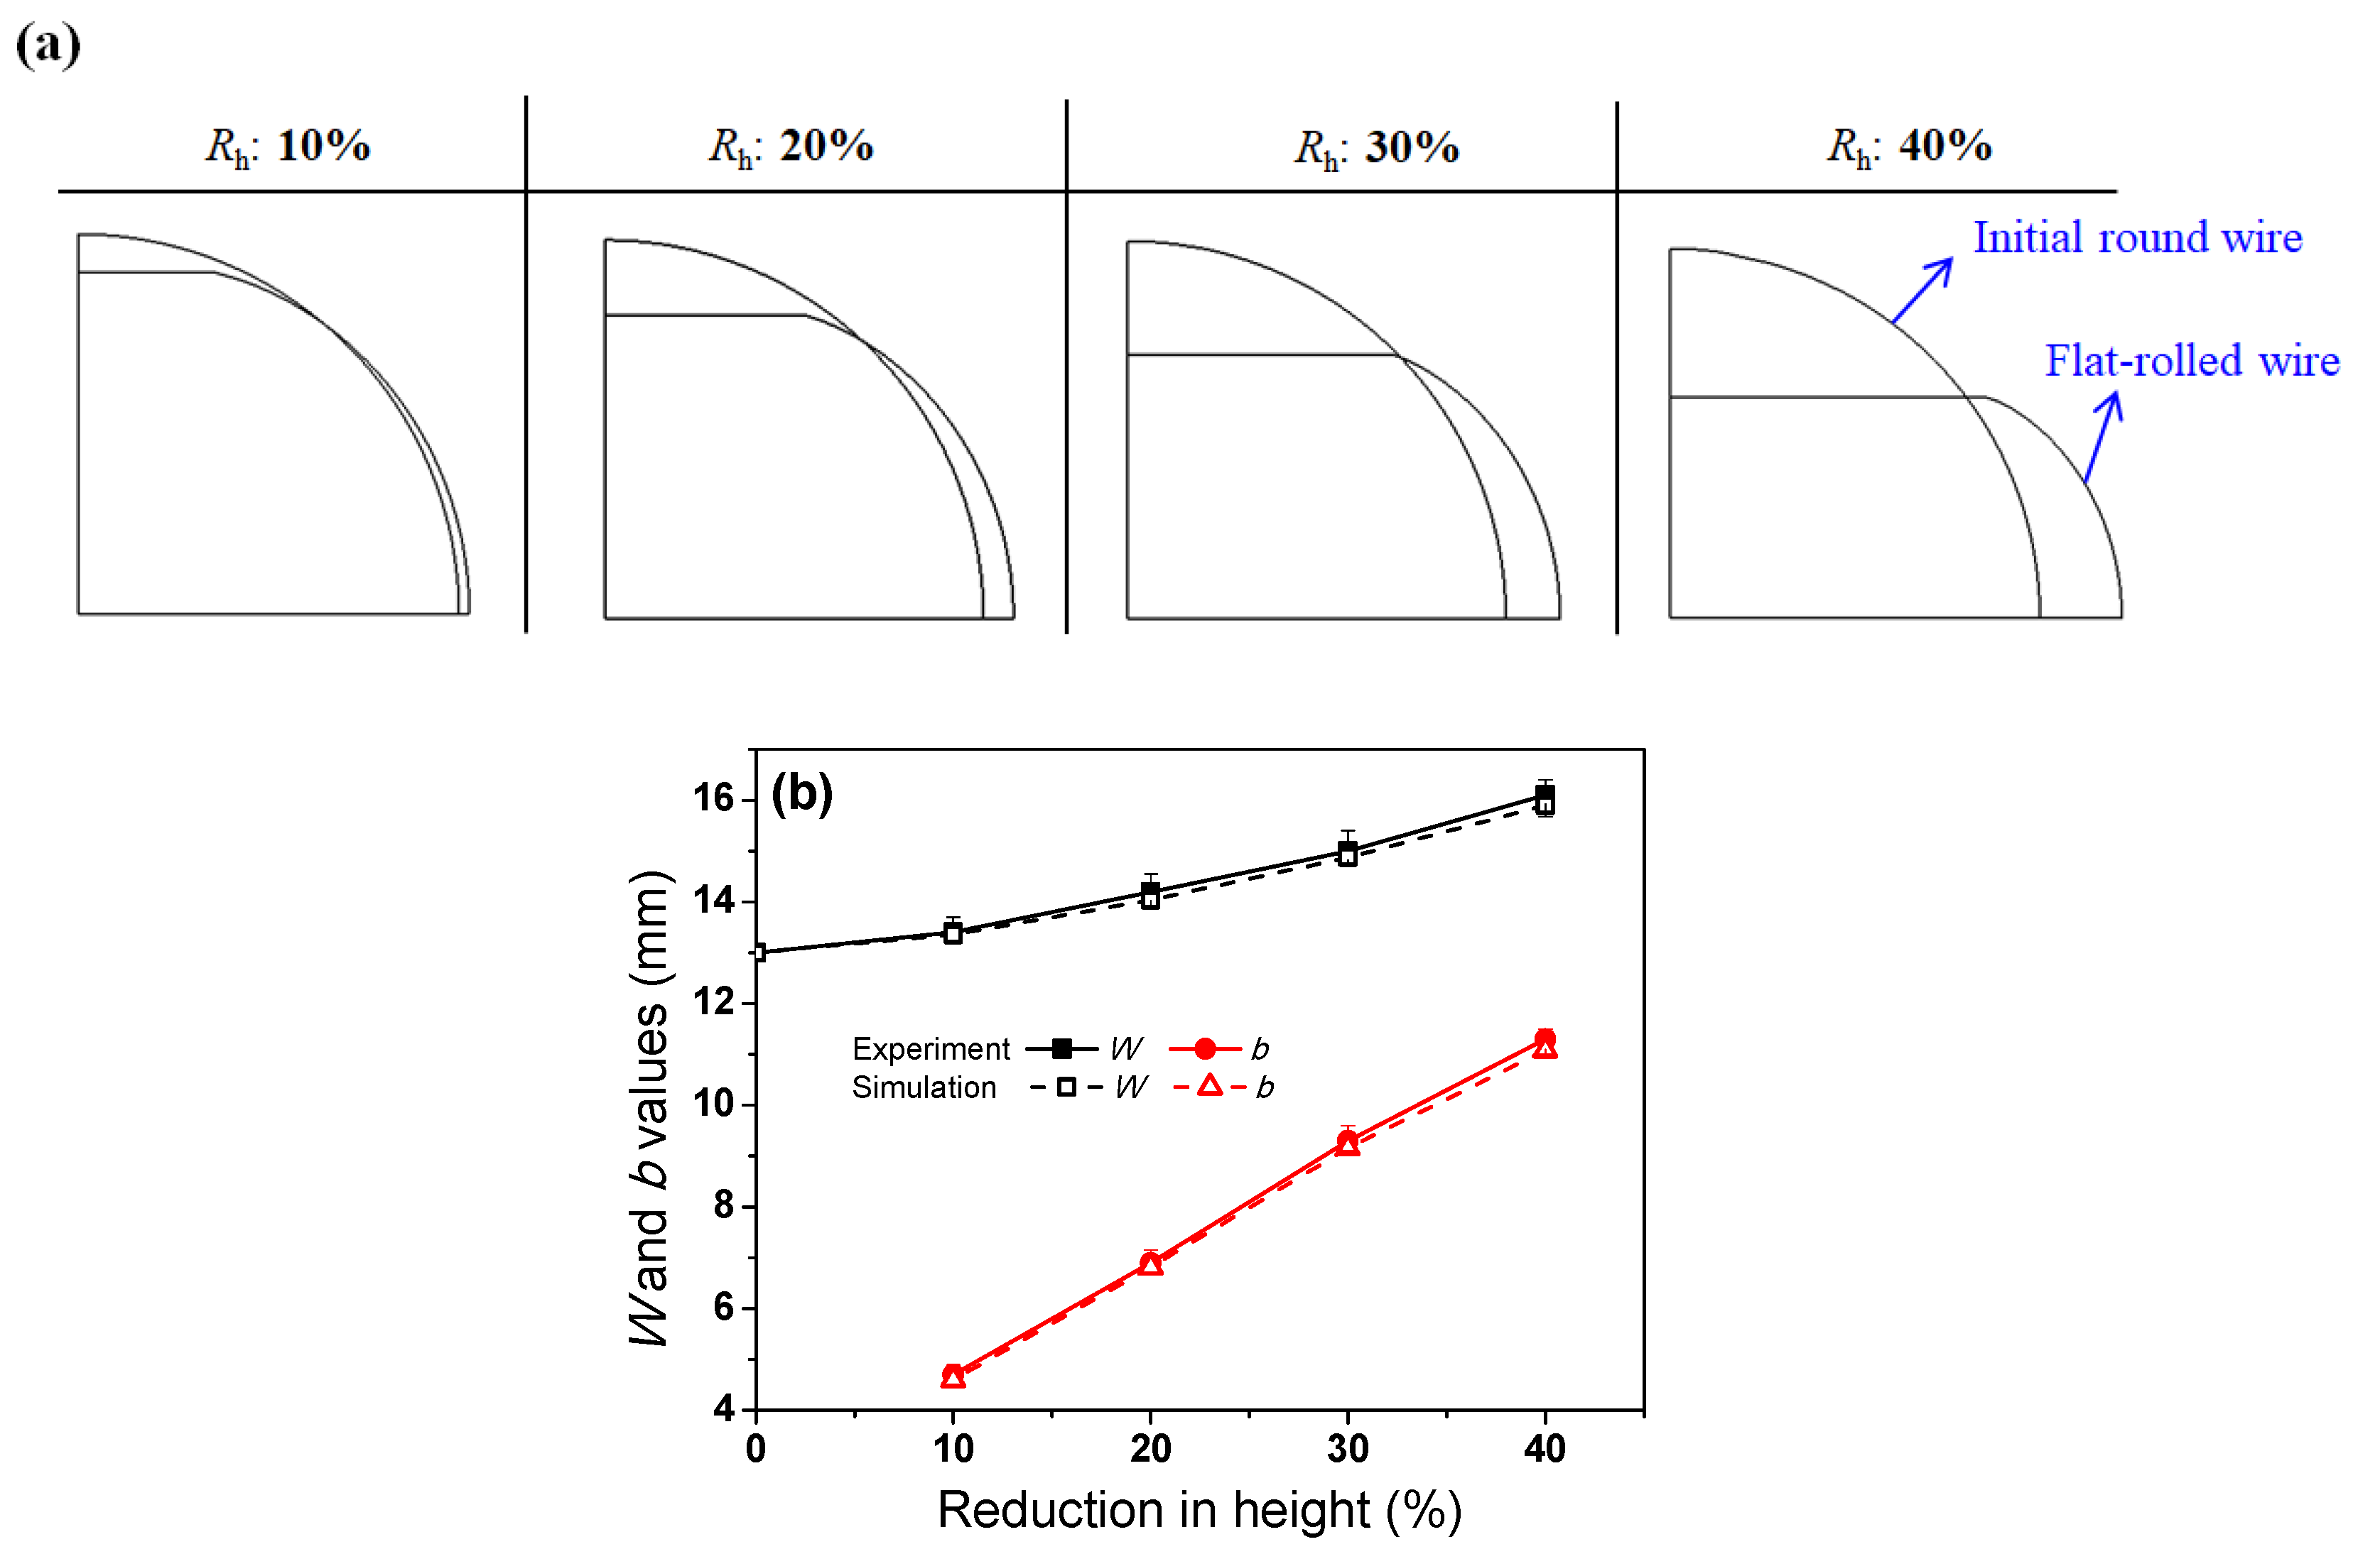
2.5. Model Validation
3. Results
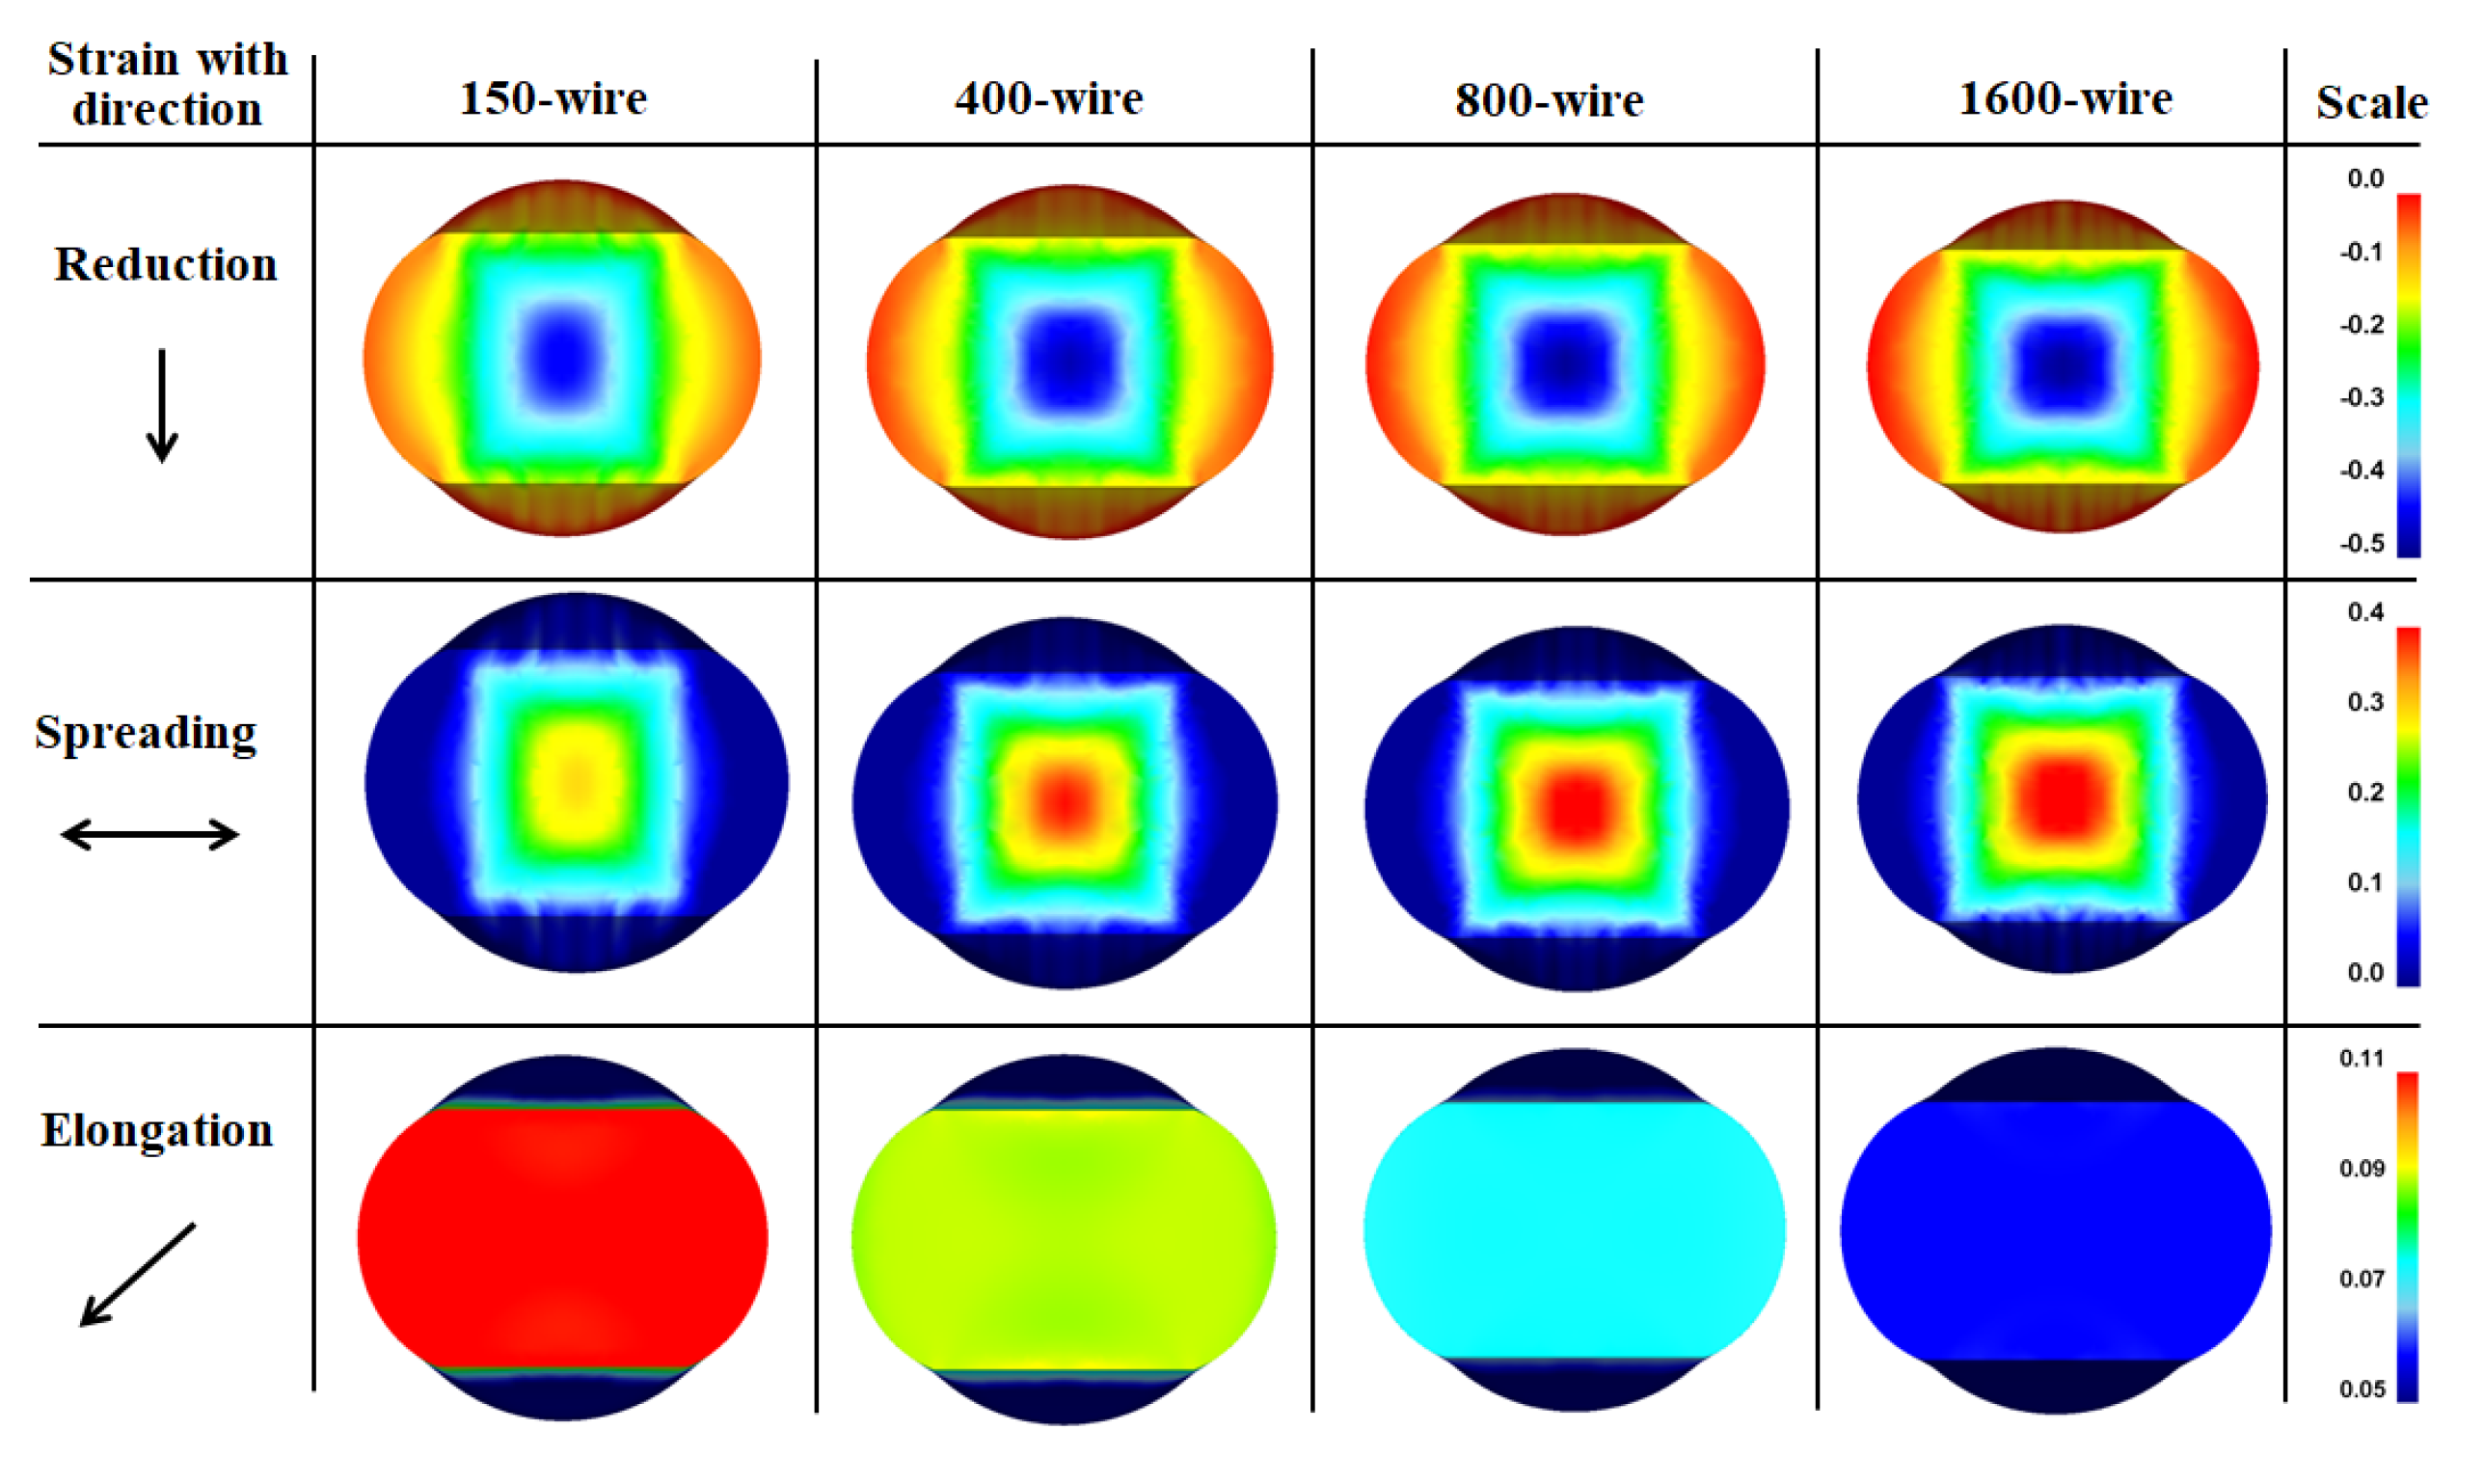
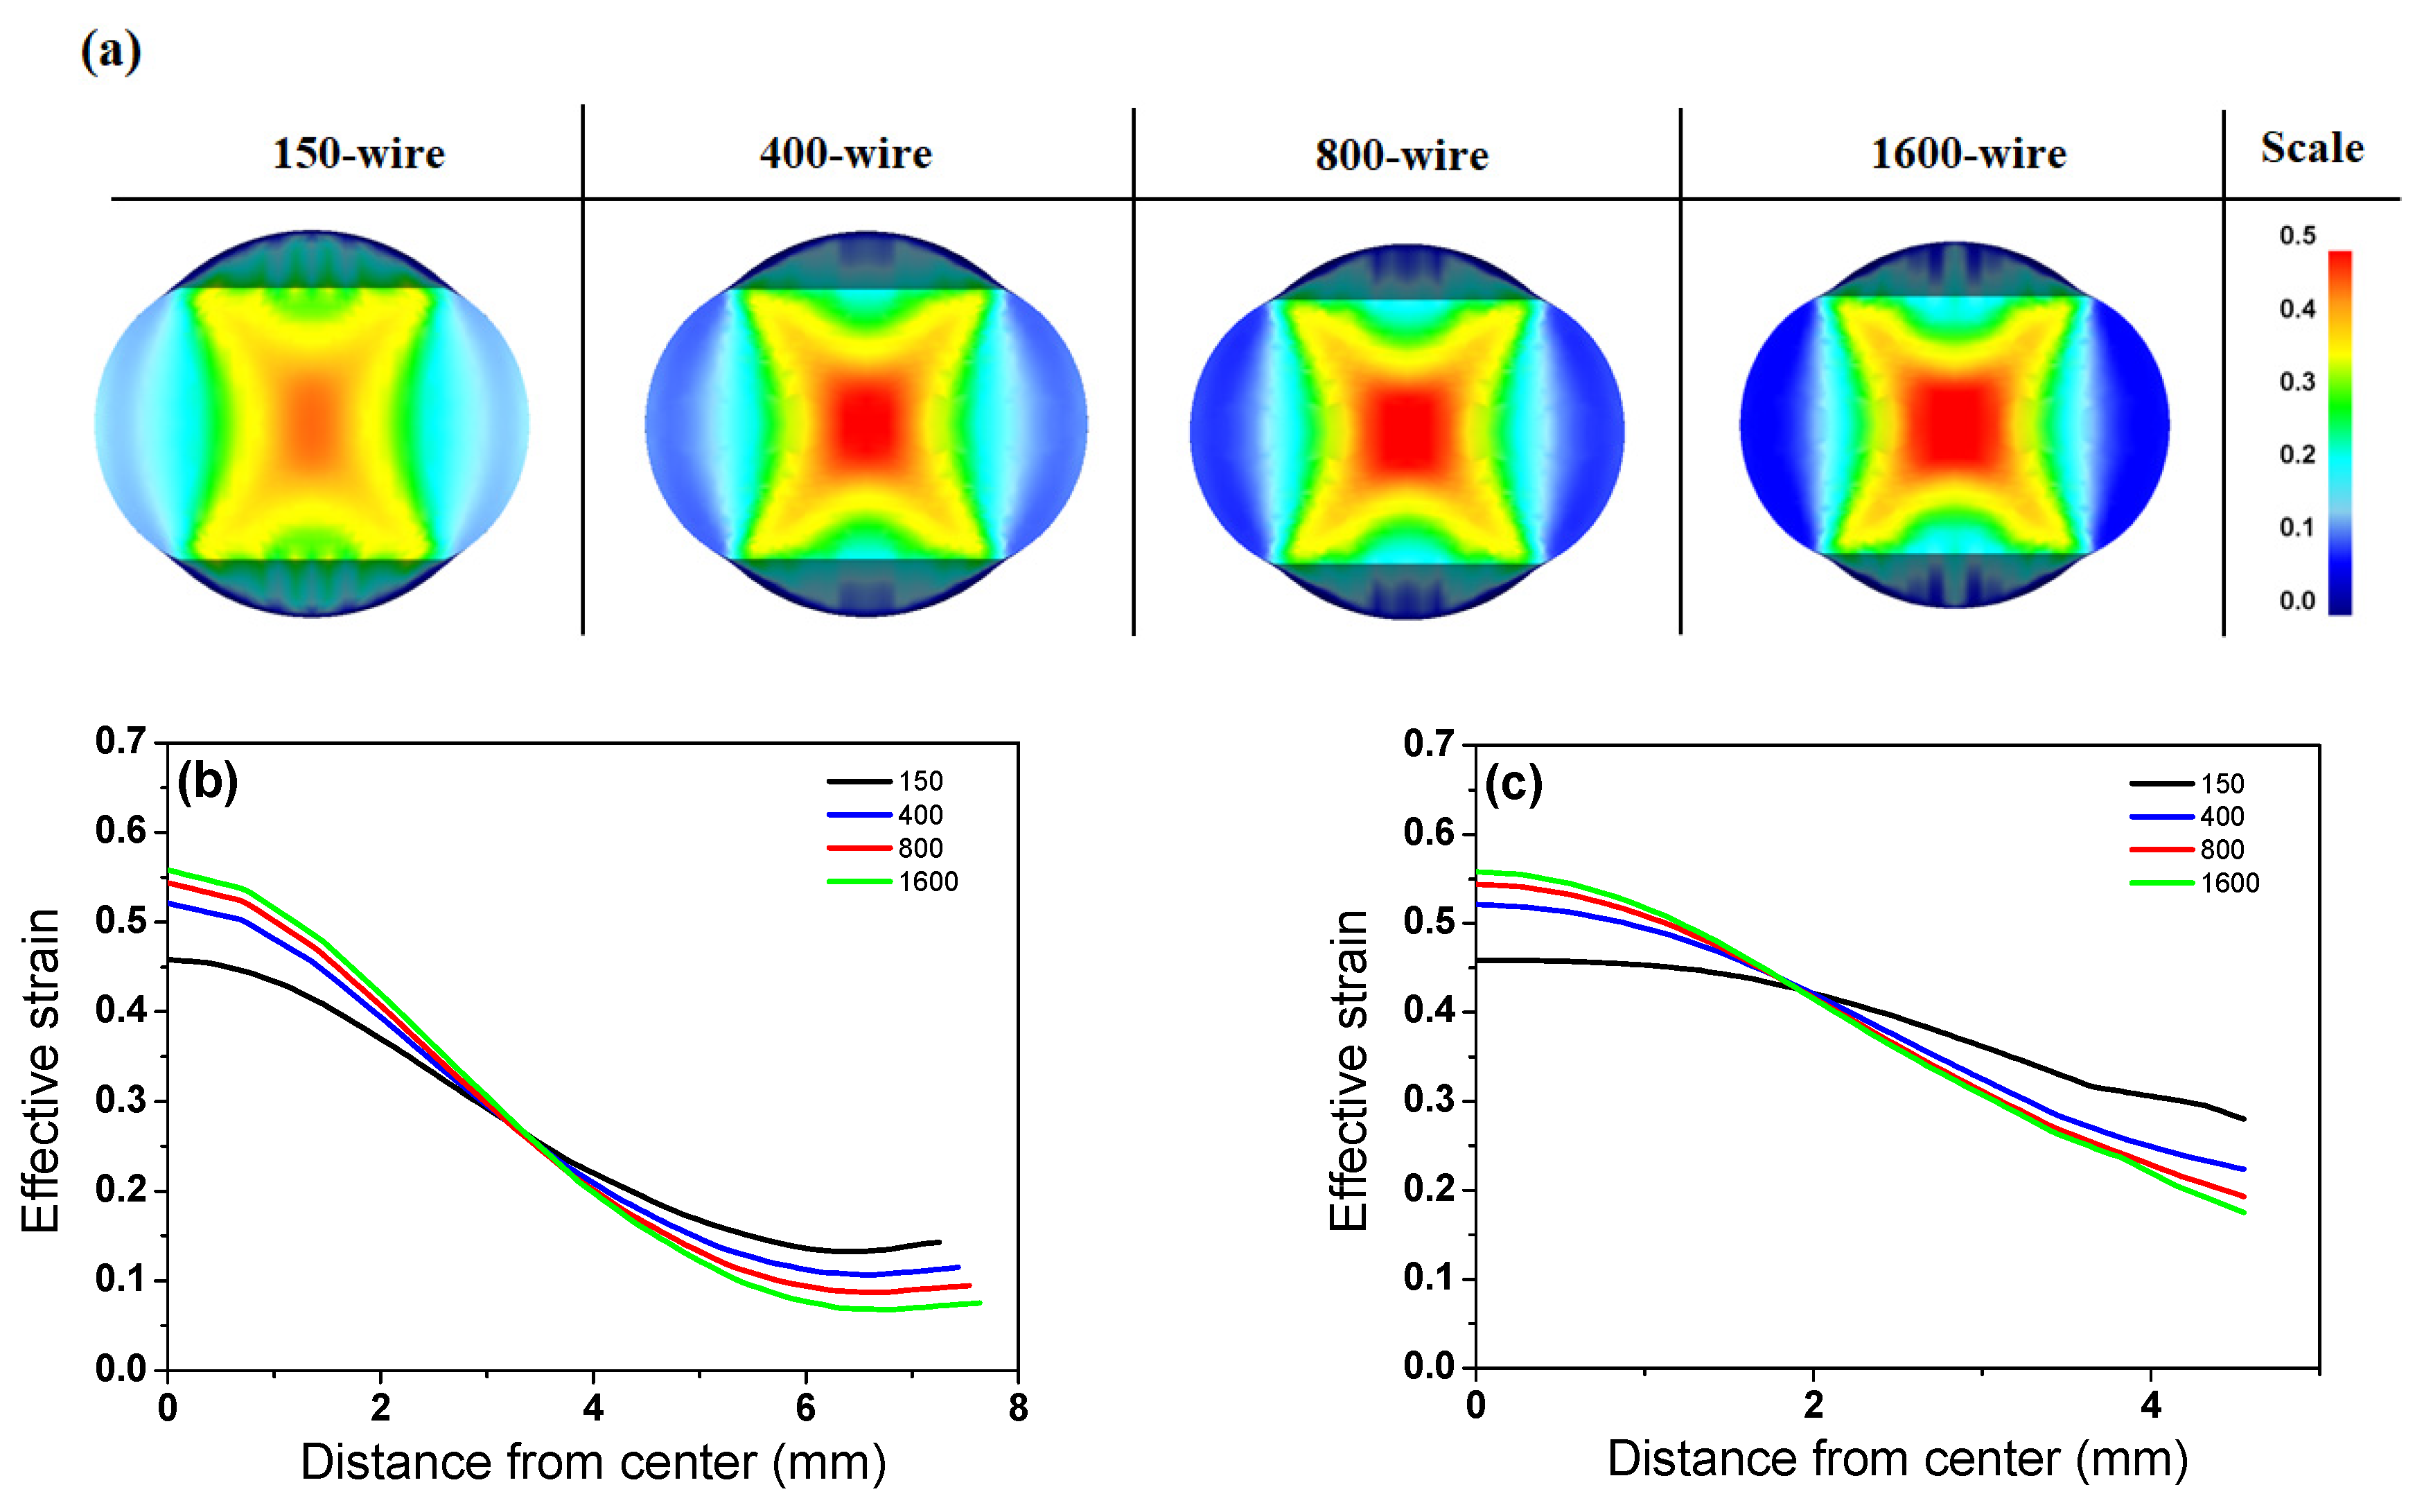
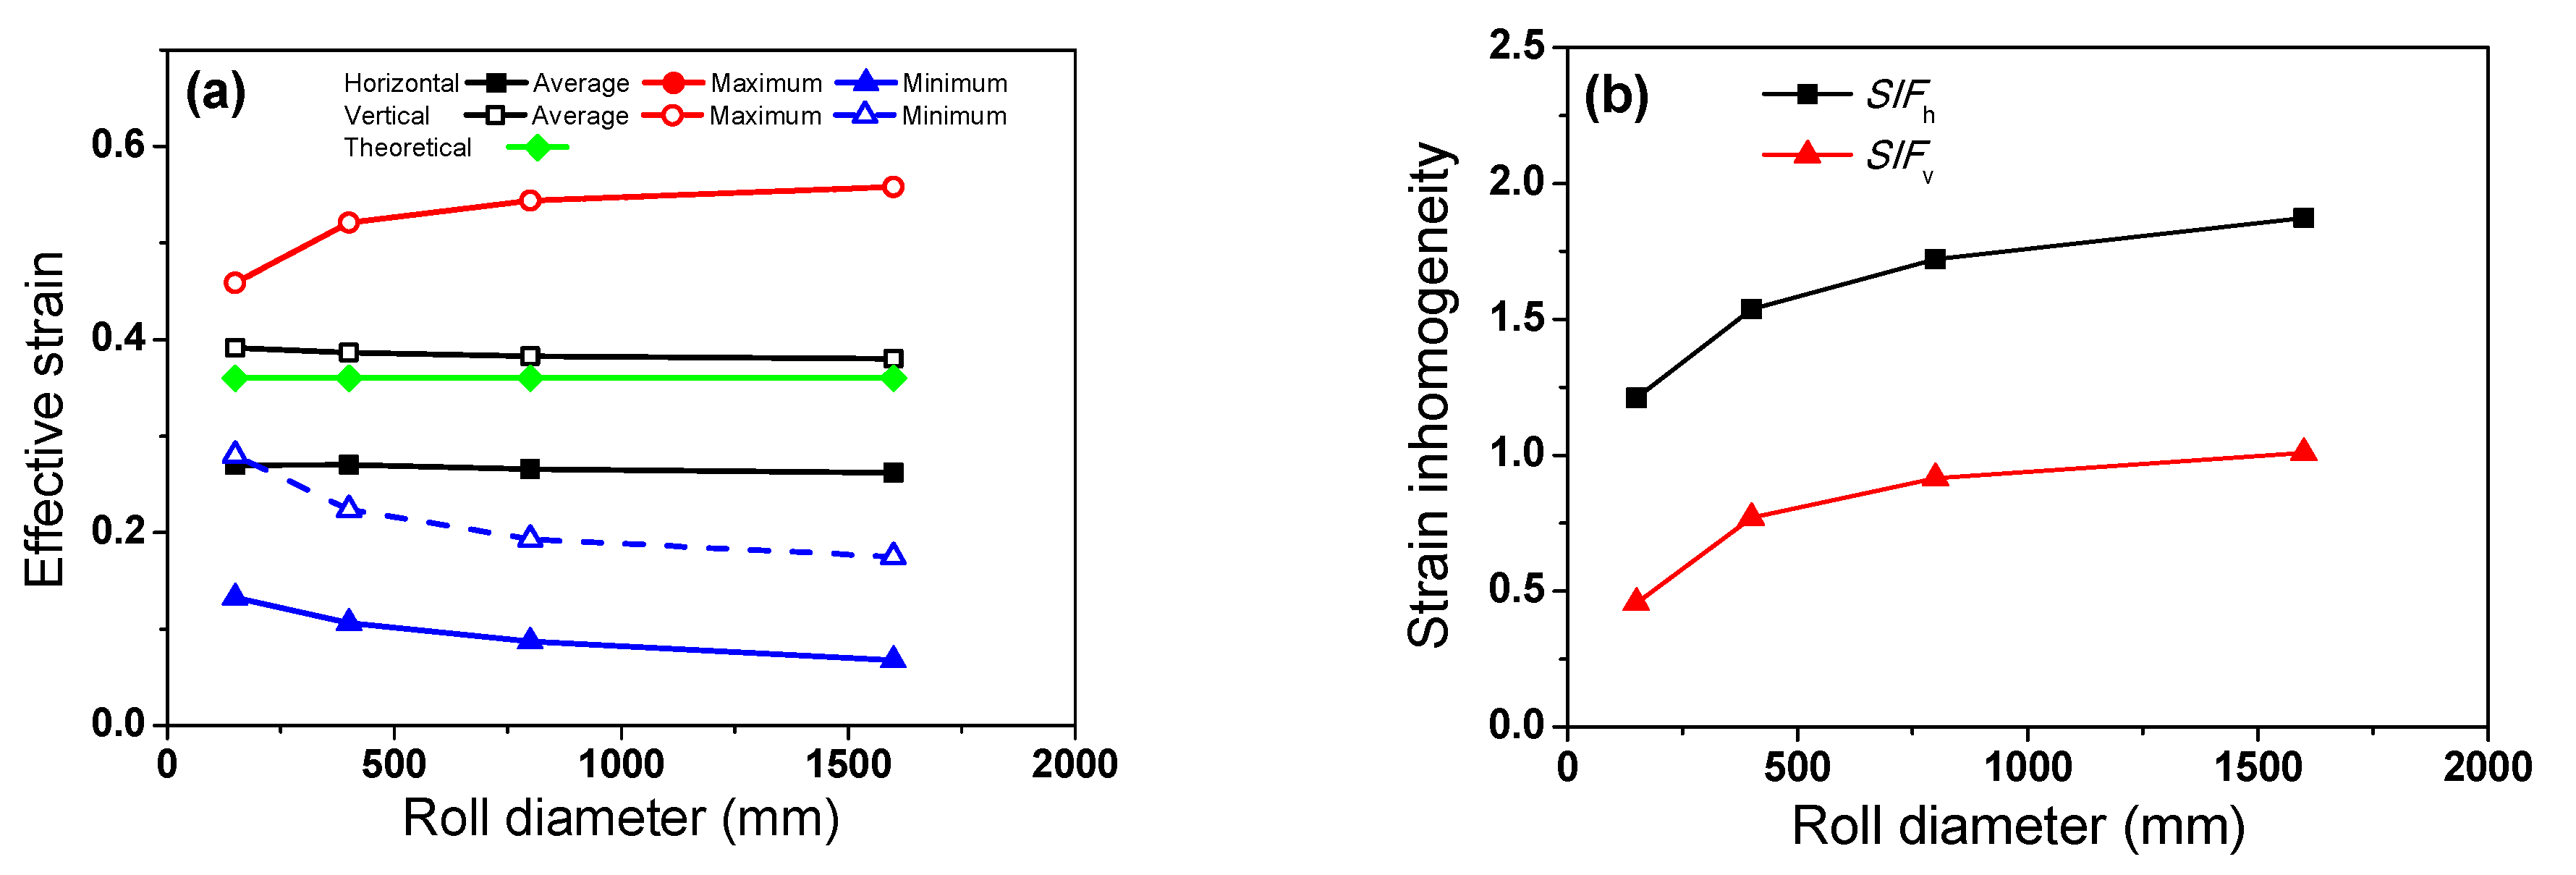
3.1. Strain Distribution with Roll Diameter
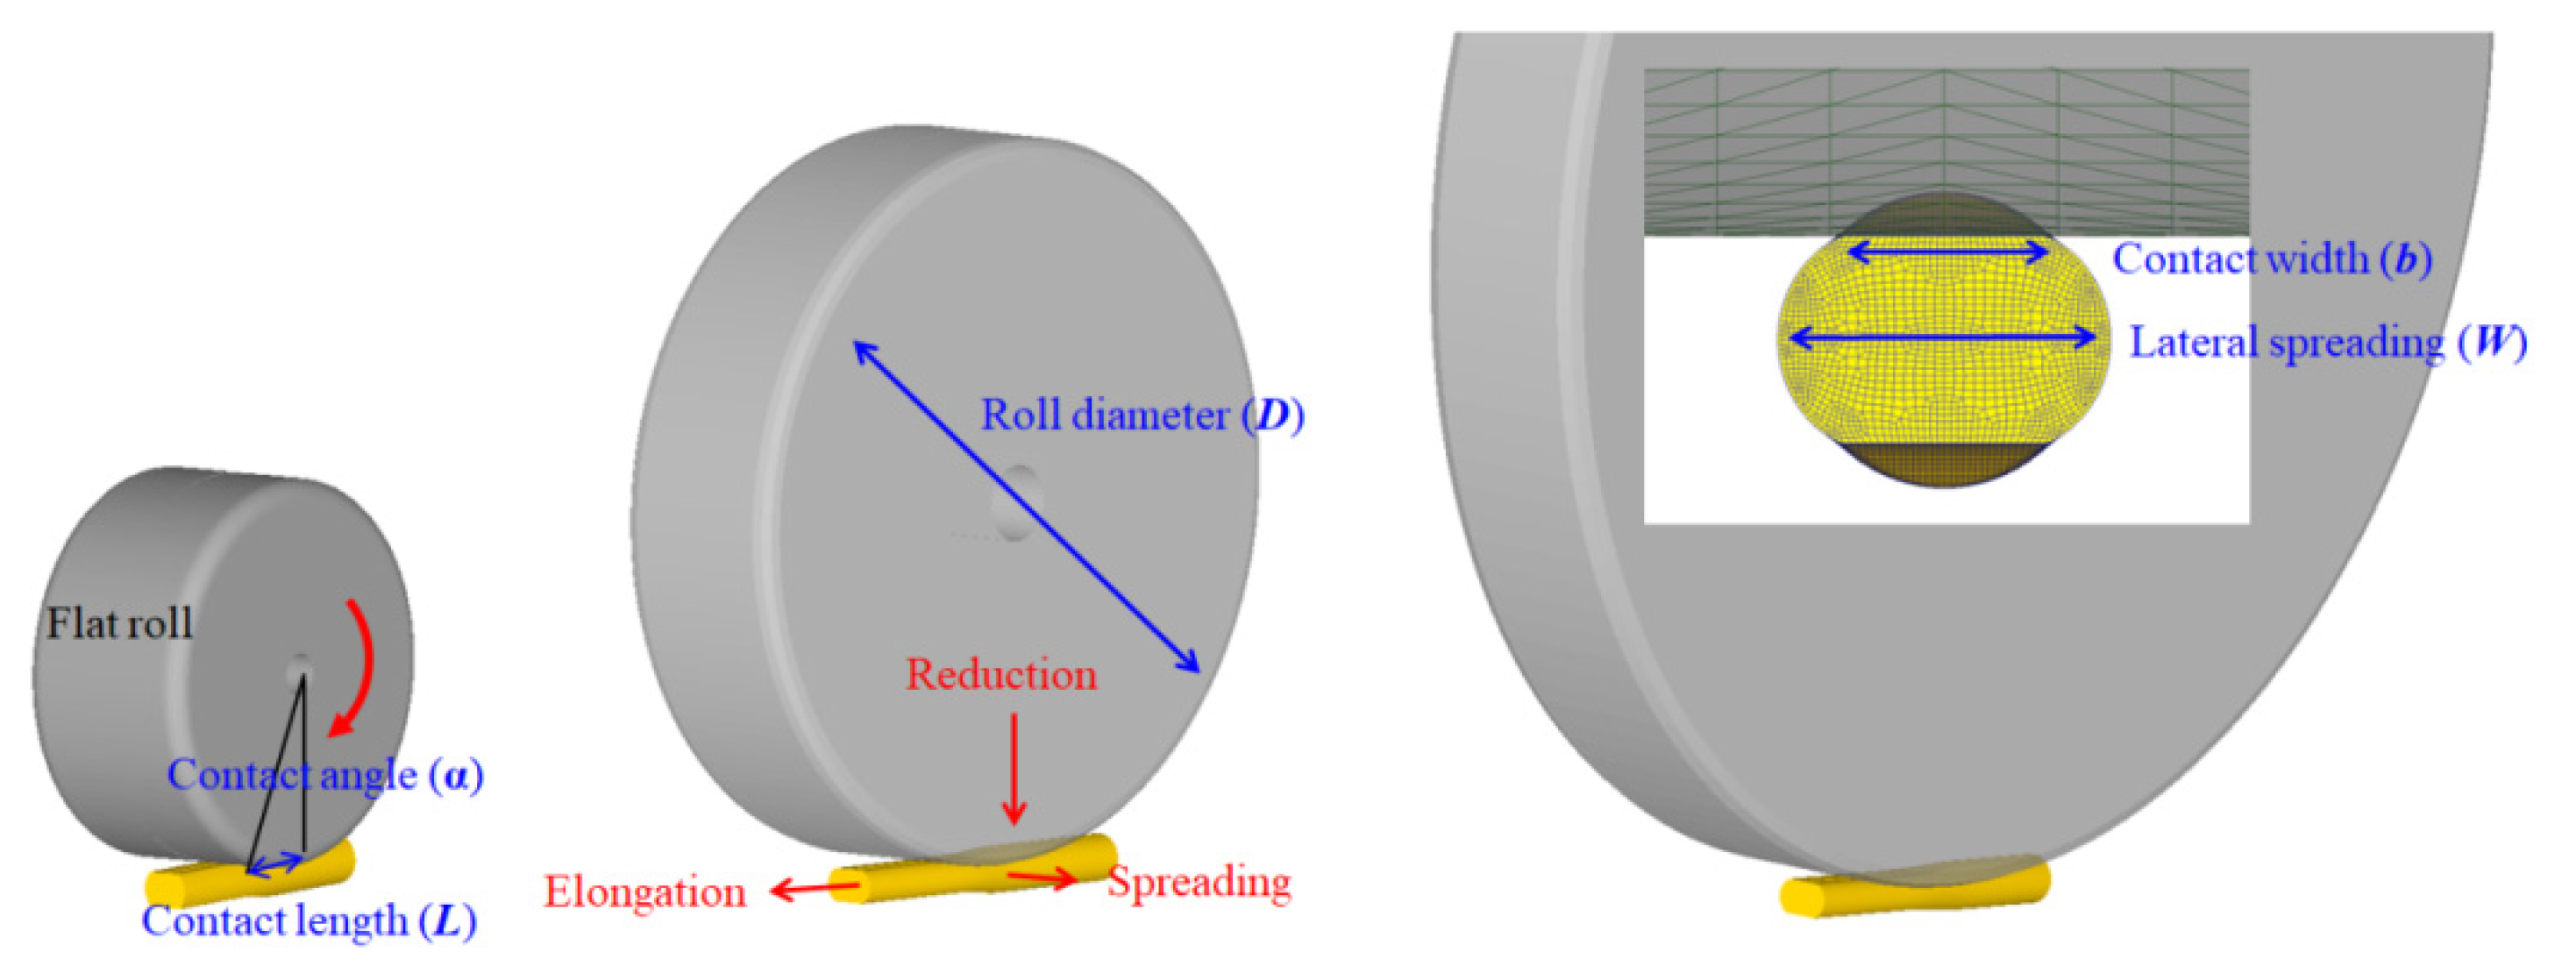
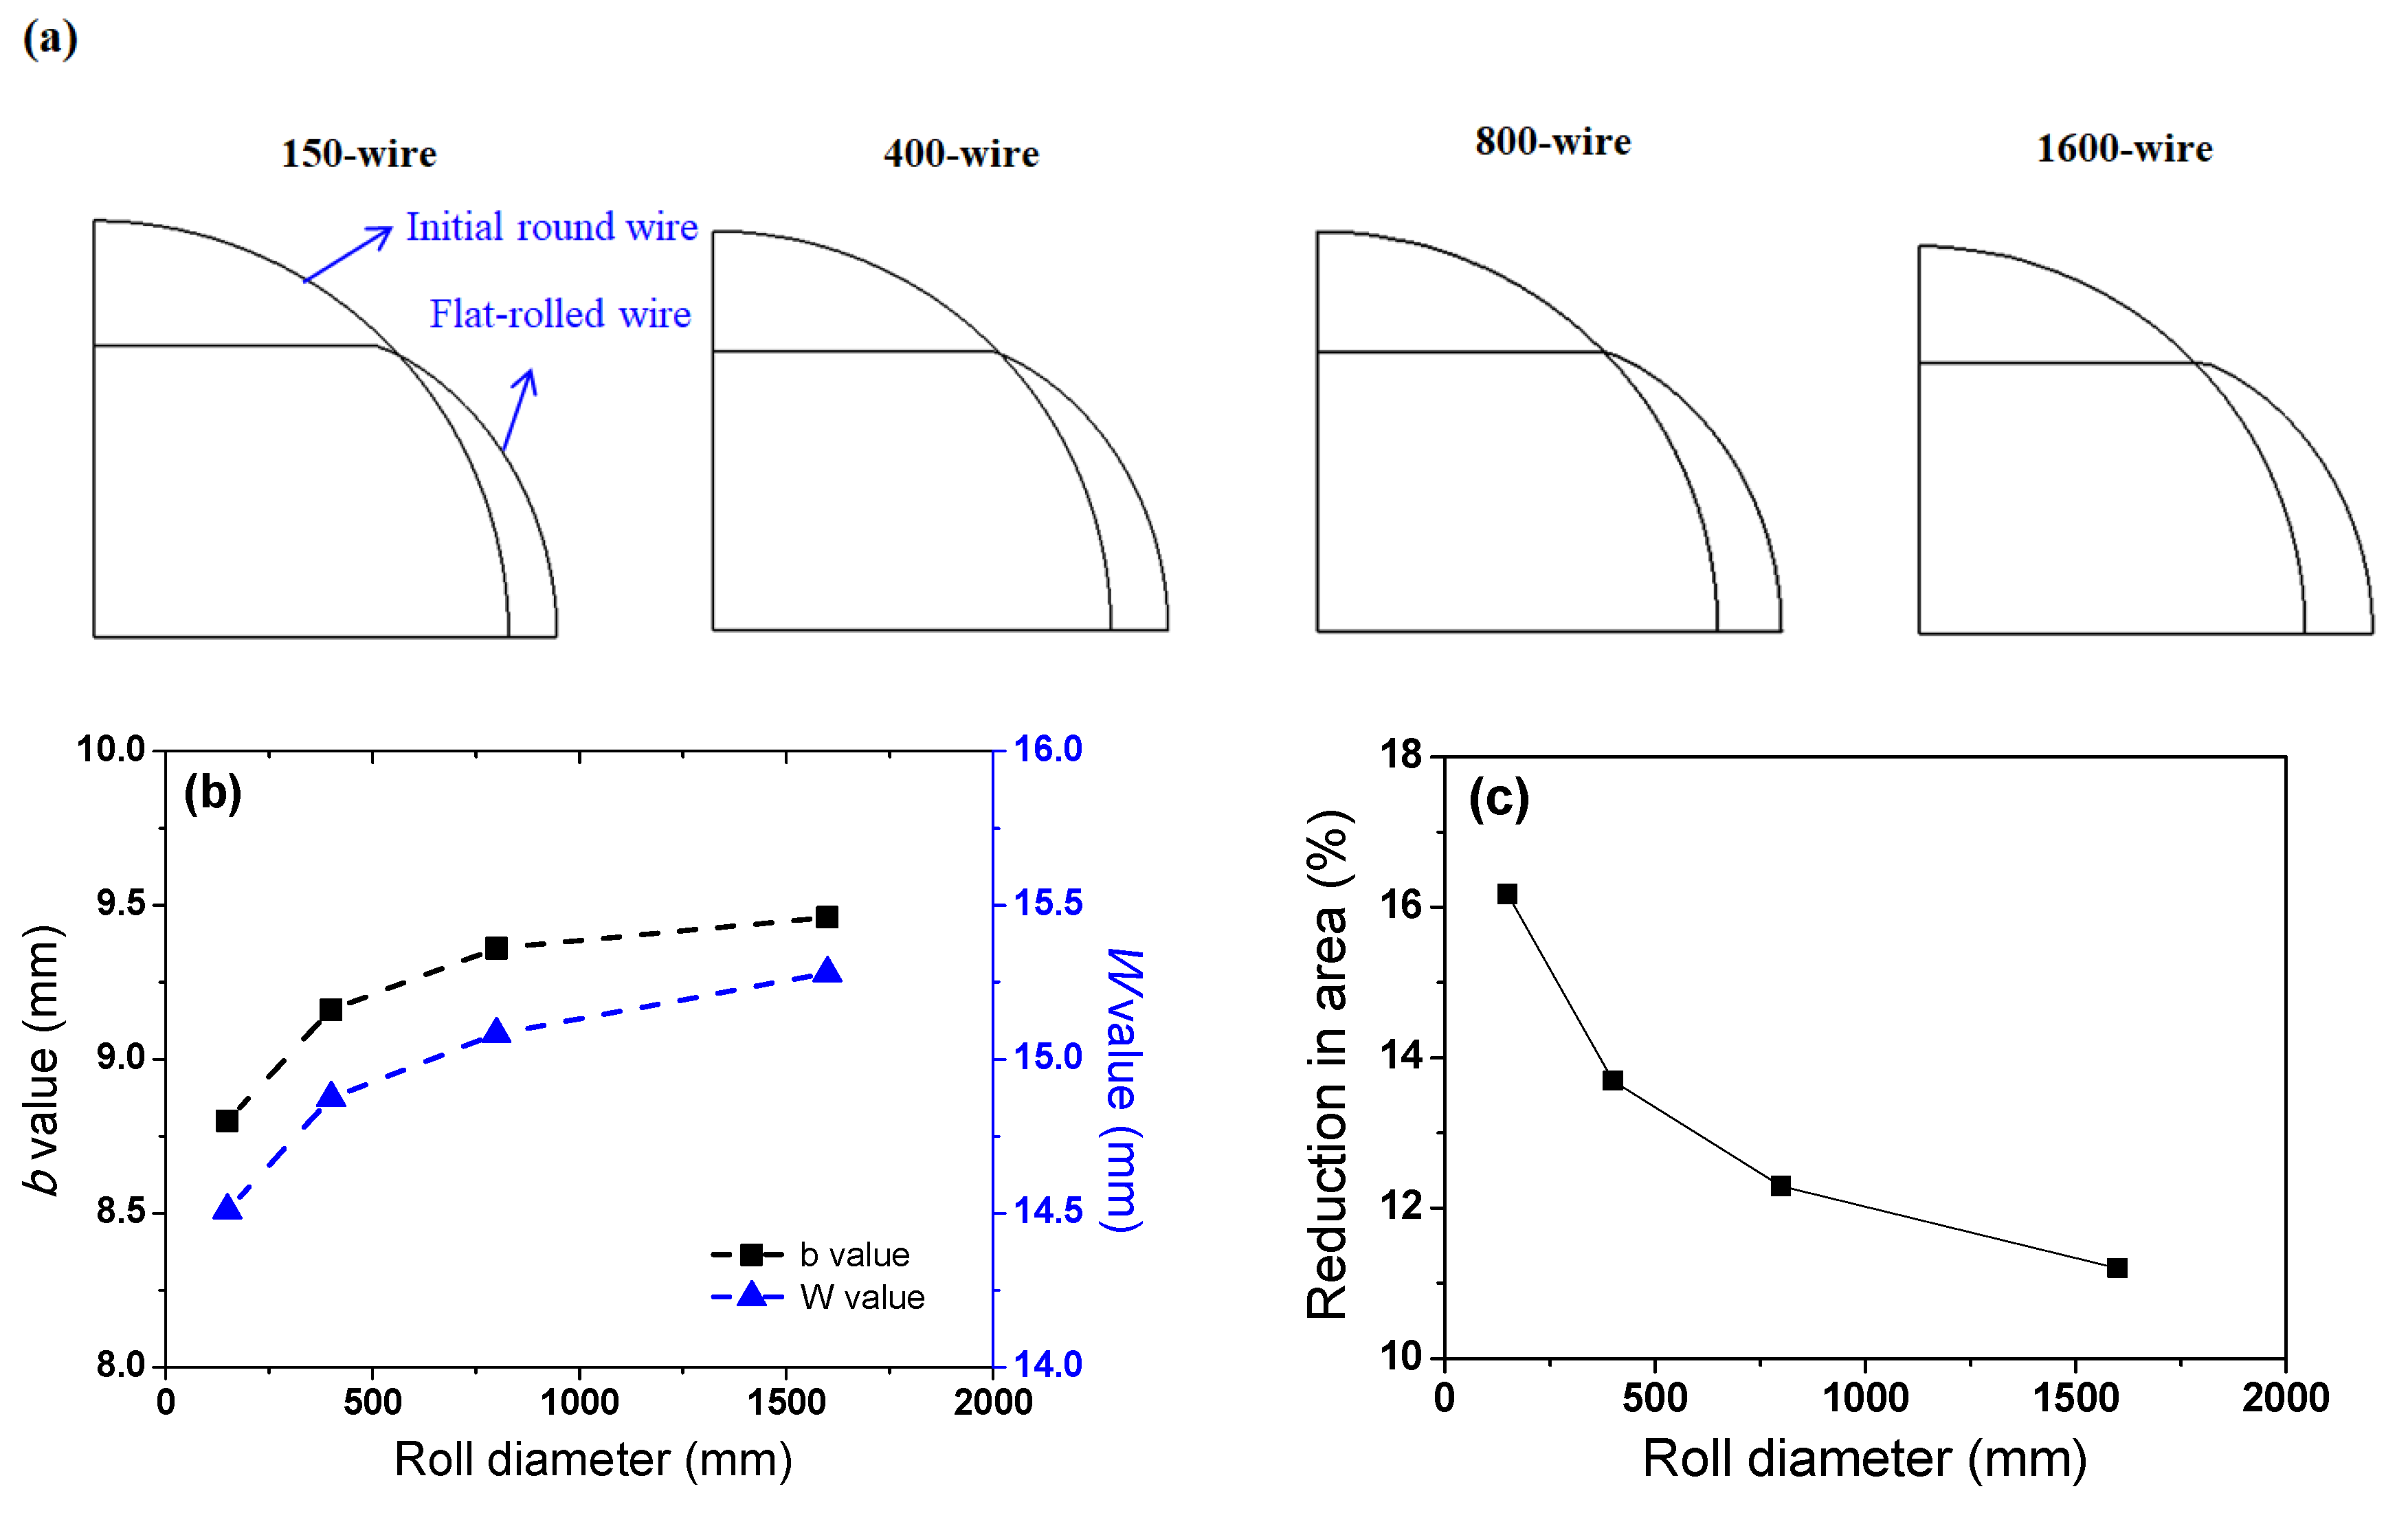
3.2. Deformation Shape with Roll Diameter
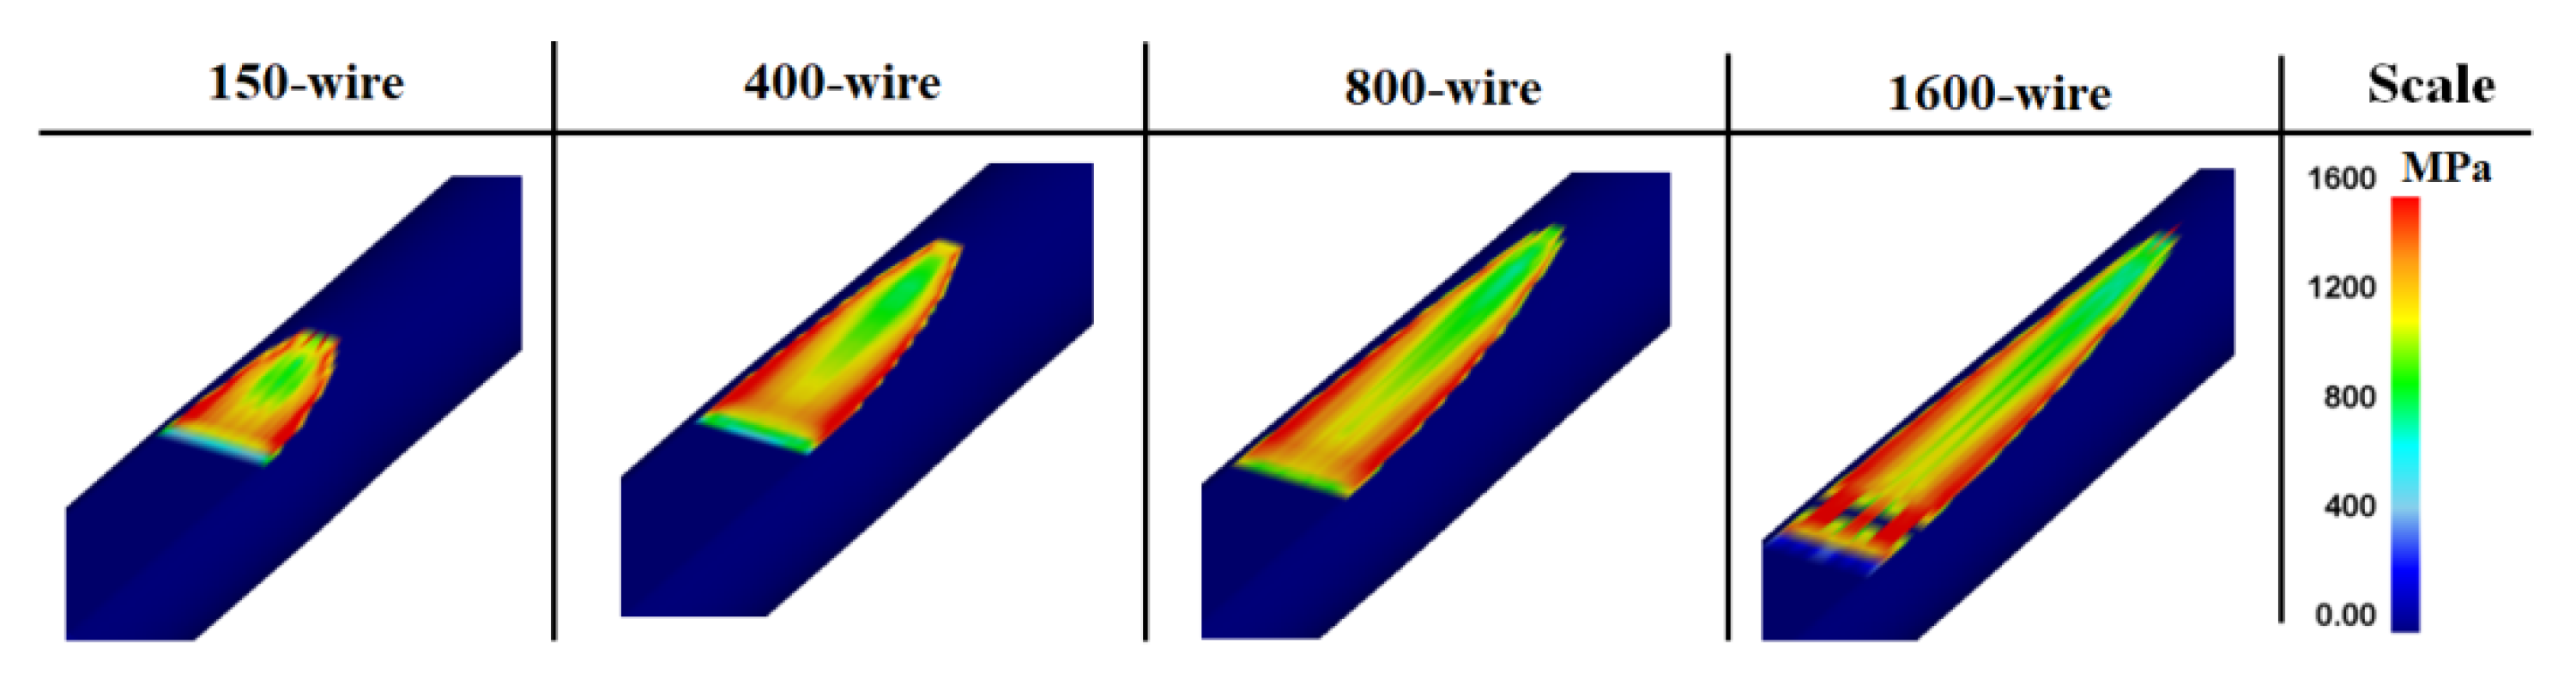
3.3. Contact Area and Pressure Distribution with Roll Diameter
3.4. Damage Value with Roll Diameter
4. Discussion
5. Conclusions
- The strain inhomogeneity of the flat-rolled wire increased with the roll diameter; therefore, the MSBs were strengthened with the roll diameter during wire flat rolling.
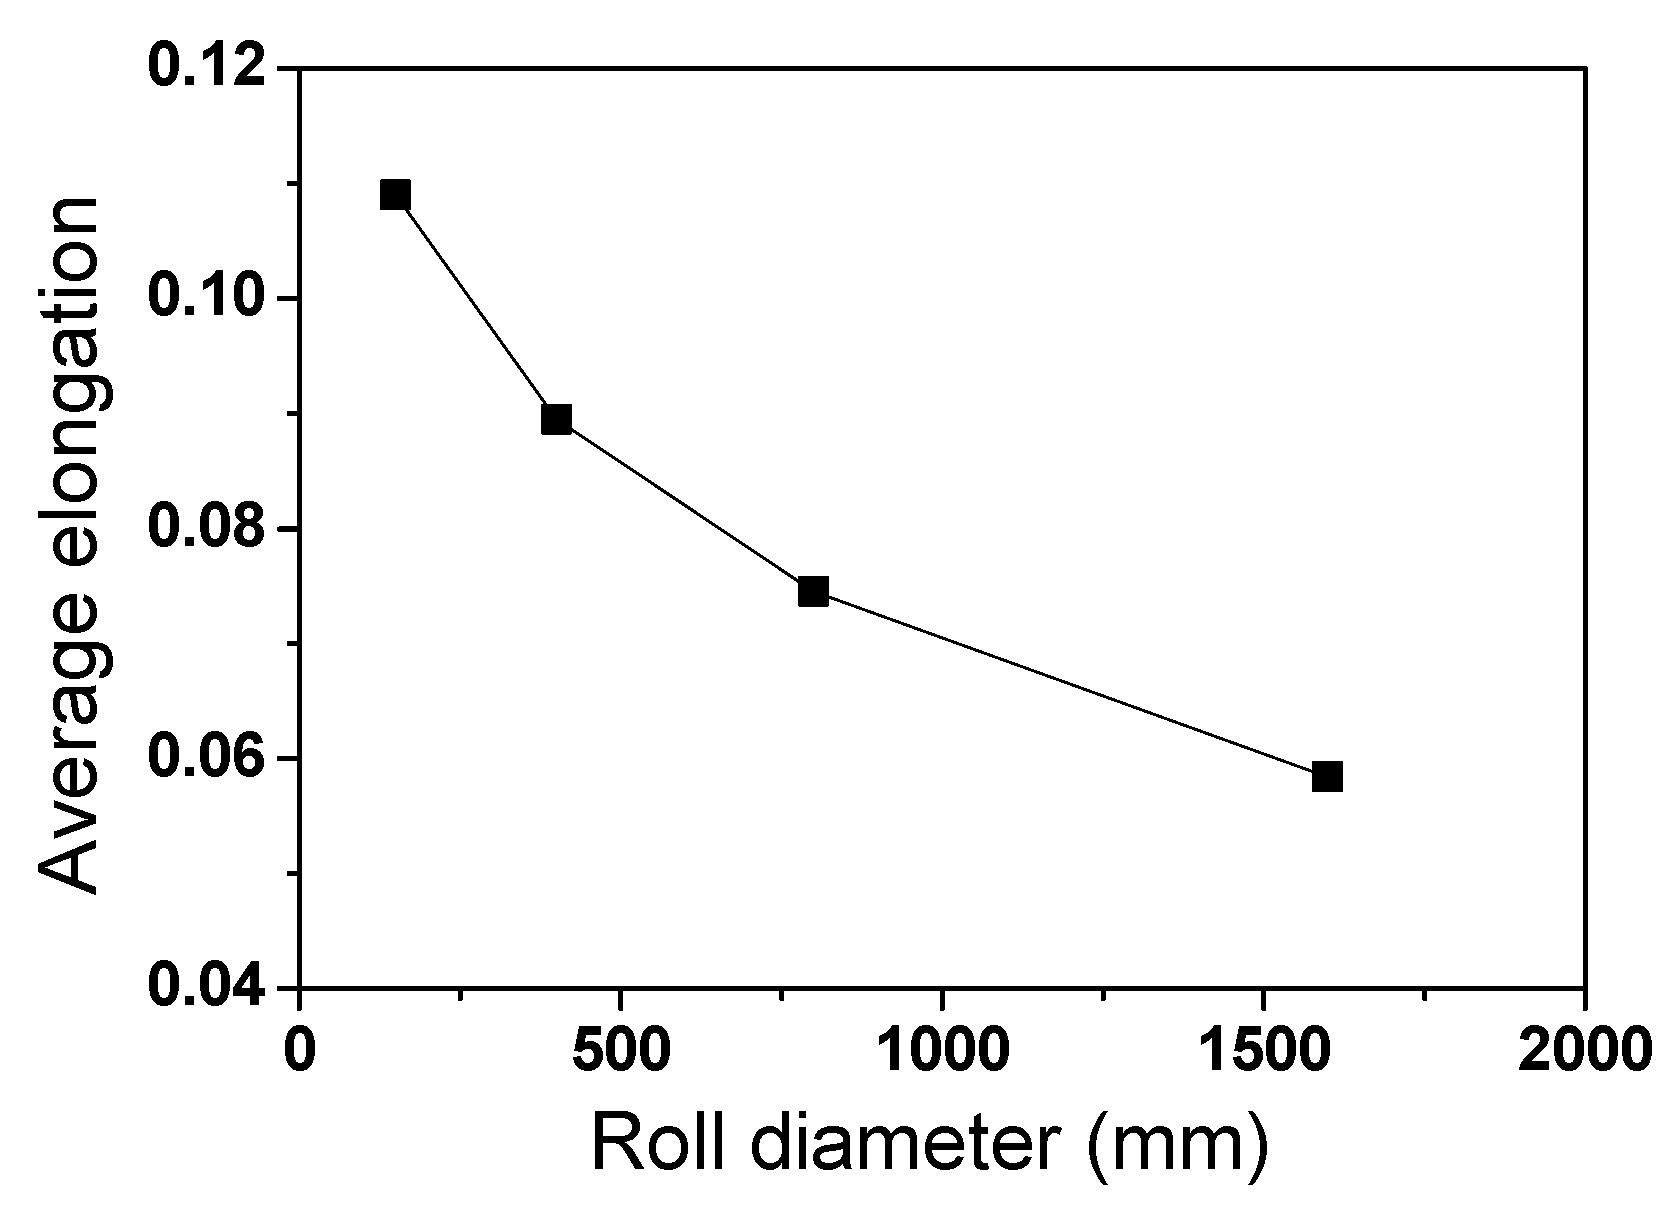
- The b and W of the wire increased as the roll diameter increased, leading to a decrease in RA with the roll diameter.
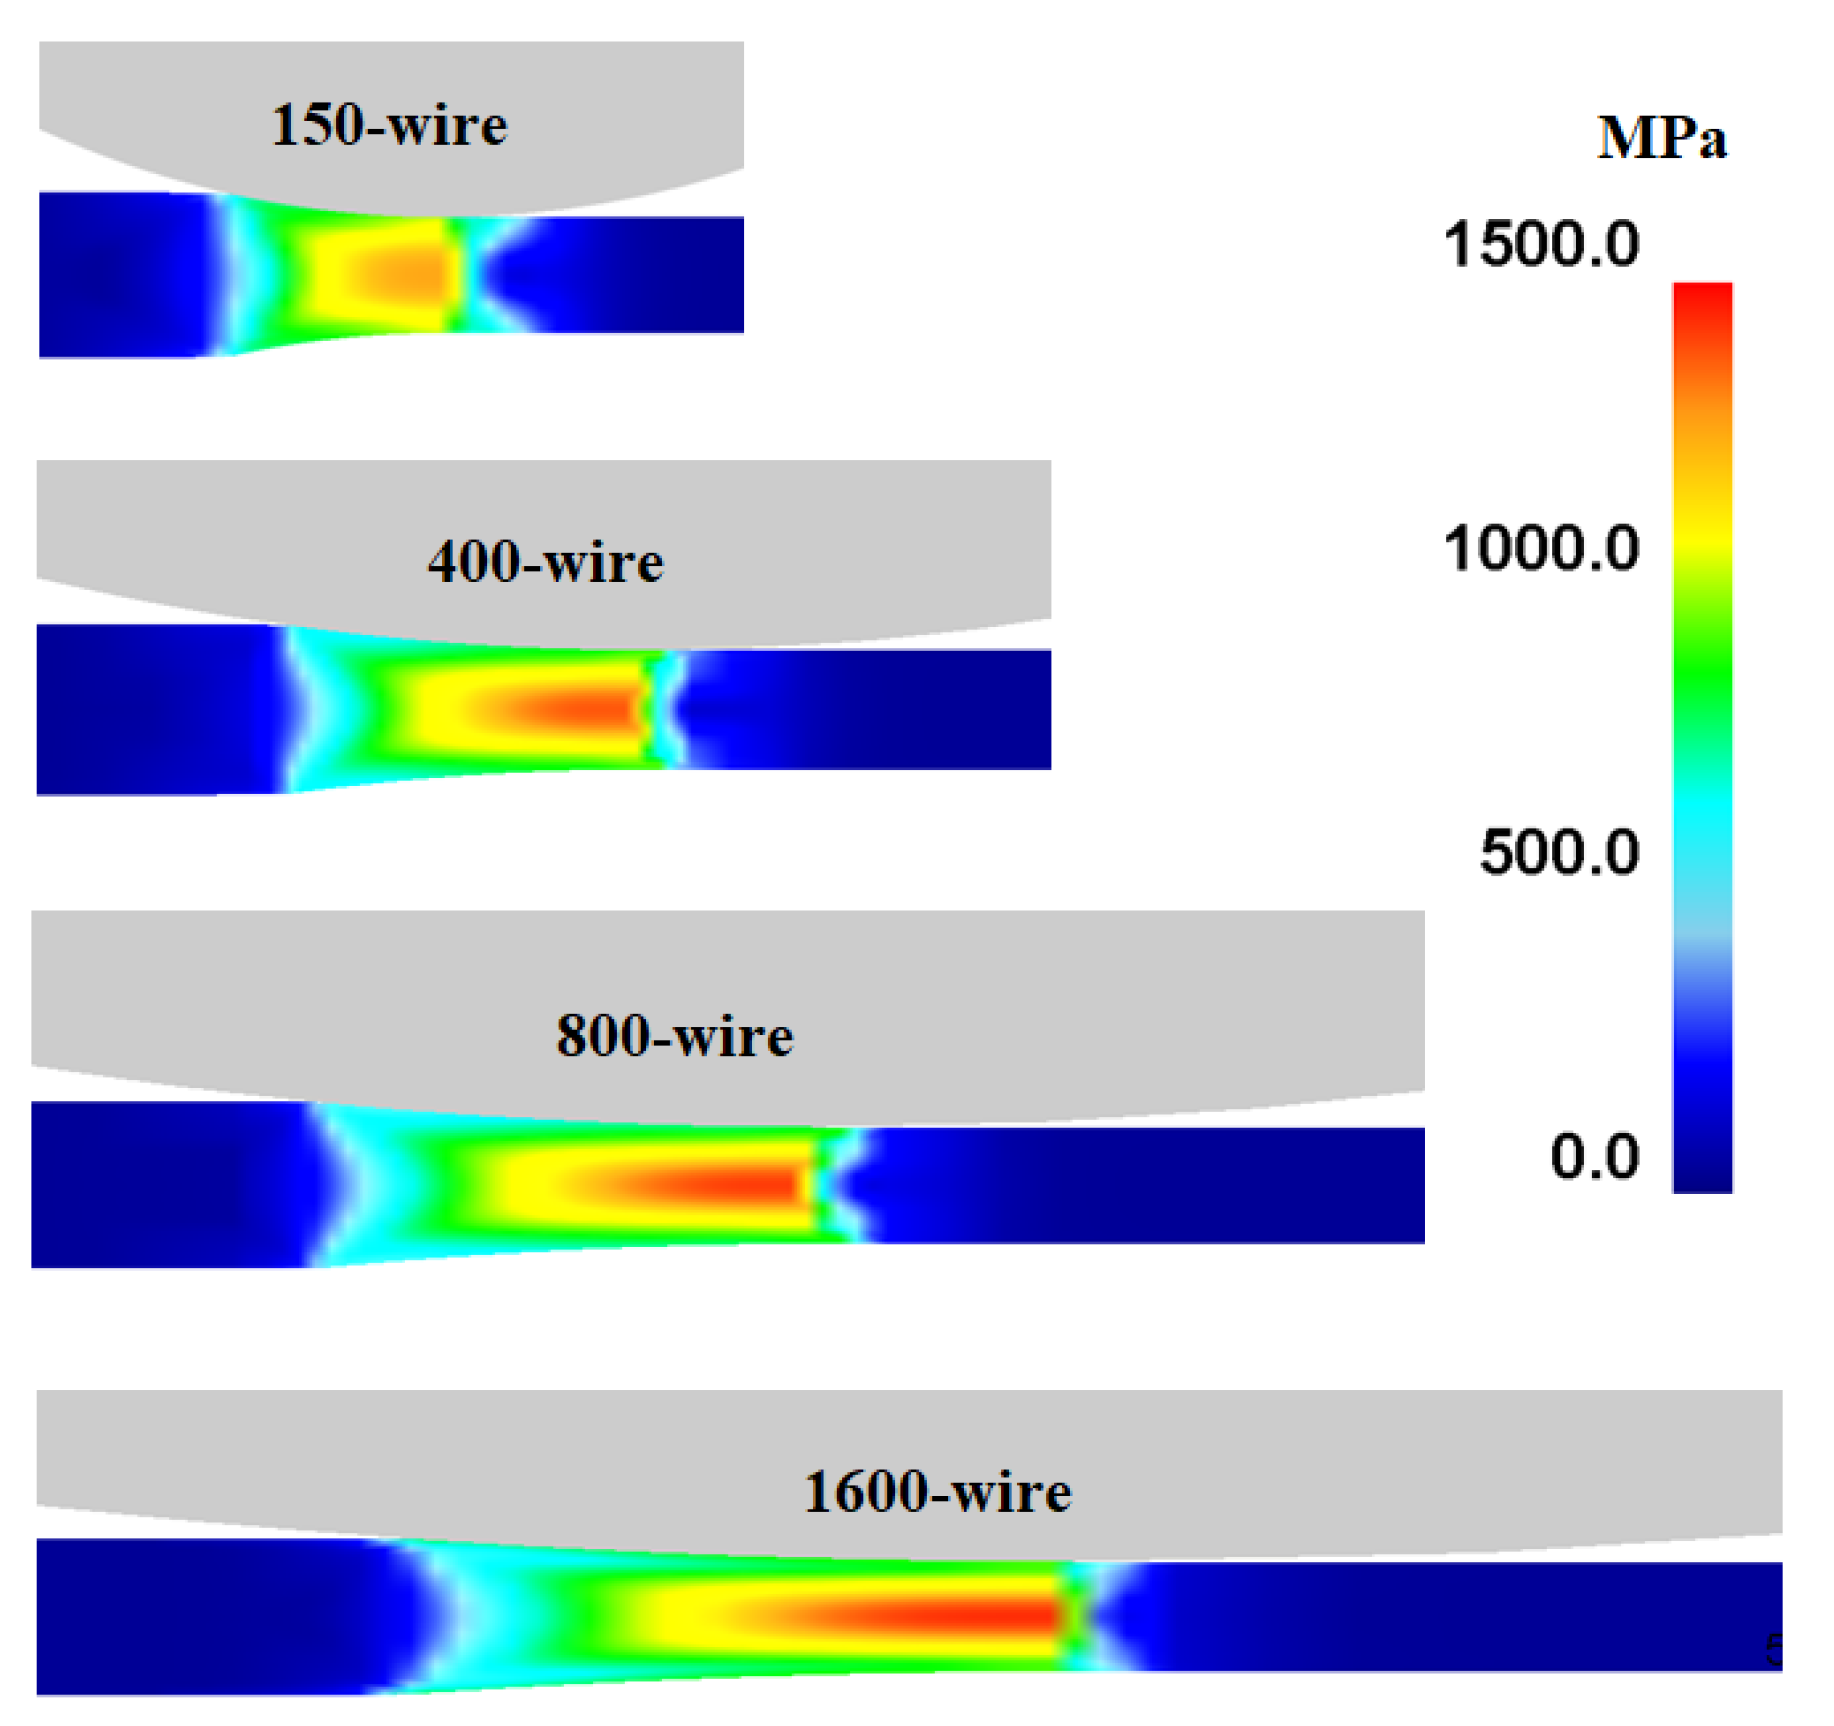
- The contour of the normal contact pressure on the wire surface exhibited similar patterns regardless of the roll diameter. The contact pressure of the wire was higher at the entry, edge, and exit zones in the contact area.
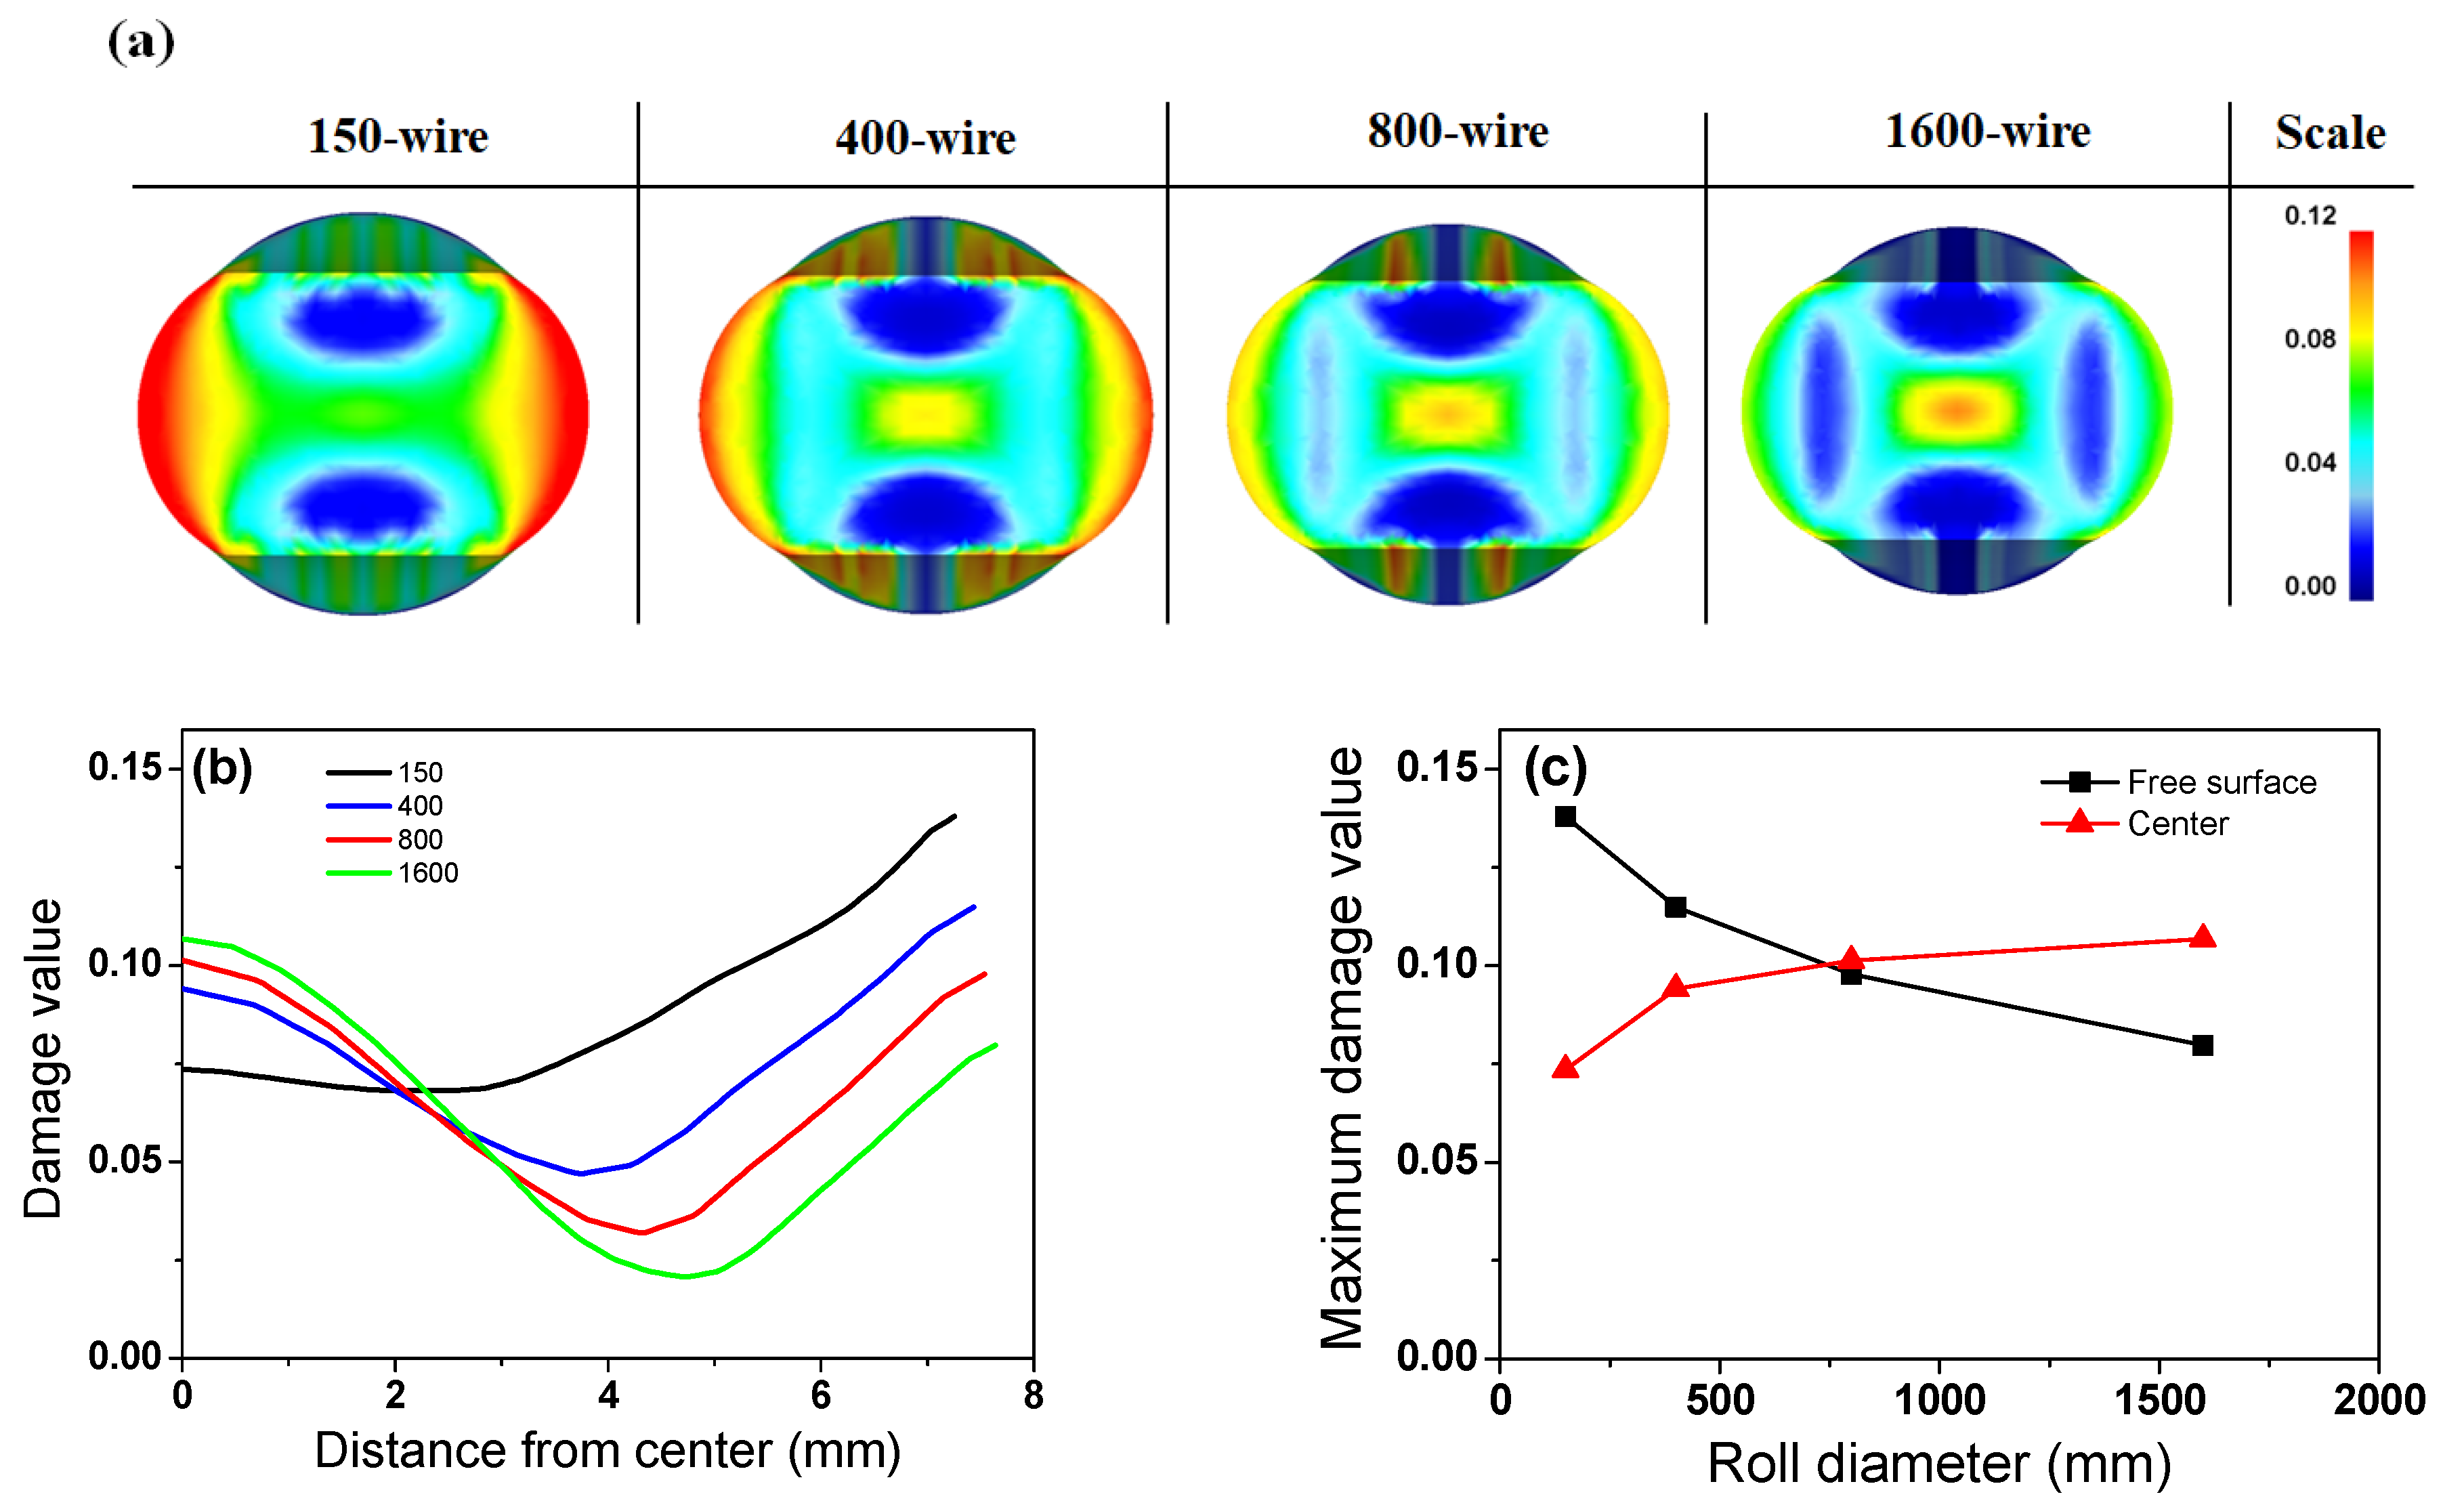
- The distribution of the damage value varied with the roll diameter. The free surface region tended to have the peak damage value during wire flat rolling; however, the center region exhibited the maximum damage value as the roll diameter increased. The optimum roll diameter was in existence during wire flat rolling from the perspective of the damage value.
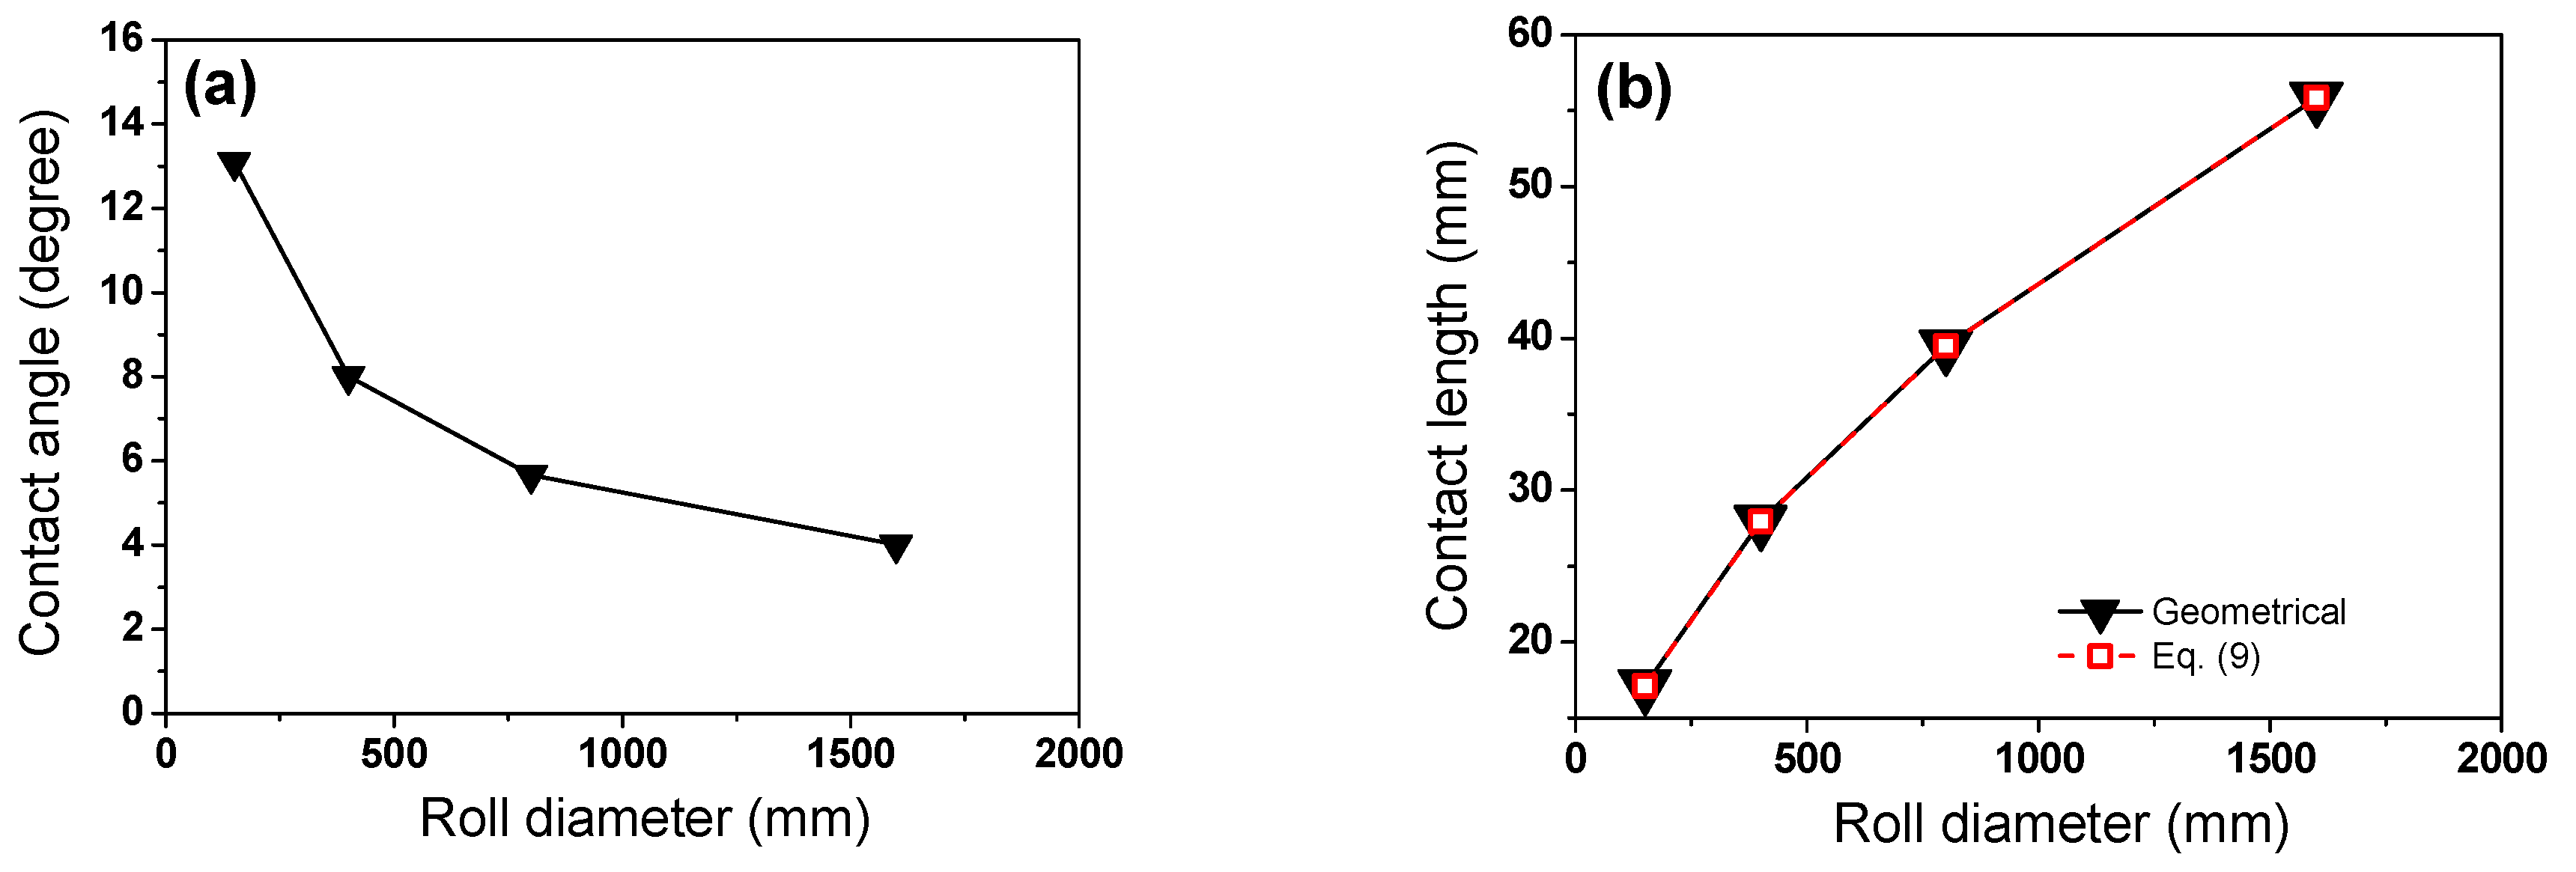
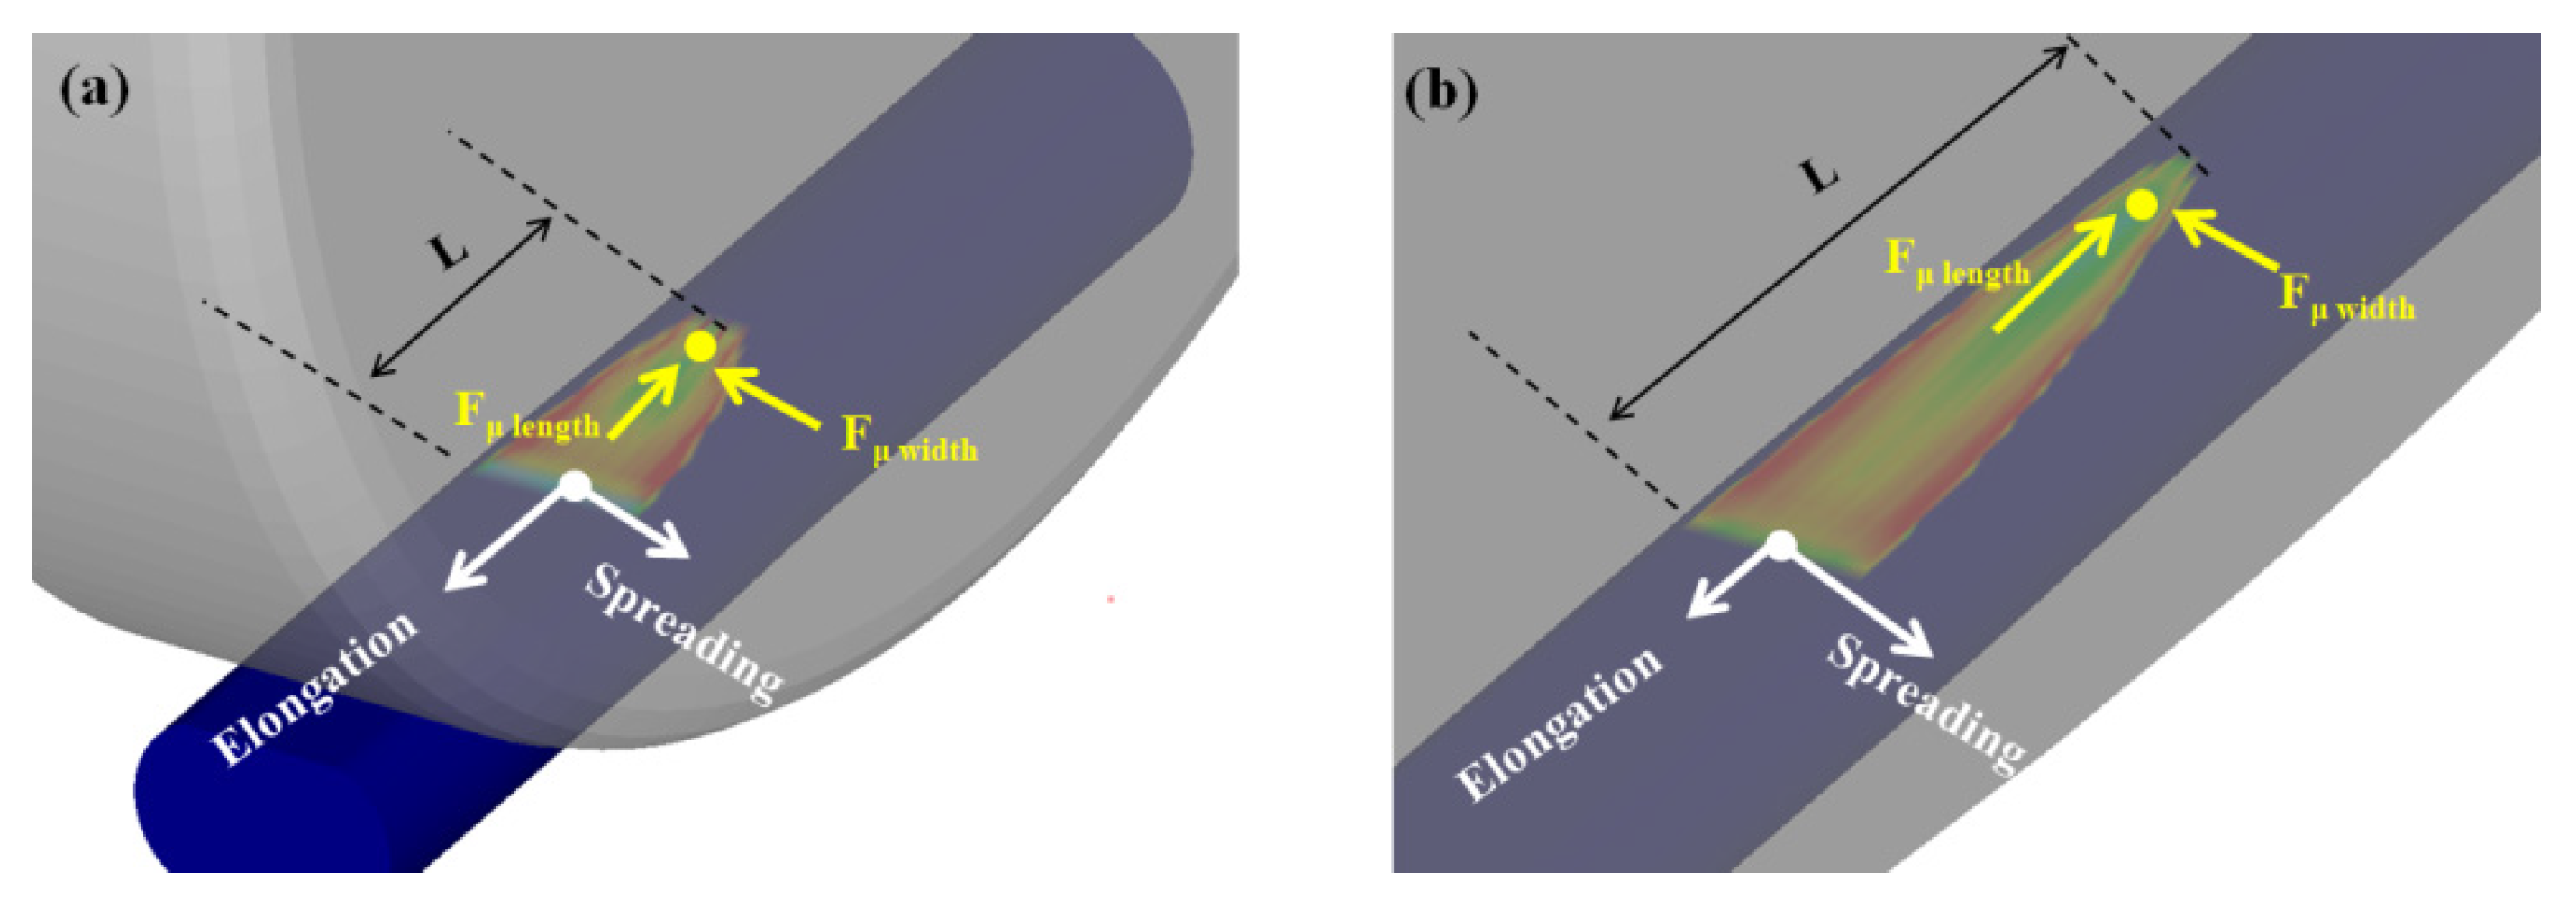
- The underlying cause of the different strain inhomogeneities, shape changes, and damage values of the flattened wire was the different contact lengths originating from the different roll diameters during wire flat rolling.
Author Contributions
Funding
Institutional Review Board Statement
Informed Consent Statement
Conflicts of Interest
References
- Kazeminezhad, M.; Taheri, A.K. Deformation inhomogeneity in flattened copper wire. Mater. Des. 2007, 28, 2047–2053. [Google Scholar] [CrossRef]
- Semiatin, S.L.; Jonas, J.J. Formability and Workability of Metals: Plastic Instability and Flow Localization; American Society for Metals: Geauga County, OH, USA, 1884. [Google Scholar]
- Qin, F.; Qi, H.; Li, Y. A Comparative Study of Constitutive Characteristics and Microstructure Evolution between Uniaxial and Plane Strain Compression of an AA6061 Alloy. J. Mater. Eng. Perform. 2019, 28, 3487–3497. [Google Scholar] [CrossRef]
- Hwang, J.K. Deformation behaviors of flat rolled wire in twinning-induced plasticity steel. Met. Mater. Int. 2020, 26, 603–616. [Google Scholar] [CrossRef]
- Hwang, J.K. Enhanced homogeneity of a flat-rolled wire in twinning-induced plasticity steel using the pass schedule design. ISIJ Int. 2020, 60, 2493–2502. [Google Scholar] [CrossRef]
- Grassel, O.; Kruger, L.; Frommeyer, G.; Meyer, L.W. High strength Fe-Mn-(Al, Si) TRIP/TWIP steels development-properties-application. Int. J. Plast. 2000, 16, 1391–1409. [Google Scholar] [CrossRef]
- Bouaziz, O.; Allain, S.; Scott, C.P.; Cugy, P.; Barbier, D. High manganese austenitic twinning induced plasticity steels: A review of the microstructure properties relationships. Curr. Opin. Solid State Mater. Sci. 2011, 15, 141–168. [Google Scholar] [CrossRef]
- Kaiso, M.; Chiba, M. Non Heat-treated Cold Heading Wire Rod for Bolts. Kobe Steel Eng. Rep. 2002, 52, 52–56. [Google Scholar]
- Kim, S.J.; Lee, T.; Hwang, J.K. High-strength bolt manufactured by an extrusion-based forming process using twinning-induced plasticity steel. J. Manuf. Process. 2020, 59, 33–42. [Google Scholar] [CrossRef]
- Kazeminezhad, M.; Taheri, A.K. The prediction of macroscopic shear bands in flat rolled wire using the finite and slab element method. Mater. Lett. 2006, 60, 3265–3268. [Google Scholar] [CrossRef]
- Kazeminezhad, M.; Taheri, A.K. The effect of 3D and 2D deformations on flattened wires. J. Mater. Process. Technol. 2008, 202, 553–558. [Google Scholar] [CrossRef]
- Masse, T.; Chastel, Y.; Montmitonnet, P.; Bobadilla, C.; Persem, N.; Foissey, S. Mechanical and damage analysis along a flat-rolled wire cold forming schedule. Int. J. Mater. Form. 2012, 5, 129–146. [Google Scholar] [CrossRef]
- Kobayashi, K.; Asakawa, M.; Kobayashi, M. Deformation behavior of round wire in compression using a cylindrical tool and the analysis of width spreading in flat rolling. Wire J. Int. 2005, 38, 74–79. [Google Scholar]
- Kazeminezhad, M.; Taheri, A.K. An experimental investigation on the deformation behavior during wire flat rolling process. J. Mater. Process. Technol. 2005, 160, 313–320. [Google Scholar] [CrossRef]
- Kazeminezhad, M.; Taheri, A.K.; Tieu, A.K. A study on the cross-sectional profile of flat rolled wire. J. Mater. Process. Technol. 2008, 200, 325–330. [Google Scholar] [CrossRef]
- Hsiang, S.H.; Lin, S.L. Modeling and optimization of caliber rolling process. J. Manuf. Sci. Eng. 2007, 129, 77–83. [Google Scholar] [CrossRef]
- Lee, Y. Prediction of the surface profile and area of the exit cross section of workpiece in round-oval-round pass sequence. ISIJ Int. 2002, 42, 726–735. [Google Scholar] [CrossRef] [Green Version]
- Wusatowski, Z. Fundamentals of Rolling; Pergamon Press: London, UK; New York, NY, USA, 1969. [Google Scholar]
- Lee, K.; Kim, B.; Kim, N. Development of Width Spread Model for High Carbon Steel Wire Rods in Flat Rolling Process. Int. J. Mech. Eng. Robot. Res. 2018, 7, 343–347. [Google Scholar]
- Fereshteh-Saniee, F.; Pillinger, I.; Hartley, P. Friction modelling for the physical simulation of the bulk metal forming processes. J. Mater. Process. Technol. 2004, 153, 151–156. [Google Scholar] [CrossRef]
- Joun, M.S.; Moon, H.G.; Choi, I.S.; Lee, M.C.; Jun, B.Y. Effects of friction laws on metal forming processes. Tribol. Int. 2009, 42, 311–319. [Google Scholar] [CrossRef]
- Kazeminezhad, M.; Taheri, A.K. Calculation of the rolling pressure distribution and force in wire flat rolling process. J. Mater. Process. Technol. 2006, 171, 253–258. [Google Scholar] [CrossRef]
- Tieu, A.K.; Liu, Y.J. Friction variation in the cold-rolling process. Tribol. Int. 2004, 37, 177–183. [Google Scholar] [CrossRef]
- Jiang, Z.Y.; Xiong, S.W.; Tieu, A.K.; Wang, Q.J. Modelling of the effect of friction on cold strip rolling. J. Mater. Process. Technol. 2008, 201, 85–90. [Google Scholar] [CrossRef]
- Utsunomiya, H.; Hartley, P.; Pillinger, I. Three-dimensional elastic-plastic finite-element analysis of the flattening of wire between plain rolls. J. Manuf. Sci. Eng. 2001, 123, 397–404. [Google Scholar] [CrossRef]
- Li, L.; Matsumoto, R.; Utsunomiya, H. Experimental study of roll flattening in cold rolling process. ISIJ Int. 2018, 58, 714–720. [Google Scholar] [CrossRef]
- Lambiase, F.; Di Ilio, A. Experimental and finite element investigation of roll drawing process. J. Mater. Eng. Perform. 2012, 21, 161–166. [Google Scholar] [CrossRef]
- Duan, X.; Sheppard, T. Three dimensional thermal mechanical coupled simulation during hot rolling of aluminium alloy 3003. Int. J. Mech. Sci. 2002, 44, 2155–2172. [Google Scholar] [CrossRef]
- Li, G.J.; Kobayashi, S. Rigid-plastic finite-element analysis of plane strain rolling. J. Eng. Ind. 1982, 104, 55–63. [Google Scholar] [CrossRef]
- Al-Salehi, F.A.R.; Firbank, T.C.; Lancaster, P.R. An experimental determination of the roll pressure distributions in cold rolling. Int. J. Mech. Sci. 1973, 15, 693–710. [Google Scholar] [CrossRef]
- Hwang, S.M.; Joun, M.S.; Kang, Y.H. Finite element analysis of temperatures, metal flow, and roll pressure in hot strip rolling. J. Eng. Ind. 1993, 115, 290–298. [Google Scholar] [CrossRef]
- Vallellano, C.; Cabanillas, P.A.; Garcia-Lomas, F.J. Analysis of deformations and stresses in flat rolling of wire. J. Mater. Process. Technol. 2008, 195, 63–71. [Google Scholar] [CrossRef]
- Carlsson, B. The contact pressure distribution in flat rolling of wire. J. Mater. Process. Technol. 1998, 73, 1–6. [Google Scholar] [CrossRef]
- Cockcroft, M.G.; Latham, D.J. Ductility and the workability of metals. J. Inst. Met. 1968, 96, 33–39. [Google Scholar]
- Oh, S.I.; Chen, C.C.; Kobayashi, S. Ductile Fracture in Axisymmetric Extrusion and Drawing—Part 2: Workability in Extrusion and Drawing. J. Manuf. Sci. Eng. 1979, 101, 36–44. [Google Scholar] [CrossRef]
- Cao, T.S.; Bobadilla, C.; Montmitonnet, P.; Bouchard, P.O. A comparative study of three ductile damage approaches for fracture prediction in cold forming processes. J. Mater. Process. Technol. 2015, 216, 385–404. [Google Scholar] [CrossRef]
- Esteban, L.; Elizalde, M.R.; Ocana, I. Mechanical characterization and finite element modelling of lateral spread in rolling of low carbon steels. J. Mater. Process. Technol. 2007, 183, 390–398. [Google Scholar] [CrossRef]


Publisher’s Note: MDPI stays neutral with regard to jurisdictional claims in published maps and institutional affiliations. |
© 2021 by the authors. Licensee MDPI, Basel, Switzerland. This article is an open access article distributed under the terms and conditions of the Creative Commons Attribution (CC BY) license (https://creativecommons.org/licenses/by/4.0/).
Share and Cite
Hwang, J.-K.; Kim, S.-J.; Kim, K.-J. Influence of Roll Diameter on Material Deformation and Properties during Wire Flat Rolling. Appl. Sci. 2021, 11, 8381. https://doi.org/10.3390/app11188381
Hwang J-K, Kim S-J, Kim K-J. Influence of Roll Diameter on Material Deformation and Properties during Wire Flat Rolling. Applied Sciences. 2021; 11(18):8381. https://doi.org/10.3390/app11188381
Chicago/Turabian StyleHwang, Joong-Ki, Sung-Jin Kim, and Kee-Joo Kim. 2021. "Influence of Roll Diameter on Material Deformation and Properties during Wire Flat Rolling" Applied Sciences 11, no. 18: 8381. https://doi.org/10.3390/app11188381
APA StyleHwang, J.-K., Kim, S.-J., & Kim, K.-J. (2021). Influence of Roll Diameter on Material Deformation and Properties during Wire Flat Rolling. Applied Sciences, 11(18), 8381. https://doi.org/10.3390/app11188381