Article

Application of Multi-System Combination Precise Point Positioning in Landslide Monitoring

1
College of Environment and Safety Engineering, Fuzhou University, Fuzhou 350108, China
2
School of Earth Sciences, Yunnan University, Kunming 650091, China
3
The Academy of Digital China, Fuzhou 350108, China
4
Opening Fund of Key Laboratory of Geohazard Prevention of Hilly Mountains, Ministry of Natural Resources (Fujian Key Laboratory of Geohazard Prevention), Fuzhou 350002, China
5
College of Geodesy and Geomatics, Shandong University of Science and Technology, Qingdao 266590, China
*
Author to whom correspondence should be addressed.
Appl. Sci. 2021, 11(18), 8378; https://doi.org/10.3390/app11188378
Submission received: 30 June 2021 / Revised: 25 August 2021 / Accepted: 1 September 2021 / Published: 9 September 2021
(This article belongs to the Special Issue GNSS Techniques for Land and Structure Monitoring)

Abstract

:
To verify the positioning performance and reliability of multi-system combination Precise Point Positioning in landslide monitoring, we carried out a multi-system combination Precise Point Positioning calculation experiment on the monitoring data of a single landslide disaster area in Fujian Province. The coordinates of the monitoring points obtained by a continuously operating reference station and the monitoring station for static relative positioning were used as reference values. The GPS system was used as the standard system and the combined PPP solution mode of G/R/C, G/R/E and G/R/E/C was used to obtain the surface displacement of the landslide area. The research showed that multi-system combination PPP converges to the centimeter level in about 30 min. The average value of internal accordant precision was more than 1 mm after convergence, and that of the external accordant precision was more than 5 cm, which meets the centimeter-level accuracy requirements in rapid landslide deformation monitoring.

1. Introduction

As a sudden geological disaster, landslides are highly destructive and severely harmful to people’s lives, property and safety. As the source of disasters is usually located in the middle and upper part of mountains and the vegetation coverage is high in most areas, it is often difficult for geological survey personnel to reach them, and thus these areas are characterized by strong concealment and difficult investigation [1,2]. The questions of how to strengthen the monitoring of the hidden danger of geological disaster, make timely discoveries and effectively identify the potential landslide disaster have become the focus and difficulty of geological disaster prevention and control.
Traditional landslide deformation monitoring uses a total station and level to monitor the displacement changes in the slope development process, which has some shortcomings, such as long monitoring periods, the significant influence of terrain, difficult measurement, high labor intensity and poor real-time performance [3,4,5]. Since the 1990s, differential GNSS positioning technology has been widely used in geological hazard monitoring [6,7]. By using two GNSS receivers to form double difference observation values, common errors such as the receiver clock error and satellite clock error can be eliminated, and strong correlation errors such as tropospheric delay and ionospheric delay can be lessened. The positioning accuracy can reach centimeter level or even millimeter level [8,9]. However, differential GNSS positioning technology requires at least one receiver to be placed on a known station for observation. When the number of visible satellites is limited, the distance between the known point and the monitoring point is too far, the environment is complex, and the height difference is too large, then the positioning accuracy is not high [10]. In 1997, American Jet Power Laboratory (JPL) [11] presented a high-precision, non-differential GPS single-point absolute positioning technology called Precise Point Positioning (PPP). It is made of a single GNSS receiver, using an IGS (International GNSS Services) center to provide the precision of satellite orbit and clock products, for a variety of model to intensive model error corrections. It uses the acquisition of pseudo-range and phase observation values to obtain high precision for coordinates of the designated position according to the earth’s international frame of reference. Without the support of the reference station, the accuracy of PPP can reach a decimeter or centimeter scale. Under the condition of long-time static observation, it can achieve the same accuracy as traditional differential GPS positioning [12]. Because of the rapid development of the multi-system GNSS and the growing maturity of precision satellite orbit and precision clock calibration products provided by IGS, the application of multi-system GNSS PPP technology is the current research hotspot. Domestic and foreign scholars have studied GPS/BDS [13,14,15,16], GPS/GLONASS [17,18,19], BDS/GPS/GLONASS [20,21], GPS/BDS/Galileo/GLONASS [22,23,24,25] and other combination modes. A large number of studies have shown that the PPP results of different combinations are different in terms of convergence time and positioning accuracy. In the case of fewer visible satellites and a complex surrounding environment, multi-system combination PPP has obvious advantages. In the application of PPP technology in landslide monitoring, Wang [26] used GIPSY’s PPP module to calculate the GPS data of peristaltic landslides for two years in a row. The study showed that the resolution accuracy of horizontal and elevation directions with an observation duration of 24 h was 2-3 mm and 8 mm, respectively. When there was no extreme weather in the observation period, the accuracy of the horizontal direction was 5 mm for the observation period of 4 h, and the accuracy of the elevation direction was 10 mm for the observation period of 8 h. Capillia et al. [27] used a special instrument to carry out a landslide simulation experiment and used PPP technology to solve the problem. The study showed that the average deviation of real-time PPP in the north, east and elevation directions was 2 cm. Zhang et al. [28] calculated 6-12 hours of monitoring data of a landslide area in southern Gansu through GAMIT and PANDA PPP modules. The experimental results showed that using the GAMIT PPP module in calculating the coordinates of the accuracy and precision of relative positioning algorithms to obtain the coordinates of the amount of change can be reflected to five decimal places, and GAMIT and PANDA PPP modules of coordinate difference variation can be reflected to more than six decimal places, which satisfies the precision requirement of rapid landslide monitoring. Huang et al. [29] discussed the calculation accuracy of GNSS PPP and RTK in a large-scale loess landslide, and the study showed that the BDS/GPS combination significantly improved the accuracy compared with the single system. The positioning accuracy of RTK was better than 3 mm and could be used for real-time monitoring of the landslide, while the positioning accuracy of PPP was better than 6 cm and could be used for the maintenance of deformation data. Peng et al. [30] took the data of eight monitoring stations in the Xishan Village landslide area of Sichuan Province for 16 months as the data source and discussed the positioning accuracy and reliability of GPS PPP, BDS PPP and GPS/BDS combined PPP. The results showed that the mean square error of GPS PPP, GPS/BDS PPP, GPS/BDS combined PPP was about 1 cm, 2 cm, and 5 cm, respectively, which meets the accuracy requirements of landslide monitoring in mountainous areas.
At present, the application of PPP in landslide monitoring is mostly single-system PPP or dual-system combined PPP [31,32], and scholars have barely discussed the accuracy, reliability and calculation rate of multi-system combined PPP in landslide monitoring in a continuous period. Their conclusions show that the combined system has greater improvement in positioning stability, continuity and positioning accuracy than the single positioning system, but the specific values are not shown. Therefore, based on the static experiment and dynamic simulation experiment research, this paper experimented with monitoring data of one single landslide disaster area in Fujian province. The coordinates of the monitoring points obtained by static relative positioning between the continuously running reference station and the monitoring station are used as the reference value, and the GPS system is used as the reference system, showing the multi-system combination of G/R/C, G/R/E and G/R/E/C to have better positioning performance, which verifies the positioning performance and reliability of multi-system combination PPP in landslide monitoring.

2. PPP Model and Evaluation Index

The traditional PPP function model is a combination of eliminating the ionosphere between the dual-frequency pseudo-distance and the phase observation. When a GNSS precision product is used, the observation equation is [33,34]:
{ P I F S = ρ S + c d t ¯ S + T S + ε ( P I F S ) L I F S = ρ S + c d t ¯ S + T S + λ S N ¯ S + ε ( L I F S )
where:
  • S = satellite system;
  • IF = ionospheric cancellation combination;
  • P = observation value of pseudo-distance;
  • L = phase observation;
  • ρ = geometric distance;
  • c = speed of light;
  • T S = tropospheric delay;
  • d t ¯ S = receiver clock difference;
  • λ S = wavelength;
  • N ¯ S = ambiguity;
  • ε ( P I F S ) = pseudo-range observation noise;
  • ε ( L I F S ) = phase observation noise.
The error caused by the earth’s tides, phase entanglement and earth’s rotation have been corrected according to the corresponding model and therefore are not listed in the formula.
Inter-system Bias (ISB) parameter estimation is required when multi-system GNSS combined PPP is carried out. The observation equation of dual-system combined PPP is:
{ P I F B = ρ B + c d t ¯ B + T B + ε ( P I F B ) L I F B = ρ B + c d t ¯ B + T B + λ B N ¯ B + ε ( L I F B ) P I F S i = ρ S i + c d t ¯ B + I S B B , S i + T S i + ε ( P I F S i ) L I F S i = ρ S i + c d t ¯ B + I S B B , S i + T S i + λ S i N ¯ S i + ε ( L I F S i )
where:
  • B = reference satellite system;
  • Si = rest of the constellations except the base system, i = 1,2,3;
  • I B S B , S i = system deviation between the base system and the rest of the system.
As the tropospheric error, ionospheric error and multipath error are strongly correlated with the satellite altitude angle, in order to reduce the impact of errors on PPP positioning performance, the altitude angle stochastic model is adopted in this paper. As the noise and multi-path errors of the satellite observations are concentrated in the low altitude satellite, in order to reduce the weight of the low altitude satellite observations, the piecewise weighting strategy is adopted in this paper. The calculation formula of the pseudorange observation and phase observation is as follows [35]:
σ P 2 = { σ P , 0 2 sin θ , θ > α σ P , 0 2 sin 2 θ , θ α , σ L 2 = { σ L , 0 2 sin θ , θ > α σ L , 0 2 sin 2 θ , θ α
where:
  • σ P , 0 2 = prior variances of pseudo-range;
  • σ L , 0 2 = phase observations;
  • α = the height of the angle threshold (30°).
The signal of the GLONASS system is transmitted by frequency-division multiple access, which leads to different hardware delays in its receiving channels. If the hardware delay is estimated as an unknown parameter, the parameter estimation result will be unstable due to too many parameters being estimated. Therefore, the processing strategy of giving a small weight to the observed value of GLONASS is usually adopted [18]. Therefore, the empirical model is used to set the ratio of pseudo-distance standard deviation and phase standard deviation of the reference system and auxiliary system:
σ B , P : σ S 1 , P : σ S 2 , P : σ S 3 , P = 1 : 2 : 2 : 2 σ B , L : σ S 1 , L : σ S 2 , L : σ S 3 , L = 1 : 2 : 2 : 2
where:
  • σ B , P = standard deviation of pseudo-range observations of reference system (3 m);
  • σ S i , P = standard deviation of pseudo-range observations of auxiliary system (6 m);
  • σ B , L = standard deviation of phase observation of reference system (0.003 m);
  • σ S i , L = standard deviation of phase observation of auxiliary system (0.006 m).

3. Quantitative Evaluation Index

3.1. Convergence Time

Convergence time refers to the number of periods required from the first period to the time when the calculation accuracy meets the limit requirements, which includes the threshold value of point-position accuracy and the number of continuous periods. If an epoch of one-dimensional (north (N), east (E), elevation (U)), two-dimensional (2D) or three-dimensional (3D) is within the scope of the deviation between the set point precision of threshold, and from this epoch back n consecutive epochs, the deviations satisfy this condition. This epoch is determined as the initial epoch converging in this dimension, and the observation time from the first epoch to this epoch is the convergence time. The threshold value of point accuracy is [−0.1 m, +0.1 m], and the number of continuous epochs is 20 in the static simulation and dynamic experiment. The calculation formula for the convergence time is:
C T = S I × L
where:
  • CT = convergence time (min);
  • SI = sampling interval;
  • L = the number of epochs required from the beginning of the first epoch until the calculation accuracy meets the limitation requirements.

3.2. Root Mean Square Error

The Root Mean Square Error (RMSE) reflects the difference between the estimated value and the reference value, and is expressed as:
R M S E = i = k n ( P i P ^ ) 2 n k
where:
  • k = initial epoch at the time of convergence time;
  • n = total epoch;
  • Pi = parameter to be estimated;
  • P ^ = the reference value.

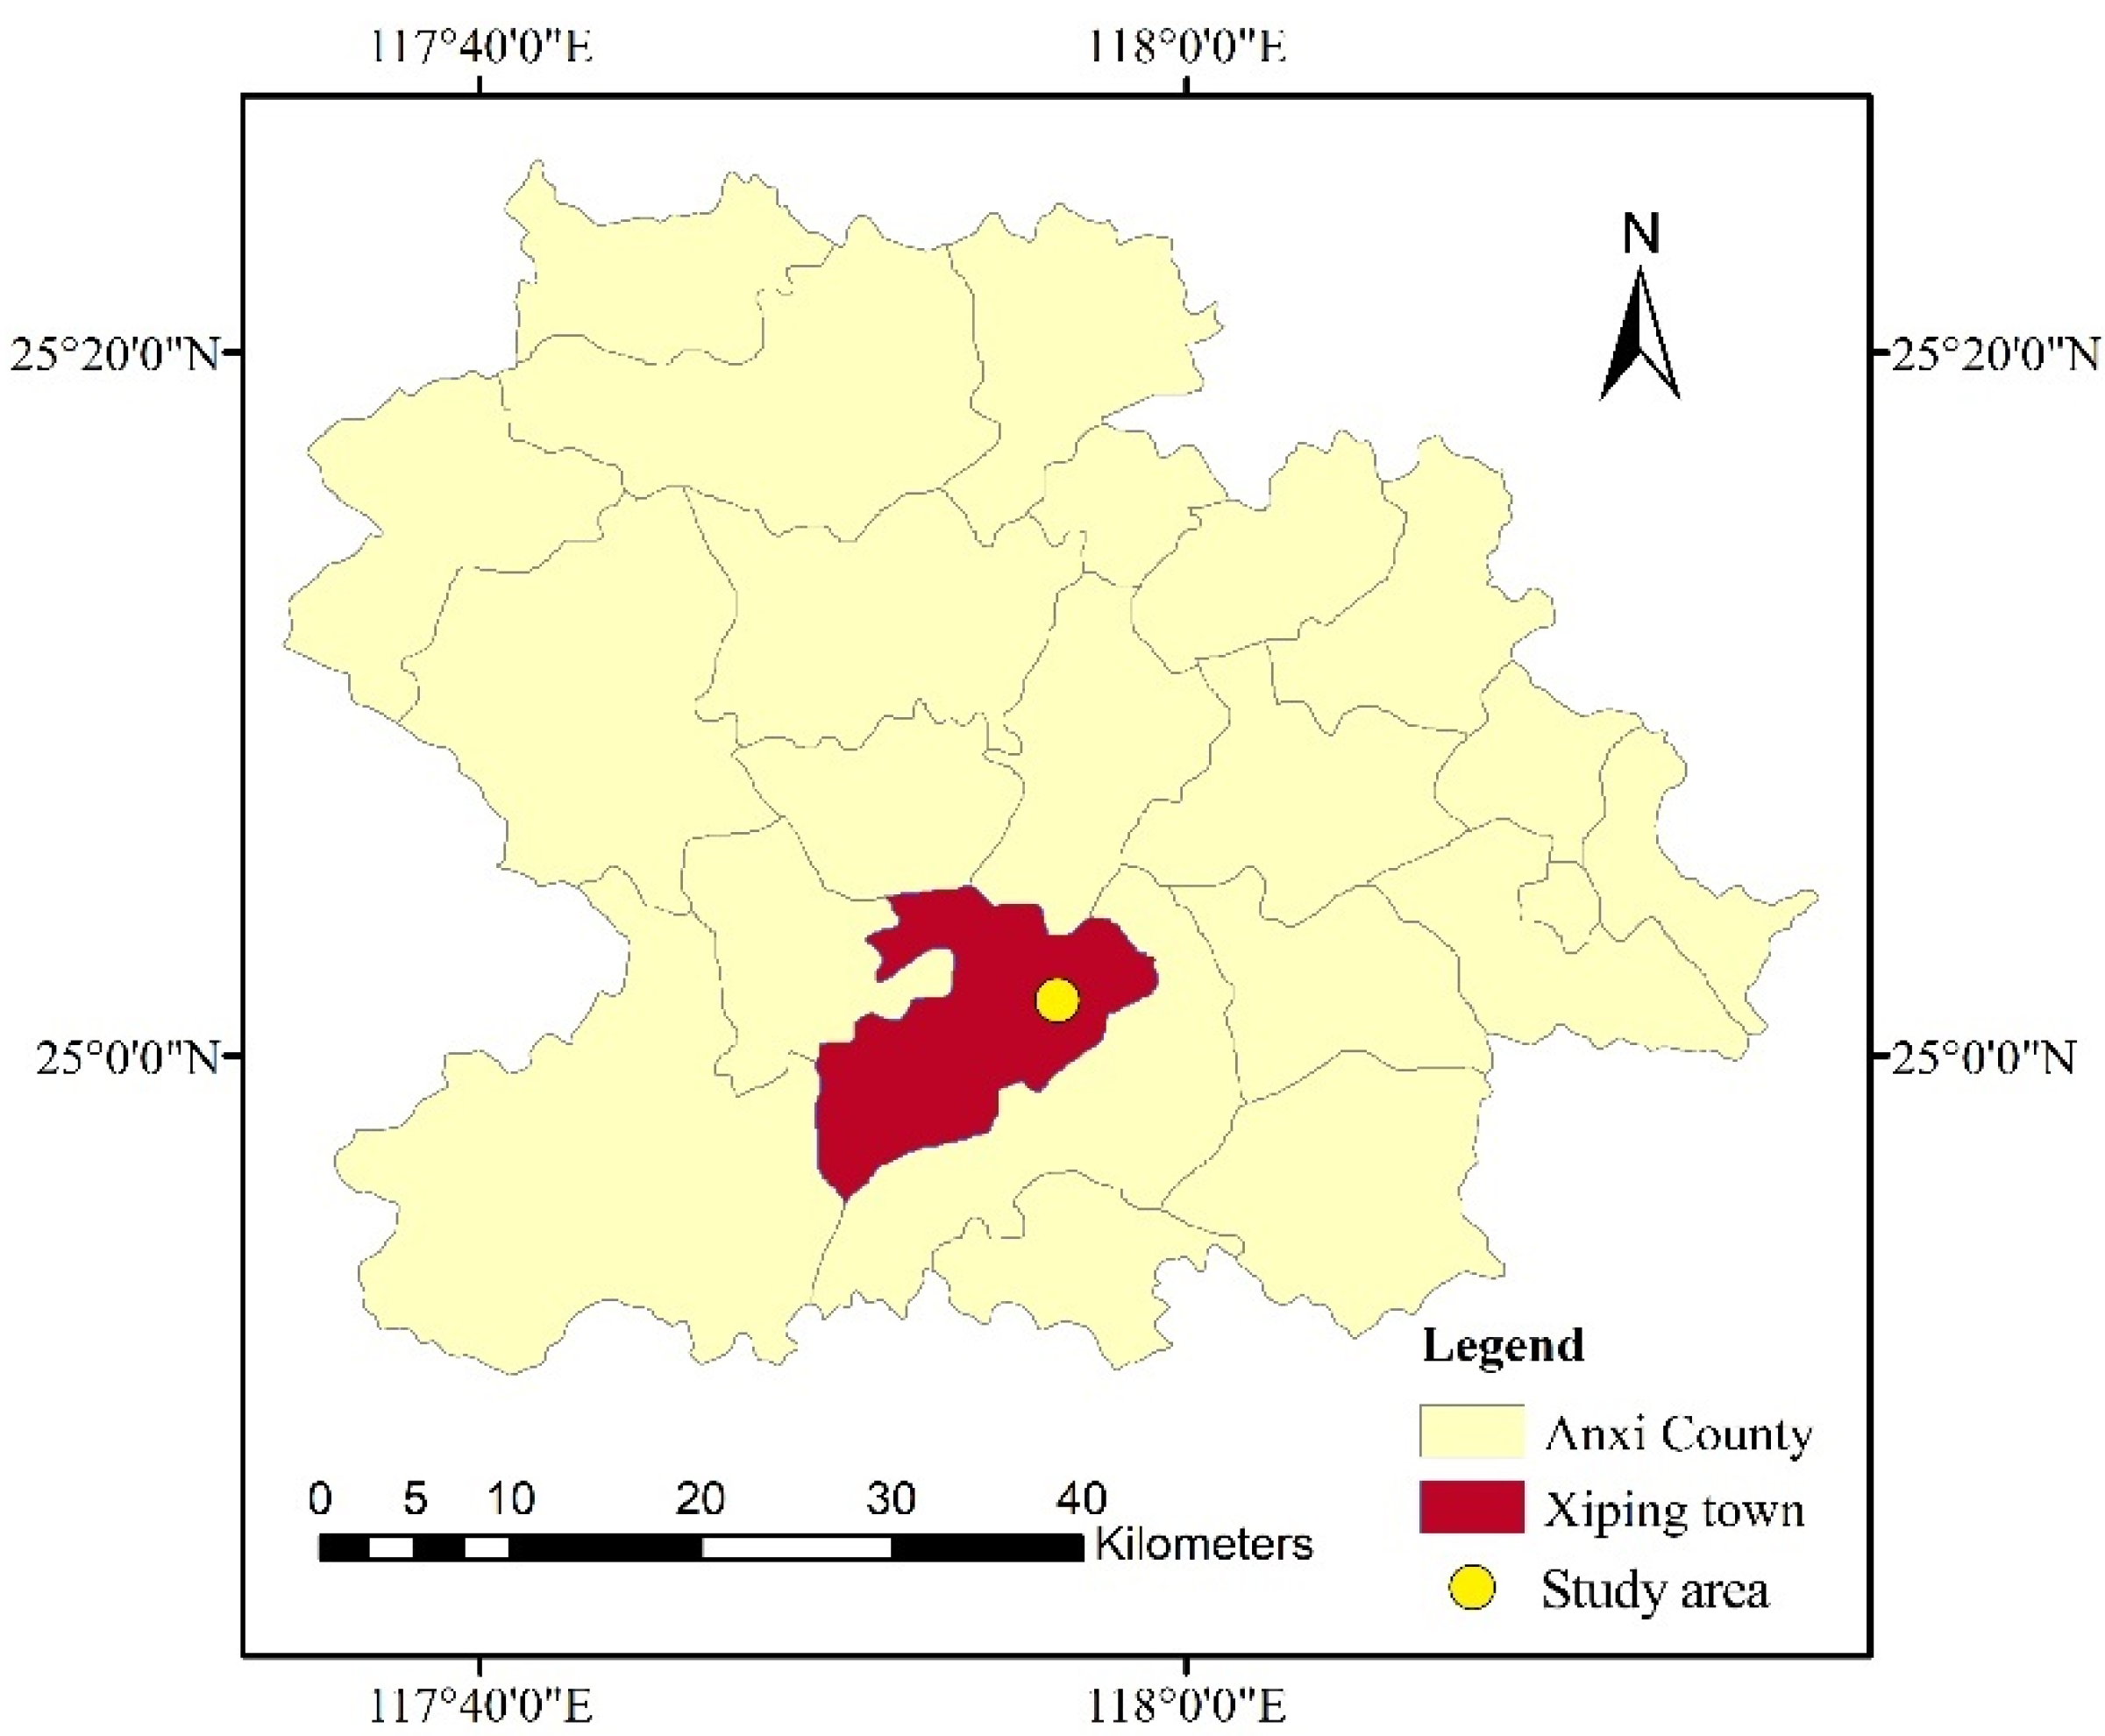
4. Overview of the Study Area

The study area is located in the northwest of Quanzhou City, Fujian Province (Figure 1). It is a medium–low mountain landform of tectonic erosion, with the highest elevation of 957 m, the lowest elevation of 290 m and the height difference of 650 m. The landslide area is located at the foot of the middle and front slope. Topographically, the boundary of 470 m and 350 m constitutes the junction of steep and slow slopes. The elevation of 290 m~350 m is the gentle slope, and the slope is about 5°~10°. The elevation of 350 m~470 m is the area where villagers gather in Yaoshan. The human engineering reconstruction is intense. The overall slope is about 15°~20°, and the slope of some artificial slopes behind the house can reach 50°~70°. The elevation of 470 m~957 m is a steep slope, and the slope is about 35°~40°. Slope body planting of tea, vegetables and other cash crops, and dense vegetation, has a coverage rate of 70~80%.

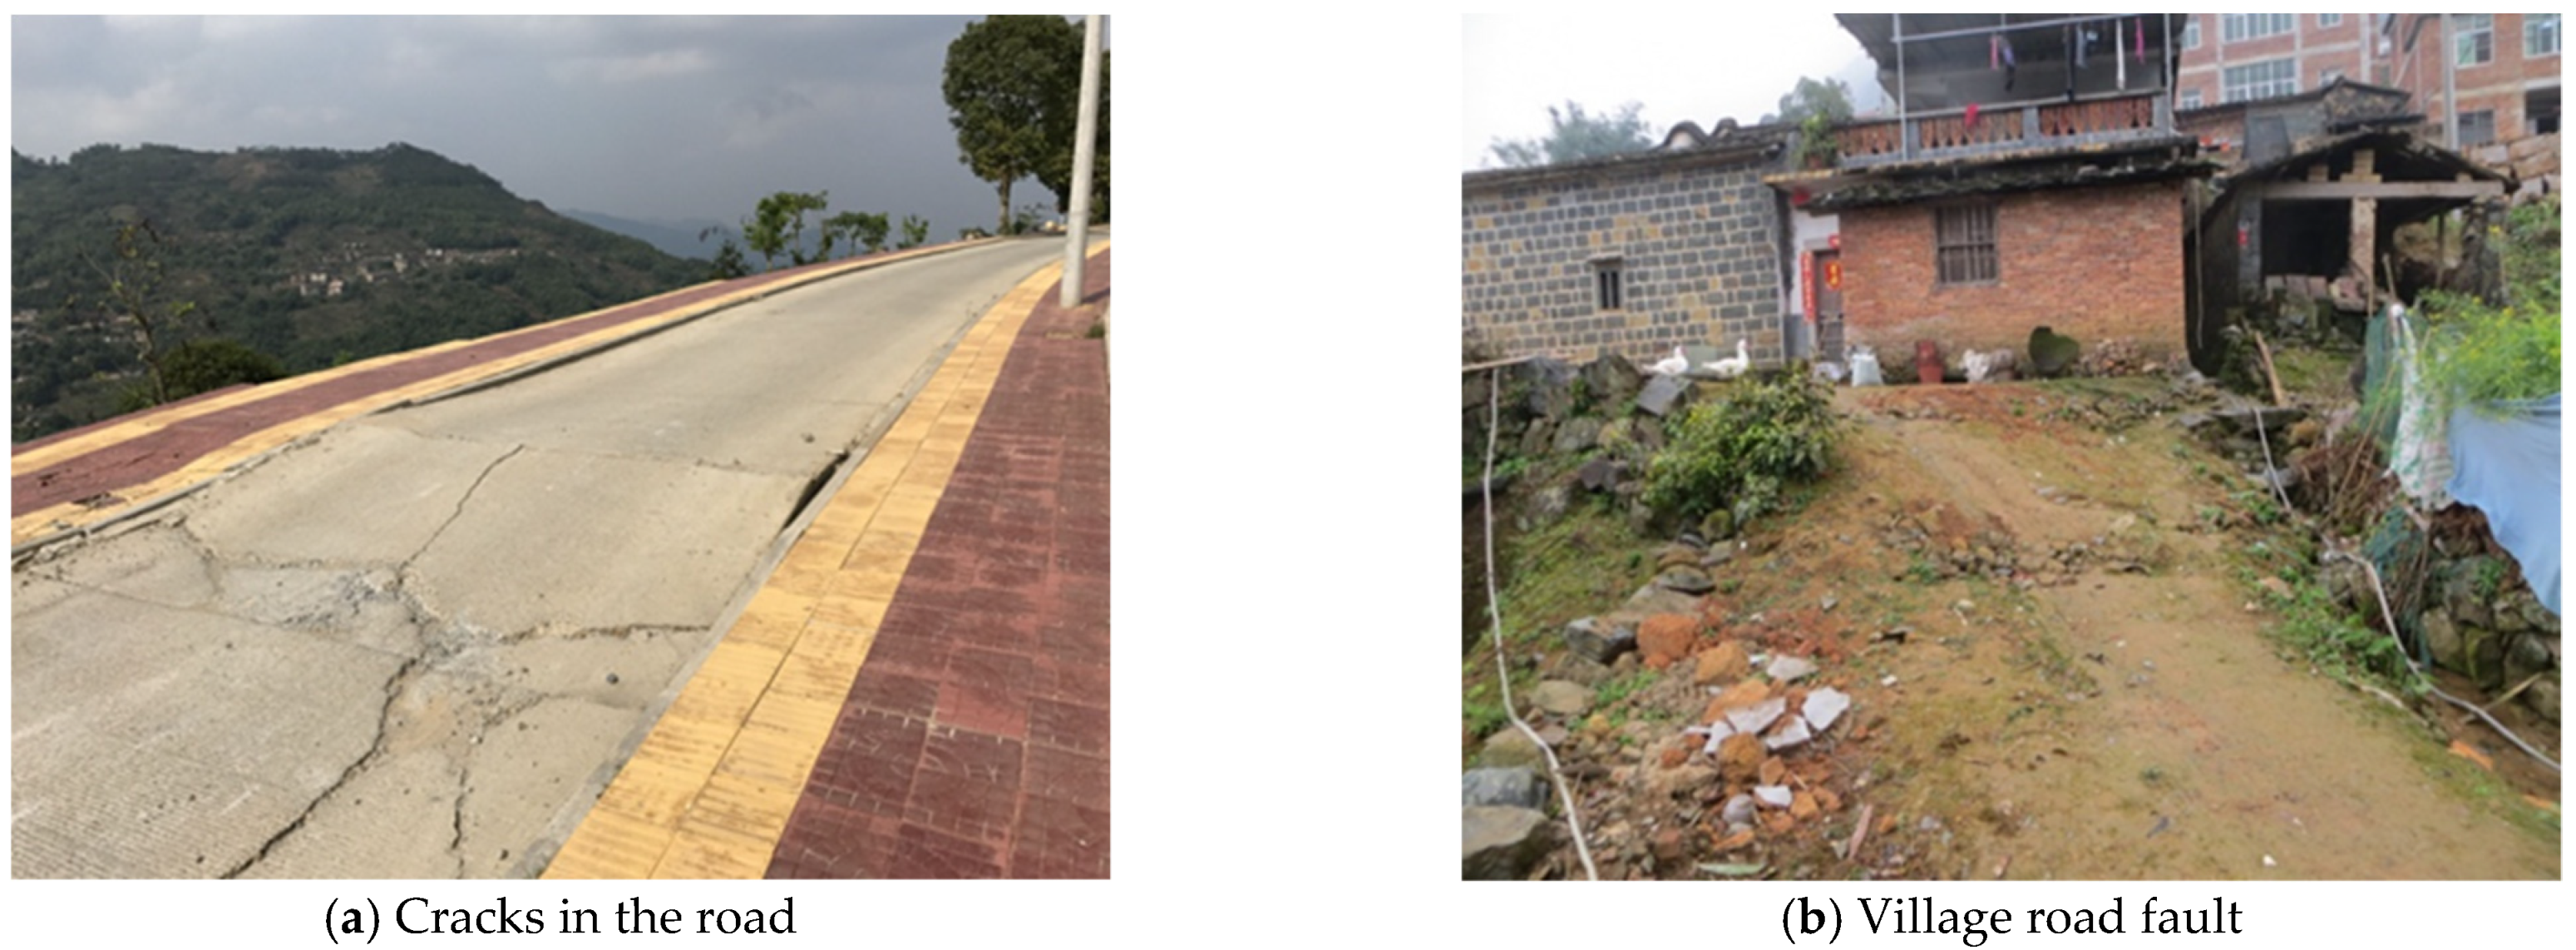
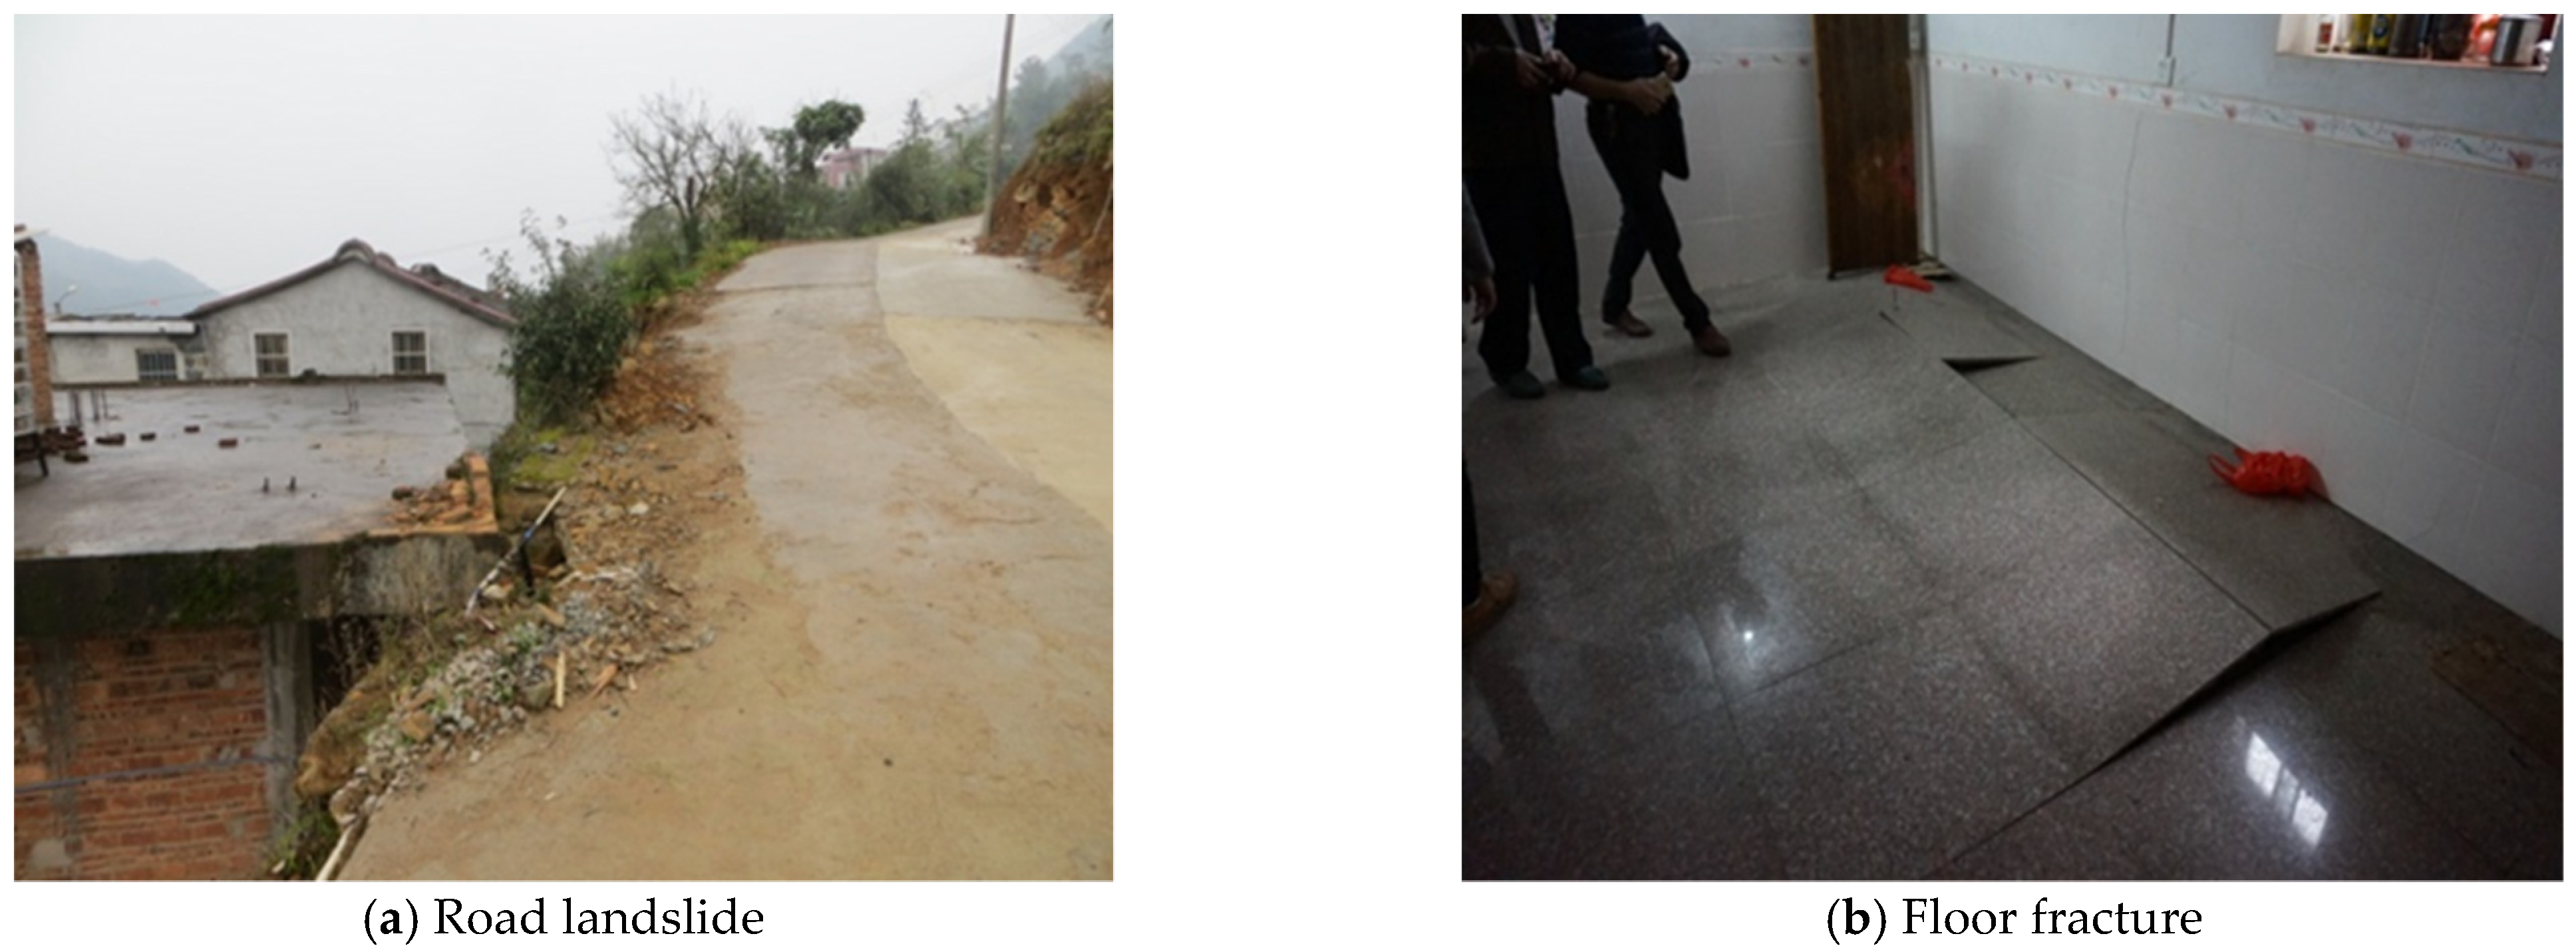
4.1. Basic Characteristics of Landslides in the Study Area

There are many transverse and oblique tensile cracks in the slope in the study area and they are mainly scattered highway cracks, up to dozens of which are distributed in the elevation of 360 m~470 m. They are perpendicular to the direction of the highway and intersect locally. The shape is zigzag, the nature is mainly subsidence-type tension, and locally it is shearing. The extension length is about 5 m~15 m, the opening is about 5 cm~15 cm, and the visible depth is 10 cm~20 cm. The rock mass near the air side near the local crack also shows the characteristics of down-fault, with a height of about 10 cm~20 cm (Figure 2 and Figure 3). The overall characteristics of the slope body are “heavy rain big slippery, light rain small slippery, no rain not slippery”.

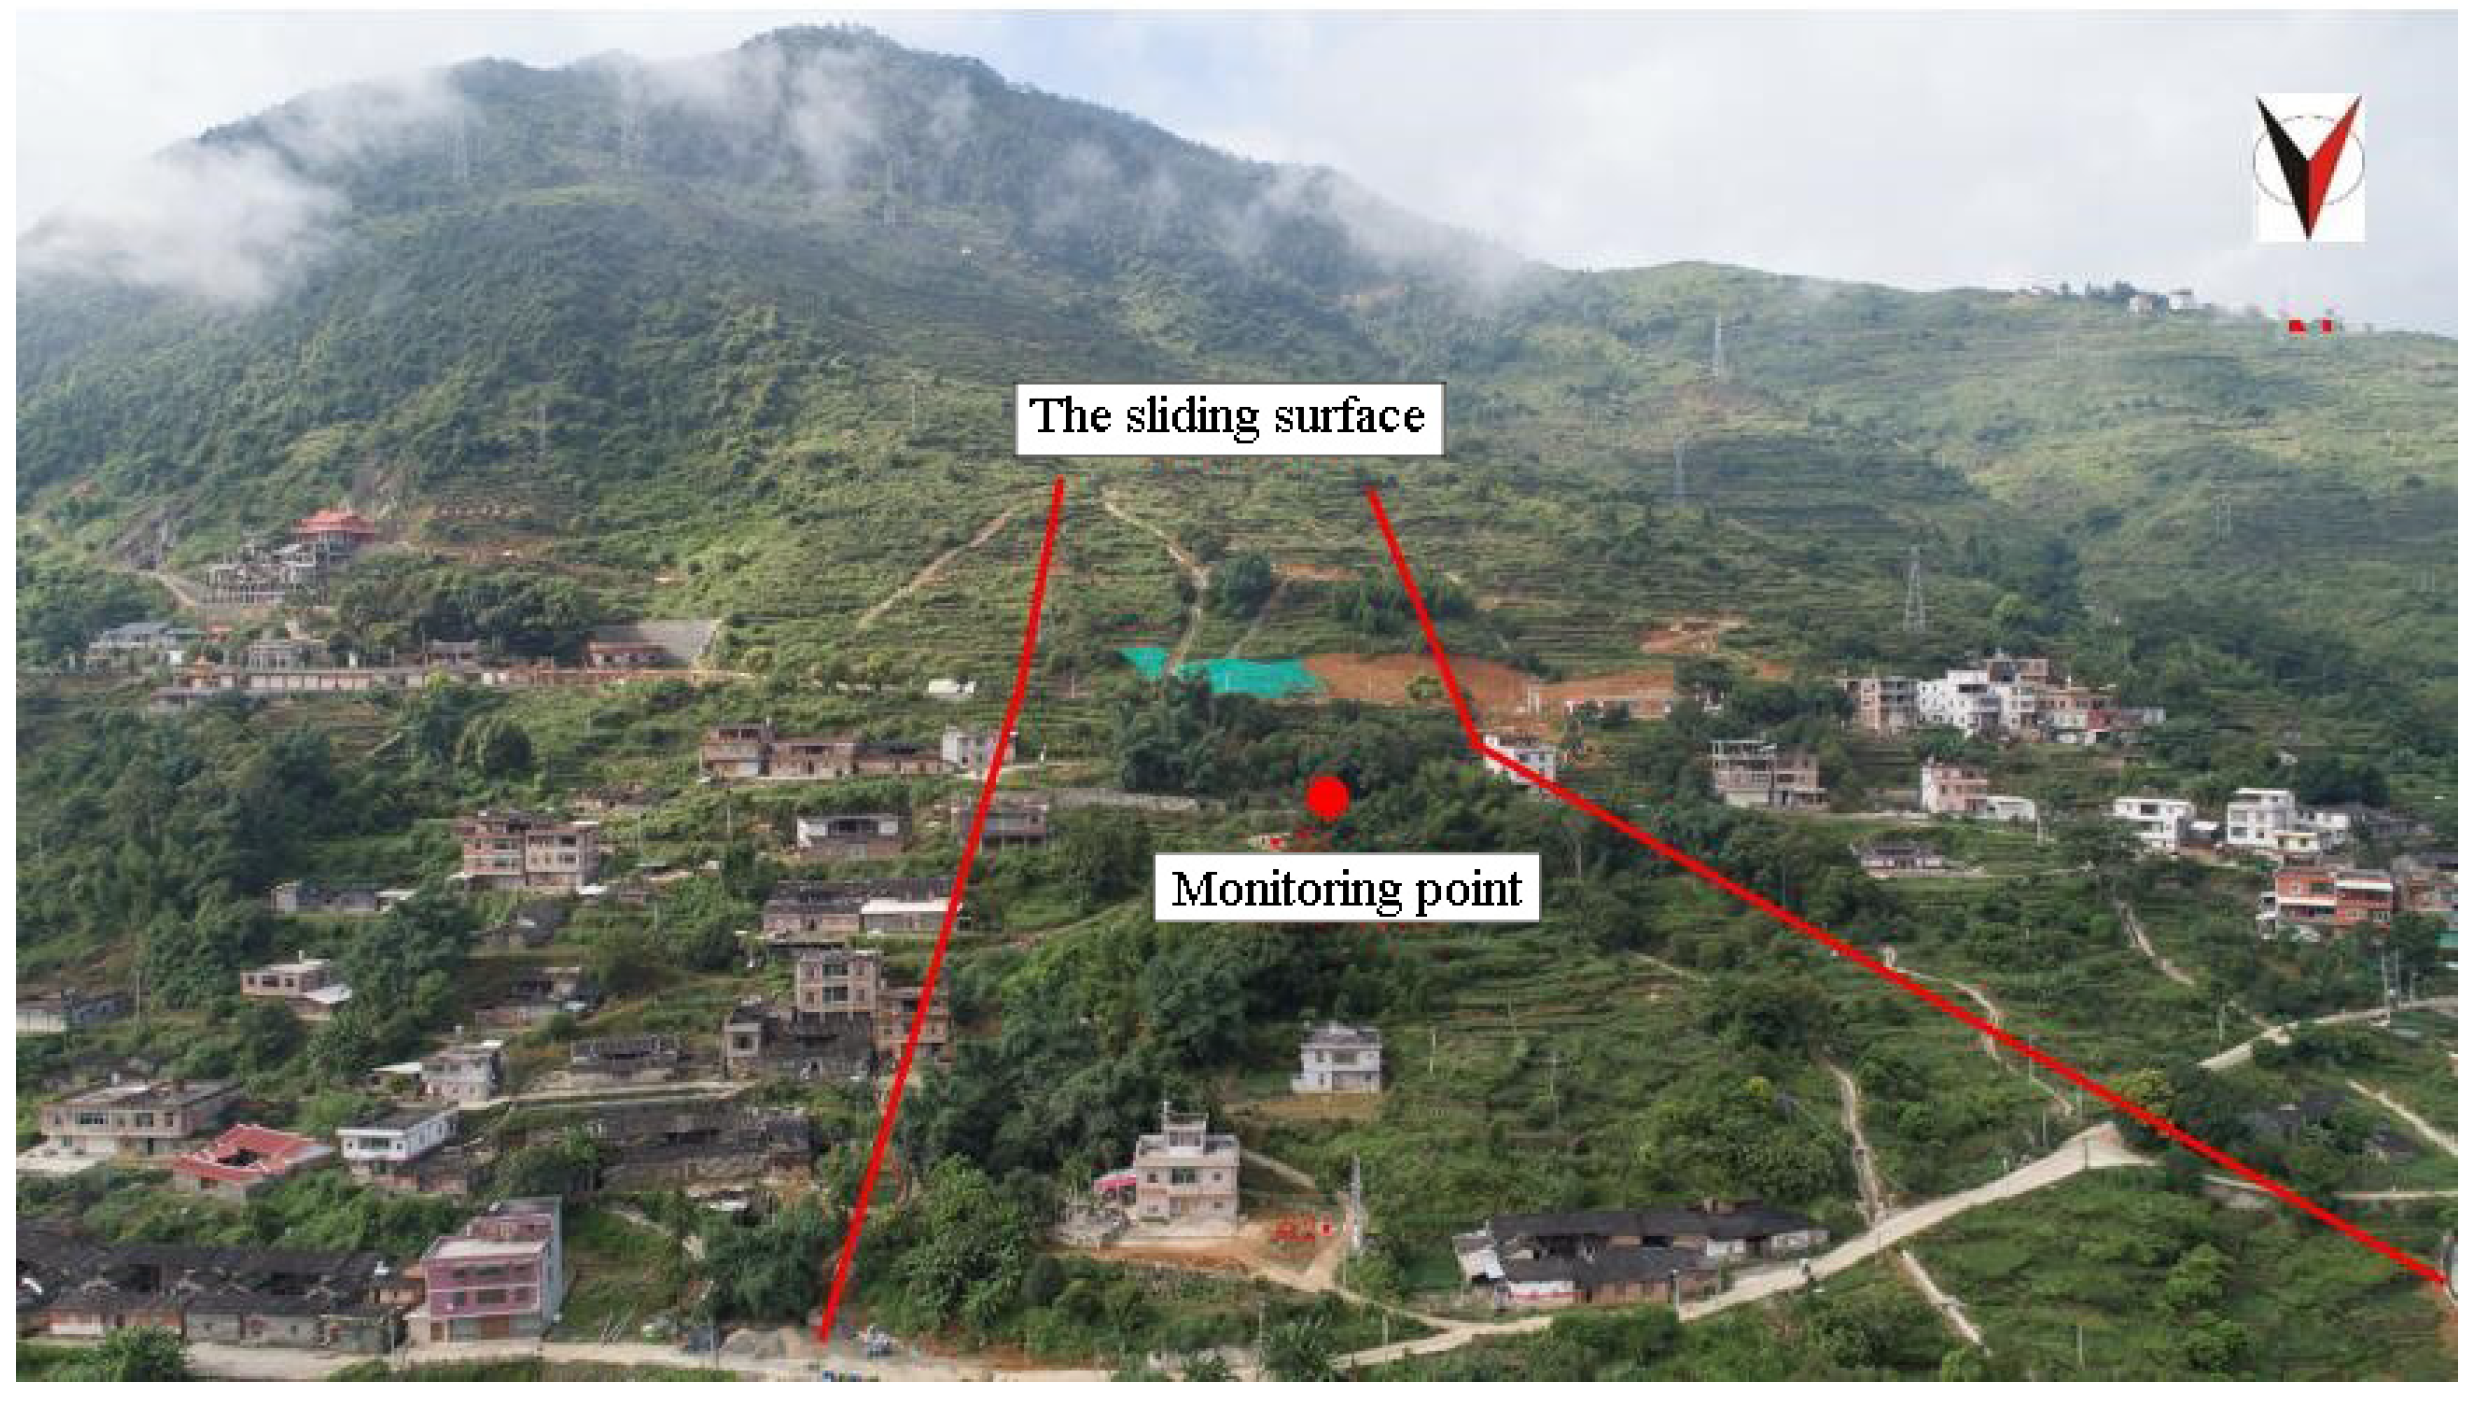
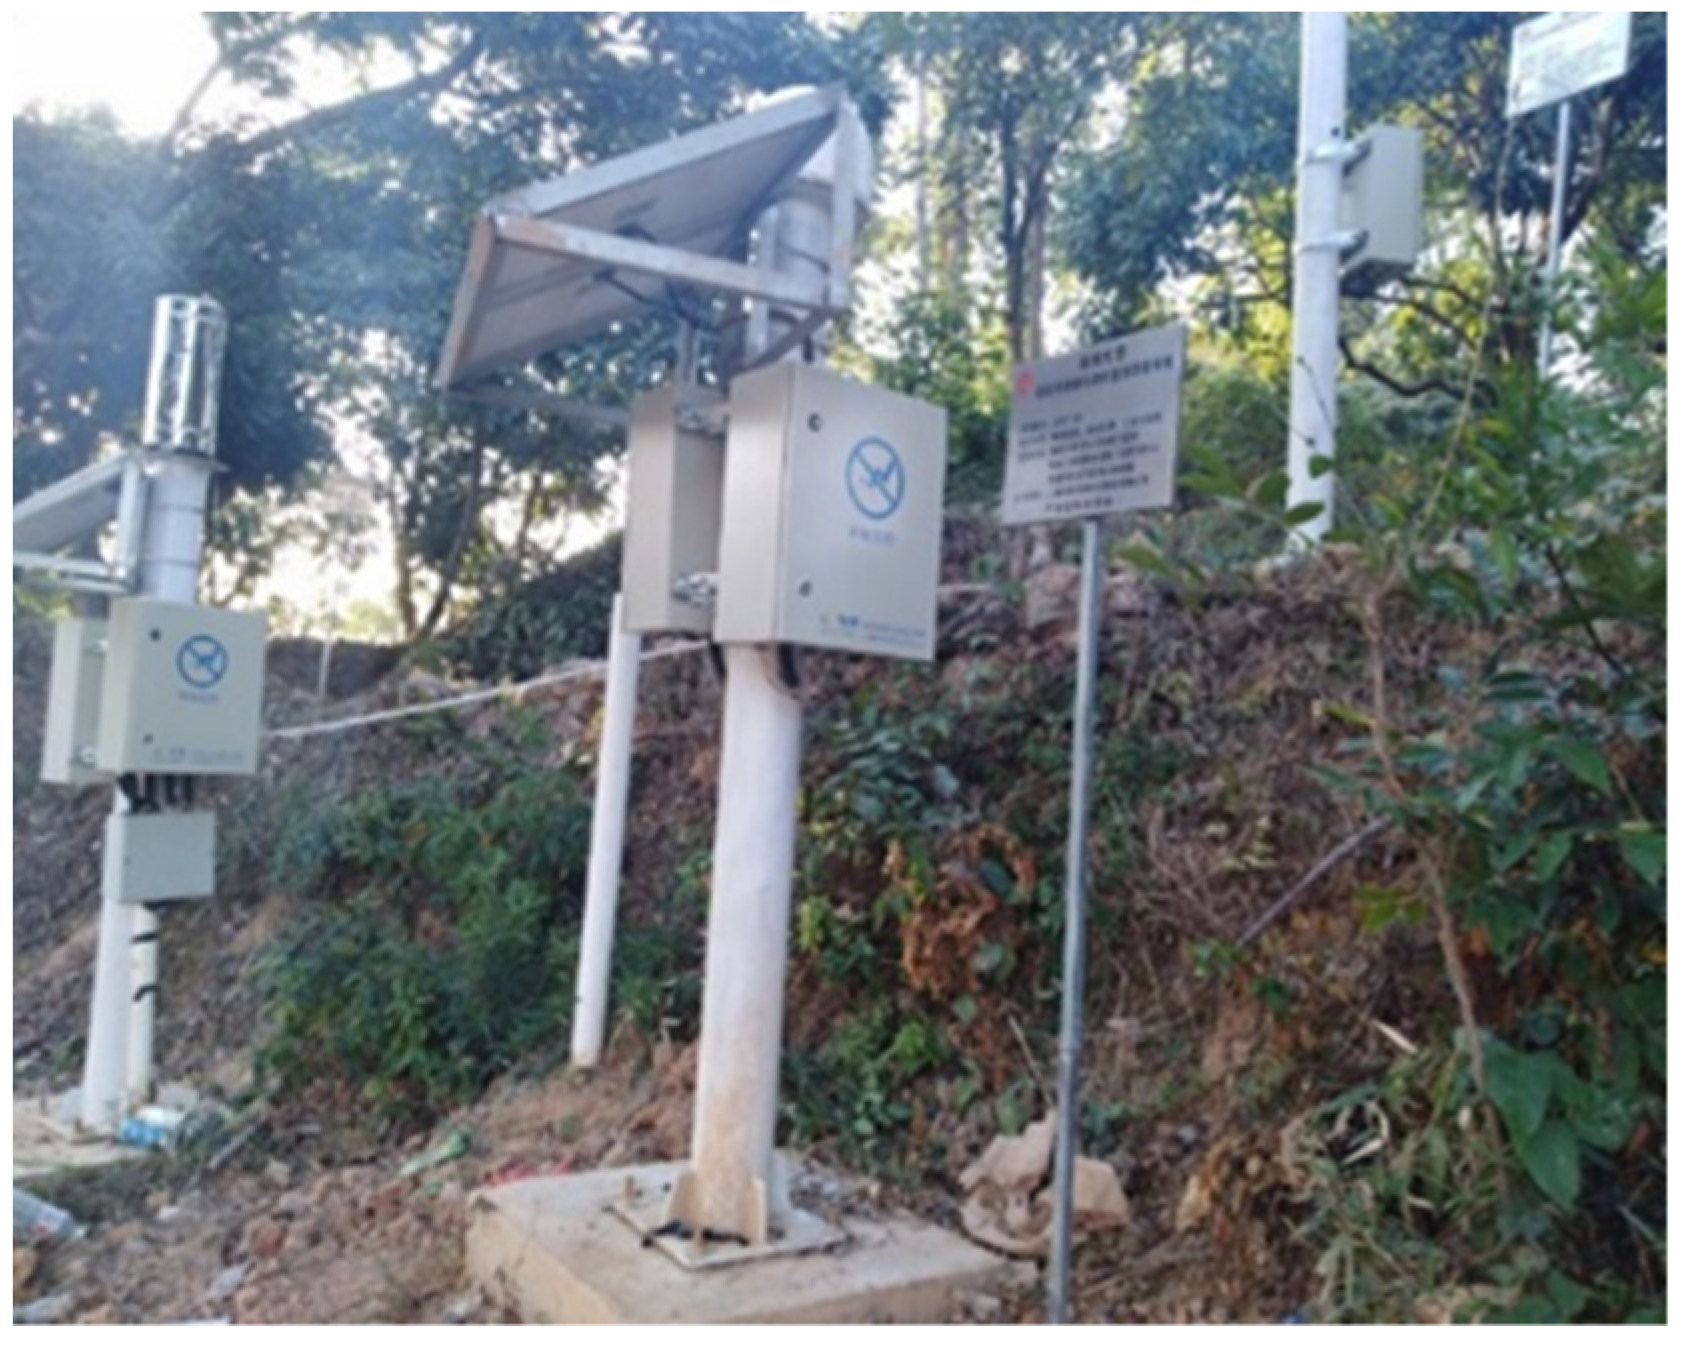
4.2. Location of Monitoring Points

According to a large amount of survey data in the early stage, the deformation range of the landslide study area, the position of the main sliding surface and the position of the monitoring point are determined (Figure 4). Within the solid red line is the influence range of the landslide area. The location of GNSS monitoring points (Figure 5) is near the central axis of the landslide study area, which can effectively monitor the displacement variation of the monitoring points in the study area in real time. The continuously operating monitoring station is equipped with an N72 receiver, A220GR choke antenna, solar panels, lightning rods and other equipment.

5. Application of Multi-System Combination PPP in Landslide Monitoring

Using the landslide monitoring data of 18 June 2019~18 January 2020 in the research area, the monitoring data were processed and analyzed by static relative positioning technology, and the displacement of the monitoring point was obtained. The relative accuracy of the baseline vector is better than 0.1 ppm, the position accuracy of the plane direction is better than 2 mm and the position accuracy of the elevation direction is better than 5 mm. The traditional measurement methods through precision level measurement validate the results of the static relative positioning. The results show that the static relative positioning monitoring results and precision level measurement results are basically identical and have high precision and reliability. In this paper, the coordinates of monitoring points obtained by static relative positioning technology are taken as reference values, and the convergence time, positioning accuracy and stability of multi-system combined PPP technology in landslide monitoring are emphatically discussed. To be concise, GPS, GLONASS, Galileo and BDS are represented by the letters G, R, E and C, respectively.

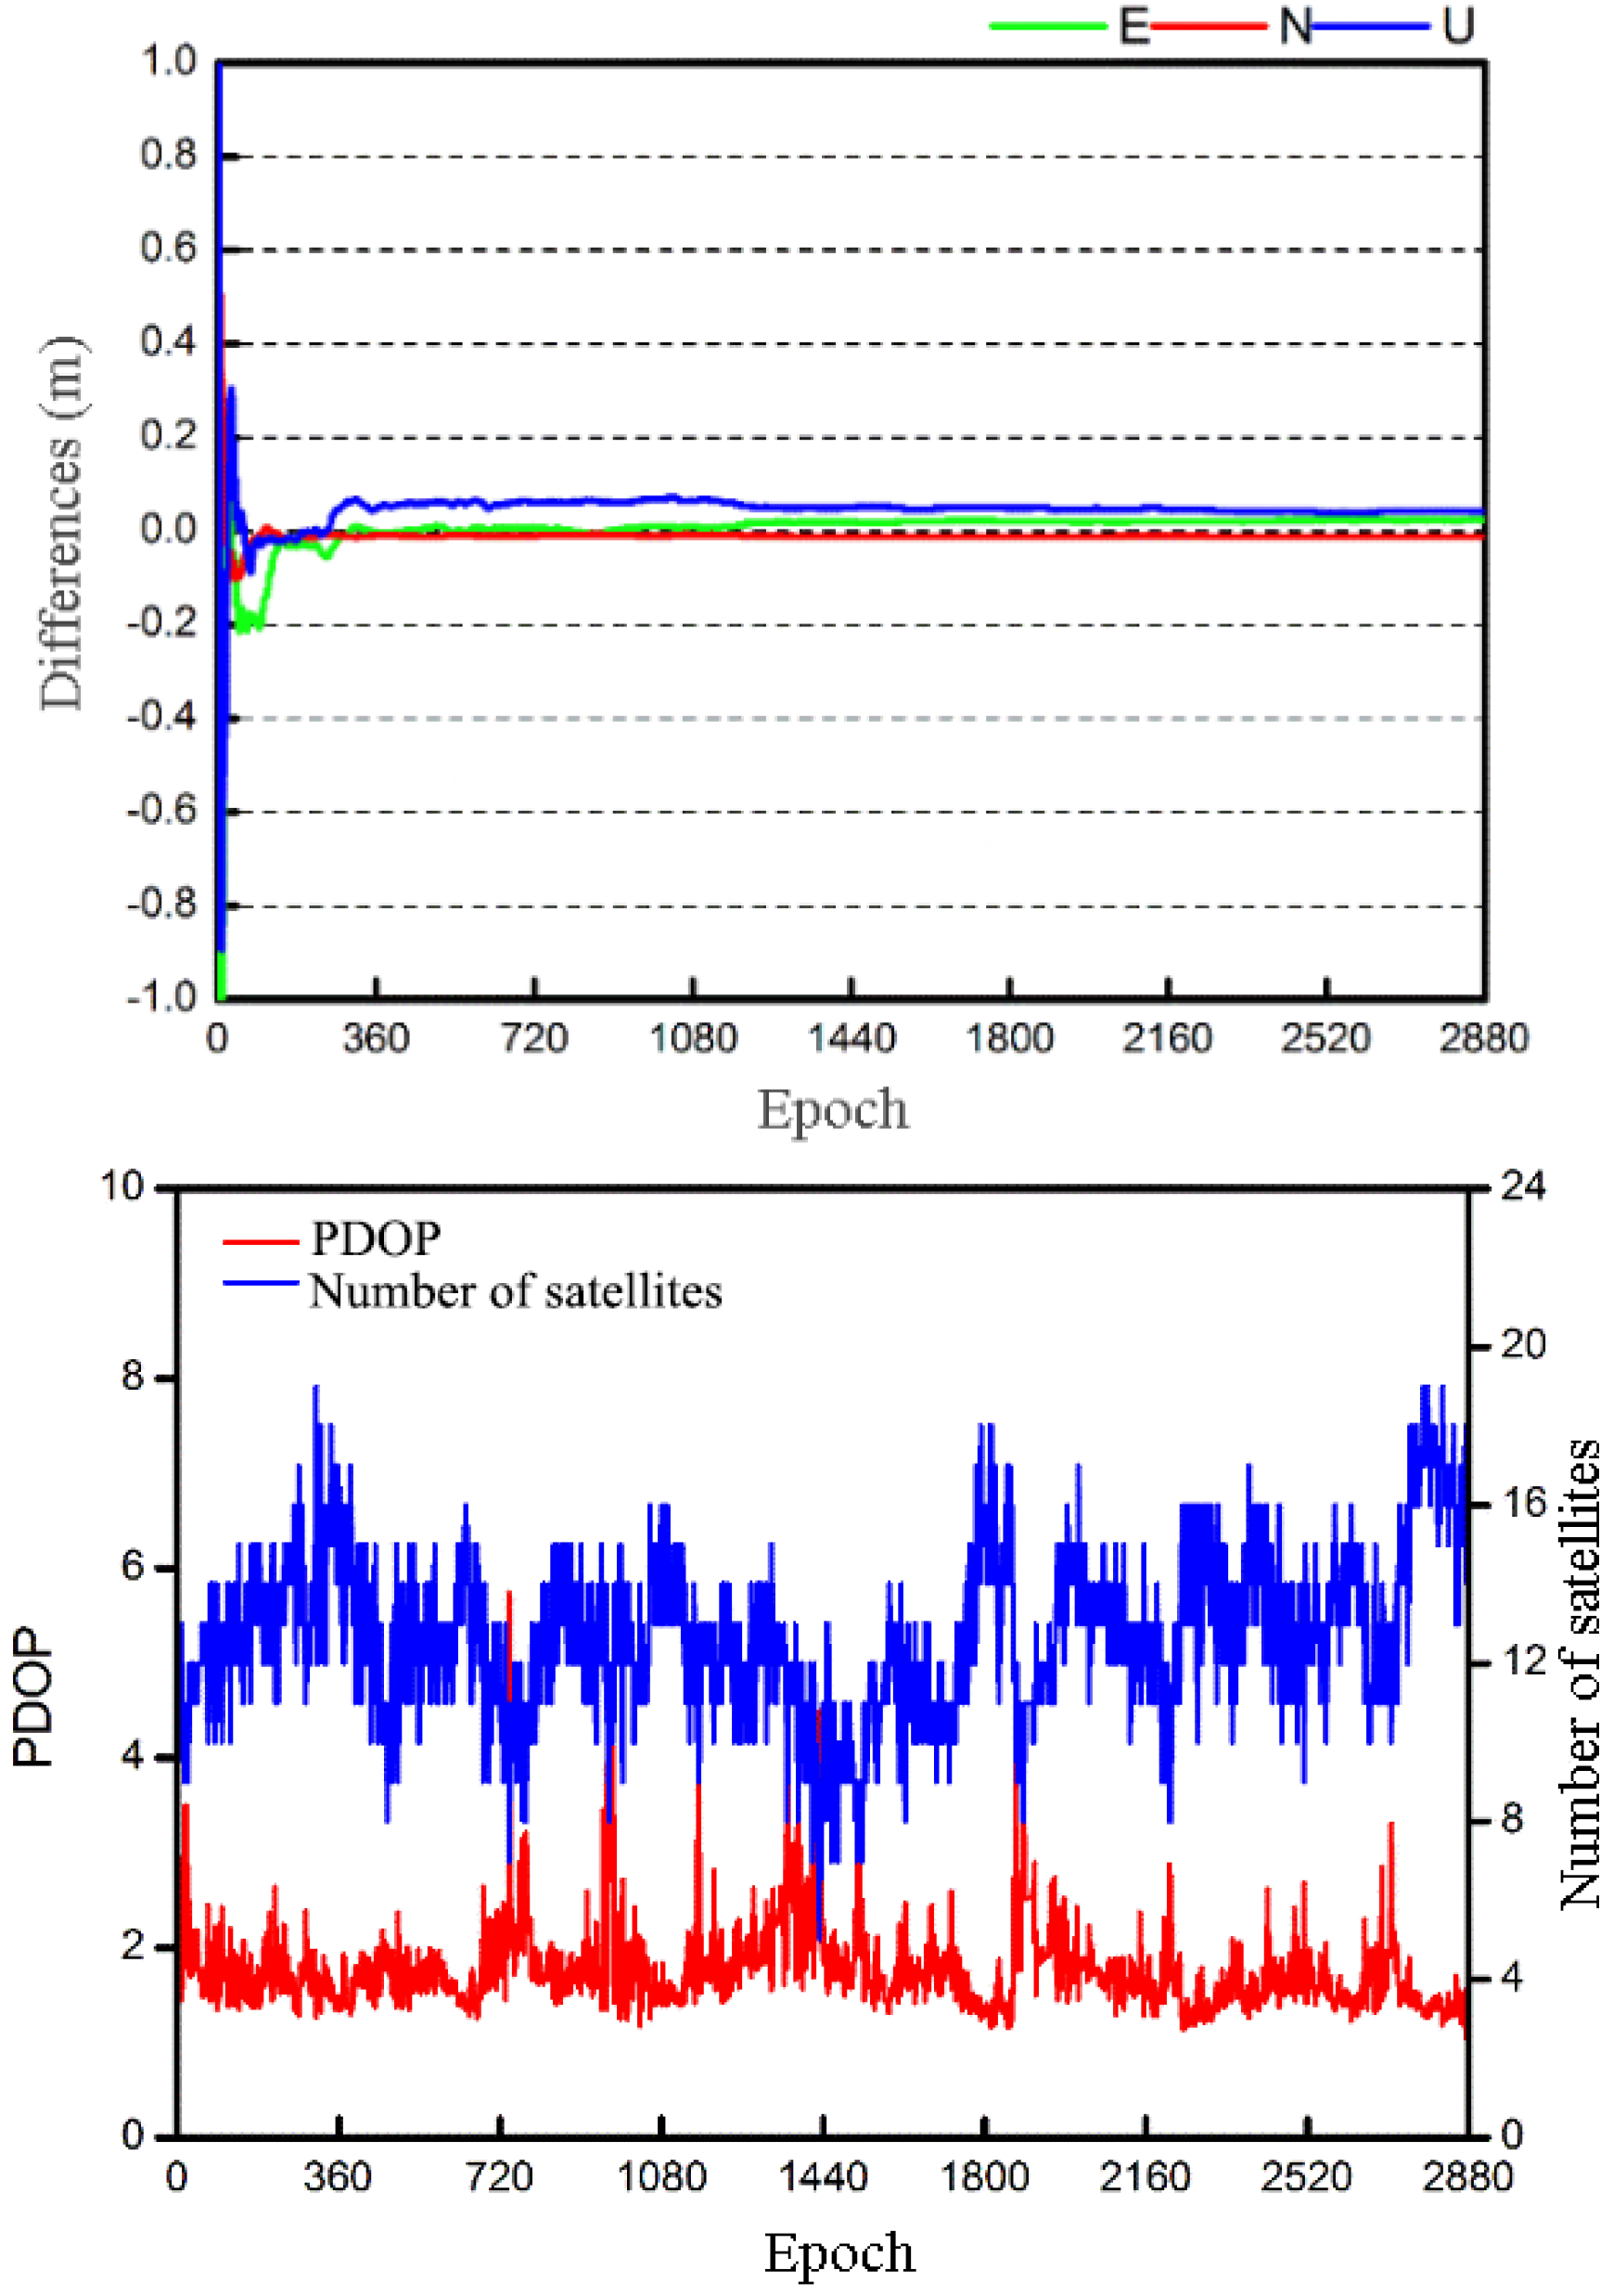
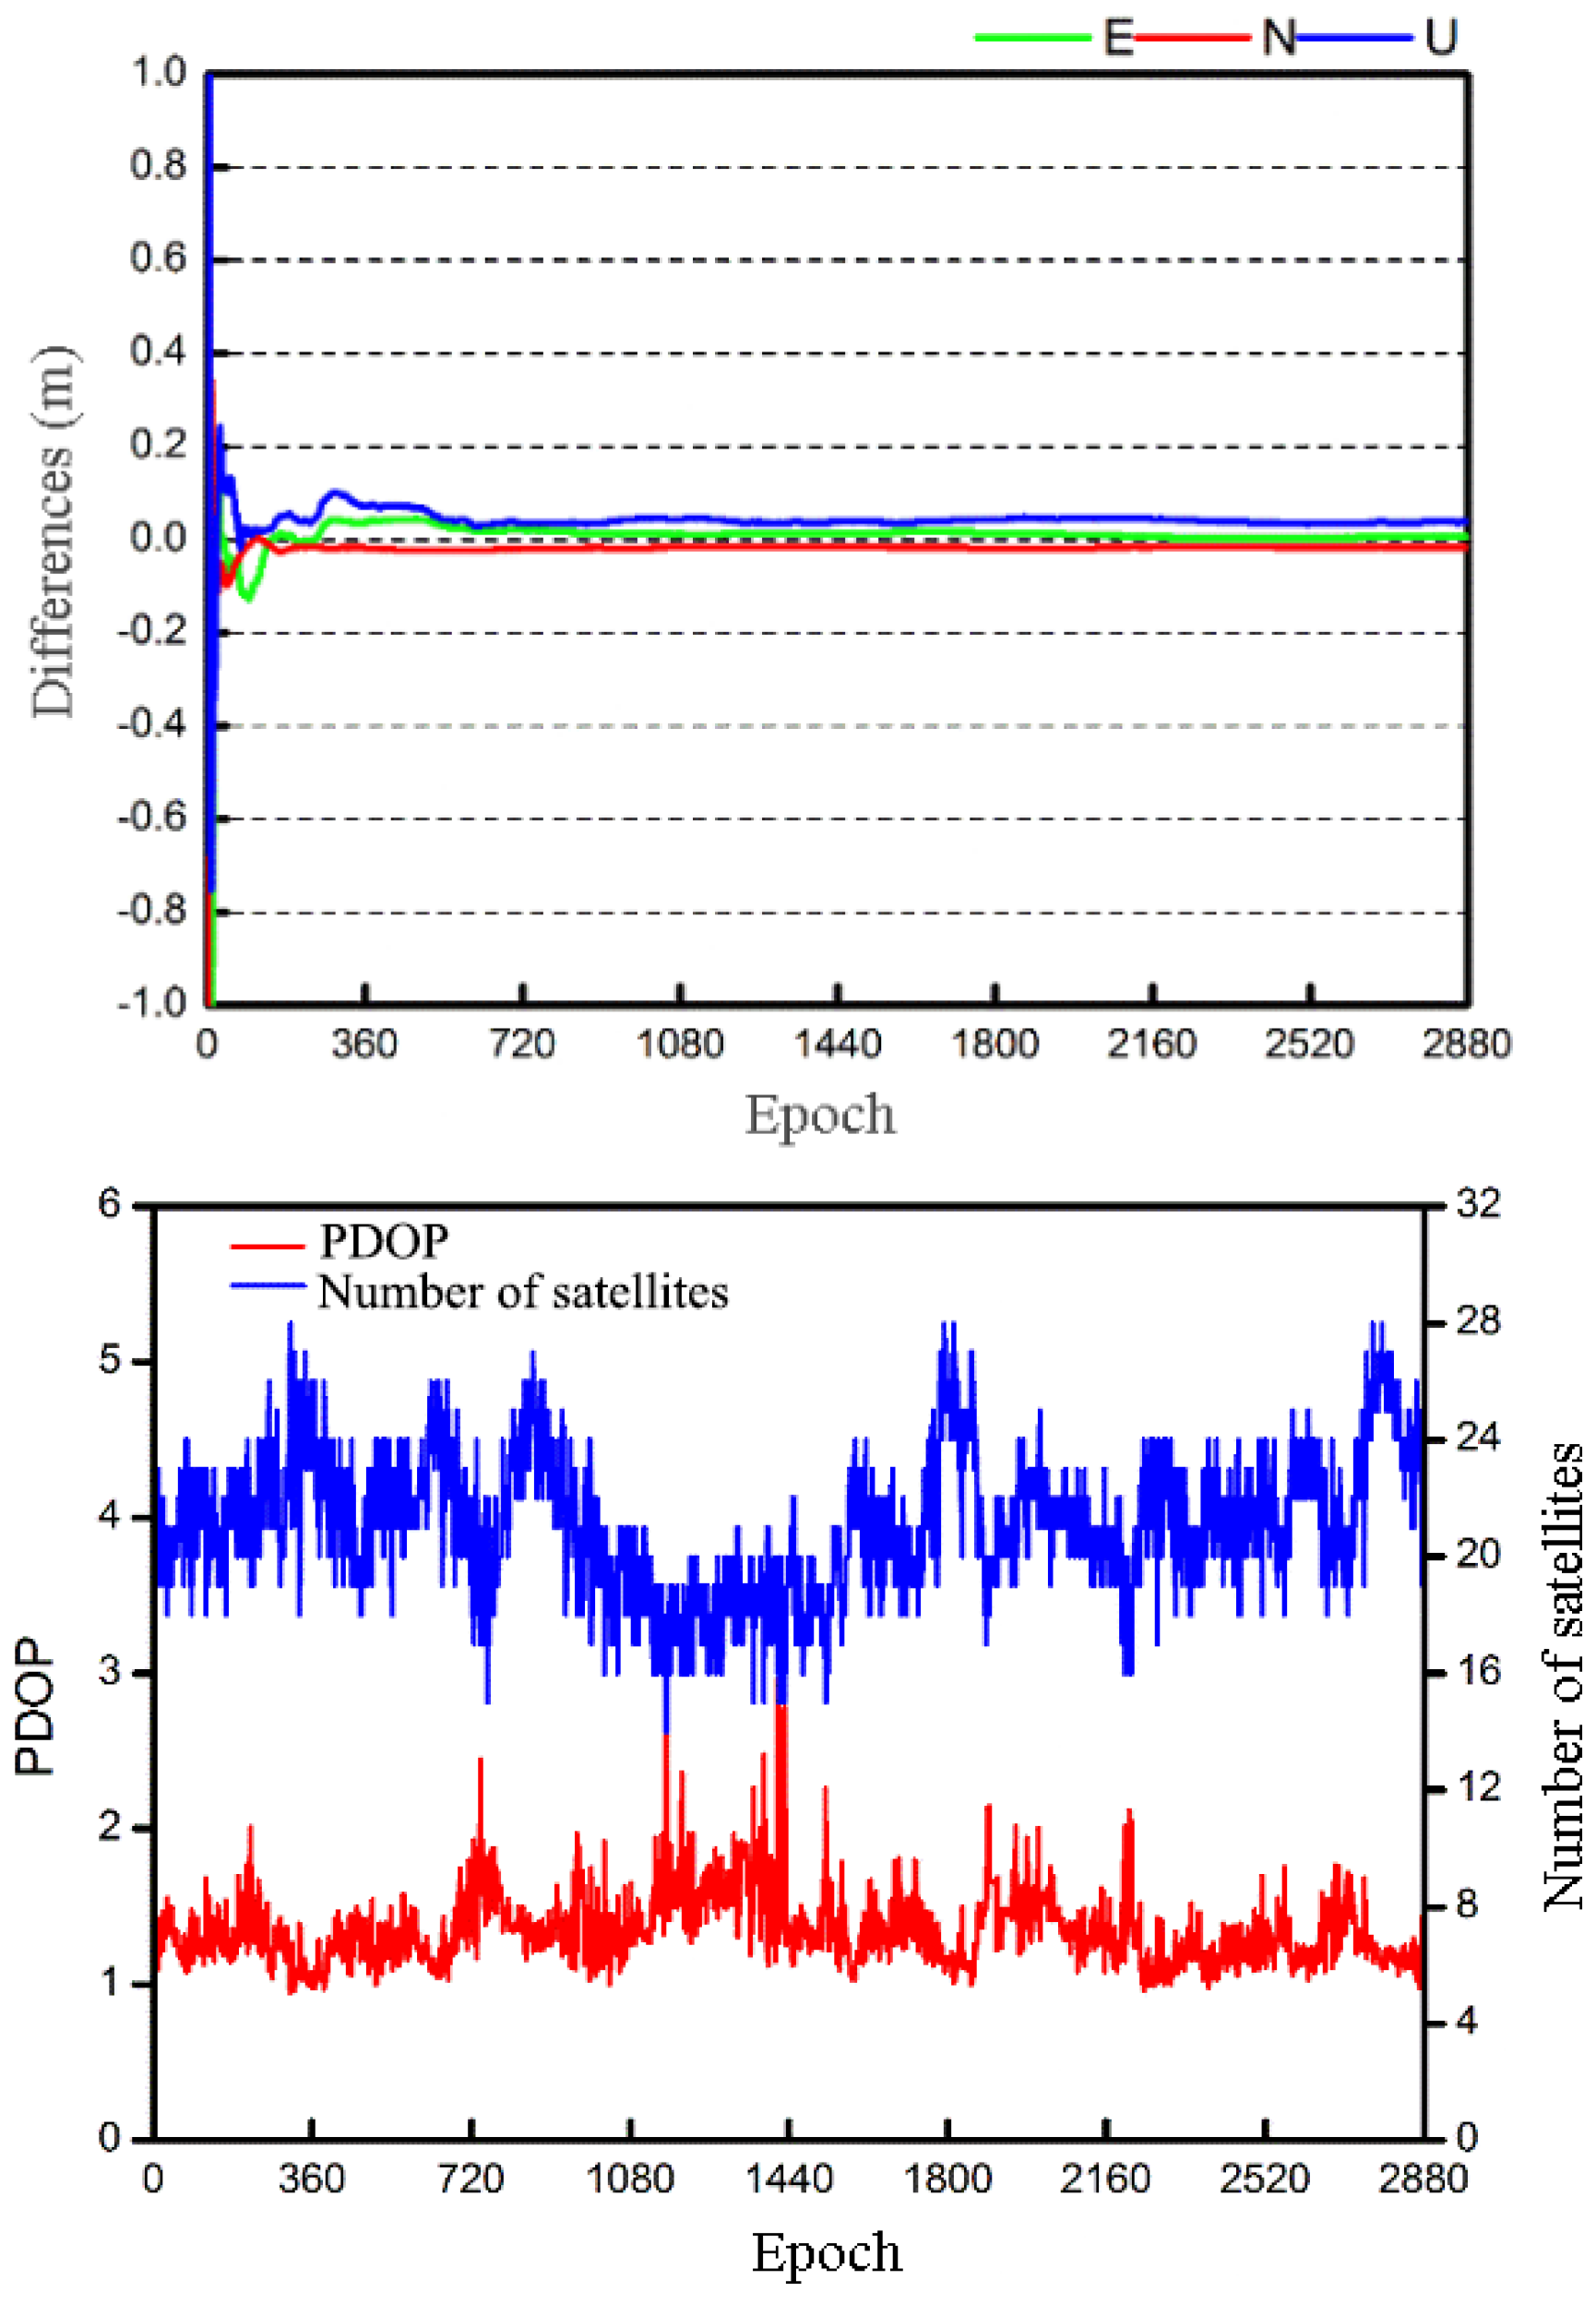
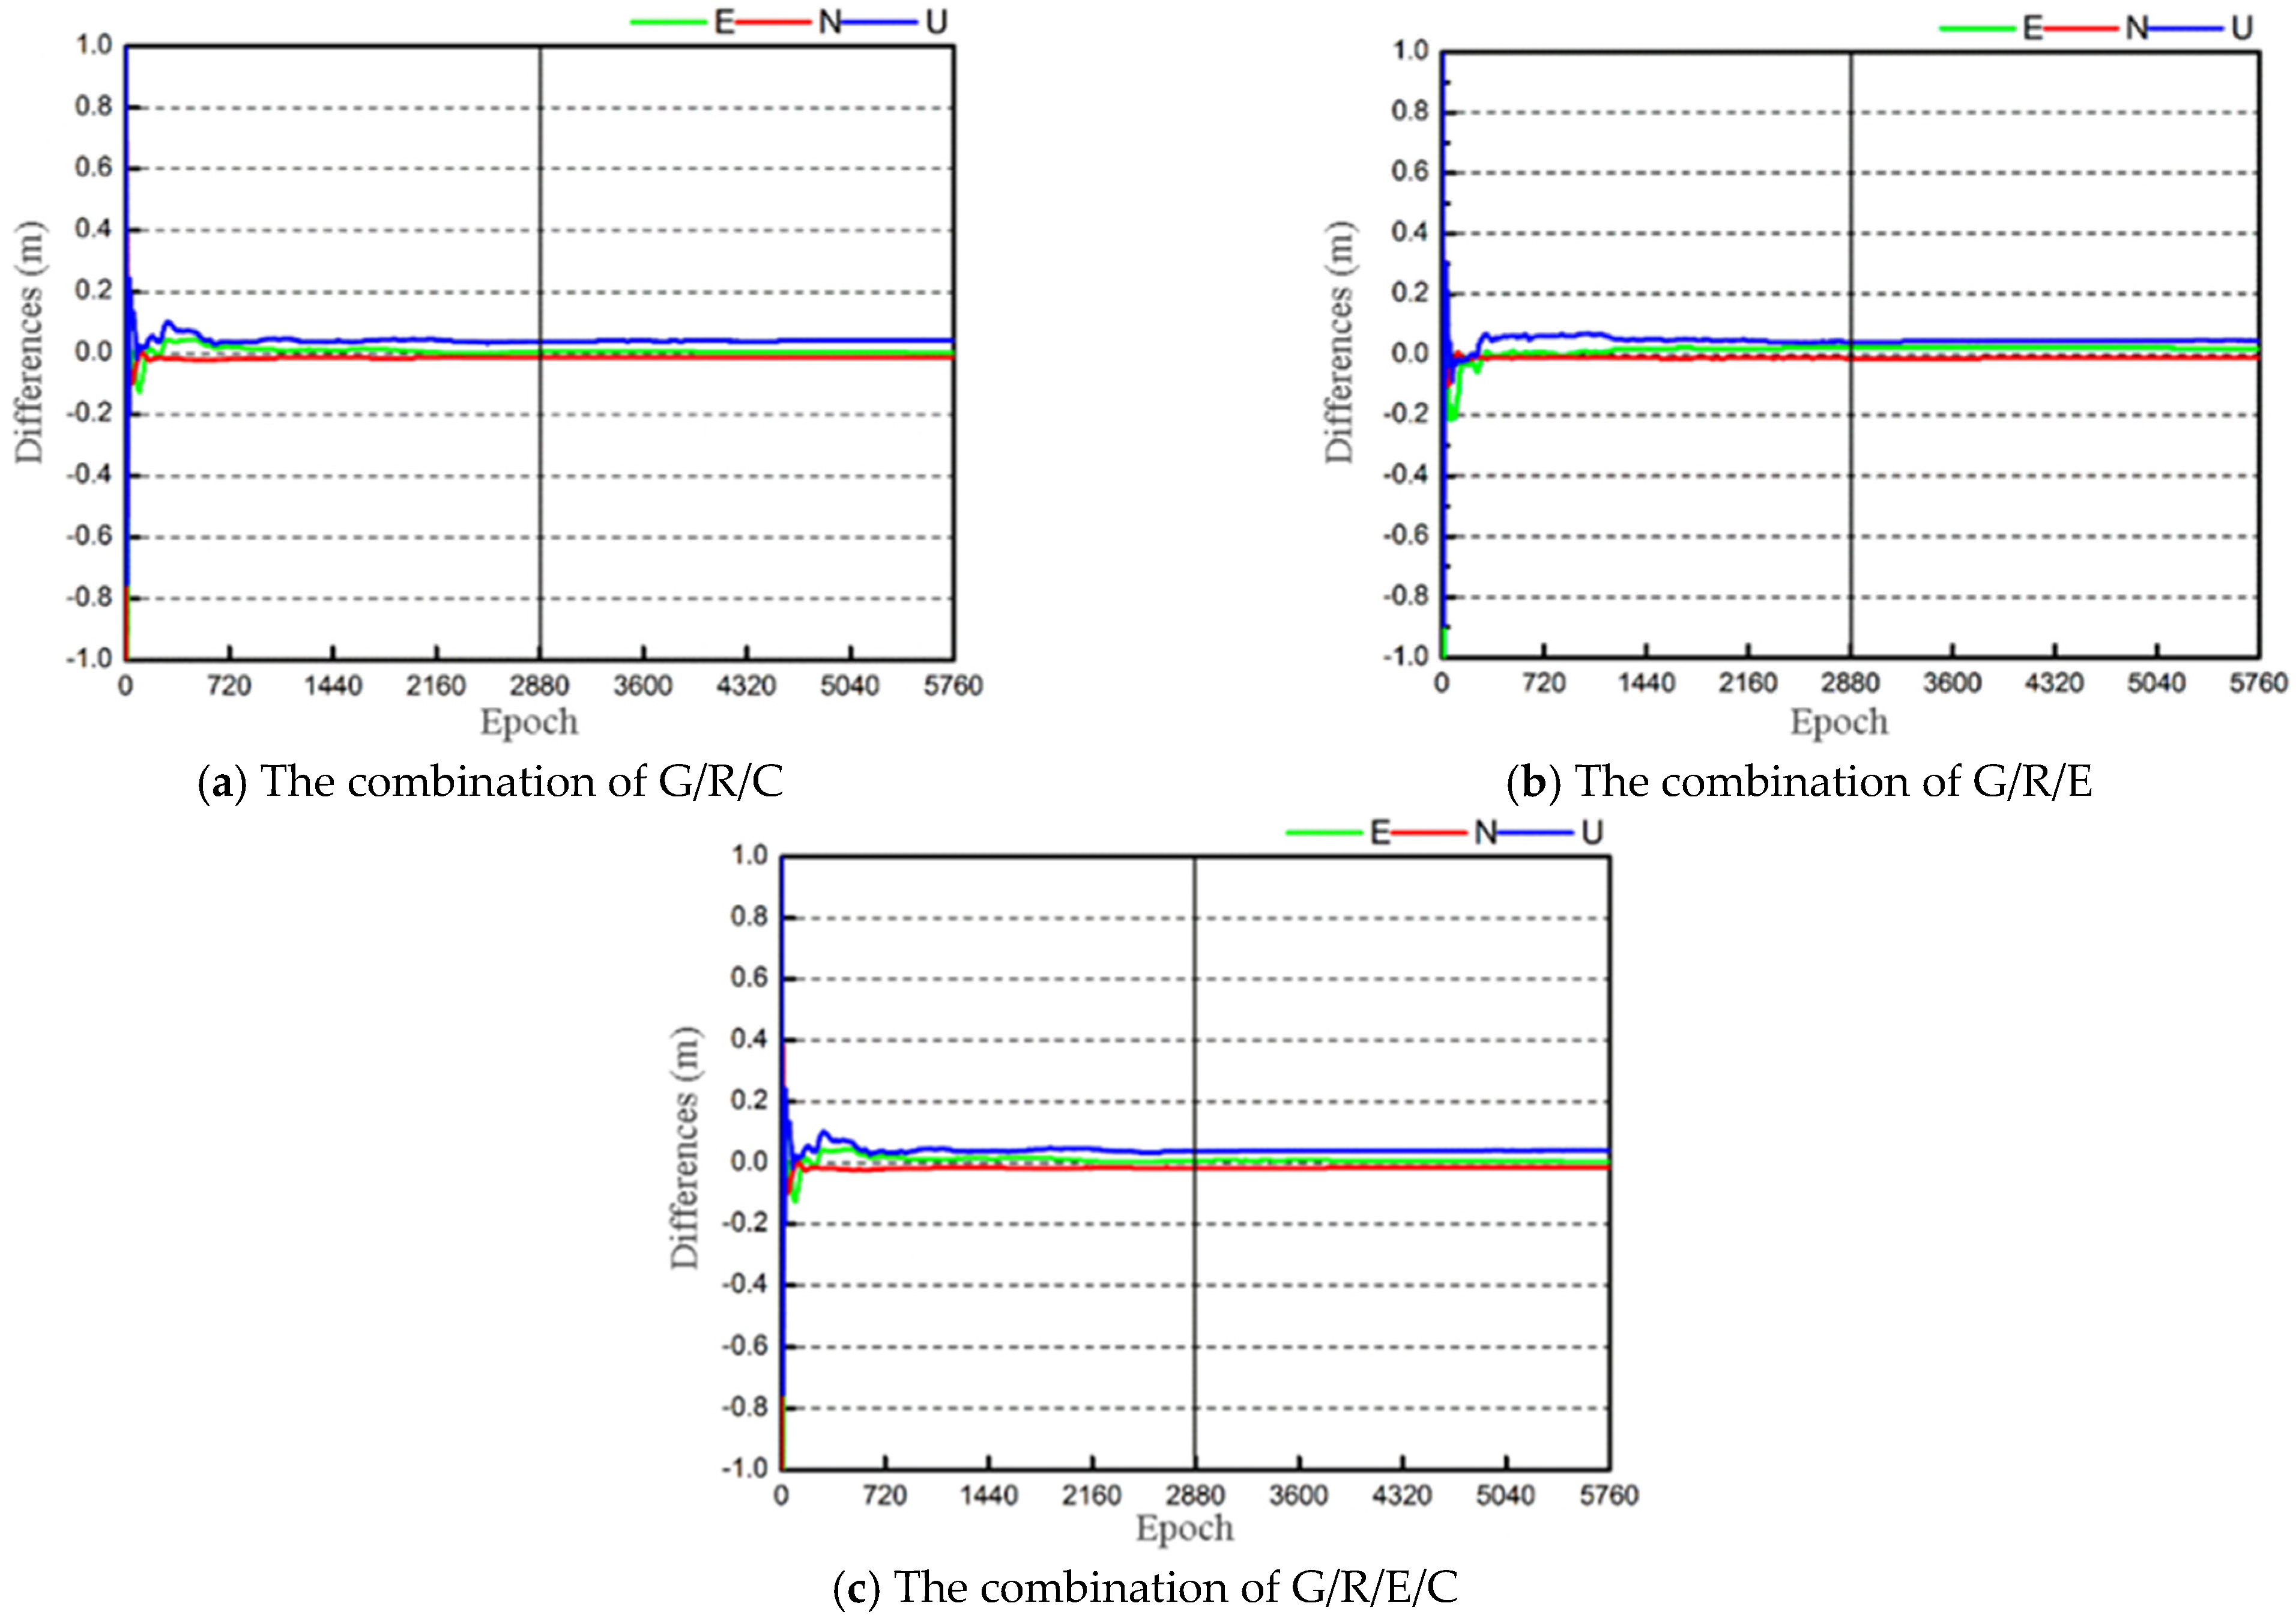
5.1. Analysis of Convergence Time

Combined with the data quality test results of monitoring points and the preliminary experimental conclusions, the GPS system was used as the benchmark to carry out the multi-system combined PPP calculation experiment. It used G/R/C, G/R/E and G/R/E/C as three good combinations and the static relative positioning calculation coordinate value as the reference coordinate to verify the positioning performance and reliability of G/R/C, G/R/E and G/R/E/C combined PPP. As the calculated results of the observed data are basically similar, the position deviation and observation status of the observed data on the third day in the north (N), east (E) and elevation (U) directions are taken as an example (Figure 6, Figure 7 and Figure 8).
According to the analysis of Figure 6, Figure 7 and Figure 8, the G/R/C combination observation state is good, the average number of available satellites is 20.6, the average PDOP value is 1.36, and the three directions of NEU converge to within 0.1 m after 12.5, 14 and 30.5 min, respectively. After convergence, the positioning accuracy of N direction is better than 1 cm, E direction is better than 2 cm, and U direction is better than 5 cm. The observation state of the G/R/E combination is slightly worse: the average number of available satellites is 12.4, and the average PDOP value is 1.79. After 12.5, 13.5 and 33 min, the three directions of NEU converge to within 0.1 m. After convergence, the positioning accuracy of N direction is about 1 cm, E direction is better than 2.2 cm, and U direction is better than 5 cm. Because the station is located in the Fujian province, Galileo has fewer visible satellites, G/R/E/C composite state of observation is similar to G/R/C composite, the average number of available satellites is 21.1, and the average PDOP value of 1.35. The three directions of NEU converge to within 0.1 m after 12.5, 14 and 30.5 min, respectively. After convergence, the positioning accuracy of N direction is better than 1 cm, E direction is better than 2 cm, and U direction is better than 5 cm. In summary, the PPP convergence time of multi-system combination is basically the same, and the positioning accuracy of NEU in all three directions can reach centimeter level after about 30 min.
In the combined PPP solution of multi-day GNSS monitoring data, if data stitching is not carried out, the daily observation data will experience about 30 min of initialization time, causing a serious waste of the original observation data. Therefore, it is extremely important to mosaic the multi-day data. In this study, the CHCData Mosaic software provided by Huace Navigation was used to mosaic the original observation data of the monitoring point, and the multi-system combined PPP calculation experiment was carried out, which greatly improved the utilization rate of the original observation. Figure 9 shows the solution results of the observation data stitching on the third and fourth days of the G/R/C, G/R/E and G/R/E/C combinations, respectively. The solid black line at the 2880 epoch is the splice point of observation data in the two phases. According to the analysis of Figure 9, the positioning accuracy of the combination of G/R/C and G/R/E/C in the N direction is better than 1 cm, the E direction is better than 2 cm, and the U direction is better than 5 cm after the PPP convergence. After the convergence of the G/R/E combination PPP, the positioning accuracy in the N direction is about 1 cm, the positioning accuracy in the E direction is better than 2.2 cm, and the positioning accuracy in the U direction is better than 5 cm.

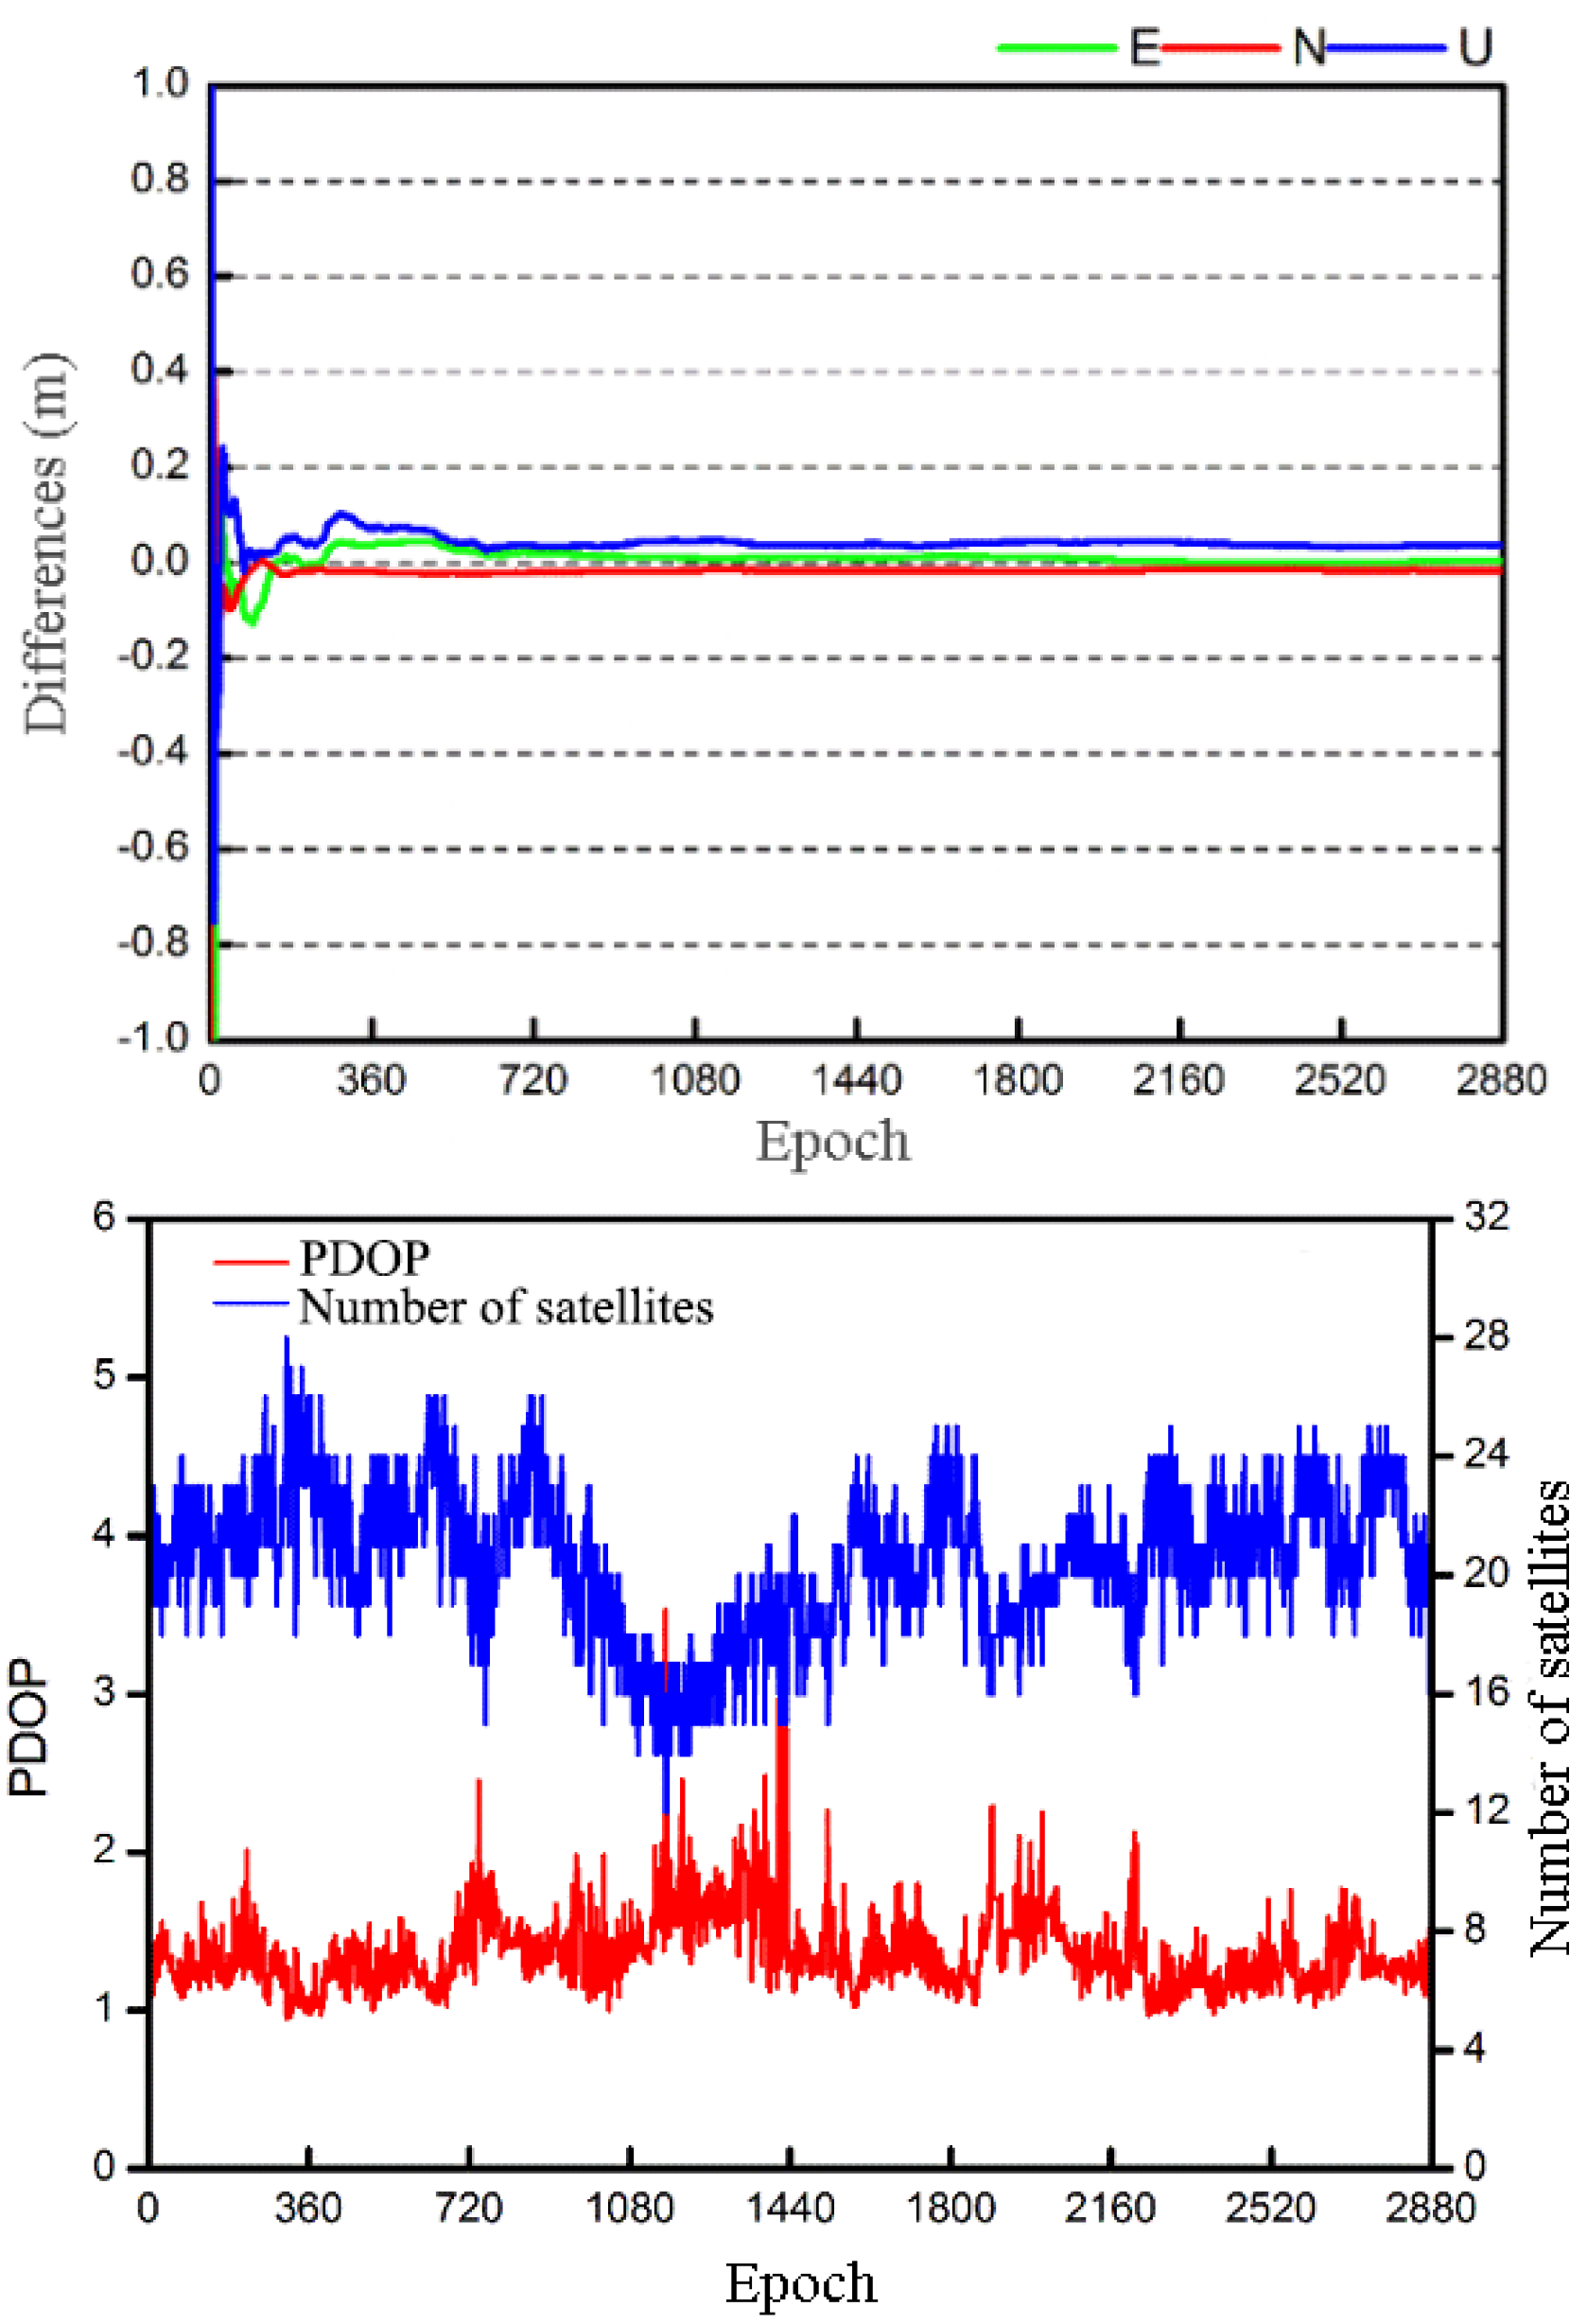
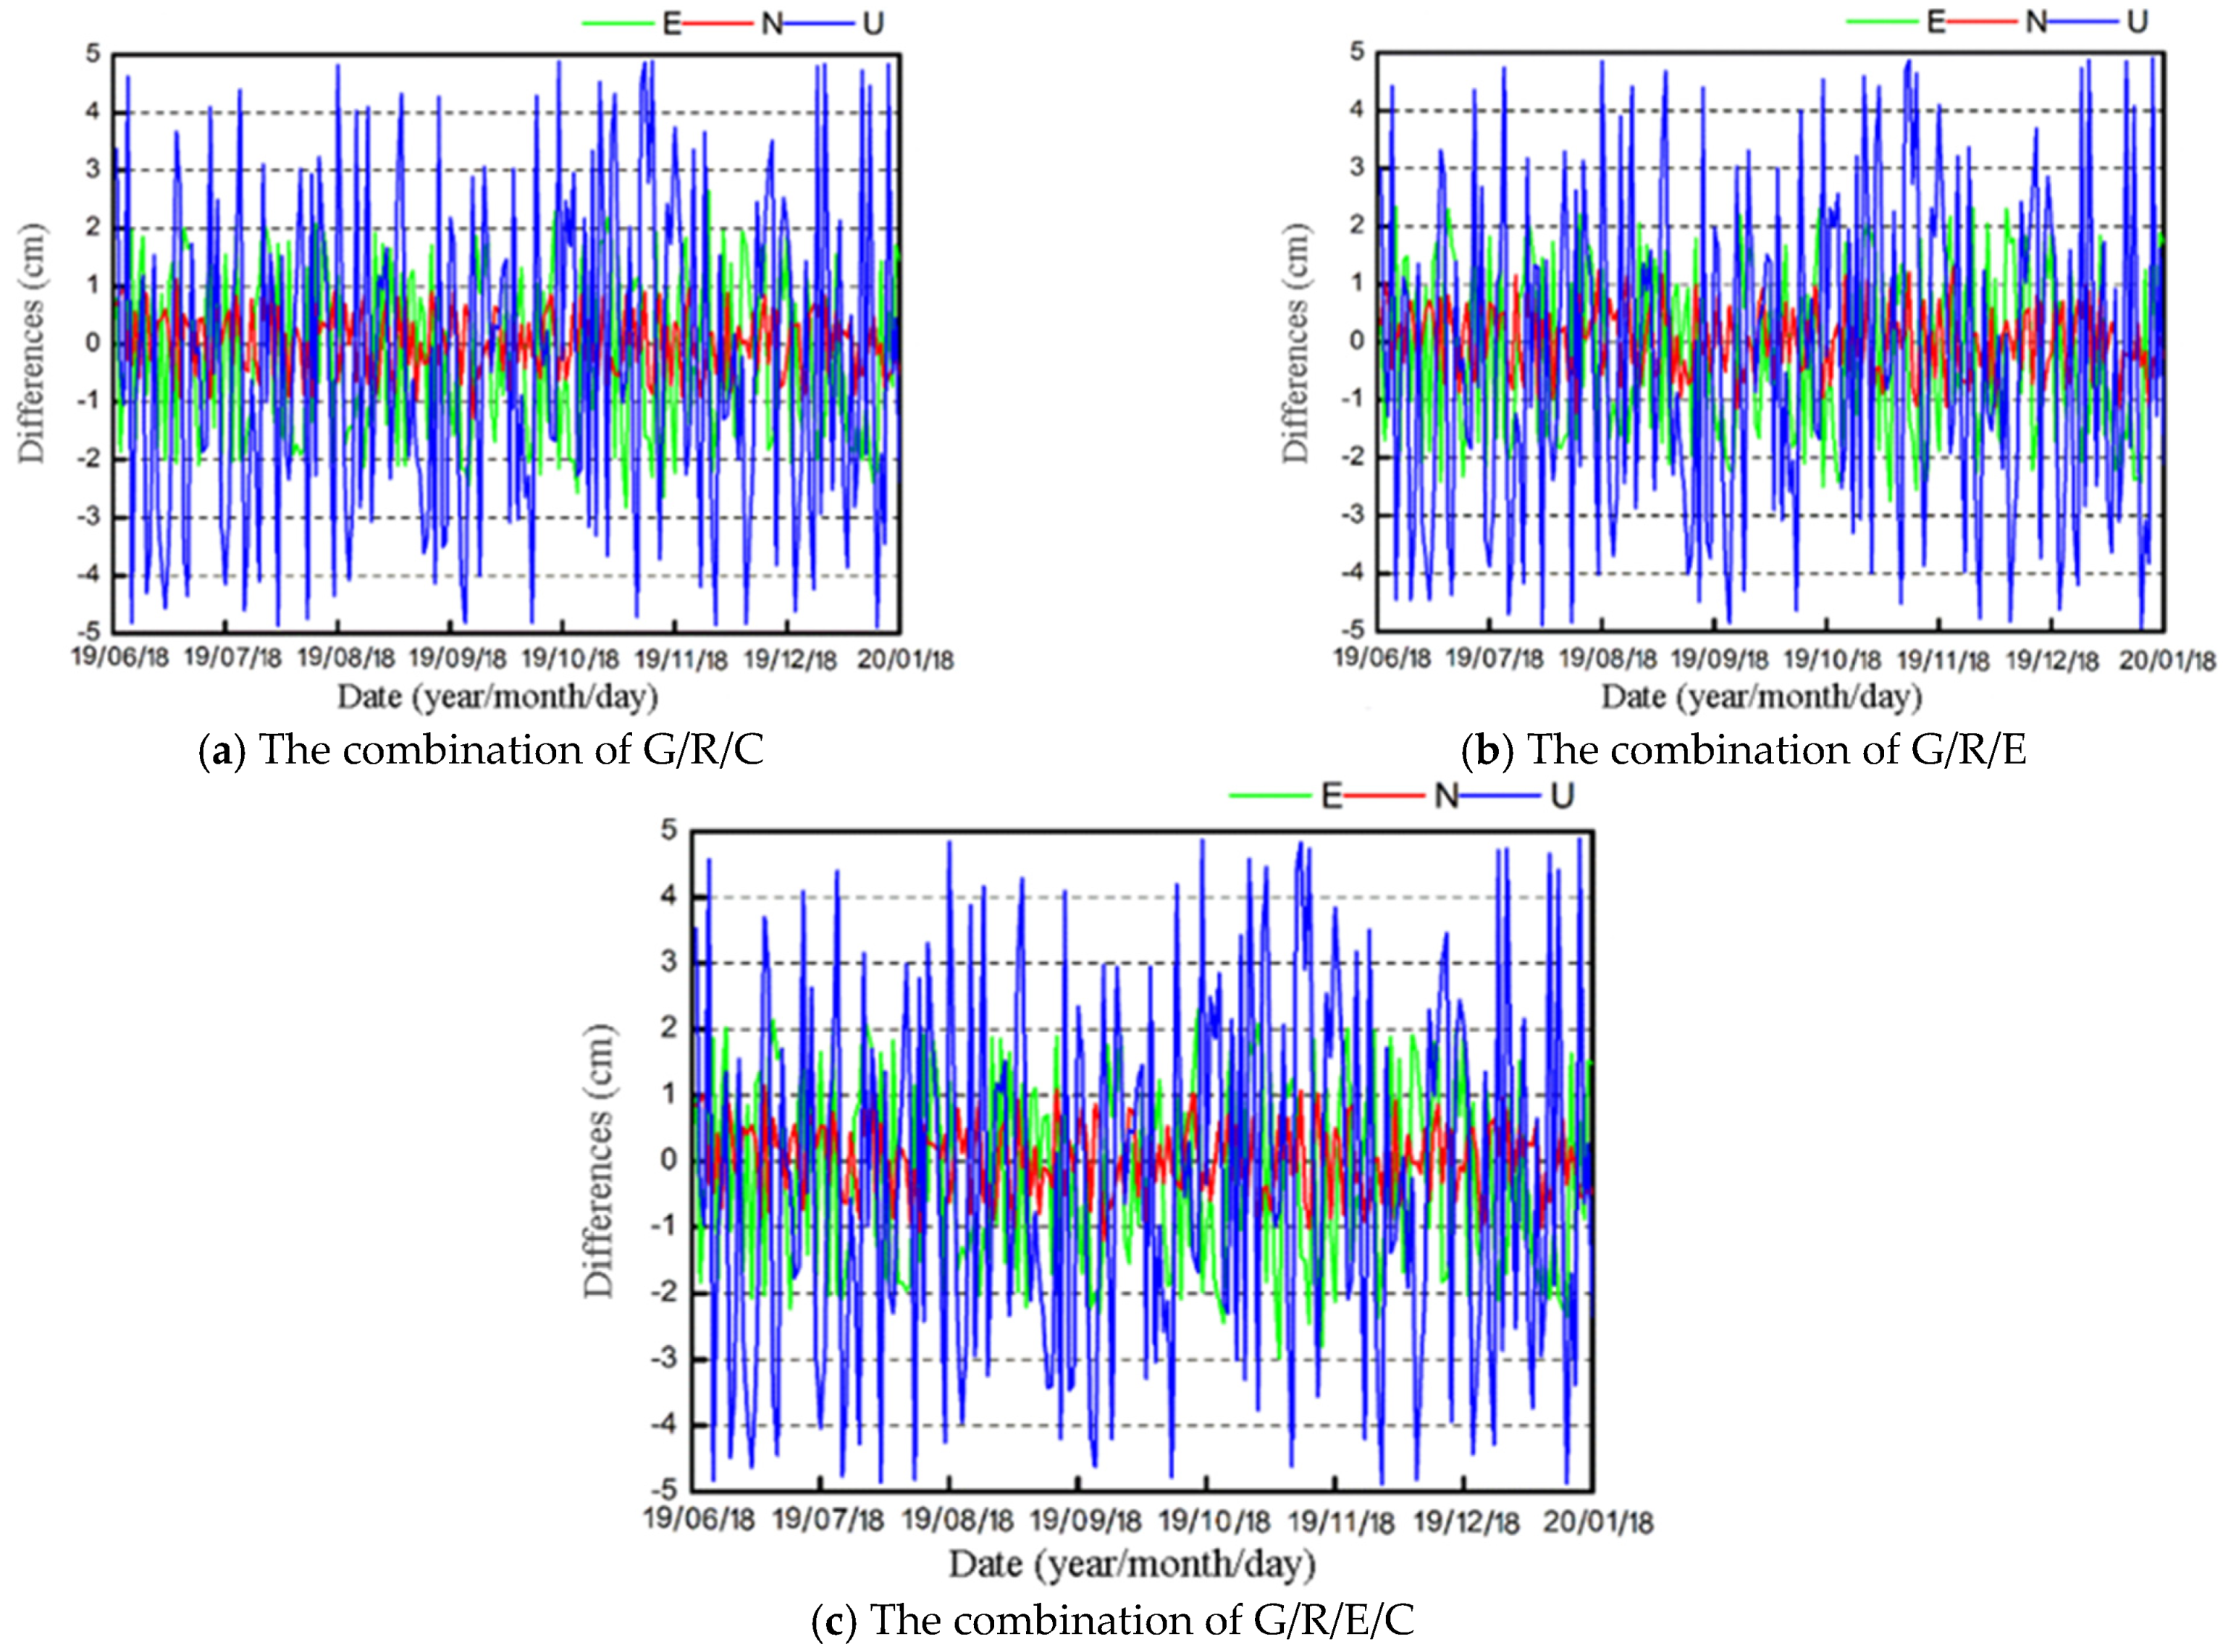
5.2. Analysis of Positioning Accuracy

To further verify the reliability of the calculating results, continuous reference stations were set up at the stable points outside the landslide disaster area for static synchronous observation. The calculation coordinates of 24 h static synchronous observation data between the reference point and the monitoring point were taken as the initial coordinates of the monitoring point. The HCMonitor software provided by Huace Navigation was used to calculate the static relative positioning. Figure 10 shows the cumulative changes of the static relative positioning of the monitoring points in the north (N), east (E) and elevation (U) directions. According to the analysis of Figure 10, the cumulative displacement of the monitoring point data in the observation period in the N direction is 9.54 mm, the cumulative displacement in the E direction is 7.38 mm, and in the U direction, it is 19.2 mm. During the observation period, the horizontal displacement of the monitoring point moved along the N and E directions, with the trend of slightly sinking in the elevation direction. The static relative positioning results can identify the millimeter-scale landslide shape variables, which provides a reliable external verification means for PPP results.
Figure 11 shows the difference between the three directions of ENU solution results in G/R/C, G/R/E and G/R/E/C combined PPP and the static relative positioning solution results in the observation period. Through the analysis of Figure 11, it can be seen that the maximum deviation of the G/R/C combination PPP and static relative positioning calculation results in the three directions of NEU are 1.28, 2.82 and 4.90 cm, the minimum deviation is 0.01, 0.02 and 0.05 cm, and the average deviation is 0.49, 1.43 and 2.43 cm. The maximum deviation of G/R/E combination PPP and static relative positioning in three directions of NEU is 2.74, 1.31 and 4.94 cm, the minimum deviation is 0.01, 0.12 and 0.03 cm, and the average deviation is 0.51, 1.45 and 2.48 cm. The maximum deviation of the G/R/E/C combination PPP and static relative positioning results in the three directions of NEU is 1.49, 2.97 and 4.89 cm, and the minimum deviation is 0.01, 0.02 and 0.05 cm, respectively. The mean deviation is 0.49, 1.42 and 2.43 cm. To more intuitively compare the difference between the results of multi-system combination PPP and the static relative positioning solution, Table 1 quantifies the difference between the results of the PPP solution and the static relative positioning solution in the three directions of NEU at an interval of one month. To sum up, the accuracy of the calculation results of G/R/C, G/R/E and G/R/E/C combined PPP is basically the same, and the external coincidence accuracy is better than 5 cm for all solutions, so they can be applied to the landslide monitoring of centimeter-level slope movement.

6. Discussion

(1) In the early stage of the experiment, we conducted a single-system, dual-system and system combined static PPP calculating experiment to determine the benchmark system to carry on the static simulation dynamic experiment with a better applied combination in the measured dynamic data. It has important practical significance and application value for the analysis of current positioning performance of the combined system dynamic PPP.
(2) Early experiments on the measured dynamic data decoding showed that in the measured dynamic data quality that the IGS stations provide, the static data quality is poor. This is because the measured dynamic data observation environment is more complex, satellites change frequently, cycles slip and gross error is more often caused. In the future, with the BDS and Galileo precision products, precision ascension and receiver-end and PCV PCO model elaboration, the combined system dynamic PPP positioning accuracy and convergence time will improve further.
(3) For the combined system presented in this paper, in the PPP calculating monitoring data we only used the rapid ephemeris products offered by GFZ. In future research, this can be combined with the CNES, BKG and ESA real-time precision products offered by institutions to determine the accuracy of the evaluation of landslides. Furthermore, it can also be combined with the relevant data such as the comprehensive meteorological, hydrological, geological evaluation of the stability of landslides and deep discussion on the mechanism of the formation of landslides.

7. Conclusions

In this paper, the coordinates of monitoring points obtained by static relative positioning of the continuously operating reference station and monitoring station were taken as reference values. The GPS system was taken as the reference system, and G/R/E, G/R/C and G/R/E/C combined PPP calculation modes were used to carry out multi-system combined PPP calculation experiments on the data of monitoring points. The results show that:
(1) G/R/C, G/R/E, and G/R/E/C combined PPP converged to within 0.1 m after 12.5, 14 and 30.5; 12.5, 13.5 and 33; and 12.5, 14 and 30.5 minutes in NEU directions, respectively. The PPP convergence time of the three combinations is basically the same, and the positioning accuracy of all the three directions of NEU can reach centimeter level after about 30 min.
(2) The accuracy of the PPP solution results of G/R/C, G/R/E and G/R/E/C combinations is basically the same. After the three PPP combinations converge in the NEU directions, the internal coincidence accuracy of the positioning results is better than 1 mm on average, and the external coincidence accuracy is better than 5 cm, which is relatively stable and suitable for landslide monitoring with the slope movement of a centimeter.

Author Contributions

Y.G. and G.W. designed the experiments; G.W. and C.L. wrote the manuscript; Y.G. and X.F. reviewed the manuscript; D.L., Z.Y. and X.W. (Xuanwei Wang) ran the experiments; C.L. and X.F. performed the verification analysis; J.G., X.W. (Xiaole Wen) and W.J. contributed to the design of the experiments. All authors have read and agreed to the published version of the manuscript.

Funding

This research was funded by Nature Science Foundation of Fujian, China, grant number 2019J01649, Opening Fund of Key Laboratory of Geohazard Prevention of Hilly Mountains, Ministry of Natural Resources (Fujian Key Laboratory of Geohazard Prevention), China, grant number FJKLGH2021K002, the innovation and entrepreneurship training program for college students of Fujian, grant number 201910386016, and Nation-al Natural Science Foundation of China, grant number 41861134011.

Institutional Review Board Statement

Not applicable.

Informed Consent Statement

Not applicable.

Data Availability Statement

The multi-GNSS precise orbit and clock products issued provided by IGS are available from ftp://igs.ensg.ign.fr/pub/igs/products/ (accessed on 30 June 2021).

Acknowledgments

We thank the editor and referees for their useful comments and criticisms. The authors gratefully acknowledge IGS for providing multi-GNSS precise orbit and clock products. We thank Xin Guo for her valuable contributions and suggestions during the revision of the paper.

Conflicts of Interest

The authors reported no potential conflict of interest.

References

  1. Richard, M.I. Landslide triggering by rain infiltration. J. Psychosom. Res. 2000, 36, 1897–1910. [Google Scholar]
  2. Malamud, B.D.; Turcotte, D.L.; Guzzetti, F.; Reichenbach, P. Landslide inventories and their statistical properties. Earth Surf. Process. Landf. 2004, 29, 687–711. [Google Scholar] [CrossRef]
  3. Guzzetti, F.; Mondini, A.C.; Cardinali, M.; Fiorucci, F.; Santangelo, M.; Chang, K.T. Landslide inventory maps: New tools for an old problem. Earth-Sci. Rev. 2012, 1–2, 42–66. [Google Scholar] [CrossRef] [Green Version]
  4. Yi, Q.L.; Wang, S.Q.; Tu, P.F. Analysis about applicability of monitoring methods for rock fall and landslide. Chin. J. Geol. Hazard Control 1996, 7, 93–101. [Google Scholar]
  5. Li, H.Y.; Nie, G.G. Coordinate Model Analysis of GPS Monitoring for Large Landslide in Xishan Village. J. Geomatics 2019, 44, 117–119. [Google Scholar]
  6. Josep, A.G.; Jordi, C.; Joan, R. Using Global Positioning System techniques in landslide monitoring. Eng. Geol. 2000, 55, 167–192. [Google Scholar]
  7. Malet, J.-P.; Maquaire, O.; Calais, E. The use of Global Positioning System techniques for the continuous monitoring of landslides: Application to the Super-Sauze earthflow (Alpes-de-Haute-Provence, France). Geomorphology 2002, 43, 33–54. [Google Scholar] [CrossRef] [Green Version]
  8. Liu, J.N.; Ye, S.R. GPS Precise Point Positioning Using Undifferenced Phase Observation. Geomat. Inf. Sci. Wuhan Univ. 2002, 2002, 234–240. [Google Scholar]
  9. Zhang, X.H.; Li, X.X.; Li, P. Review of GNSS PPP and Its Application. Acta Geod. Cartogr. Sinica 2017, 46, 1399–1407. [Google Scholar]
  10. Ren, X.D.; Zhang, K.K.; Li, X.X.; Zhang, X.H. Precise Point Positioning with Multi-constellation Satellite Systems: Beidou Galileo GLONASS GPS. Acta Geod. Cartogr. Sinica 2015, 44, 1307–1313. [Google Scholar]
  11. Zumberge, J.F.; Heflin, M.B.; Jefferson, D.C.; Watkins, M.M.; Webb, F.H. Precise Point Positioning for the Efficient and Robust Analysis of GPS Data from Large Networks. J. Geophys. Res. Solid Earth 1997, 102, 5005–5017. [Google Scholar] [CrossRef] [Green Version]
  12. Wang, L.; Zhang, X.; Huang, G.W.; Tu, R.; Zhang, S.C. Experiment results and analysis of landslide monitoring by using GPS PPP technology. Rock Soil Mechanics 2014, 35, 2118–2124. [Google Scholar]
  13. Zhang, X.H.; Zuo, X.; Li, P.; Pan, Y.M. Convergence Time and Positioning Accuracy Comparison between BDS and GPS Precise Point Positioning. Acta Geodactica Cartogr. Sinica 2015, 44, 250–256. [Google Scholar]
  14. Liu, Y.Y.; Ye, S.R.; Song, W.W.; Lou, Y.D.; Chen, D.Z. Integrating GPS and BDS to shorten the initialization time for ambiguity-fixed PPP. GPS Solut. 2017, 21, 333–343. [Google Scholar] [CrossRef]
  15. He, H.; Li, J.; Yang, Y.; Xu, J.; Guo, H.; Wang, A. Performance assessment of single- and dual-frequency BeiDou/GPS single-epoch kinematic positioning. GPS Solut. 2014, 18, 393–403. [Google Scholar] [CrossRef]
  16. Chen, J.; Wang, J.; Zhang, Y.; Yang, S.; Chen, Q.; Gong, X. Modeling and Assessment of GPS/BDS Combined Precise Point Positioning. Sensors 2016, 16, 1151. [Google Scholar] [CrossRef] [Green Version]
  17. Li, P.; Zhang, X.H. Integrating GPS and GLONASS to accelerate convergence and initialization times of precise point positioning. GPS Solut. 2014, 18, 461–471. [Google Scholar] [CrossRef]
  18. Cai, C.S.; Gao, Y. Modeling and Assessment of Combined GPS/GLONASS Precise Point Positioning. GPS Solut. 2013, 17, 223–236. [Google Scholar] [CrossRef]
  19. Angrisano, A.; Gaglione, S.; Gioia, C. Performance assessment of GPS/GLONASS single point positioning in an urban environment. Acta Geod. Geophys. 2013, 48, 149–161. [Google Scholar] [CrossRef]
  20. Wang, L.; Li, Z.S.; Yuan, H.; Zhou, K. Validation and analysis of the performance of dual-frequency single-epoch BDS/GPS/GLONASS relative positioning. Chin. Sci. Bull. 2015, 60, 857–886. (In Chinese) [Google Scholar] [CrossRef]
  21. Li, X.; Zheng, K.; Li, X.; Liu, G.; Ge, M.; Wickert, J.; Schuh, H. Real-time capturing of seismic waveforms using high-rate BDS, GPS and GLONASS observations: The 2017 Mw 6.5 Jiuzhaigou earthquake in China. GPS Solut. 2019, 23, 17. [Google Scholar] [CrossRef]
  22. Cai, C.; Gao, Y.; Pan, L.; Zhu, J. Precise Point Positioning with Quad-constellations: GPS, BeiDou, GLONASS and Galileo. Adv. Space Res. 2015, 56, 133–143. [Google Scholar] [CrossRef]
  23. Jiao, G.; Song, S.; Ge, Y.; Su, K.; Liu, Y. Assessment of BeiDou-3 and Multi-GNSS Precise Point Positioning Performance. Sensors 2019, 19, 2496. [Google Scholar] [CrossRef] [Green Version]
  24. Li, X.; Chen, X.; Ge, M.; Schuh, H. Improving multi-GNSS ultra-rapid orbit determination for real-time precise point positioning. J. Geod. 2019, 93, 45–64. [Google Scholar] [CrossRef]
  25. Lou, Y.; Zheng, F.; Gu, S.; Wang, C.; Guo, H.; Feng, Y. Multi-GNSS precise point positioning with raw single-frequency and dual-frequency measurement models. GPS Solut. 2016, 20, 849–862. [Google Scholar] [CrossRef]
  26. Wang, G. Millimeter-Accuracy GPS Landslide Monitoring Using Precise Point Positioning with Single Receiver Phase Ambiguity (PPP-SRPA) Resolution: A Case Study in Puerto Rico. J. Geod. Sci. 2013, 3, 22–31. [Google Scholar] [CrossRef]
  27. Capilla, R.M.; Berné, J.L.; Martín, A.; Rodrigo, R. Simulation Case Study of Deformations and Landslides Using Real-Time GNSS Precise Point Positioning Technique. Geomat. Nat. Hazards Risk 2016, 7, 1856–1873. [Google Scholar] [CrossRef] [Green Version]
  28. Zhang, H.L.; Gao, Y.P.; Zhang, J. Application of GNSS Precise Point Positioning in landslides—Taking a landslide monitoring data processing in Longnan as an example. Sci. Technol. Innov. Herald. 2015, 12, 58–59. [Google Scholar]
  29. Huang, G.; Du, Y.; Meng, L.; Huang, G.; Wang, J.; Han, J. Application Performance Analysis of Three GNSS Precise Positioning Technology in Landslide Monitoring. In Proceedings of the China Satellite Navigation Conference (CSNC) 2017, Shanghai, China, 23 May 2017; p. 437. [Google Scholar] [CrossRef]
  30. Peng, F.Y.; Nie, G.G.; Xue, C.H. Application of GPS/BDS Precise Point Positioning Technology in Landslide Deformation Monitoring. Navig. Position. Timing 2019, 6, 103–112. [Google Scholar]
  31. Xia, F.; Ye, S.; Xia, P.; Zhao, L.; Jiang, N.; Chen, D.; Hu, G. Assessing the Latest Performance of Galileo-only PPP and the Contribution of Galileo to Multi-GNSS PPP. Adv. Space Res. 2018, 63, 2784–2795. [Google Scholar] [CrossRef]
  32. Zhao, X.; Wang, S.; Liu, C.; Ou, J.; Yu, X. Assessing the Performance of Multi-GNSS Precise Point Positioning in Asia-Pacific Region. Surv. Rev. 2017, 49, 186–196. [Google Scholar] [CrossRef]
  33. Zhang, Z.; Li, B.; Nie, L.; Wei, C.; Jia, S.; Jiang, S. Initial Assessment of BeiDou-3 Global Navigation Satellite System: Signal Quality, RTK and PPP. GPS Solut. 2019, 23, 111. [Google Scholar] [CrossRef]
  34. Pierre, H.; Kouba, J. GPS Precise Point positioning using IGS orbit products. Phys. Chem. Earth Part A Solid Earth Geod. 2001, 26, 573–578. [Google Scholar]
  35. Gao, C.; Wu, F.; Chen, W.; Wang, W. An Improved Weight Stochastic Model in GPS Precise Point Positioning. In Proceedings of the Transportation, Mechanical and Electrical Engineering(TMEE), 2011 International Conference on Transportation, Changchun, China, 16–18 December 2011; pp. 629–632. [Google Scholar]
Figure 1. Location of study area.
Applsci 11 08378 g001
Figure 2. Road cracks.
Applsci 11 08378 g002
Figure 3. Slope moving forward and house cracking.
Applsci 11 08378 g003
Figure 4. Landslide scope and monitoring point layout.
Applsci 11 08378 g004
Figure 5. Location of the monitoring site.
Applsci 11 08378 g005
Figure 6. Position deviation and observation of G/R/C combined PPP.
Applsci 11 08378 g006
Figure 7. Position deviation and observation of G/R/E combined PPP.
Applsci 11 08378 g007
Figure 8. Position deviation and observation of G/R/E/C combined PPP.
Applsci 11 08378 g008
Figure 9. The deviation of splicing solution.
Applsci 11 08378 g009
Figure 10. Cumulative shape variables of monitoring points.
Applsci 11 08378 g010
Figure 11. Comparison of difference between combined PPP and static relative positioning results.
Applsci 11 08378 g011
Table 1. The PPP positioning results compared with the results of static relative positioning difference and the RMSE.
CombinationDateDeviation/cmRMSE
(Year/Month/Day)ENUENU
2019/6/180.790.693.371.320.552.85
2019/7/18−0.220.58−2.931.530.582.79
2019/8/181.720.68−2.711.610.562.77
G/R/C2019/9/18−2.15−0.7−4.11.340.572.68
2019/10/18−2.020.712.961.480.532.55
2019/11/18−1.390.97−1.641.730.612.93
2019/12/18−1.490.98−1.691.490.532.67
2020/1/181.45−0.52−2.381.330.513.03
2019/6/180.410.313.011.400.462.77
2019/7/18−0.680.62−2.891.700.572.75
2019/8/18−1.660.75−2.651.540.642.80
G/R/E2019/9/18−1.96−0.51−3.91.340.612.79
2019/10/18−2.420.312.561.500.562.52
2019/11/18−1.041.31−1.31.670.732.95
2019/12/18−1.33−0.82−1.531.520.562.66
2020/1/181.71−0.26−2.121.470.543.10
2019/6/180.940.843.521.140.592.88
2019/7/18−0.280.52−2.991.350.552.79
2019/8/18−1.630.78−2.611.410.562.79
G/R/E/C2019/9/18−2.21−0.76−4.161.140.592.68
2019/10/18−2.140.592.841.230.572.54
2019/11/18−1.520.84−1.771.520.652.91
2019/12/18−1.58−1.07−1.791.290.542.65
2020/1/181.48−0.49−2.351.150.513.01
Publisher’s Note: MDPI stays neutral with regard to jurisdictional claims in published maps and institutional affiliations.

