
Quantitative Evaluation of Food-Waste Components in Organic Fertilizer Using Visible–Near-Infrared Hyperspectral Imaging


Abstract
:1. Introduction
2. Materials and Methods
2.1. Sample Preparation
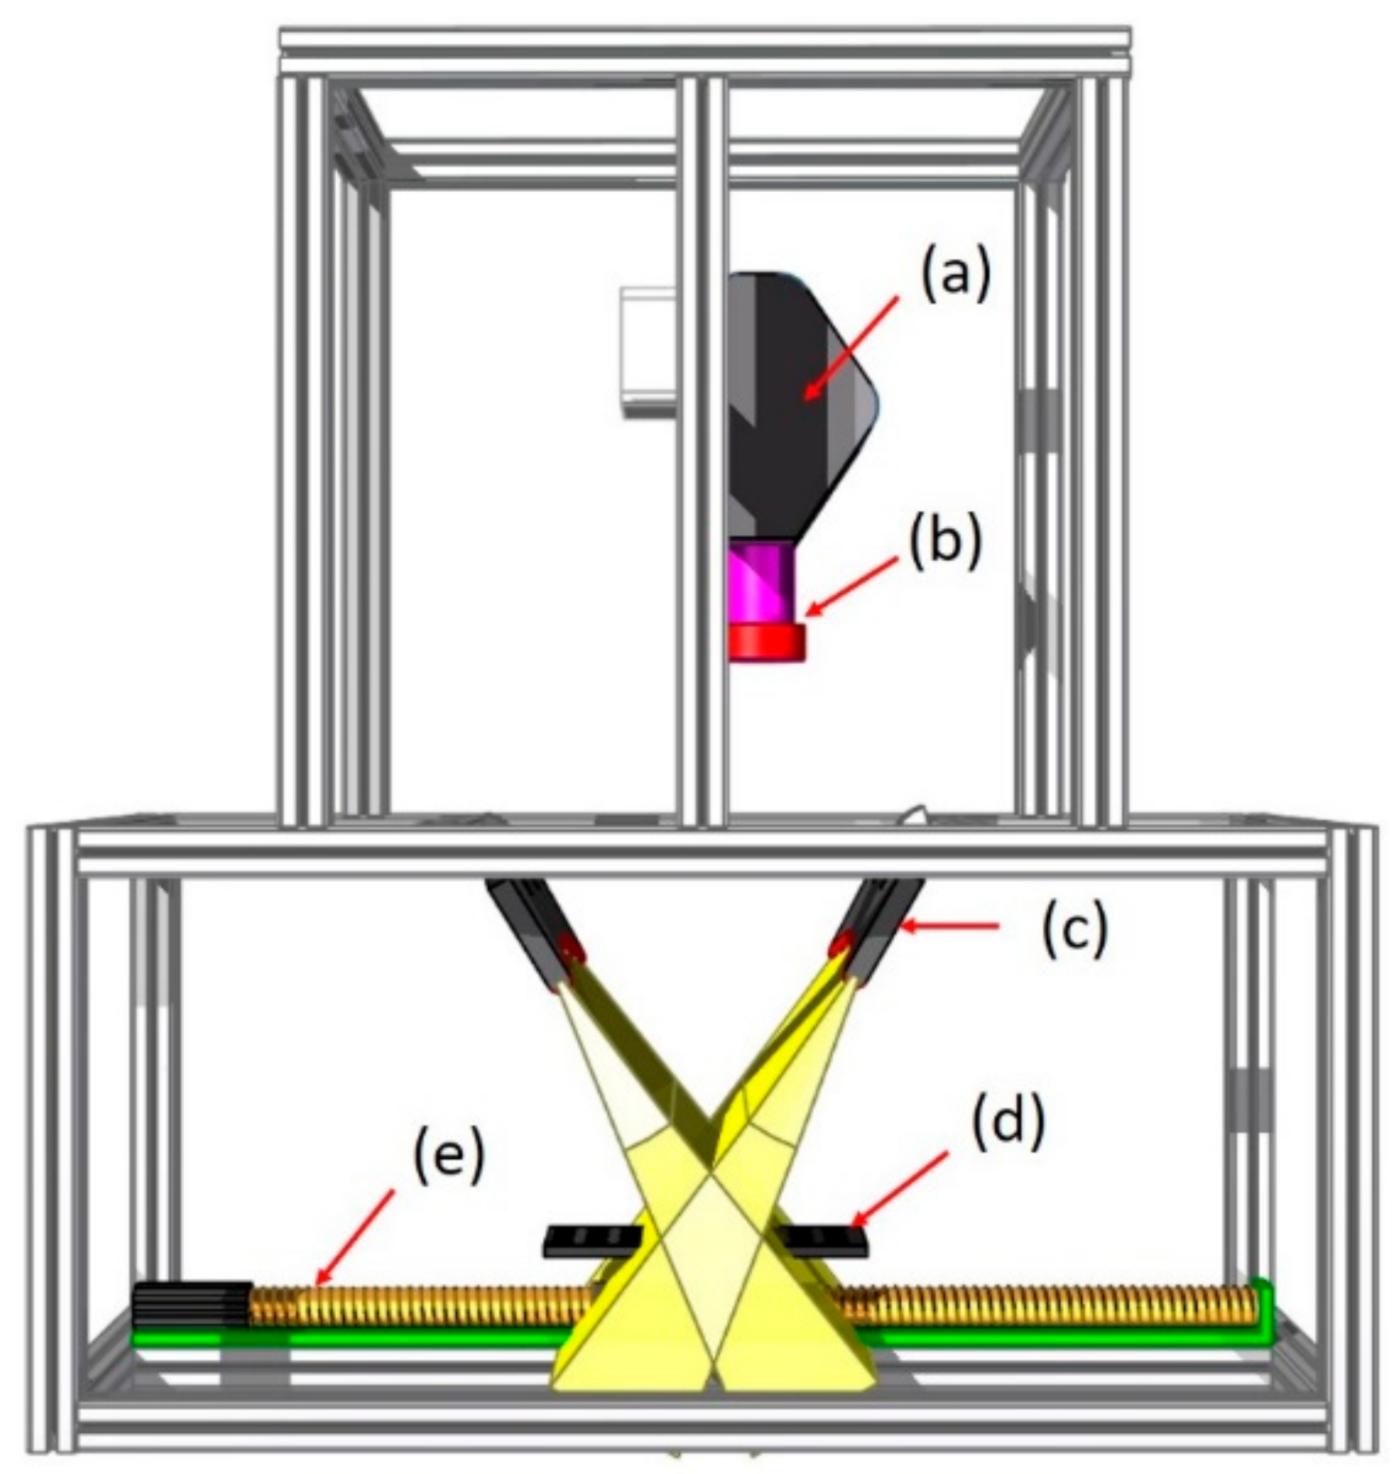
2.2. Hyperspectral Imaging System
2.3. Hyperspectral Image Acquisition
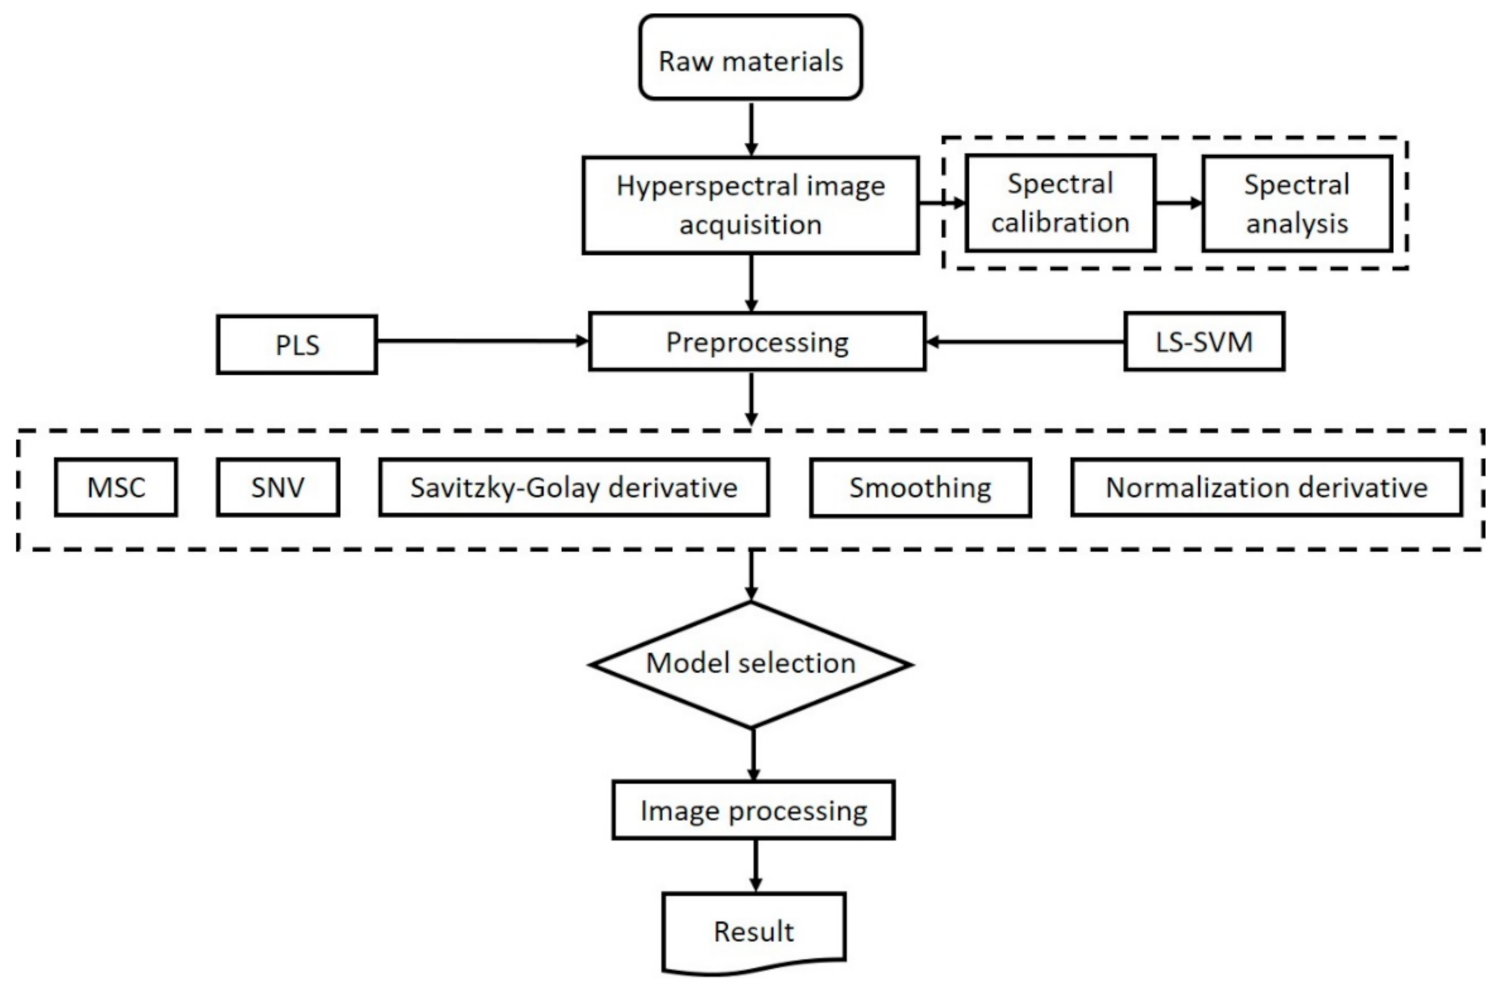
2.4. Model Delvelopment
2.5. Image Processing
3. Results
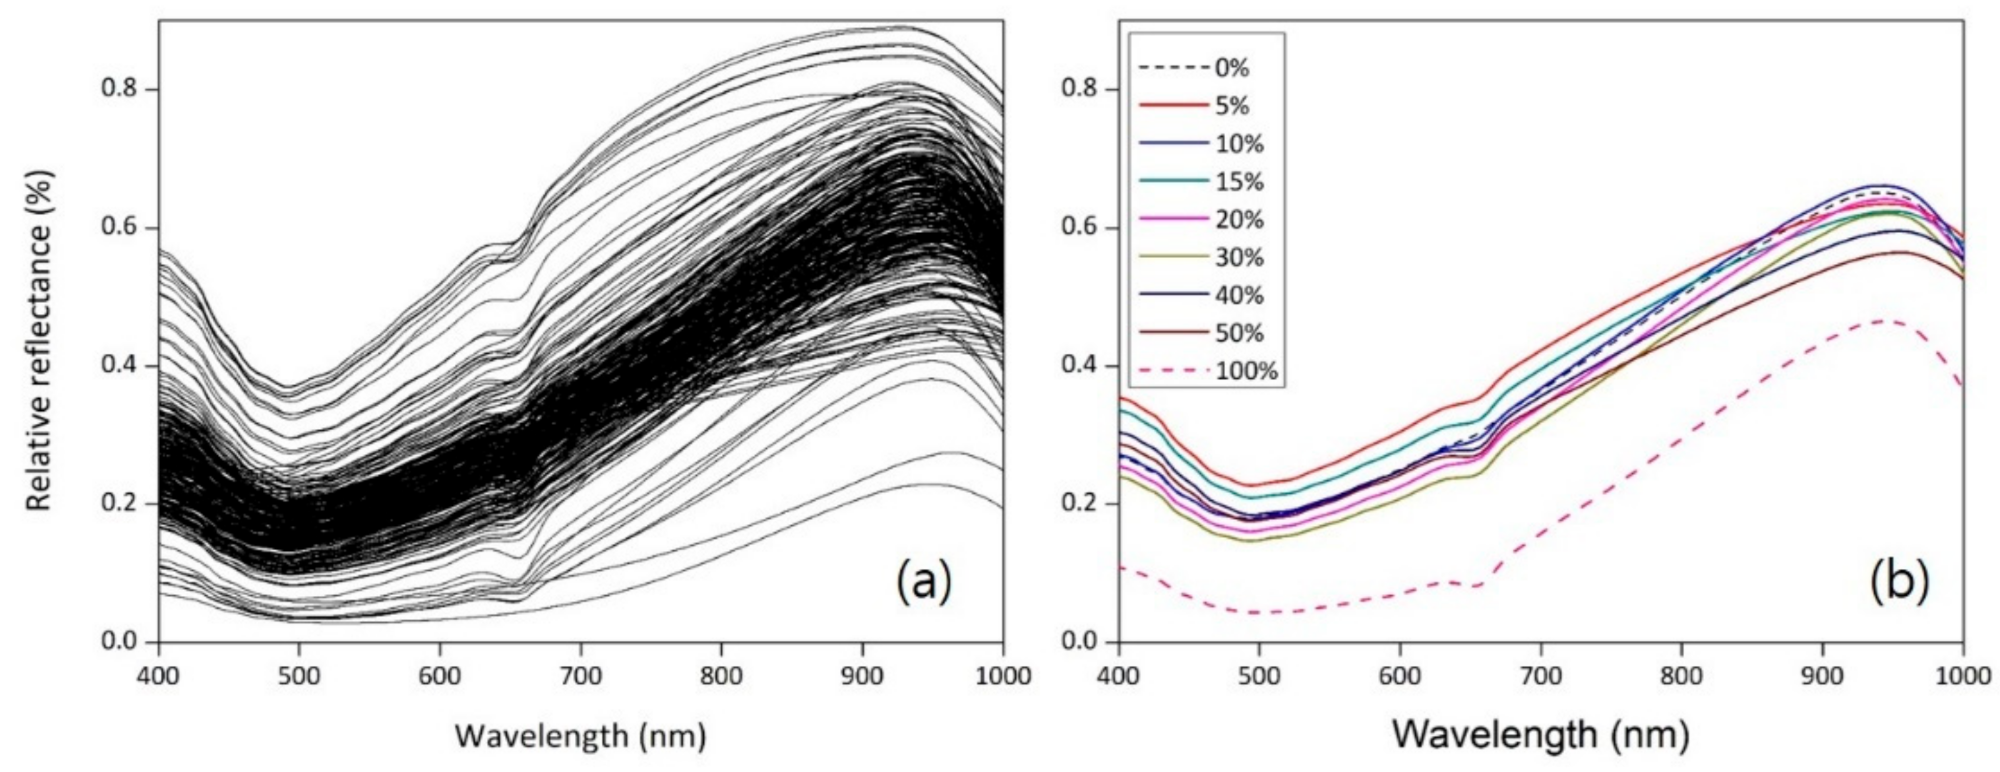
3.1. Spectral Data
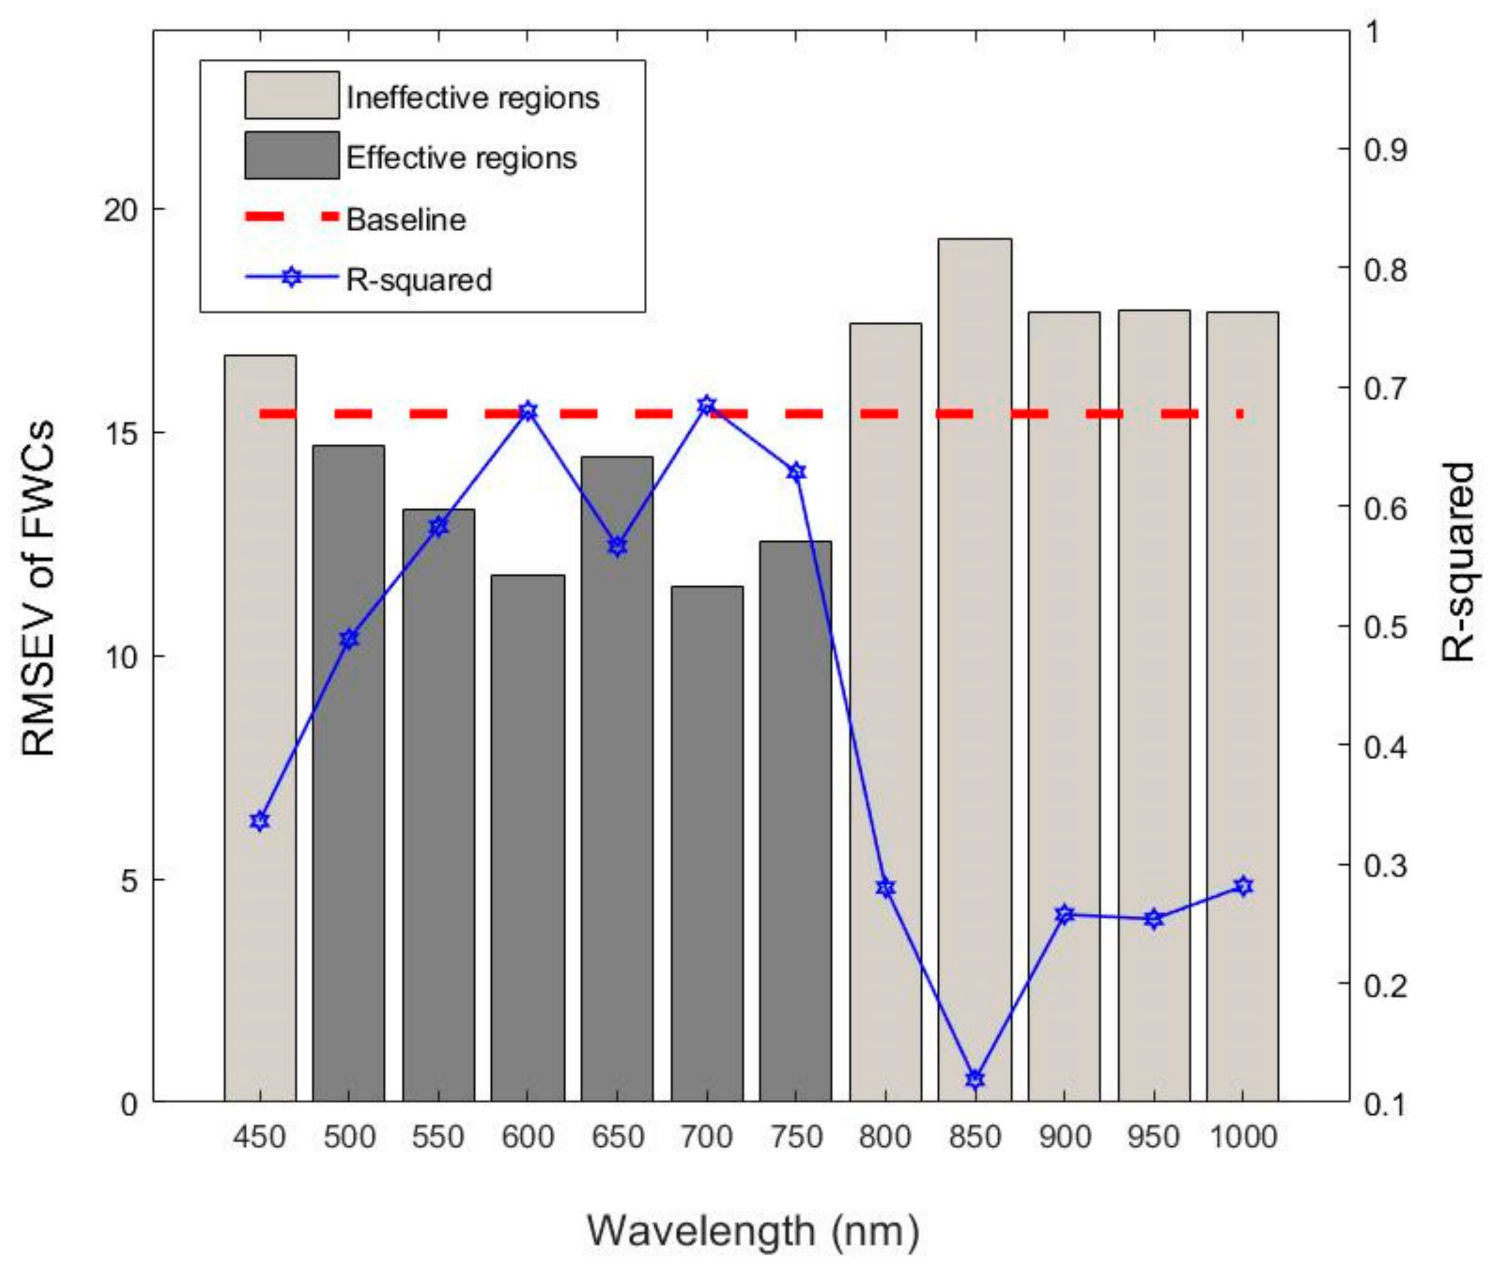
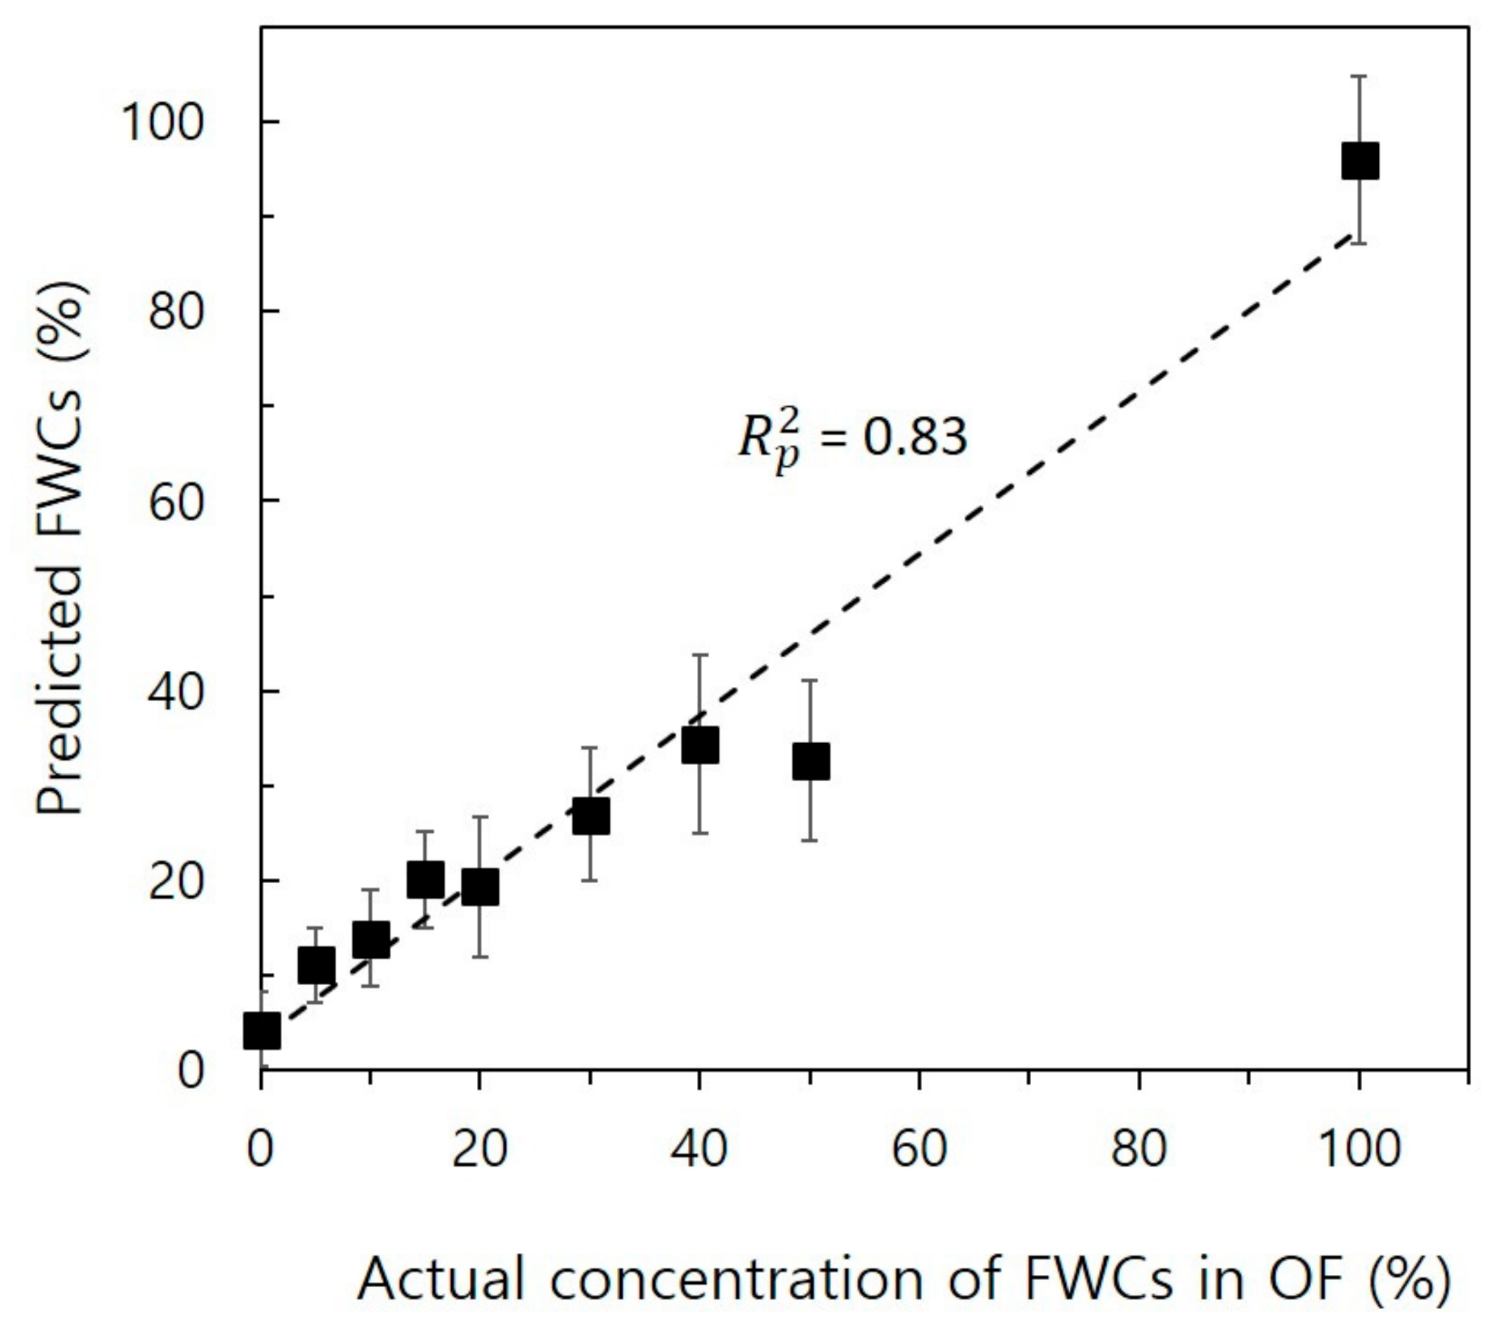
3.2. Model Development
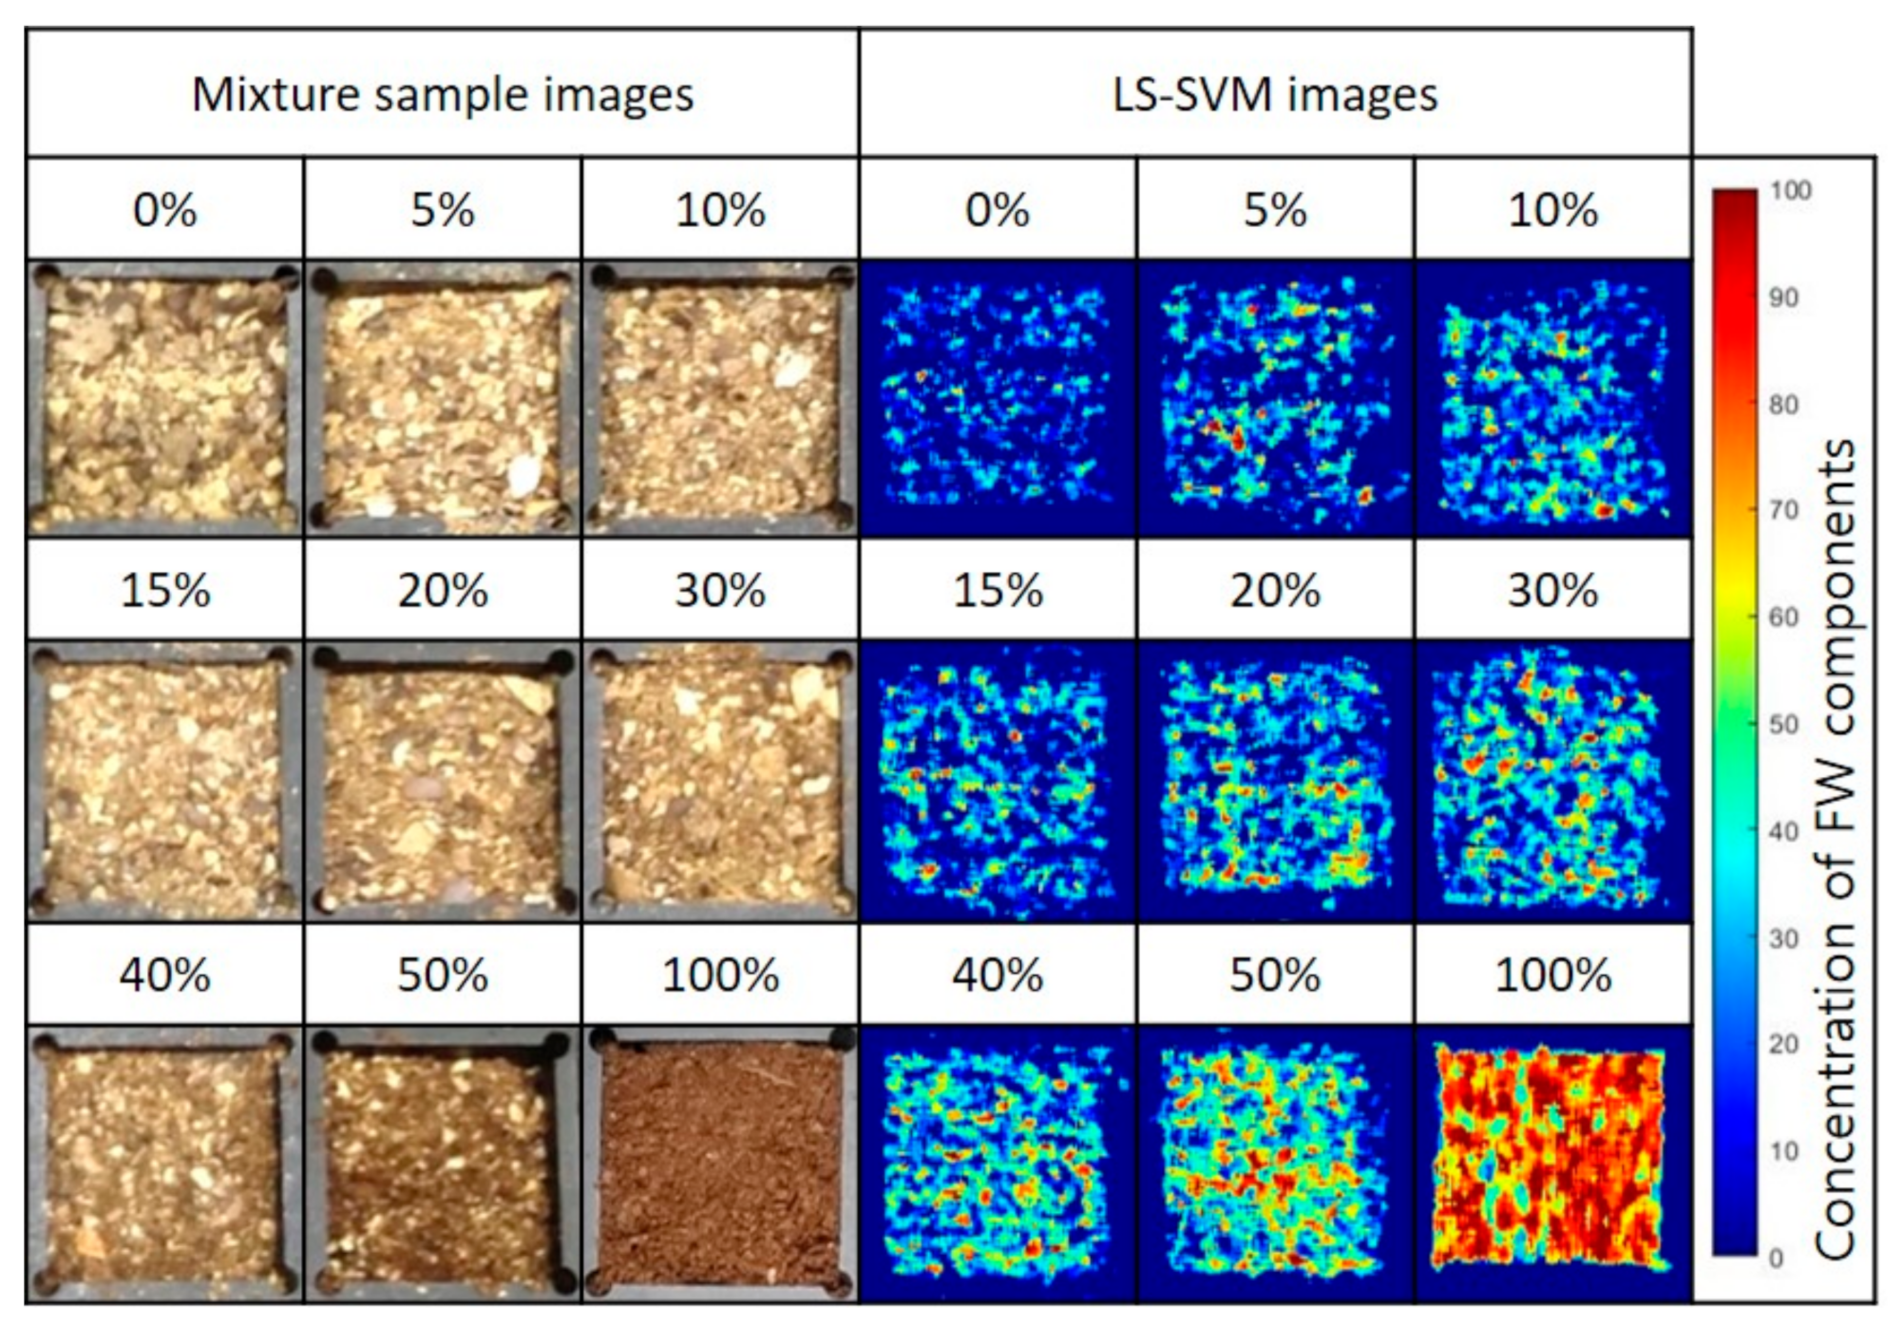
3.3. FWC Visucalization in Mixture Samples
4. Discussion
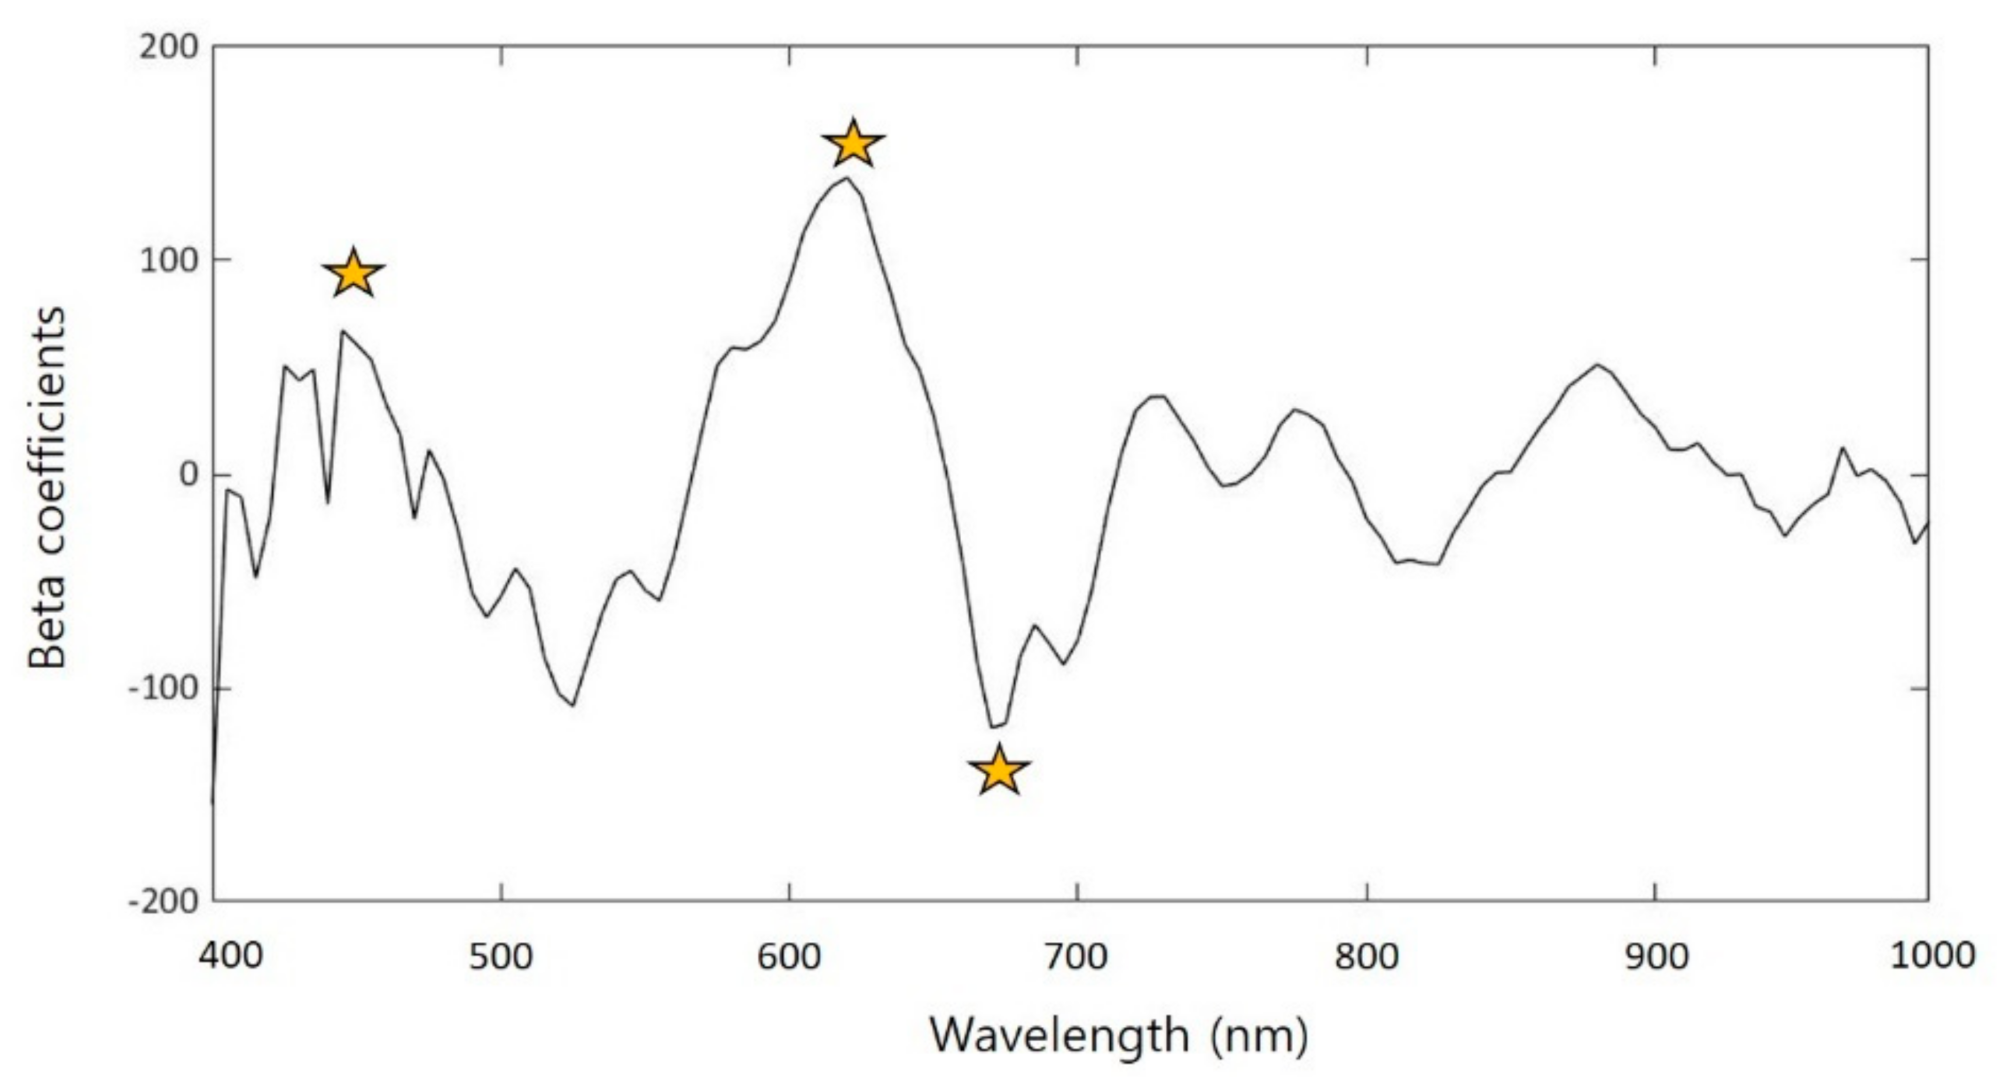
4.1. Spectral Analysis
4.2. PLS and SVM Model Analysis
4.3. Ananlysis of Hyperspectral FWC Imaging
5. Conclusions
Author Contributions
Funding
Institutional Review Board Statement
Informed Consent Statement
Data Availability Statement
Conflicts of Interest
References
- Capson-Tojo, G.; Rouez, M.; Crest, M.; Steyer, J.P.; Delgenès, J.P.; Escudié, R. Food waste valorization via anaerobic processes: A review. Rev. Environ. Sci. Biotechnol. 2016, 15, 499–547. [Google Scholar] [CrossRef]
- Chiew, Y.L.; Spångberg, J.; Baky, A.; Hansson, P.A.; Jönsson, H. Environmental impact of recycling digested food waste as a fertilizer in agriculture—A case study. Resour. Conserv. Recycl. 2015, 95, 1–14. [Google Scholar] [CrossRef]
- Kim, M.H.; Kim, J.W. Comparison through a LCA evaluation analysis of food waste disposal options from the perspective of global warming and resource recovery. Sci. Total Environ. 2010, 408, 3998–4006. [Google Scholar] [CrossRef]
- Vaverková, M.D.; Adamcová, D.; Winkler, J.; Koda, E.; Červenková, J.; Podlasek, A. Influence of a municipal solid waste landfill on the surrounding environment: Landfill vegetation as a potential risk of allergenic pollen. Int. J. Environ. Res. Public Health 2019, 16, 64. [Google Scholar] [CrossRef] [Green Version]
- Palmiotto, M.; Fattore, E.; Paiano, V.; Celeste, G.; Colombo, A.; Davoli, E. Influence of a municipal solid waste landfill in the surrounding environment: Toxicological risk and odor nuisance effects. Environ. Int. 2014, 68, 16–24. [Google Scholar] [CrossRef] [PubMed]
- Thassitou, P.K.; Arvanitoyannis, I.S. Bioremediation: A novel approach to food waste management. Trends Food Sci. Technol. 2001, 12, 185–196. [Google Scholar] [CrossRef]
- Stabnikova, O.; Ding, H.B.; Tay, J.H.; Wang, J.Y. Biotechnology for aerobic conversion of food waste into organic fertilizer. Waste Manag. Res. 2005, 23, 39–47. [Google Scholar] [CrossRef] [PubMed]
- Hamid, H.A.; Harun, H.; Sunar, N.; Muhammad, M.S.; Hamidon, N.; Ali, R.; Ahmad, F.H.; Qi, L.P. Development of Organic Fertilizer From Food Waste By Composting in Uthm Pagoh. Sustain. Environ. Technol. 2018, 1, 1–6. [Google Scholar]
- Acosta-Motos, J.R.; Ortuño, M.F.; Bernal-Vicente, A.; Diaz-Vivancos, P.; Sanchez-Blanco, M.J.; Hernandez, J.A. Plant responses to salt stress: Adaptive mechanisms. Agronomy 2017, 7, 18. [Google Scholar] [CrossRef] [Green Version]
- Lee, I.B.; Kim, P.J.; Chang, K.W. Evaluation of stability of compost prepared with korean food wastes. Soil Sci. Plant Nutr. 2002, 48, 1–8. [Google Scholar] [CrossRef]
- Jin, C.; Sun, S.; Yang, D.; Sheng, W.; Ma, Y.; He, W.; Li, G. Anaerobic digestion: An alternative resource treatment option for food waste in China. Sci. Total Environ. 2021, 779, 146397. [Google Scholar] [CrossRef]
- Kim, Y.; Kim, D.; Lee, G. Physicochemical Properties of a Mixture of Dried Food Waste Powder with Organic Fertilizer and Effects on the Growth of Major Leafy Vegetable. J. Korea Org. Resour. Recycl. Assoc. 2019, 27, 5–13. [Google Scholar] [CrossRef]
- Amanah, H.Z.; Joshi, R.; Masithoh, R.E.; Choung, M.-G.; Kim, K.-H.; Kim, G.; Cho, B.-K. Nondestructive measurement of anthocyanin in intact soybean seed using Fourier Transform Near-Infrared (FT-NIR) and Fourier Transform Infrared (FT-IR) spectroscopy. Infrared Phys. Technol. 2020, 111, 103477. [Google Scholar] [CrossRef]
- Kim, G.; Baek, I.; Stocker, M.D.; Smith, J.E.; Van Tassell, A.L.; Qin, J.; Chan, D.E.; Pachepsky, Y.; Kim, M.S. Hyperspectral Imaging from a Multipurpose Floating Platform to Estimate Chlorophyll-a Concentrations in Irrigation Pond Water. Remote Sens. 2020, 12, 2070. [Google Scholar] [CrossRef]
- Kim, M.S.; Chen, Y.R.; Mehl, P.M. Hyperspectral reflectance and fluorescence imaging system for food quality and safety. Trans. ASAE 2001, 44. [Google Scholar] [CrossRef]
- An, D.; Zhao, G.; Chang, C.; Wang, Z.; Li, P.; Zhang, T.; Jia, J. Hyperspectral field estimation and remote-sensing inversion of salt content in coastal saline soils of the Yellow River Delta. Int. J. Remote Sens. 2016, 37, 455–470. [Google Scholar] [CrossRef]
- Kumar, J.P.; Deshpande, S.; Inamdar, A. Detection of Fertilizer Quantity in Soil Using Hyperspectral Data. In Proceedings of the 9th Workshop on Hyperspectral Image and Signal Processing: Evolution in Remote Sensing, Amsterdam, The Netherlands, 1–4 September 2018. [Google Scholar] [CrossRef]
- Wang, Y.; Hu, X.; Hou, Z.; Ning, J.; Zhang, Z. Discrimination of nitrogen fertilizer levels of tea plant (Camellia sinensis) based on hyperspectral imaging. J. Sci. Food Agric. 2018, 98, 4659–4664. [Google Scholar] [CrossRef] [PubMed]
- Sha, W.; Li, J.; Xiao, W.; Ling, P.; Lu, C. Quantitative analysis of elements in fertilizer using laser-induced breakdown spectroscopy coupled with support vector regression model. Sensors 2019, 19, 3277. [Google Scholar] [CrossRef] [Green Version]
- Lin, Z.; Wang, R.; Wang, Y.; Wang, L.; Lu, C.; Liu, Y.; Zhang, Z.; Zhu, L. Accurate and rapid detection of soil and fertilizer properties based on visible/near-infrared spectroscopy. Appl. Opt. 2018, 57, D69. [Google Scholar] [CrossRef] [PubMed]
- Kira, O.; Linker, R.; Gitelson, A. Non-destructive estimation of foliar chlorophyll and carotenoid contents: Focus on informative spectral bands. Int. J. Appl. Earth Obs. Geoinf. 2015, 38, 251–260. [Google Scholar] [CrossRef]
- Lee, H.; Kim, M.S.; Lohumi, S.; Cho, B.-K. Detection of melamine in milk powder using MCT-based short-wave infrared hyperspectral imaging system. Food Addit. Contam. Part A 2018, 35, 1027–1037. [Google Scholar] [CrossRef] [PubMed]
- Yi, Q.; Jiapaer, G.; Chen, J.; Bao, A.; Wang, F. Different units of measurement of carotenoids estimation in cotton using hyperspectral indices and partial least square regression. ISPRS J. Photogramm. Remote Sens. 2014, 91, 72–84. [Google Scholar] [CrossRef]
- Yuan, H.; Yang, G.; Li, C.; Wang, Y.; Liu, J.; Yu, H.; Feng, H.; Xu, B.; Zhao, X.; Yang, X. Retrieving soybean leaf area index from unmanned aerial vehicle hyperspectral remote sensing: Analysis of RF, ANN, and SVM regression models. Remote Sens. 2017, 9, 309. [Google Scholar] [CrossRef] [Green Version]
- Lante, A.; Lomolino, G.; Cagnin, M.; Spettoli, P. Content and characterisation of minerals in milk and in Crescenza and Squacquerone Italian fresh cheeses by ICP-OES. Food Control 2006, 17, 229–233. [Google Scholar] [CrossRef]
- Li, W.; Simmons, P.; Shrader, D.; Herrman, T.J.; Dai, S.Y. Microwave plasma-atomic emission spectroscopy as a tool for the determination of copper, iron, manganese and zinc in animal feed and fertilizer. Talanta 2013, 112, 43–48. [Google Scholar] [CrossRef]
- Baek, I.; Lee, H.; Cho, B.; Mo, C.; Chan, D.E.; Kim, M.S. Shortwave infrared hyperspectral imaging system coupled with multivariable method for TVB-N measurement in pork. Food Control 2021, 124, 107854. [Google Scholar] [CrossRef]
- Faqeerzada, M.A.; Perez, M.; Lohumi, S.; Lee, H.; Kim, G.; Wakholi, C.; Joshi, R.; Cho, B.-K. Online Application of a Hyperspectral Imaging System for the Sorting of Adulterated Almonds. Appl. Sci. 2020, 10, 6569. [Google Scholar] [CrossRef]
- Faqeerzada, M.A.; Lohumi, S.; Kim, G.; Joshi, R.; Lee, H.; Kim, M.S.; Cho, B.-K. Hyperspectral Shortwave Infrared Image Analysis for Detection of Adulterants in Almond Powder with One-Class Classification Method. Sensors 2020, 20, 5855. [Google Scholar] [CrossRef]
- Qin, J.; Chao, K.; Kim, M.S.; Lu, R.; Burks, T.F. Hyperspectral and multispectral imaging for evaluating food safety and quality. J. Food Eng. 2013, 118, 157–171. [Google Scholar] [CrossRef]
- Christopher, J.C. Burgers A Tutorial on Support Vector Machines for Pattern Recognition. Data Min. Knowl. Discov. 1998, 2, 121–167. [Google Scholar]
- Lee, H.; Kim, M.S.; Lee, W.H.; Cho, B.K. Determination of the total volatile basic nitrogen (TVB-N) content in pork meat using hyperspectral fluorescence imaging. Sens. Actuators B Chem. 2018, 259, 532–539. [Google Scholar] [CrossRef]
- Lee, H.; Cho, B.-K.; Kim, M.S.; Lee, W.-H.; Tewari, J.; Bae, H.; Sohn, S.-I.; Chi, H.-Y. Prediction of crude protein and oil content of soybeans using Raman spectroscopy. Sensors Actuators B Chem. 2013, 185, 694–700. [Google Scholar] [CrossRef] [Green Version]
- Manley, M. Near-infrared spectroscopy and hyperspectral imaging: Non-destructive analysis of biological materials. Chem. Soc. Rev. 2014, 43, 8200–8214. [Google Scholar] [CrossRef] [PubMed] [Green Version]
- Ilani, T.; Herrmann, I.; Karnieli, A.; Arye, G. Characterization of the biosolids composting process by hyperspectral analysis. Waste Manag. 2016, 48, 106–114. [Google Scholar] [CrossRef]
- Ben-Dor, E.; Inbar, Y.; Chen, Y. The reflectance spectra of organic matter in the visible near-infrared and short wave infrared region (400–2500 nm) during a controlled decomposition process. Remote Sens. Environ. 1997, 61, 1–15. [Google Scholar] [CrossRef]
- Curran, P.J. Remote sensing of foliar chemistry. Remote Sens. Environ. 1989, 30, 271–278. [Google Scholar] [CrossRef]
- Chu, B.; Chen, K.; Pan, X.; Wu, Q.; Liu, S.; Gong, J.; Li, X. Visible/Short-wave near-infrared hyperspectral analysis of lipid concentration and fatty acid unsaturation of Scenedesmus obliquus in situ. Comput. Electron. Agric. 2021, 182, 106046. [Google Scholar] [CrossRef]
- Clarke, F.C.; Hammond, S.V.; Jee, R.D.; Moffat, A.C. Determination of the information depth and sample size for the analysis of pharmaceutical materials using reflectance near-infrared microscopy. Appl. Spectrosc. 2002, 56, 1475–1483. [Google Scholar] [CrossRef]
- Baveye, P.C.; Laba, M. Visible and near-infrared reflectance spectroscopy is of limited practical use to monitor soil contamination by heavy metals. J. Hazard. Mater. 2015, 285, 137–139. [Google Scholar] [CrossRef]
- Fu, X.; Chen, J.; Zhang, J.; Fu, F.; Wu, C. Effect of penetration depth and particle size on detection of wheat flour adulterant using hyperspectral imaging. Biosyst. Eng. 2021, 204, 64–78. [Google Scholar] [CrossRef]


| Materials | NaCl (mg/g) | Capsaicin (mg/g) |
|---|---|---|
| FW fertilizer | 752.52 | 1637.31 |
| Castor oil cake | 57.29 | 0 |
| Rapeseed oil cake | 37.77 | 0 |
| Soybean oil cake | 2.56 | 0 |
| Bone dust | 479.32 | 0 |
| Rice bran | 9.64 | 0 |
| Fish meal | 412.58 | 0 |
| Models | Preprocessing | Calibration | Prediction | ||||||
|---|---|---|---|---|---|---|---|---|---|
| SEC (%) | Factors | Bias | SEP (%) | Bias | |||||
| PLS | Smoothing | 0.74 | 10.35 | 9 | 0.69 | 0.65 | 12.27 | 0.57 | |
| Normalization | Mean | 0.79 | 9.47 | 6 | 0.74 | 0.76 | 10.12 | 0.10 | |
| Maximum | 0.8 | 9.22 | 8 | 0.76 | 0.71 | 11.28 | 0.78 | ||
| Range | 0.77 | 9.73 | 8 | 0.73 | 0.68 | 11.7 | 0.76 | ||
| MSC | 0.77 | 9.77 | 7 | 0.73 | 0.67 | 12.03 | 5.03 | ||
| SNV | 0.75 | 10.18 | 7 | 0.71 | 0.69 | 11.53 | 0.53 | ||
| SGD | 1st deri. | 0.75 | 10.28 | 7 | 0.68 | 0.66 | 11.94 | −0.12 | |
| 2nd deri. | 0.79 | 9.32 | 9 | 0.67 | 0.68 | 11.68 | −0.06 | ||
| Raw | 0.73 | 10.52 | 8 | 0.69 | 0.676 | 11.73 | −0.20 | ||
| LS-SVM | Smoothing | 0.9 | 6.44 | - | 0.76 | 0.76 | 10.03 | −0.12 | |
| Normalization | Mean | 0.85 | 7.86 | - | 0.82 | 0.82 | 8.62 | 1.17 | |
| Maximum | 0.89 | 6.81 | - | 0.81 | 0.82 | 8.74 | 0.40 | ||
| Range | 0.87 | 7.44 | - | 0.83 | 0.83 | 8.46 | 0.94 | ||
| MSC | 0.9 | 6.36 | - | 0.83 | 0.83 | 8.55 | 4.53 | ||
| SNV | 0.92 | 5.85 | - | 0.81 | 0.81 | 8.96 | 0.78 | ||
| SGD | 1st deri. | 0.95 | 4.5 | - | 0.83 | 0.84 | 8.34 | −0.36 | |
| 2nd deri. | 0.99 | 2.26 | - | 0.78 | 0.78 | 9.64 | −0.24 | ||
| Raw | 0.89 | 6.75 | - | 0.83 | 0.83 | 8.52 | 0.41 | ||
Publisher’s Note: MDPI stays neutral with regard to jurisdictional claims in published maps and institutional affiliations. |
© 2021 by the authors. Licensee MDPI, Basel, Switzerland. This article is an open access article distributed under the terms and conditions of the Creative Commons Attribution (CC BY) license (https://creativecommons.org/licenses/by/4.0/).
Share and Cite
Kim, G.; Lee, H.; Cho, B.-K.; Baek, I.; Kim, M.S. Quantitative Evaluation of Food-Waste Components in Organic Fertilizer Using Visible–Near-Infrared Hyperspectral Imaging. Appl. Sci. 2021, 11, 8201. https://doi.org/10.3390/app11178201
Kim G, Lee H, Cho B-K, Baek I, Kim MS. Quantitative Evaluation of Food-Waste Components in Organic Fertilizer Using Visible–Near-Infrared Hyperspectral Imaging. Applied Sciences. 2021; 11(17):8201. https://doi.org/10.3390/app11178201
Chicago/Turabian StyleKim, Geonwoo, Hoonsoo Lee, Byoung-Kwan Cho, Insuck Baek, and Moon S. Kim. 2021. "Quantitative Evaluation of Food-Waste Components in Organic Fertilizer Using Visible–Near-Infrared Hyperspectral Imaging" Applied Sciences 11, no. 17: 8201. https://doi.org/10.3390/app11178201
APA StyleKim, G., Lee, H., Cho, B.-K., Baek, I., & Kim, M. S. (2021). Quantitative Evaluation of Food-Waste Components in Organic Fertilizer Using Visible–Near-Infrared Hyperspectral Imaging. Applied Sciences, 11(17), 8201. https://doi.org/10.3390/app11178201