
Comparison of Manual versus Semi-Automatic Segmentations of the Stenotic Carotid Artery Bifurcation

 ,
,
Abstract
:1. Introduction
1.1. Imaging of Carotid Artery Pathology and Its Clinical Relevance
1.2. Computational Geometries for Blood Flow Simulation in Stenotic Carotid Artery
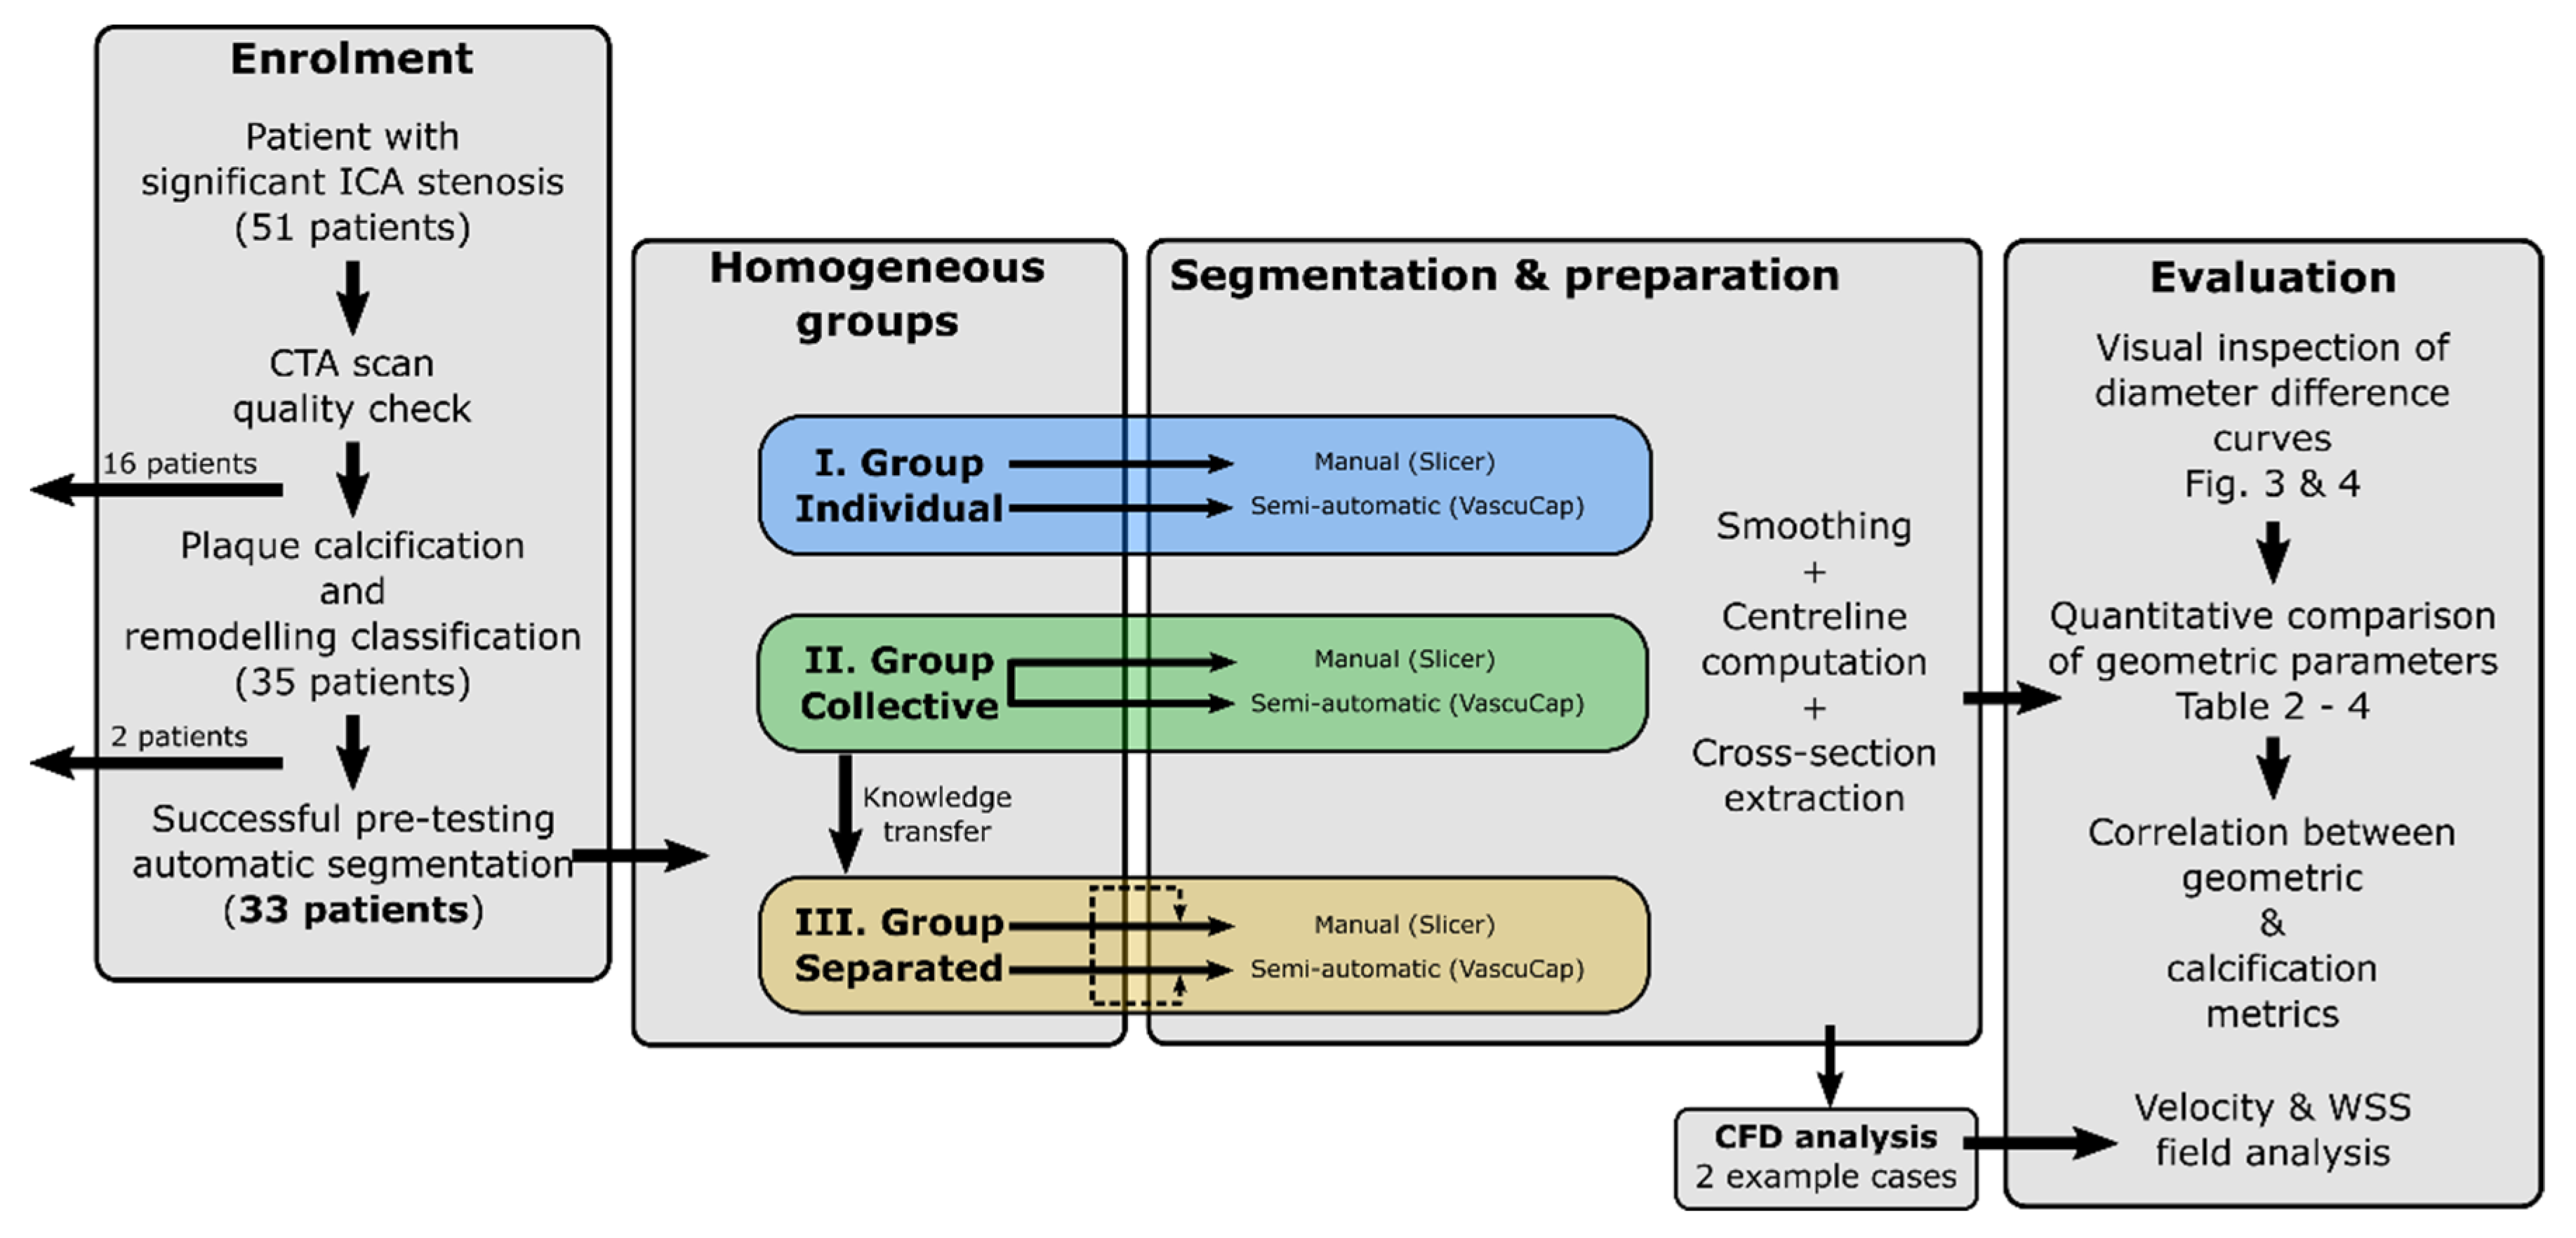
2. Materials and Methods
2.1. Enrolment of Patients
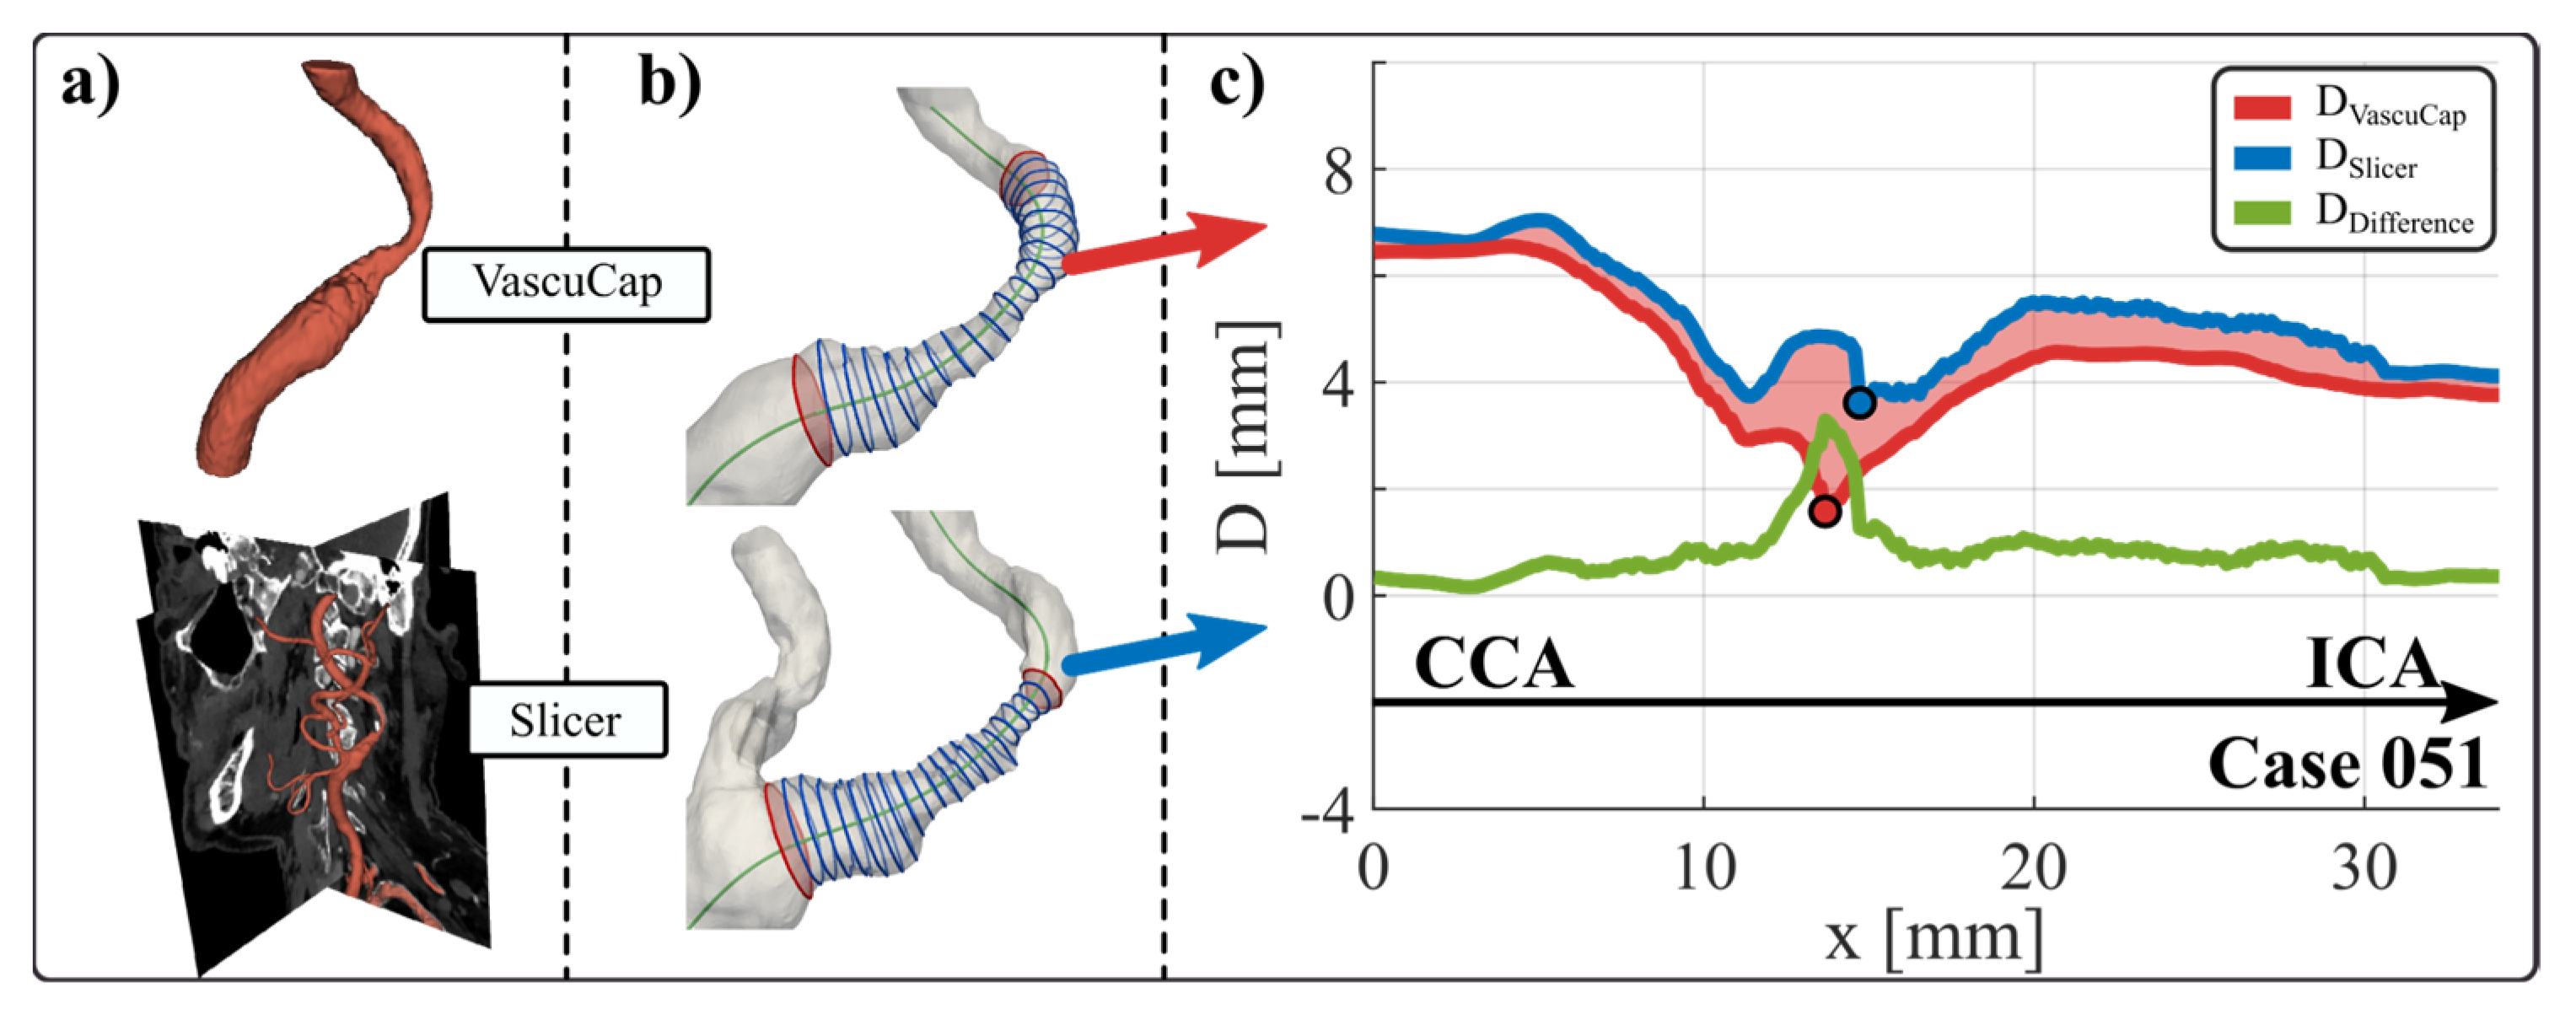
2.2. Segmentation and Preparation (VascuCap vs. Slicer)
2.3. CFD Analysis
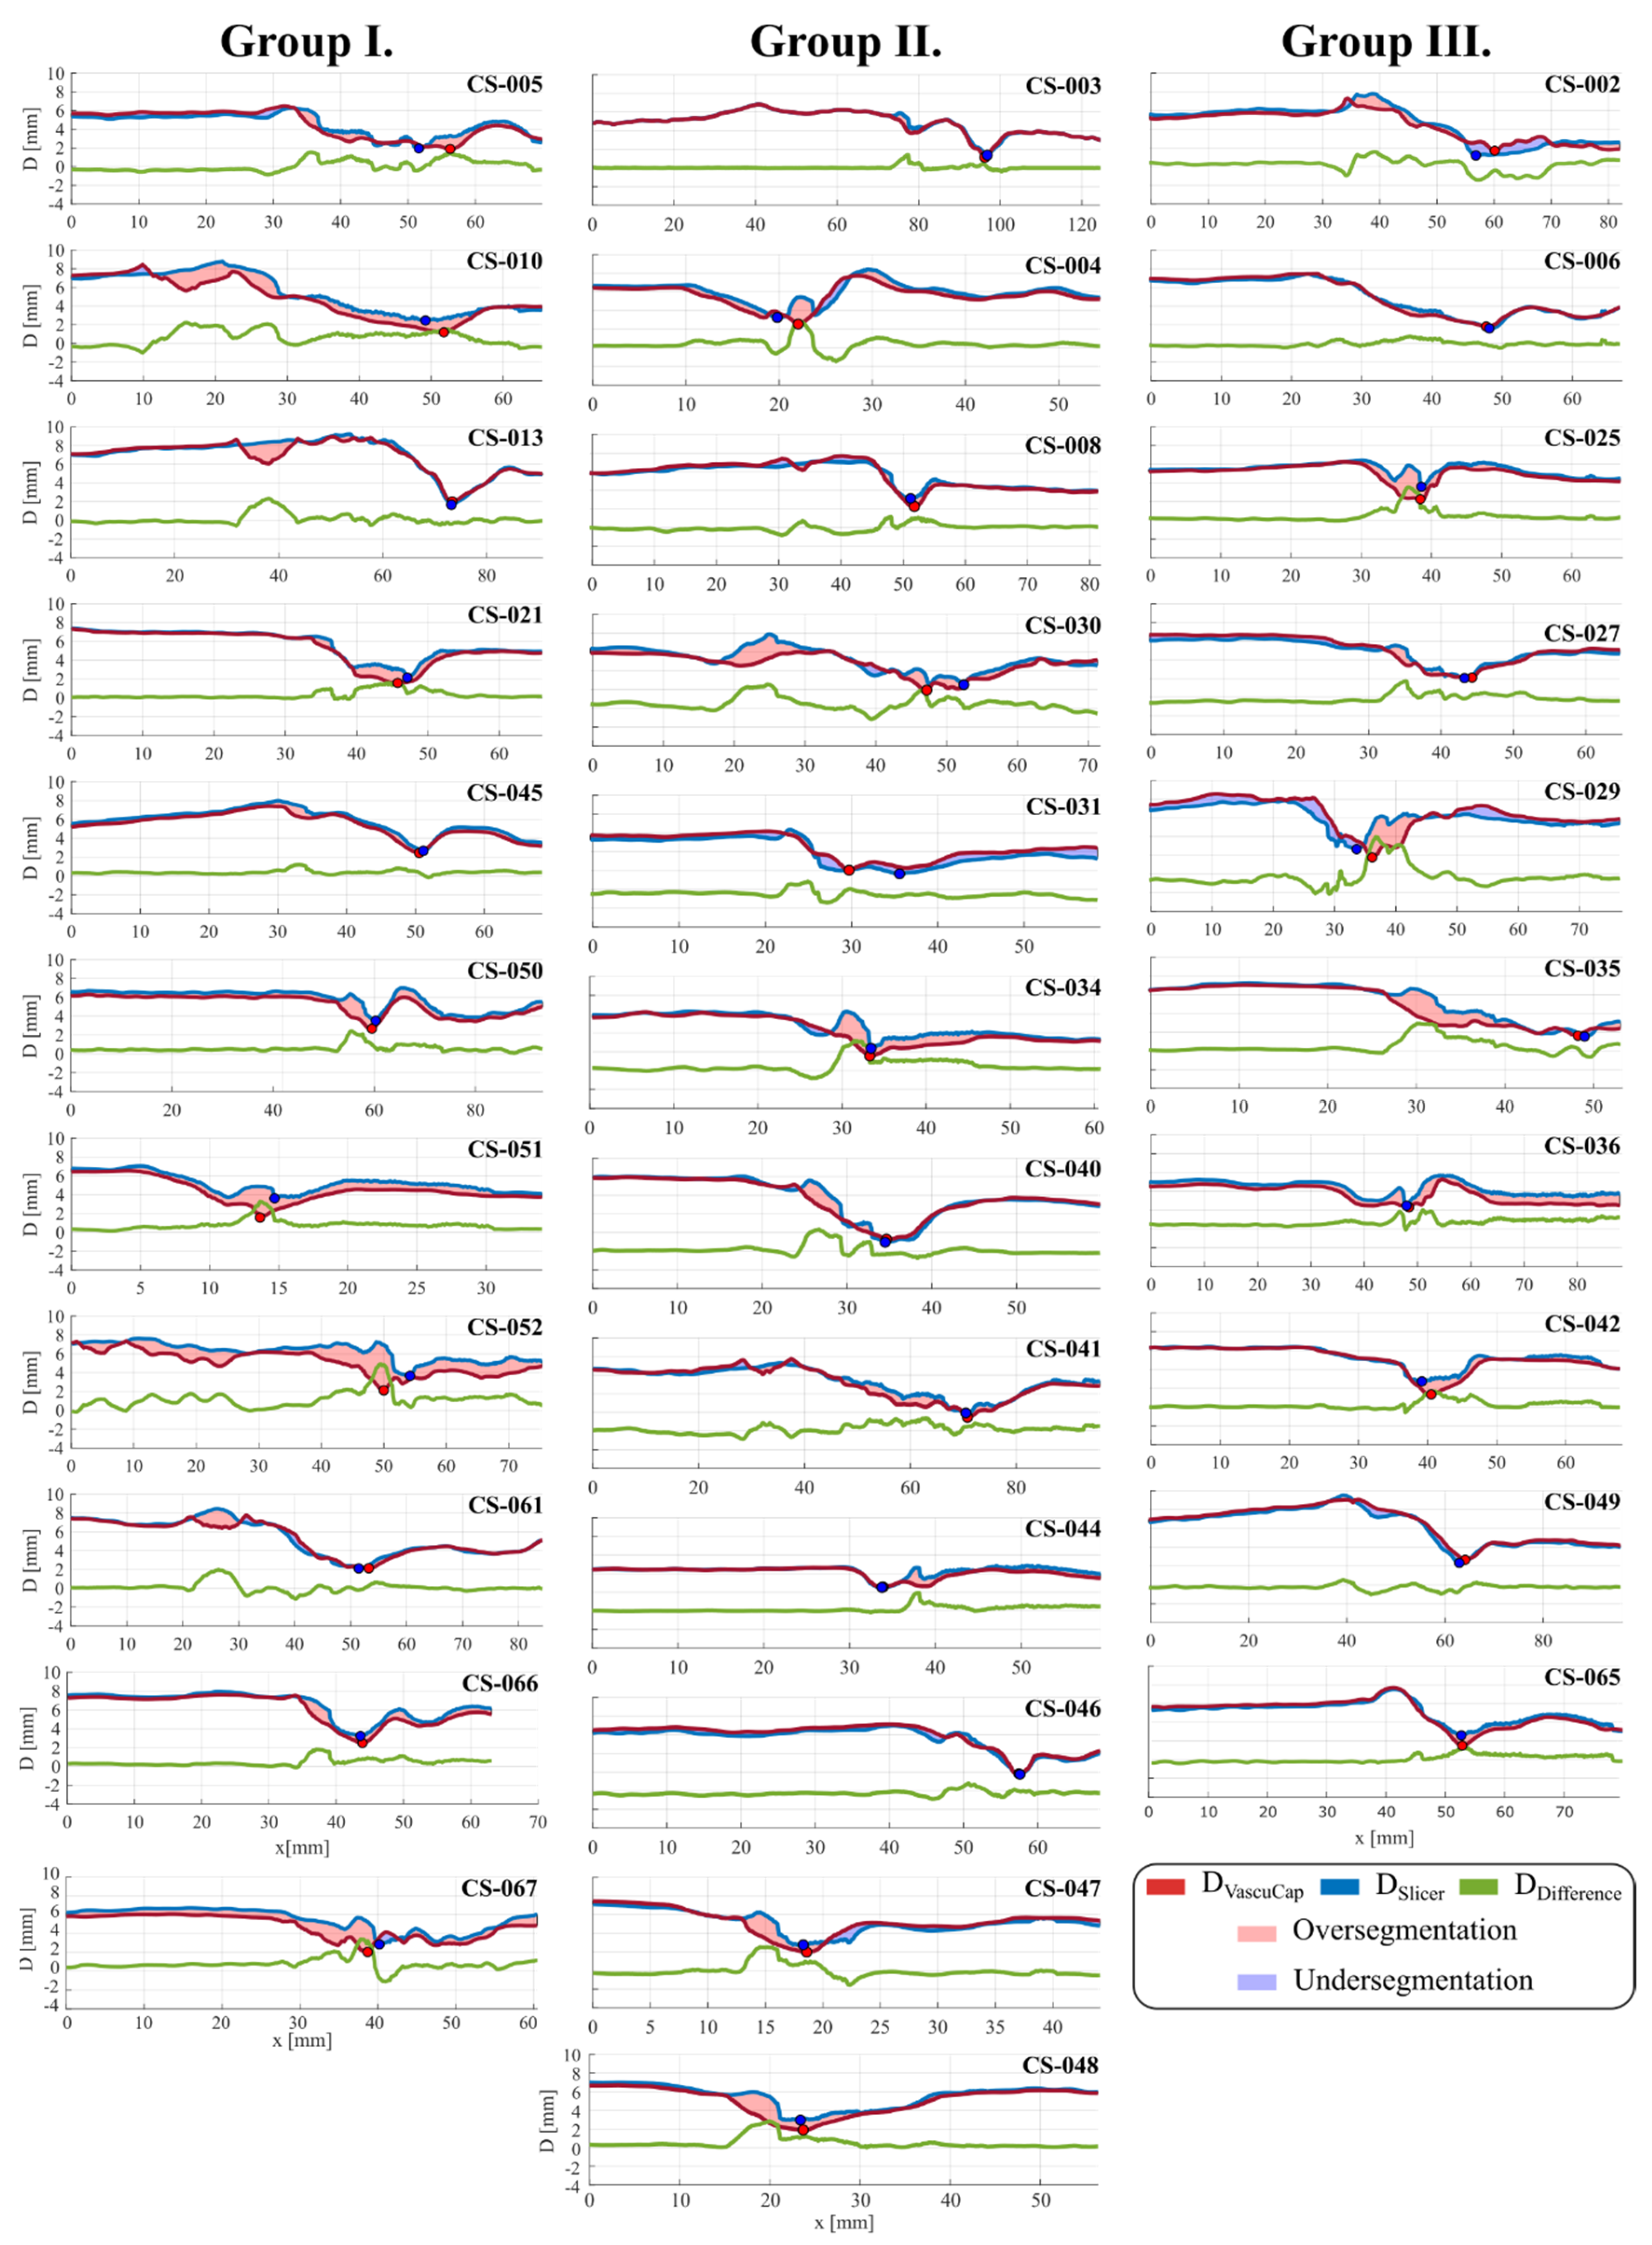
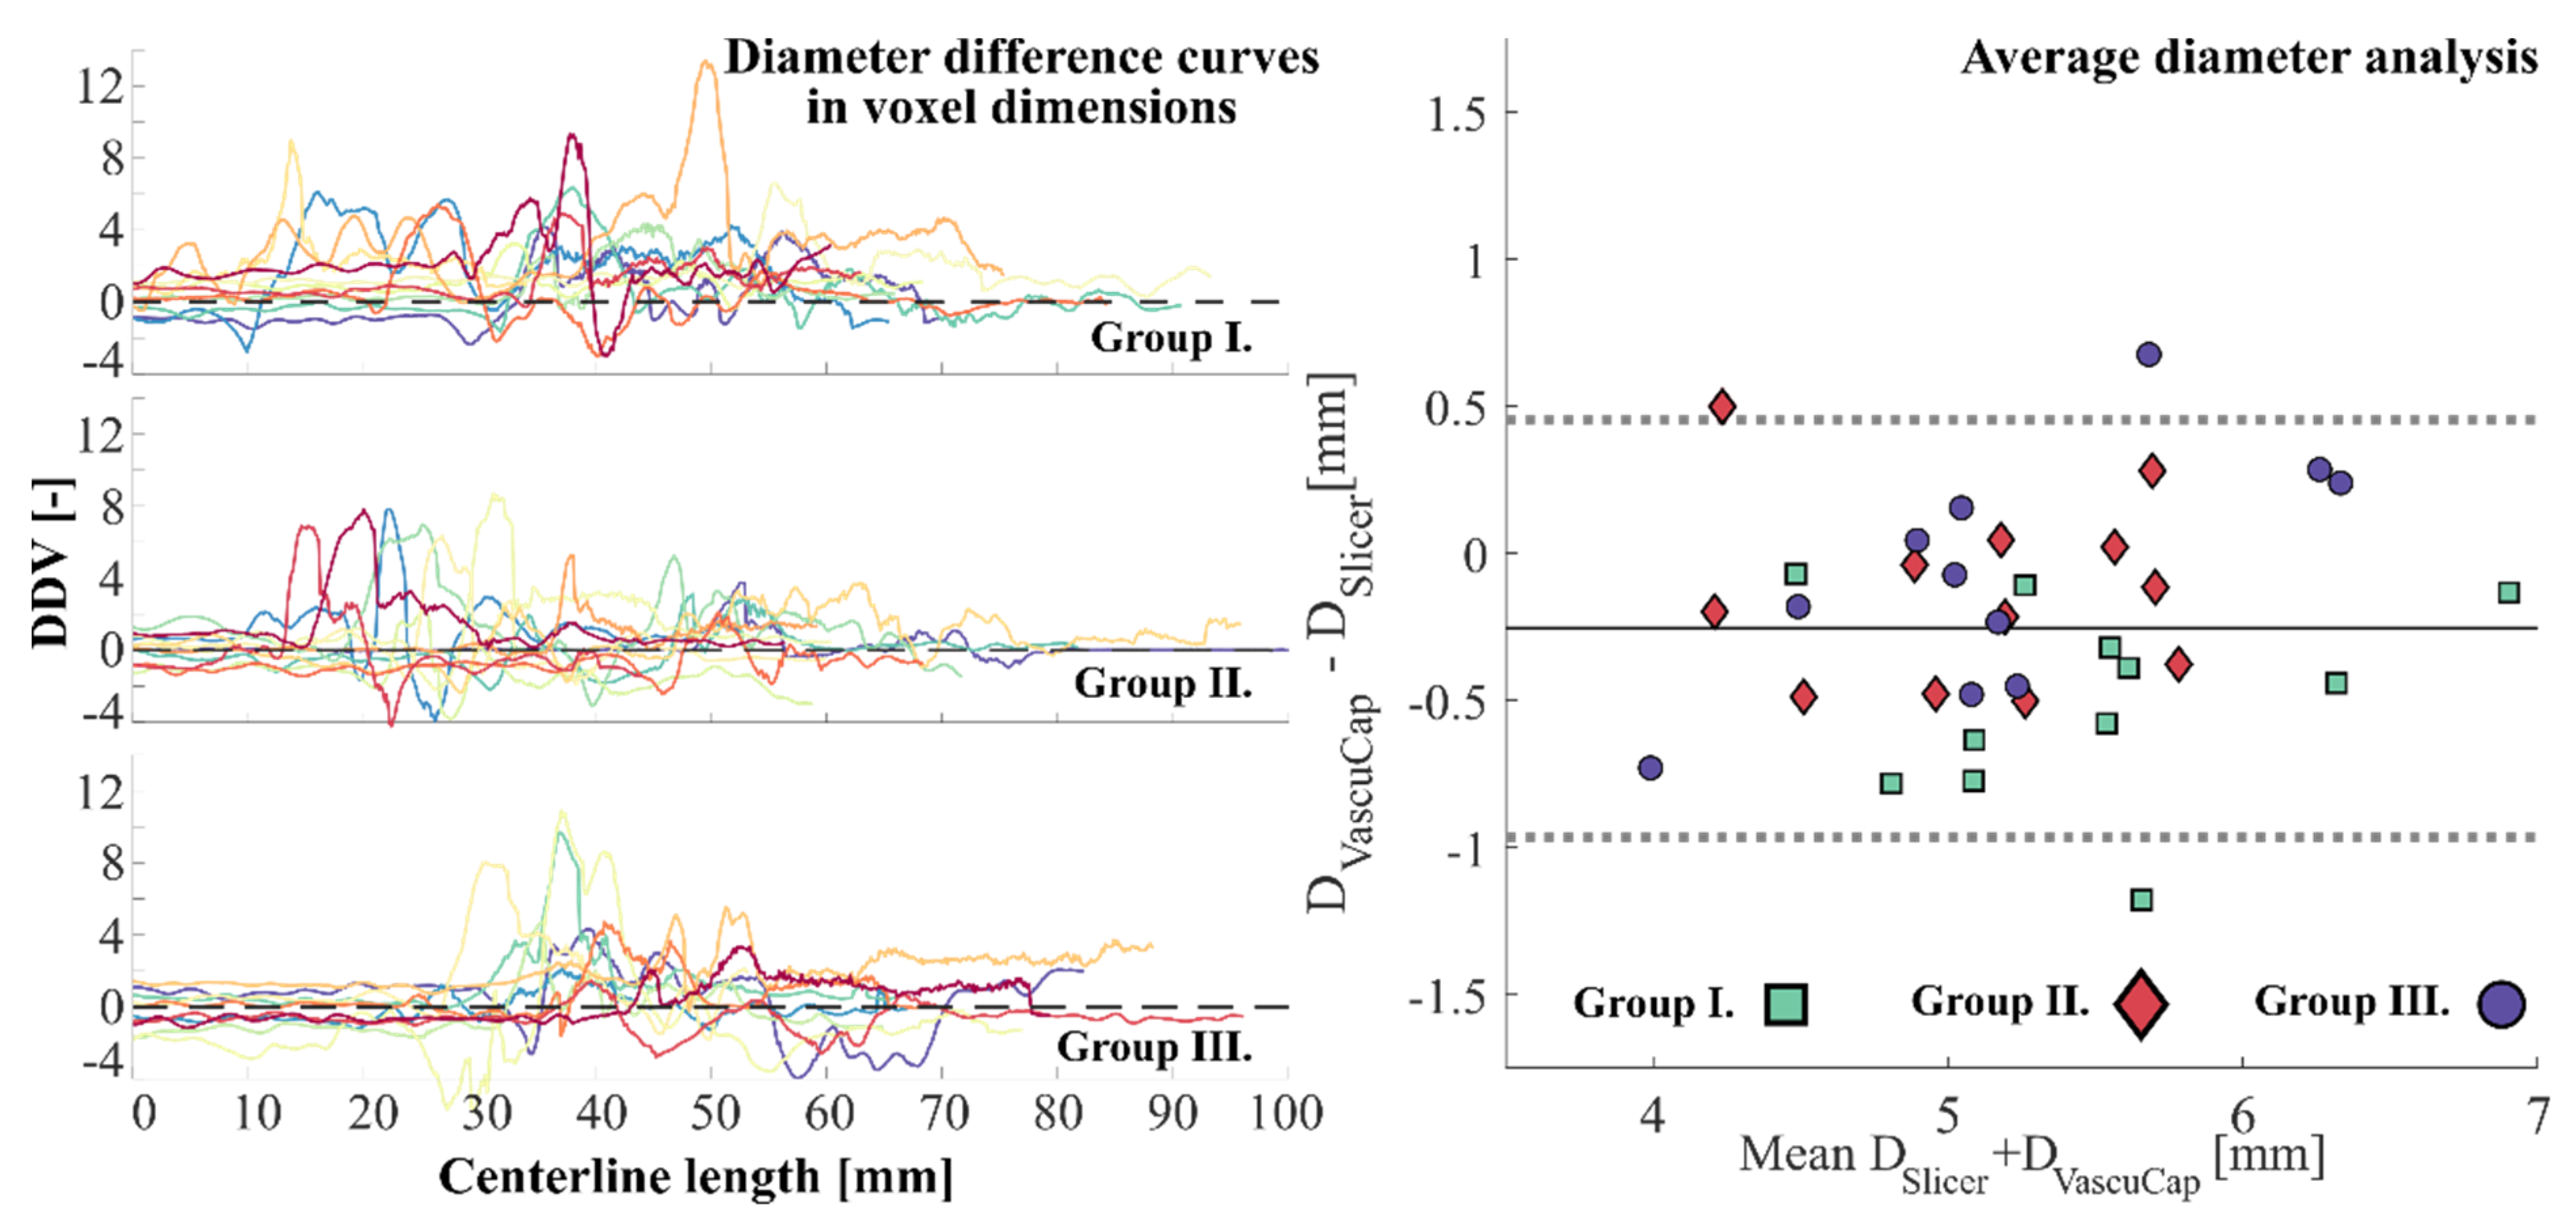
2.4. Evaluation
3. Results
3.1. Segmentation Comparisons
3.2. Effect of Calcification on Correlation of Segmentation
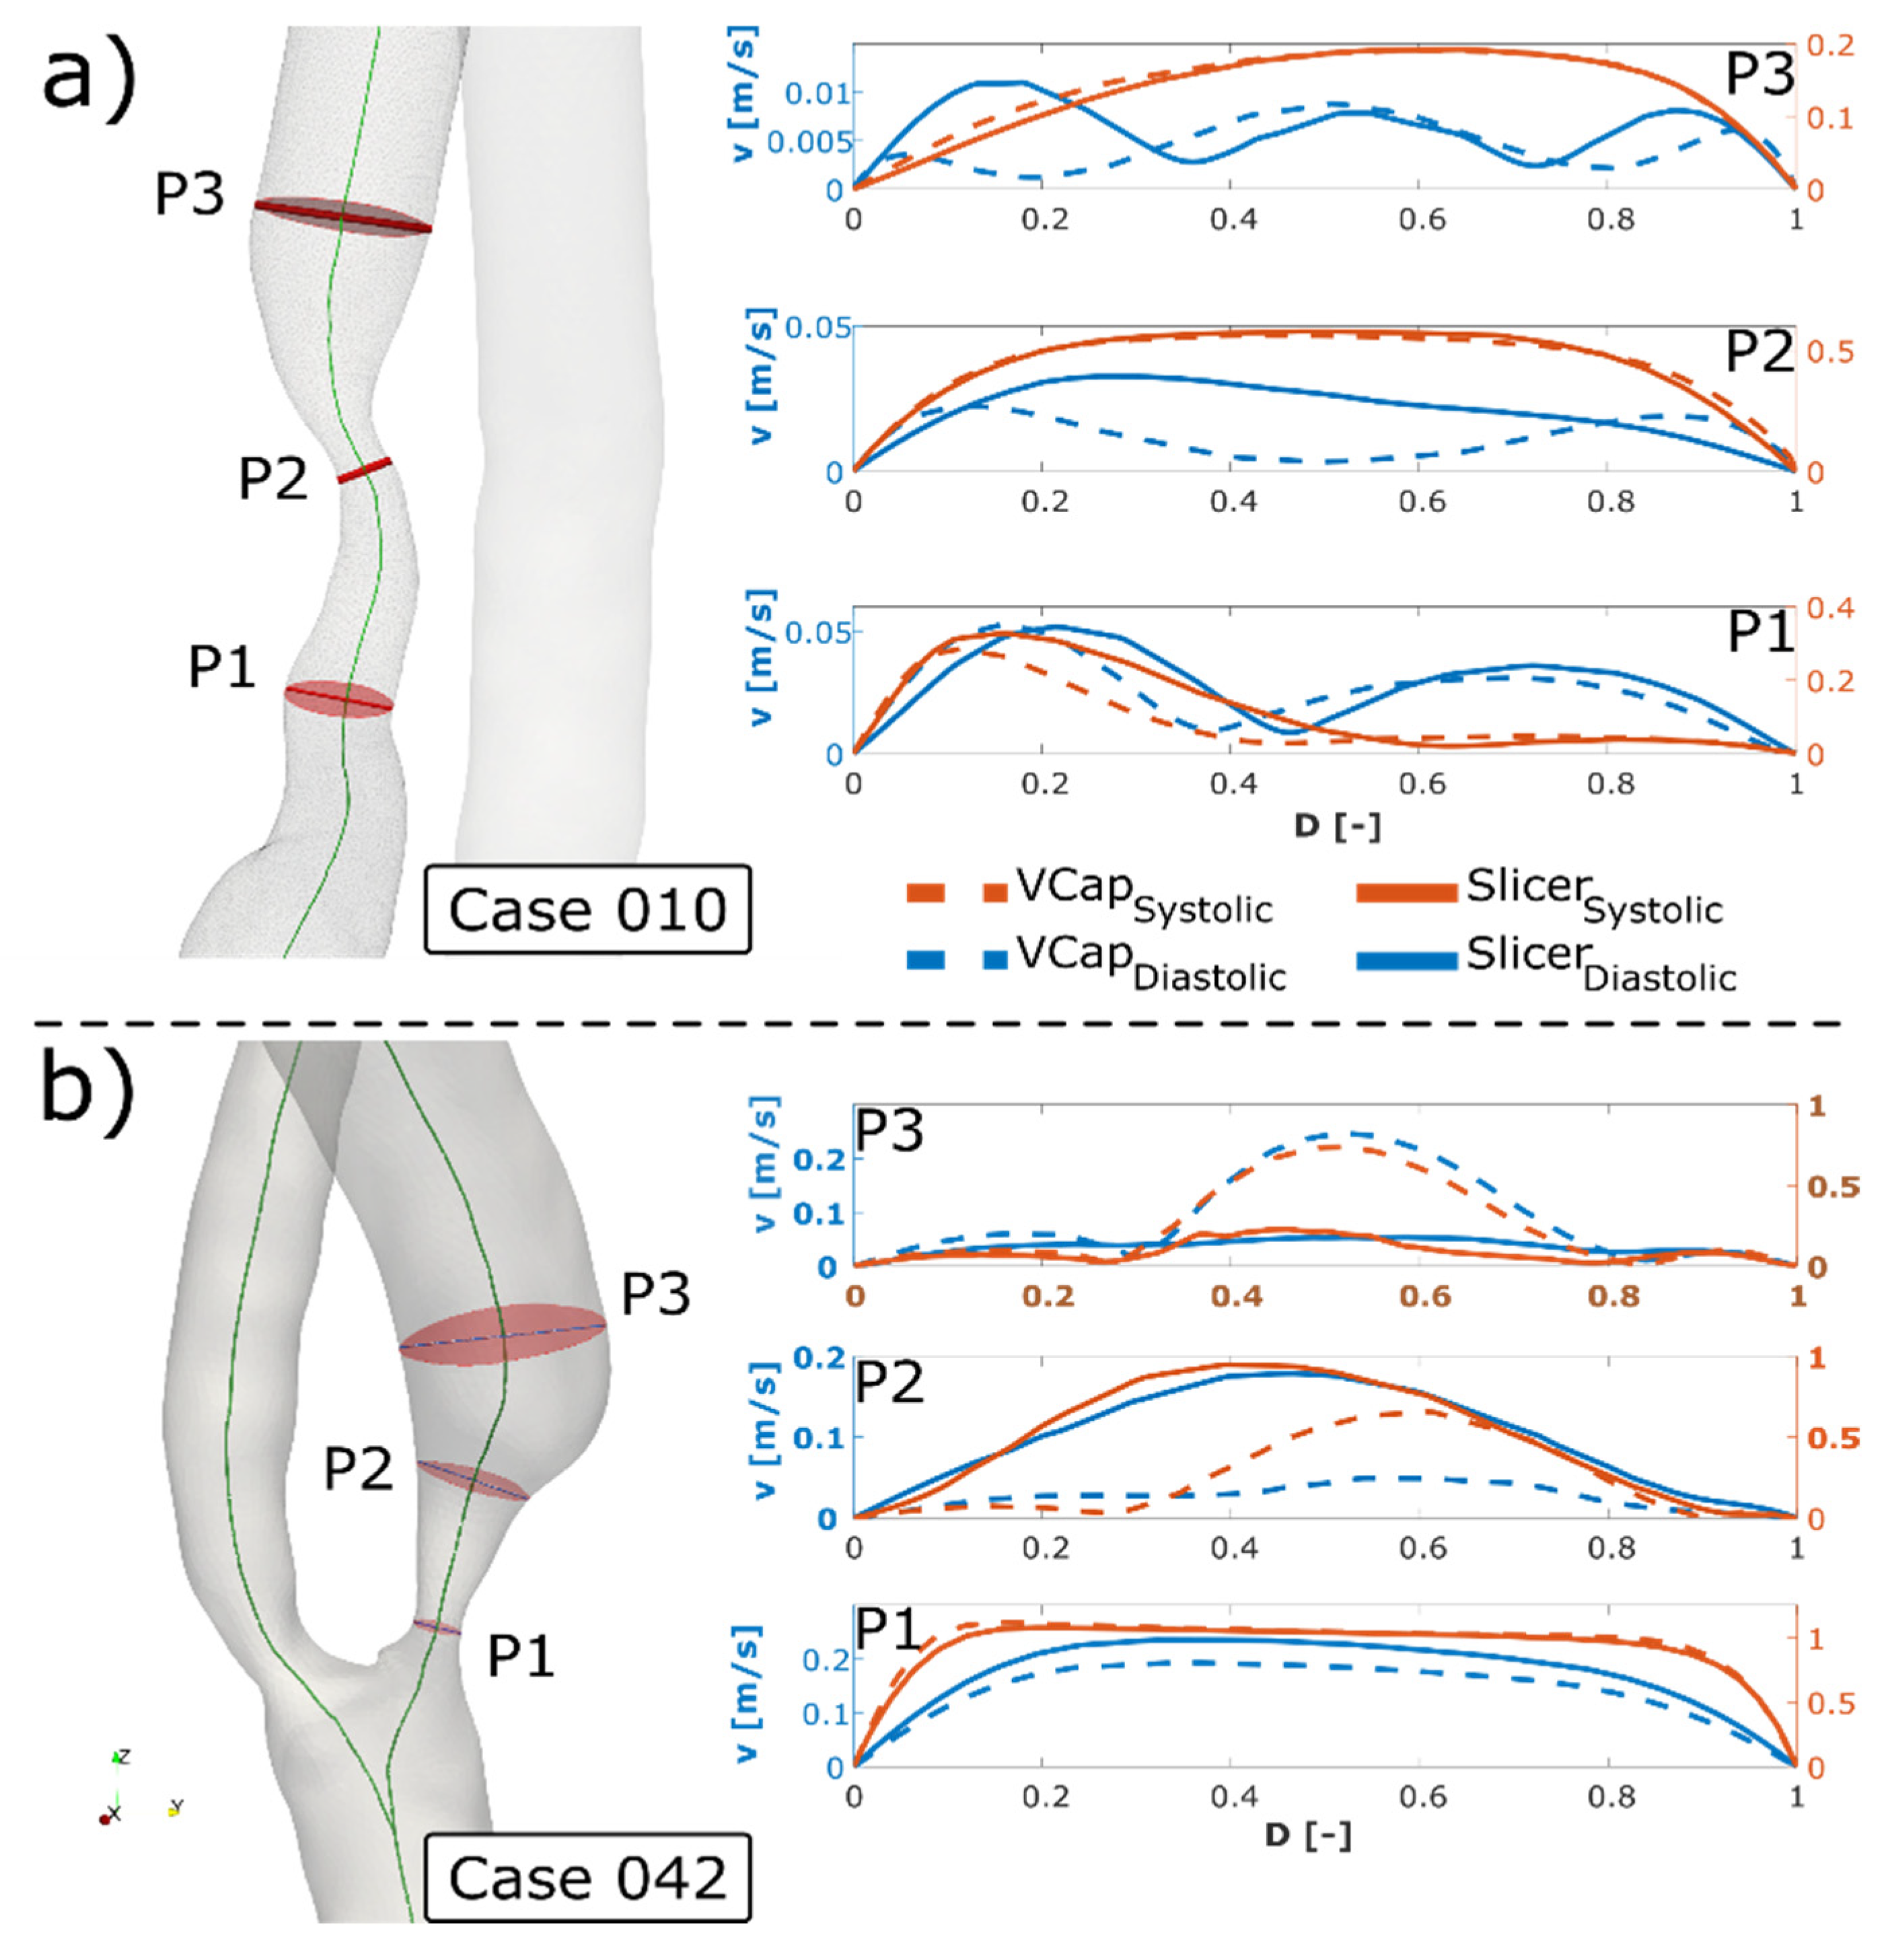
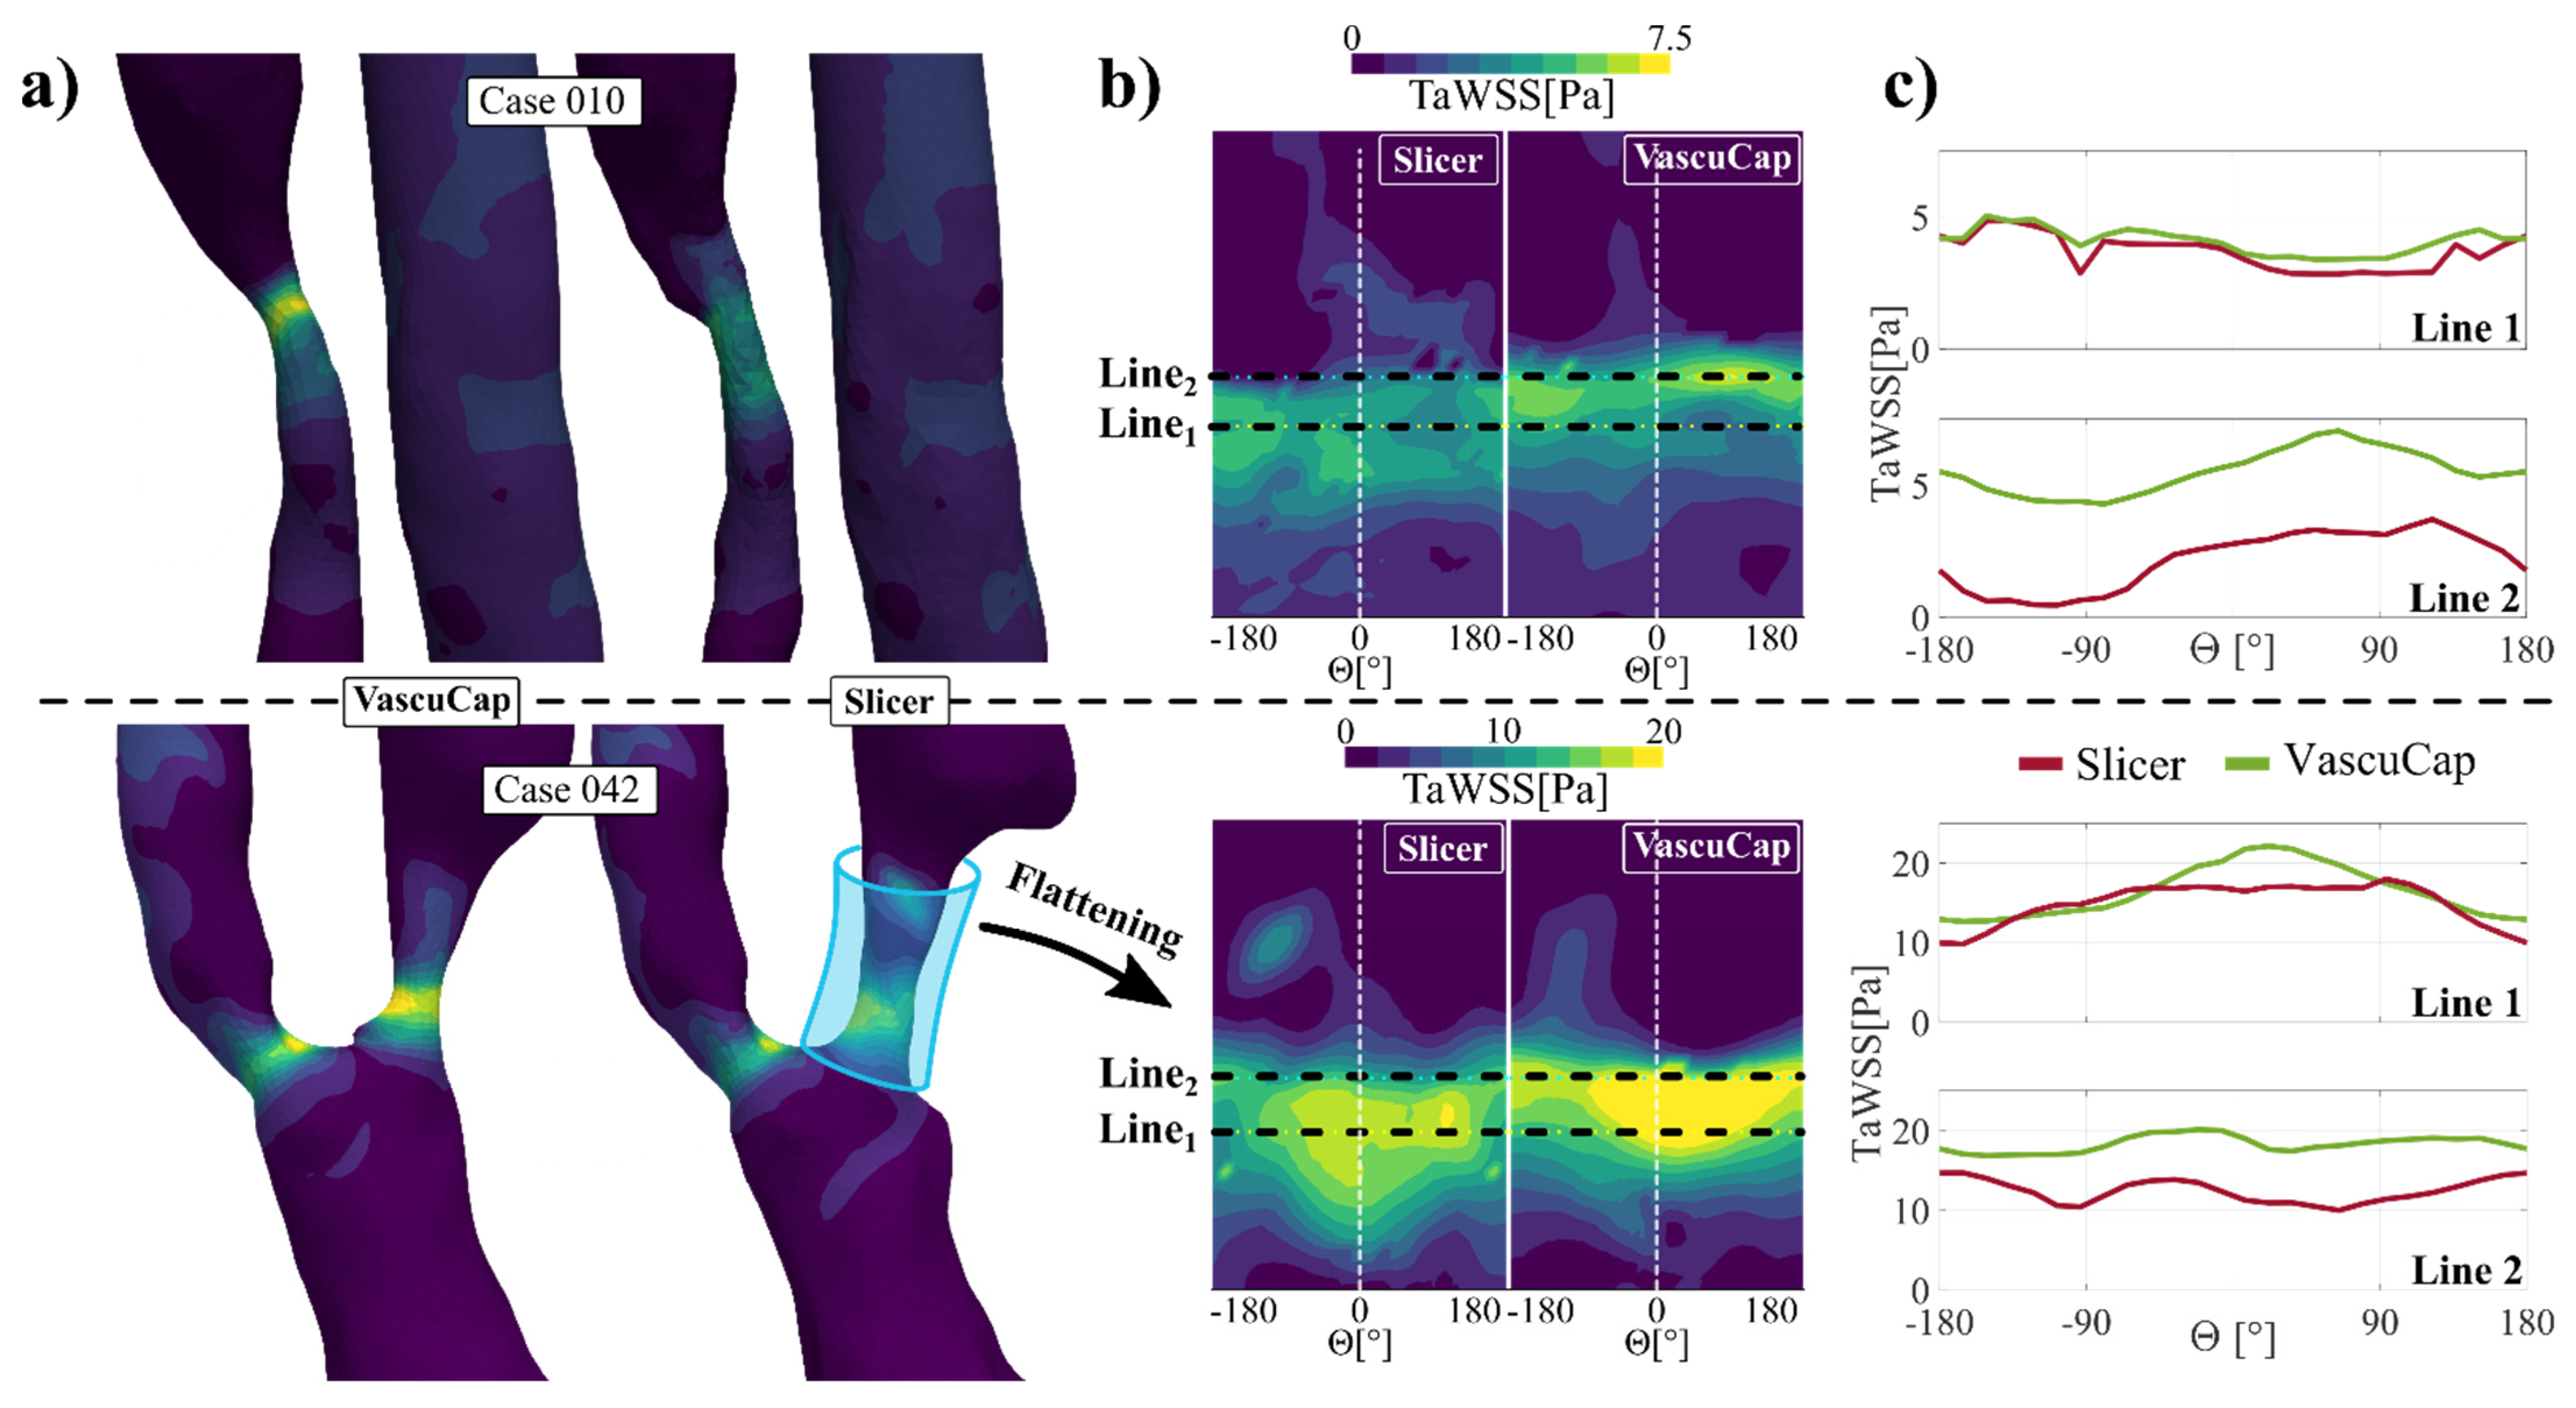
3.3. Effect of Differences of Segmentation on Flow Analysis
4. Discussion
4.1. General Discussion
4.2. Effect of Differences of Segmentation
4.3. Effect of Differences on the Flow Field
4.4. Limitations
5. Conclusions
Author Contributions
Funding
Institutional Review Board Statement
Informed Consent Statement
Conflicts of Interest
Appendix A

| Group I.—Individual | Group II.—Collective | Group II.—Separated | ||||||
|---|---|---|---|---|---|---|---|---|
| Dmin | VascuCap | Slicer | Dmin | VascuCap | Slicer | Dmin | VascuCap | Slicer |
| 005 | 1.893 | 1.946 | 003 | 1.146 | 1.384 | 002 | 1.709 | 1.199 |
| 010 | 1.189 | 2.457 | 008 | 2.268 | 3.133 | 006 | 1.814 | 1.614 |
| 013 | 2.029 | 1.660 | 030 | 1.939 | 2.516 | 027 | 2.092 | 2.040 |
| 021 | 1.592 | 2.151 | 031 | 2.045 | 1.665 | 035 | 1.628 | 1.538 |
| 045 | 2.438 | 2.670 | 034 | 1.538 | 2.363 | 036 | 2.308 | 2.477 |
| 051 | 1.577 | 3.614 | 040 | 1.289 | 0.961 | 042 | 1.336 | 2.722 |
| 052 | 2.130 | 3.668 | 041 | 1.488 | 1.943 | 049 | 2.676 | 2.349 |
| 061 | 2.137 | 2.119 | 044 | 2.559 | 2.526 | 065 | 1.502 | 2.600 |
| 066 | 2.484 | 3.229 | 046 | 1.824 | 1.755 | |||
| 067 | 2.036 | 2.846 | 047 | 1.973 | 2.763 | |||
| 048 | 1.898 | 2.952 | ||||||
References
- Czlonkowska, A.; Kl, F.; Se, K.; Rj, A.; Gw, A.; Rl, B.; Sc, F.; Jl, H.; Sc, J.; Irene, K.; et al. Faculty Opinions recommendation of Guidelines for the prevention of stroke in patients with stroke or transient ischemic attack: A guideline for healthcare professionals from the american heart association/american stroke association. Fac. Opin.-Post-Publ. Peer Rev. Biomed. Lit. 2011, 42, 2160–2236. [Google Scholar] [CrossRef]
- Naylor, A.R.; Ricco, J.B.; de Borst, G.J.; Debus, S.; Haro, J.; Halliday, A.; Hamilton, G.; Kakisis, J.; Kakkos, S.; Lepidi, S.; et al. Management of atherosclerotic carotid and vertebral artery disease: 2017 clinical practice guidelines of the European Society for Vascular Surgery (ESVS). Eur. J. Vasc. Endovasc. Surg. 2018, 55, P3–P81. [Google Scholar] [CrossRef] [PubMed] [Green Version]
- Silvennoinen, H.M.; Ikonen, S.; Soinne, L.; Railo, M.; Valanne, L.C.T. Angiographic analysis of carotid artery stenosis: Comparison of manual assessment, semiautomatic vessel analysis, and digital subtraction angiography. Am. J. Neuroradiol. 2007, 28, 97–103. [Google Scholar] [PubMed]
- Murgia, A.; Erta, M.; Suri, J.S.; Gupta, A.; Wintermark, M.; Saba, L. CT imaging features of carotid artery plaque vulnerability. Ann. Transl. Med. 2020, 19, 1261. [Google Scholar] [CrossRef]
- Chen, C.-J.; Lee, T.-.H.; Hsu, H.-.L.; Tseng, Y.-.C.; Lin, S.-.K.; Wang, L.-.J.; Wong, Y.-.C. Multi-slice CT angiography in diagnosing total versus near occlusions of the internal carotid artery: Comparison with catheter angiography. Stroke 2004, 35, 83–85. [Google Scholar] [CrossRef] [Green Version]
- Borst, J.; Marquering, H.A.; Kappelhof, M.; Zadi, T.; van Dijk, A.C.; Nederkoorn, P.J.; van den Berg, R.; van der Lugt, A.; Majoie, C.B. Diagnostic Accuracy of 4 Commercially Available Semiautomatic Packages for Carotid Artery Stenosis Measurement on CTA. Am. J. Neuroradiol. 2015, 36, 1978–1987. [Google Scholar] [CrossRef] [PubMed] [Green Version]
- Saba, L.; Saam, T.; Jäger, H.R.; Yuan, C.; Hatsukami, T.S.; Saloner, D.; Wasserman, B.A.; Bonati, L.H.; Wintermark, M. Imaging biomarkers of vulnerable carotid plaques for stroke risk prediction and their potential clinical implications. Lancet. Neurol. 2019, 18, 559–572. [Google Scholar] [CrossRef]
- Eshtehardi, P.; Brown, A.J.; Bhargava, A.; Costopoulos, C.; Hung, O.Y.; Corban, M.T.; Hosseini, H.; Gogas, B.D.; Giddens, D.P.; Samady, H. High wall shear stress and high-risk plaque: An emerging concept. Int. J. Cardiovasc. Imaging. 2017, 33, 1089–1099. [Google Scholar] [CrossRef]
- Tuenter, A.; Selwaness, M.; Lorza, A.A.; Schuurbiers, J.C.H.; Speelman, L.; Cibis, M.; van der Lugt, A.; de Bruijne, M.; van der Steen, A.F.W.; Franco, O.H.; et al. High shear stress relates to intraplaque haemorrhage in asymptomatic carotid plaques. Atherosclerosis 2016, 251, 348–354. [Google Scholar] [CrossRef] [Green Version]
- Groen, H.C.; Gijsen, F.J.; van der Lugt, A.; Ferguson, M.S.; Hatsukami, T.S.; van der Steen, A.F.; Yuan, C.; Wentzel, J.J. Plaque rupture in the carotid artery is localized at the high shear stress region: A case report. Stroke 2007, 38, 2379–2381. [Google Scholar] [CrossRef] [Green Version]
- Morbiducci, U.; Kok, A.M.; Kwak, B.R.; Stone, P.H.; Steinman, D.A.; Wentzel, J.J. Atherosclerosis at arterial bifurcations: Evidence for the role of haemodynamics and geometry. Thromb. Haemost. 2016, 115, 484–492. [Google Scholar] [CrossRef] [PubMed]
- Kurkcuoglu, A.; Aytekin, C.; Oktem, H.; Pelin, C. Morphological variation of carotid artery bifurcation level in digital angiography. Folia Morphol. (Warsz.) 2015, 74, 206–211. [Google Scholar] [CrossRef] [Green Version]
- Lee, S.W.; Antiga, L.; Spence, J.D.; Steinman, D.A. Geometry of the carotid bifurcation predicts its exposure to disturbed flow. Stroke 2008, 39, 2341–2347. [Google Scholar] [CrossRef] [Green Version]
- Bijari, P.B.; Antiga, L.; Gallo, D.; Wasserman, B.A.; Steinman, D.A. Improved prediction of disturbed flow via hemodynamically-inspired geometric variables. J. Biomech. 2012, 45, 1632–1637. [Google Scholar] [CrossRef] [PubMed] [Green Version]
- Jiang, P.; Chen, Z.; Hippe, D.S.; Watase, H.; Sun, B.; Lin, R.; Yang, Z.; Xue, Y.; Zhao, X.; Yuan, C. Association Between Carotid Bifurcation Geometry and Atherosclerotic Plaque Vulnerability: A Chinese Atherosclerosis Risk Evaluation Study. Arterioscler. Thromb. Vasc. Biol. 2020, 40, 1383–1391. [Google Scholar] [CrossRef]
- Yang, C.; Canton, G.; Yuan, C.; Ferguson, M.; Hatsukami, T.S.; Tang, D. Advanced human carotid plaque progression correlates positively with flow shear stress using follow-up scan data: An in vivo MRI multi-patient 3D FSI study. J. Biomech. 2010, 43, 2530–2538. [Google Scholar] [CrossRef] [PubMed] [Green Version]
- Gallo, D.; Bijari, P.B.; Morbiducci, U.; Qiao, Y.; Xie, Y.; Etesami, M.; Habets, D.; Lakatta, E.G.; Wasserman, B.A.; Steinman, D.A. Segment-specific associations between local haemodynamic and imaging markers of early atherosclerosis at the carotid artery: An in vivo human study. J.R. Soc. Interface 2018, 15, 20180352. [Google Scholar] [CrossRef] [Green Version]
- Gallo, D.; Steinman, D.A.; Morbiducci, U. An insight into the mechanistic role of the common carotid artery on the hemodynamics at the carotid bifurcation. Ann. Biomed. Eng. 2015, 43, 68–81. [Google Scholar] [CrossRef] [PubMed]
- Thomas, C.; Korn, A.; Ketelsen, D.; Danz, S.; Tsifikas, I.; Claussen, C.D.; Ernemann, U.; Heuschmid, M. Automatic lumen segmentation in calcified plaques: Dual-energy CT versus standard reconstructions in comparison with digital subtraction angiography. Am. J. Roentgenol. 2010, 194, 1590–1595. [Google Scholar] [CrossRef]
- Babiarz, L.S.; Yousem, D.M.; Wasserman, B.A.; Wu, C.; Bilker, W.; Beauchamp, N.J., Jr. Cavernous carotid artery calcification and white matter ischemia. Am. J. Neuroradiol. 2003, 24, 872–877. [Google Scholar]
- Yoshida, K.; Fukumitsu, R.; Kurosaki, Y.; Funaki, T.; Kikuchi, T.; Takahashi, J.C.; Takagi, Y.; Yamagata, S.; Miyamoto, S. The association between expansive arterial remodeling detected by high-resolution MRI in carotid artery stenosis and clinical presentation. J. Neurosurg 2015, 123, 434–440. [Google Scholar] [CrossRef]
- Sheahan, M.; Ma, X.; Paik, D.; Obuchowski, N.A.; St. Pierre, S.; Newman, W.P., III; Rae, G.; Perlman, E.S.; James, M.R.; Keith, C., Jr.; et al. Atherosclerotic plaque tissue: Noninvasive quantitative assessment of characteristics with software-aided measurements from conventional CT angiography. Radiology 2018, 286, 622–631. [Google Scholar] [CrossRef] [PubMed]
- Antiga, L.; Piccinelli, M.; Botti, L.; Ene-Iordache, B.; Remuzzi, A.; Steinman, D.A. An image-based modeling framework for patient-specific computational hemodynamics. Med. Biol. Eng. Comput. 2008, 46, 1097–1112. [Google Scholar] [CrossRef] [Green Version]
- Berg, P.; Voß, S.; Saalfeld, S.; Janiga, G.; Bergersen, A.W.; Valen-Sendstad, K.; Bruening, J.; Goubergrits, L.; Spuler, A.; Cancelliere, N.M.; et al. Multiple aneurysms anatomy challenge 2018 (MATCH): Phase I: Segmentation. CVET 2018, 9, 565–581. [Google Scholar] [CrossRef] [PubMed]
- Morbiducci, U.; Gallo, D.; Massai, D.; Ponzini, R.; Deriu, M.A.; Antiga, L.; Redaelli, A.; Montevecchi, F.M. On the importance of blood rheology for bulk flow in hemodynamic models of the carotid bifurcation. J. Biomech. 2011, 44, 2427–2438. [Google Scholar] [CrossRef]
- Khan, M.O.; Valen-Sendstad, K.; Steinman, D.A. Narrowing the expertise gap for predicting intracranial aneurysm hemodynamics: Impact of solver numerics versus mesh and time-step resolution. Am. J. Neuroradiol. 2015, 36, 1310–1316. [Google Scholar] [CrossRef] [Green Version]
- Antiga, L.; Steinman, D.A. Robust and objective decomposition and mapping of bifurcating vessels. IEEE Trans. Med. Imaging. 2004, 23, 704–13. [Google Scholar] [CrossRef]
- Hillman, B.J. ACRIN—Lessons learned in conducting multi-center trials of imaging and cancer. Cancer. Imaging. 2005, 5, S97–S101. [Google Scholar] [CrossRef]
- Bankier, A.A.; Levine, D.; Halpern, E.F.; Kressel, H.Y. Consensus interpretation in imaging research: Is there a better way? Radiology. 2010, 257, 14–17. [Google Scholar] [CrossRef]
- Chrencik, M.T.; Khan, A.A.; Luther, L.; Anthony, L.; Yokemick, J.; Patel, J.; Sorkin, J.D.; Sikdar, S.; Lal, B.K. Quantitative assessment of carotid plaque morphology (geometry and tissue composition) using computed tomography angiography. J. Vasc. Surg. 2019, 70, 858–868. [Google Scholar] [CrossRef]
- Vukadinovic, D.; Rozie, S.; van Gils, M.; van Walsum, T.; Manniesing, R.; van der Lugt, A.; Niessen, W.J. Automated versus manual segmentation of atherosclerotic carotid plaque volume and components in CTA: Associations with cardiovascular risk factors. Int J. Cardiovasc. Imaging. 2012, 28, 877–887. [Google Scholar] [CrossRef]
- Diab, H.M.H.; Rasmussen, L.M.; Duvnjak, S.; Diederichsen, A.; Jensen, P.S.; Lindholt, J.S. Computed tomography scan based prediction of the vulnerable carotid plaque. BMC Med. Imaging. 2017, 17, 61. [Google Scholar] [CrossRef] [Green Version]
- Serfaty, J.M.; Nonent, M.; Nighoghossian, N.; Rouhart, F.; Derex, L.; Rotaru, C.; Chirossel, P.; Thabut, G.; Guias, B.; Heautot, J.F.; et al. Plaque density on CT, a potential marker of ischemic stroke. Neurology 2006, 66, 118–120. [Google Scholar] [CrossRef]
- Wintermark, M.; Jawadi, S.S.; Rapp, J.H.; Tihan, T.; Tong, E.; Glidden, D.V.; Abedin, S.; Schaeffer, S.; Acevedo-Bolton, G.; Boudignon, B.; et al. High-resolution CT imaging of carotid artery atherosclerotic plaques. Am. J. Neuroradiol. 2008, 29, 875–882. [Google Scholar] [CrossRef] [Green Version]
- de Weert, T.T.; Ouhlous, M.; Meijering, E.; Zondervan, P.E.; Hendriks, J.M.; van Sambeek, M.R.; Dippel, D.W.; van der Lugt, A. In vivo characterization and quantification of atherosclerotic carotid plaque components with multidetector computed tomography and histopathological correlation. Arter. Thromb. Vasc. Biol. 2006, 26, 2366–2372. [Google Scholar] [CrossRef]
- Berg, P.; Voß, S.; Janiga, G.; Saalfeld, S.; Bergersen, A.W.; Valen-Sendstad, K.; Bruening, J.; Goubergrits, L.; Spuler, A.; Chiu, T.L. Multiple Aneurysms AnaTomy CHallenge 2018 (MATCH)—phase II: Rupture risk assessment. Int. J. Comput Assist. Radiol Surg. 2019, 14, 1795–1804. [Google Scholar] [CrossRef] [PubMed]
- Voß, S.; Beuing, O.; Janiga, G.; Berg, P. Multiple aneurysms anatomy challenge 2018 (MATCH)—Phase Ib: Effect of morphology on hemodynamics. PLoS ONE 2019, 14, e0216813. [Google Scholar] [CrossRef] [PubMed] [Green Version]
- Lopes, D.; Puga, H.; Teixeira, J.; Lima, R. Blood flow simulations in patient-specific geometries of the carotid artery: A systematic review. J. Biomech. 2020. [Google Scholar] [CrossRef] [PubMed]


| Group I.—Individual | Group II.—Collective | Group III.—Separated | |||||||||||||||
|---|---|---|---|---|---|---|---|---|---|---|---|---|---|---|---|---|---|
| ID | Plaque loc. | Calc. Extent | Calc. Thickness | Calc. Score | Pos. Rem. | ID | Plaque Loc. | Calc. Extent | Calc. Thickness | Calc. Score | Pos. Rem. | ID | Plaque Loc. | Calc. Extent | Calc. Thickness | Calc. Score | Pos. Rem. |
| 005 | 1 | 2 | 2 | 4 | 1 | 003 | 2 | 2 | 2 | 4 | 0 | 002 | 2 | 2 | 2 | 4 | 1 |
| 010 | 2 | 0 | 0 | 0 | 1 | 004 | 1 | 1 | 1 | 2 | 1 | 006 | 1 | 1 | 1 | 2 | 0 |
| 013 | 1 | 1 | 1 | 2 | 1 | 008 | 1 | 1 | 1 | 2 | 0 | 025 | 1 | 1 | 2 | 3 | 1 |
| 021 | 1 | 1 | 1 | 2 | 0 | 030 | 2 | 1 | 2 | 3 | 1 | 027 | 1 | 2 | 2 | 4 | 0 |
| 045 | 2 | 1 | 1 | 2 | 0 | 031 | 2 | 0 | 0 | 0 | 0 | 029 | 1 | 4 | 4 | 8 | 1 |
| 050 | 1 | 0 | 1 | 1 | 0 | 034 | 1 | 2 | 4 | 6 | 0 | 035 | 1 | 1 | 1 | 2 | 1 |
| 051 | 1 | 4 | 3 | 7 | 1 | 040 | 1 | 3 | 2 | 5 | 1 | 036 | 1 | 0 | 0 | 0 | 1 |
| 052 | 1 | 4 | 4 | 8 | 1 | 041 | 1 | 4 | 4 | 8 | 1 | 042 | 1 | 3 | 3 | 6 | 1 |
| 061 | 1 | 3 | 3 | 6 | 0 | 044 | 1 | 3 | 1 | 4 | 1 | 049 | 2 | 0 | 1 | 1 | 0 |
| 066 | 1 | 2 | 2 | 4 | 0 | 046 | 1 | 3 | 3 | 6 | 0 | 065 | 1 | 2 | 1 | 3 | 0 |
| 067 | 1 | 3 | 3 | 6 | 1 | 047 | 1 | 3 | 2 | 5 | 0 | ||||||
| 048 | 1 | 3 | 3 | 6 | 1 | ||||||||||||
| Group I.—Individual | Group II.—Collective | Group III.—Separated | |||
|---|---|---|---|---|---|
| ID | ADDV [–] | ID | ADDV [–] | ID | ADDV [–] |
| 005 | 0.19 | 003 | 0.11 | 002 | 0.26 |
| 010 | 1.73 | 004 | 0.79 | 006 | 0.12 |
| 013 | 0.37 | 008 | 0.06 | 025 | 0.82 |
| 021 | 0.88 | 030 | 1.31 | 027 | 0.42 |
| 045 | 0.95 | 031 | 1.36 | 029 | 1.77 |
| 050 | 1.35 | 034 | 1.33 | 035 | 0.29 |
| 051 | 2.73 | 040 | 0.32 | 036 | 1.99 |
| 052 | 2.14 | 041 | 0.59 | 042 | 0.64 |
| 061 | 0.30 | 044 | 0.54 | 049 | 0.65 |
| 066 | 1.01 | 046 | 0.77 | 065 | 0.20 |
| 067 | 2.11 | 047 | 0.35 | ||
| 048 | 0.92 | ||||
| Mean | Std. | Mean | Std. | Mean | Std. |
| 1.16 | 1.33 | 0.65 | 1.09 | 0.75 | 0.91 |
| Dmin AVG VascuCap | Dmin AVG Slicer | Relative Difference | Relative Std | Correlation | p | |
|---|---|---|---|---|---|---|
| [mm] | [mm] | [%] | [%] | [–] | [–] | |
| Group I. | 1.950 | 2.636 | 35.16 | ∓38.75 | 0.138 | <0.01 |
| Group II. | 1.815 | 2.178 | 19.99 | ∓27.92 | 0.680 | <0.05 |
| Group III. | 1.883 | 2.067 | 9.80 | ∓36.47 | 0.084 | <0.25 |
| ADDV vs. | Group I. Individual | Group II. Collective | Group III. Separate | |
|---|---|---|---|---|
| Calcification Score | Corr. Coefficient | 0.59 | 0.19 | 0.71 |
| p | <0.001 | <0.0001 | <0.001 | |
| Calcification Extent | Corr. Coefficient | 0.44 | −0.20 | 0.57 |
| p | <0.05 | <0.001 | <0.01 | |
| Calcification Thickness | Corr. Coefficient | 0.61 | 0.46 | 0.82 |
| p | <0.01 | <0.001 | <0.001 |
Publisher’s Note: MDPI stays neutral with regard to jurisdictional claims in published maps and institutional affiliations. |
© 2021 by the authors. Licensee MDPI, Basel, Switzerland. This article is an open access article distributed under the terms and conditions of the Creative Commons Attribution (CC BY) license (https://creativecommons.org/licenses/by/4.0/).
Share and Cite
Csippa, B.; Mihály, Z.; Czinege, Z.; Németh, M.B.; Halász, G.; Paál, G.; Sótonyi, P., Jr. Comparison of Manual versus Semi-Automatic Segmentations of the Stenotic Carotid Artery Bifurcation. Appl. Sci. 2021, 11, 8192. https://doi.org/10.3390/app11178192
Csippa B, Mihály Z, Czinege Z, Németh MB, Halász G, Paál G, Sótonyi P Jr. Comparison of Manual versus Semi-Automatic Segmentations of the Stenotic Carotid Artery Bifurcation. Applied Sciences. 2021; 11(17):8192. https://doi.org/10.3390/app11178192
Chicago/Turabian StyleCsippa, Benjamin, Zsuzsanna Mihály, Zsófia Czinege, Márton Bence Németh, Gábor Halász, György Paál, and Péter Sótonyi, Jr. 2021. "Comparison of Manual versus Semi-Automatic Segmentations of the Stenotic Carotid Artery Bifurcation" Applied Sciences 11, no. 17: 8192. https://doi.org/10.3390/app11178192
APA StyleCsippa, B., Mihály, Z., Czinege, Z., Németh, M. B., Halász, G., Paál, G., & Sótonyi, P., Jr. (2021). Comparison of Manual versus Semi-Automatic Segmentations of the Stenotic Carotid Artery Bifurcation. Applied Sciences, 11(17), 8192. https://doi.org/10.3390/app11178192