1. Introduction
Hepatitis B virus (HBV) is a global public health problem. It infects hepatocytes, the main cells found in the liver, and can lead to chronic liver disease, cirrhosis, and liver cancer. As of 2015, over 250 million people worldwide are chronically infected with HBV, with the majority of these cases in Asia, Sub-Saharan Africa, parts of the Arabian Peninsula, the South Pacific, tropical South America, and arctic North America, with Asia unique in the degree of hepatitis burden. In areas where HBV is highly endemic, the infection is spread primarily neonatally from infected mothers to their children, with as many as 90% of infants exposed to the virus developing chronic infections. Young children also remain susceptible to chronic infection, while fewer than 5% of exposed adults, who are otherwise healthy, will go on to develop chronic disease. Besides vertical transmission, HBV may be contracted through any blood-borne exposure, including sexual contact, needle sharing, or blood transfusion [
1,
2]. Although the global burden of viral hepatitis is in decline—in large part due to a nearly 100% effective vaccine, near universal screening of blood products, and more effective treatments—the vaccine is still not implemented widely enough, and a significant number of cases persist even in developed countries [
3]. Treatment for chronic HBV can reduce the risk of developing cirrhosis and liver cancer, but generally does not result in a cure and often must be taken lifelong once initiated [
2].
Despite these recent clinical advances and the disease’s global significance, its pathogenesis remains poorly understood. A widely accepted hypothesis suggests that HBV is not directly cytopathic; rather, liver inflammation and subsequent complications caused by HBV are generated by immune attack on infected cells [
4,
5,
6]. Considerable evidence supports this hypothesis [
4,
5,
7,
8], However, the extent and nature of the virus’s cytopathicity remain unresolved [
9]. In particular, very little is known about how viral infection affects proliferation. In the experimental literature, the effect of HBV infection on hepatocyte proliferation is controversial, with conflicting data showing both induction and inhibition of proliferation [
10]. In addition, infection has been correlated with both pro- and anti-apoptotic effects on hepatocytes [
11]. HBV X protein has severely impaired liver regeneration in some mouse models [
11,
12,
13], but had little effect in others [
14]. It is possible that natural variation in the HBV virus itself may explain these conflicting results [
10]. Here, we study the dynamical implications of the proliferation of infected hepatocytes.
Mathematical models have been applied to a wide variety of viral illnesses, and HBV is no exception, with scores of modeling works published in recent years (see, e.g., recent reviews by Goyal et al. [
15] and Ciupe [
16]). Previous models have mainly, though not exclusively, focused on chronic infections and were originally adapted from HIV models, including at least three state variables: healthy hepatocytes,
x, infected hepatocytes,
y, and free virions,
v. The basic virus infection model (BVIM), presented by Nowak et al. [
17,
18], assumes that healthy hepatocytes are produced by some constant influx term,
, healthy hepatocytes die at per-capita rate
d, infected hepatocytes die at per-capita rate
a, and infection occurs according to
mass action kinetics, with coefficient
. Infectious virions are produced by infected hepatocytes at rate
and die at rate
, giving the model:
In this model, the immune response to infection is represented by an elevated death rate in infected hepatocytes,
, and by the destruction of free virions at rate
. Such simple linear dynamics are clearly inappropriate for modeling the adaptive immune system’s response to acute infection, but may be a reasonable first approximation in the case of established, chronic infection. Extensions and variations of the BVIM model have been introduced to study the rich dynamics of HIV infection and treatment [
19,
20]. This basic framework has been extended and modified to study different aspects of HBV infection. Multiple works have modeled the immune response in at least some detail [
16,
21,
22,
23,
24] and considered the interplay between the immune response and imposed treatments [
25,
26]. Drug treatment, with or without the immune response, can also be incorporated into this basic framework—e.g., [
27,
28,
29]. Some drugs interfere with virion production, which can be simply modeled as a decreased virion production rate when treatment is on, while others decrease the magnitude of the infection term [
28].
While different biological behaviors can be added in different ways, special care to the basic model construction and its implicit assumptions is warranted. Restricting our attention to chronic infection and ignoring any adaptive or evolving immune response, the BVIM still makes at least three basic assumptions incompatible with biology that have major effects on the model dynamics:
Infection is a mass action process;
Healthy hepatocytes are produced by a constant influx;
Infected hepatocytes do not reproduce.
As shown by Gourley et al. [
30], the assumption of mass action kinetics for infection yields a basic reproductive number that is dependent on the homeostatic liver size,
, and thus results in the biologically implausible prediction that an individual’s susceptibility to infection depends on liver mass. Replacing the mass action term with a standard incidence term, as in [
30,
31], eliminates this dependence. The standard incidence term in generic viral infection models also received theoretical treatment in [
32,
33]. Furthermore, the concept of mass action kinetics is borrowed from chemical kinetics, where reaction rates increase in proportion to the concentration of all involved reactants [
34]. As a solid organ with a highly stereotyped cellular architecture, the actual density of hepatocytes is not expected to vary appreciably between individuals or disease states, further arguing against the mass action formulation and for a standard incidence (or other) term better suited to the physical system.
The injured liver is clearly not replenished by a constant influx of cells. Rather, liver regeneration is driven by widespread hepatocyte proliferation in a process that is modeled very well, at least heuristically, by logistic growth (see Eikenberry et al. [
35] for a detailed justification of the logistic growth term). As shown in [
35,
36], replacing the constant influx of healthy hepatocytes with logistic growth that depends on the total liver mass (both healthy and infected hepatocytes) greatly affects the model dynamics.
The analysis of Hews et al. [
36] also derived two new indices, the cellular vitality index,
, and the liver failure index,
, that, in addition to the well-known basic reproductive number,
, partition the parameter space into distinct dynamical regions. This model admits three potential steady states, corresponding to complete obliteration of the liver (
), chronic liver infection (
), and absence of disease (
;
). Interestingly, there exists a region of the parameter space where all of the states are unstable. In this region, hepatocyte populations (both healthy and infected) and viral loads exhibit sustained oscillation. Furthermore, for each of these three steady states, there exist parameter regimes in which the steady state is asymptotically stable. Ciupe et al. [
22,
37] also considered logistic growth for hepatocytes in the more complex setting of acute infection, and logistic growth has been considered in other works as well [
38,
39]; however, the precise dynamical effect of this term in these models is unclear.
While the effects of modifying the first two assumptions to more biologically realistic alternatives have been thoroughly studied [
30,
31,
35,
36], here we make a special study of the dynamic implications of relaxing the assumption that infected hepatocytes do not reproduce. It must be noted that many HBV infection models also remove this assumption [
16,
38,
39,
40,
41,
42,
43], with Dahari et al. [
38], for example, suggesting that differing proliferation dynamics among healthy and infected hepatocytes could help explain varying patterns of viral load decays observed after treatment initiation, while Reluga et al. [
39] applied a similar model to chronic hepatitis C viral dynamics. Goyal et al. [
42] suggested that infected hepatocytes proliferating to produce uninfected daughter cells may be an important dynamic in preventing acute HBV infection, which directly affects up to 99% of hepatocytes, from progressing to the chronic state. Ciupe and colleagues [
22,
44] also considered the possibility that infected cells may recover from infection via a noncytolytic mechanism and thereafter become refractory to further infection (essentially a within-host “susceptible–infected–recovered” framework), with logistic growth dynamics for all hepatocyte classes, but mass action infection dynamics. Indeed, mass action infection kinetics remain common across those HBV models that do employ logistic growth (although, see, e.g., [
26] for an exception), and the precise dynamical implications of logistic growth in both infected and uninfected hepatocytes are rarely studied. Furthermore, given the lack of consensus on the infection’s effect on proliferation, as a first approximation, we assumed that infected hepatocytes proliferate no faster than healthy hepatocytes.
We rigorously explored how adding proliferation in infected hepatocytes, in addition to logistic growth in general and the standard incidence term for viral infection, affects the dynamics of basic chronic HBV models. The analysis of these models is not intended to provide evidence as to whether infected hepatocytes proliferate or not, but does yield a testable biological hypothesis: healthy hepatocytes are present in chronic HBV infection if and only if the proliferation of infected hepatocytes is severely impaired. The following section justifies this hypothesis.
2. Model Development and Dynamics
We assumed that infected hepatocytes proliferate at a rate less than or equal to the rate of proliferation of healthy hepatocytes. As many other chronic HBV models, we omitted a complex immune response. Therefore, our model has a population of healthy hepatocytes,
, a population of infected hepatocytes,
, and a population of free virions,
,
A logistic growth term is also used for the proliferation of healthy and infected hepatocytes with r and as the maximum proliferation rates and K as the carrying capacity. The infection rate is ; the death rate of infected hepatocytes is a; the number of free virions produced per infected hepatocyte is ; the death rate of virions is .
The basic reproduction number,
, is the same as with all previous models that assume a standard incidence term for infection,
The cellular vitality index,
, first introduced in Hews et al. [
36], incorporates the rates of healthy hepatocyte proliferation, infected hepatocyte proliferation, and infected hepatocyte lifespan, and it roughly represents the capacity of the healthy liver to regenerate. For the model (
4)–(6),
For clarification, has the standard definition, which is the expected number of secondary infections per primary infection in a completely susceptible population. On the other hand, is the point when , the chronic infection state with a nonzero healthy hepatocyte population, ceases to exist given that . Since depends on the proliferation and death rates of hepatocytes and relates to the possible collapse of the system (to the extinction equilibrium), can be thought of as representing the capacity of the healthy liver to regenerate. From this, it can be seen that increasing either the proliferation or lifespan of infected hepatocytes impairs the ability of the infected liver to regenerate, while greater proliferation in healthy hepatocytes is beneficial.
In the following subsections, we present two different proliferation scenarios that differ in the maximum proliferation rate of infected hepatocytes. In the first of these, we assumed that infected hepatocytes proliferate at the same rate as healthy hepatocytes. In the second, we assumed that hepatocytes proliferate at a non-negligible rate that is nevertheless lower than that of healthy hepatocytes. We assumed nonnegative initial conditions for both models. One can use the methods of Hews et al. [
36] to show rigorously that solutions in both models remain bounded and nonnegative.
2.1. Infected Hepatocytes Proliferating at the Same Rate
We assumed that healthy and infected hepatocytes proliferate at the same rate and therefore set
and arrive at the first model:
As mentioned above, the basic reproduction number is:
and the cellular vitality index is:
If
, there are three steady states of (
7)–(9):
If
, there are infinitely many positive steady states. Hence, in the following, we assumed that
. Let
,
, and
be the liver failure, disease-free, and infected states, respectively. The liver failure state exists since,
Notice that the infected state
does not allow a population of healthy hepatocytes. Therefore, chronic infection in this model is always characterized by complete infection of the liver. It should be pointed out that models using a mass action term instead of the standard incidence for infection do admit chronic infections that maintain a healthy cell population, but we rejected these models for reasons already specified [
30].
Notice that only exists in the positive cone and is therefore biologically relevant only when . At , the total number of hepatocytes is ; therefore, increasing proliferation (r) or decreasing mortality (a) rates increases equilibrium liver mass (assumed to be proportional to the number of hepatocytes). If the proliferation rate is greater than the death rate of infected hepatocytes then whether the infection becomes chronic depends on the reproduction rate. If , the liver is free of infection, and if , the liver becomes completely infected and the hepatocyte population is reduced compared to the healthy liver.
Proposition 1. Given the system (7)–(9), if , then exists and the following results hold. a. If , then is locally asymptotically stable and is a saddle point;
b. If , then is unstable and is locally asymptotically stable.
The proofs are omitted as they involve straightforward linearization techniques. Since
always exists when
and is a saddle when
, global stability for
cannot be determined.
Figure 1 shows a bifurcation diagram of
a with
. Healthy hepatocytes and infected hepatocytes are plotted separately so it is clear that the number of infected hepatocytes and virions is an increasing function of
a.
If , then the only steady states are and . As with traditional viral infection models, is globally stable when .
Theorem 2. If and , is globally stable.
Proof. Let
be a solution of:
Let
be a solution of:
is the only steady state of (
12) and (13) and is locally asymptotically stable when
and
. Since (
12) and (13) is a cooperative system, and therefore monotone, all solutions of (
12) and (13) will approach
.
Let
,
; then by the comparison theorem,
for
. Therefore,
Therefore, by the squeeze theorem,
□
Since and are the only two steady states, there can neither be a chronic stable state nor sustained oscillations.
Biologically, as long as hepatocytes proliferate faster than the infected hepatocytes die, the liver will survive. Since the number of infected hepatocytes at is , the greater the hepatocyte proliferation rate and the smaller the death rate of infected hepatocytes, the greater the equilibrium number of hepatocytes in the liver. This result is intuitively clear.
According to Proposition 1(b), this model presents the following biological hypothesis: if healthy and infected hepatocytes proliferate at the same rate, then there will not be a significant population of healthy cells in the liver during chronic infection. Furthermore, patients would be unlikely to experience oscillations in viral load and liver mass, dynamics that are present in models without infected hepatocyte proliferation.
2.2. Infected Hepatocytes Proliferating at a Different Rate
Since the data are inconclusive as to the proliferation rate of infected hepatocytes, we next explored the dynamical implication of infected hepatocytes proliferating at a smaller rate than healthy hepatocytes. The only change made to (
7)–(9) is that the maximum proliferation rate for the infected hepatocytes is changed from
r to
,
where
. The basic reproduction number,
, is again,
The cellular vitality index,
, is slightly modified to account for the proliferation of infected hepatocytes. In particular,
In addition to the three equilibria admitted by the model (
7)–(9), the system (
14)–(16) allows an additional steady state representing chronic infection, seen in Hews et al. [
36]. The entire set of equilibria therefore can include the following:
,
,
, and
, where:
Notice that
only exists if
and
only exists if
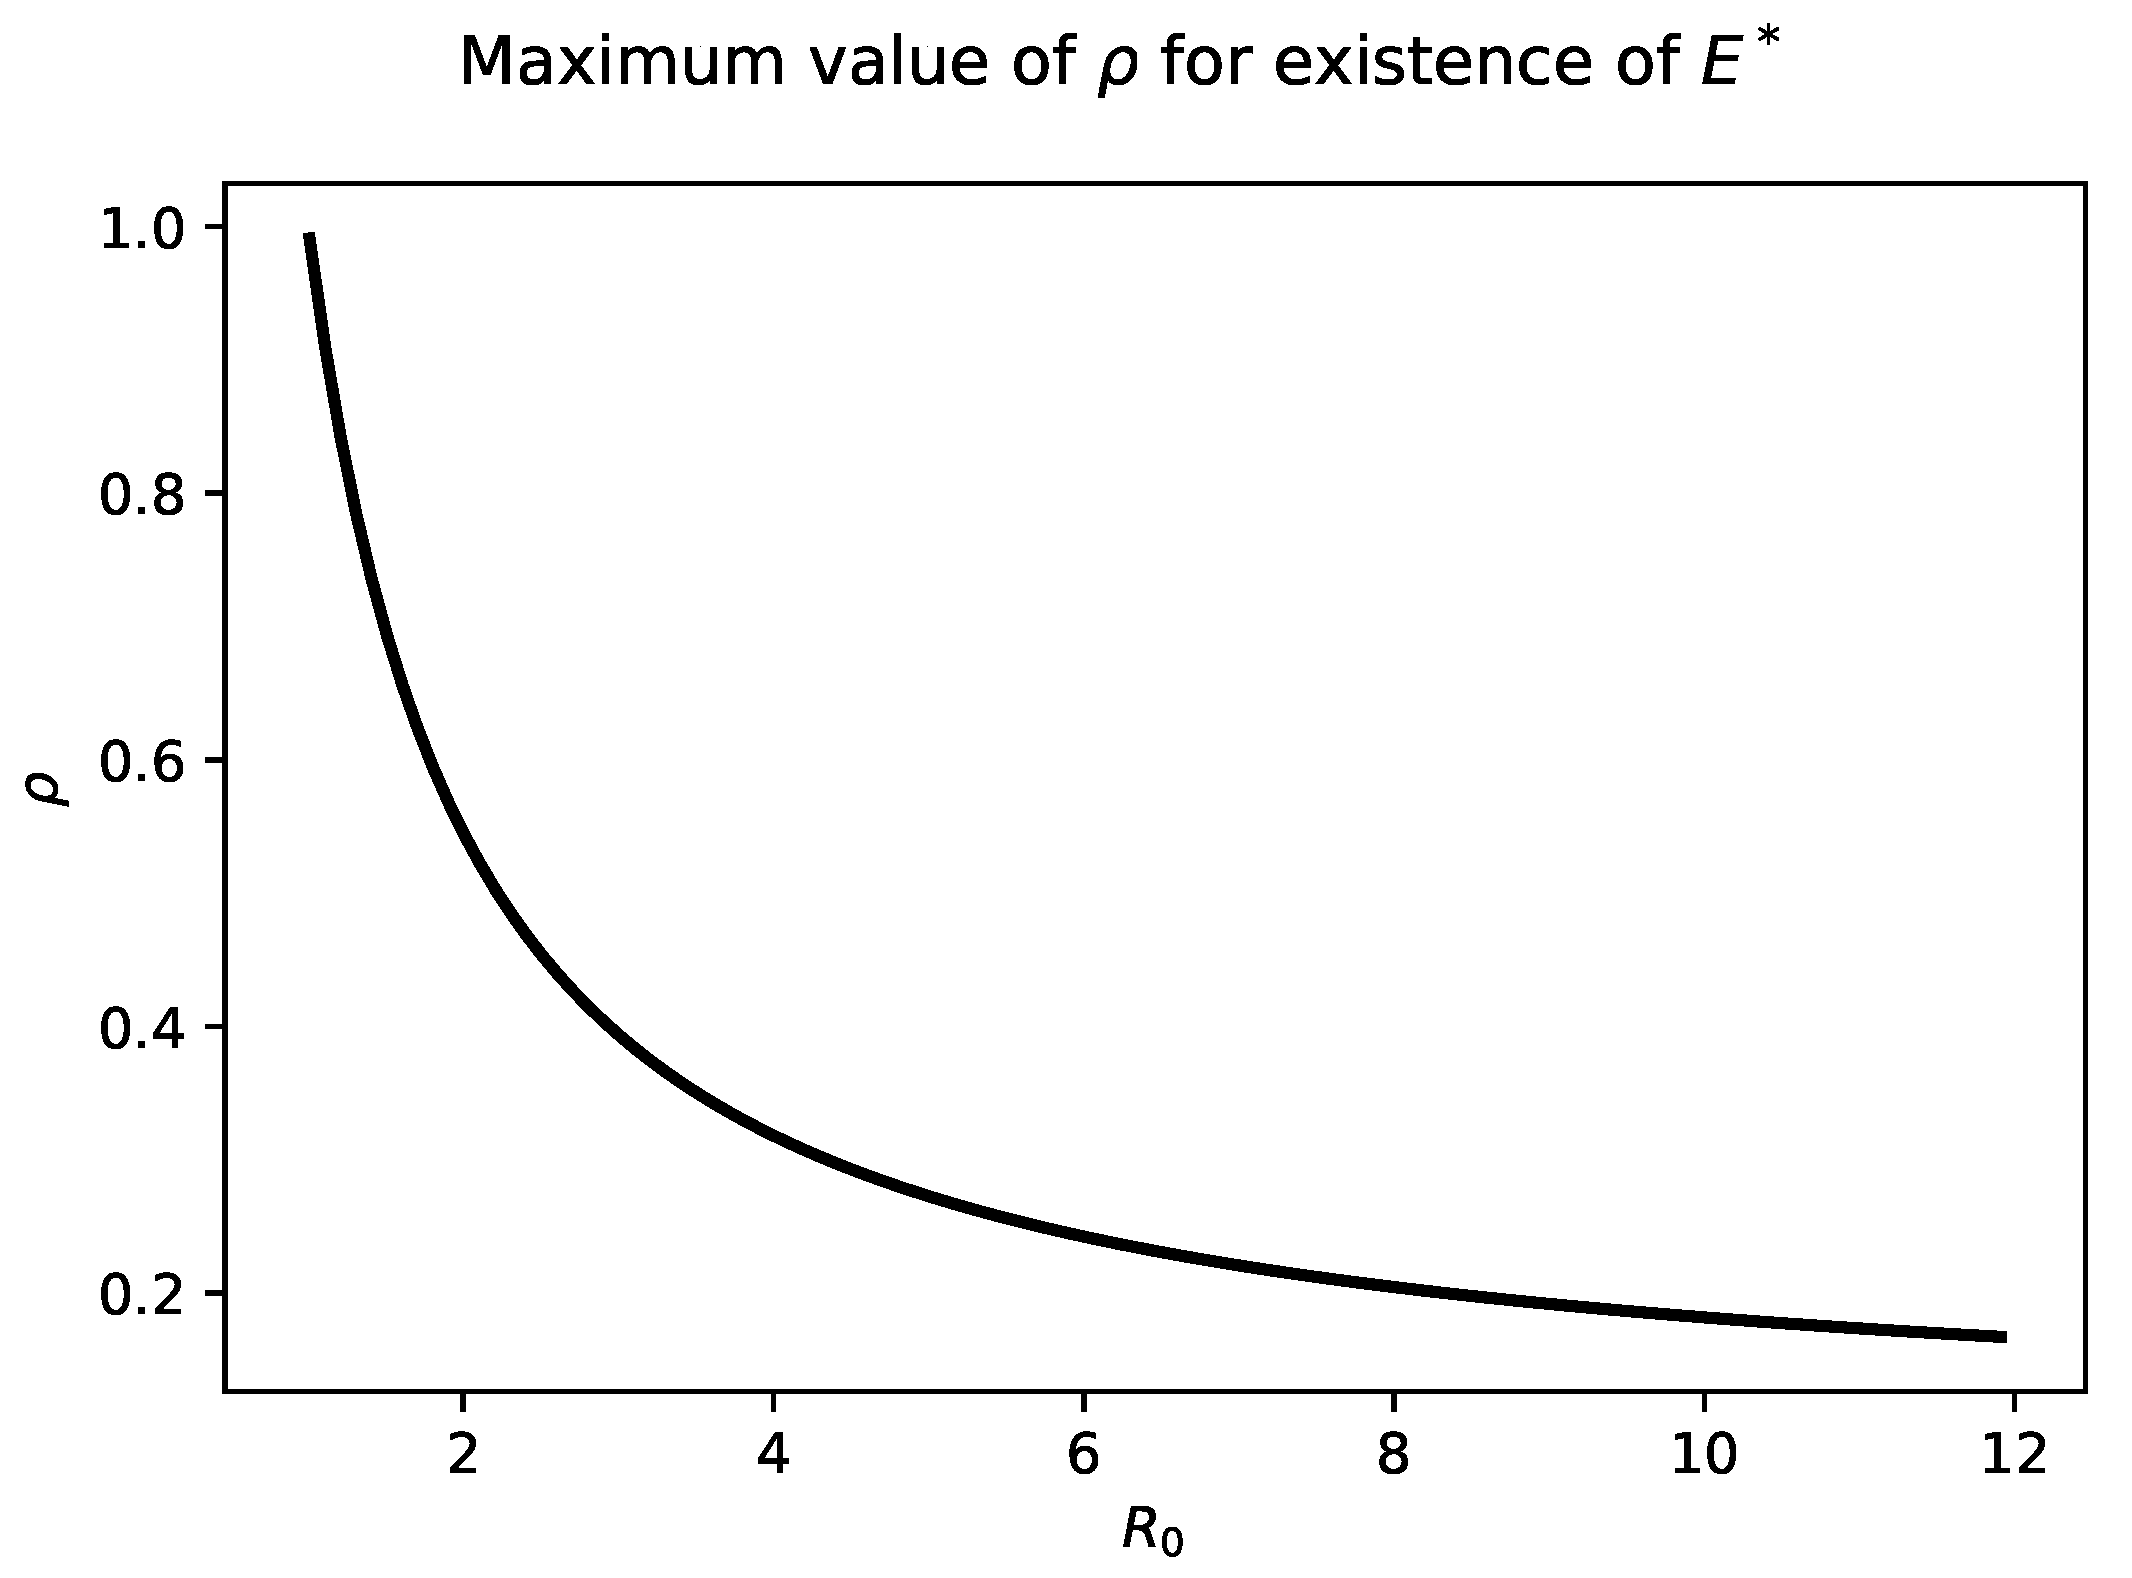
and the maximum proliferation rate of infected hepatocytes is sufficiently small, namely:
Figure 2 highlights the relationship between
and
. As
increases into the biologically relevant range of 6–8, The maximum value of
that admits a chronic steady state is quite small, less than
.
In contrast to the model studies by Hews et al. [
36] in which infected hepatocytes could not divide, the fraction of infected hepatocytes at the chronic steady state in the model (
14)–(16) now depends on the maximum proliferation rate of hepatocytes, even when that rate is small. In particular, that fraction is:
Notice that:
which is identical to the fraction of infected hepatocytes in the model without proliferating infected cells [
36].
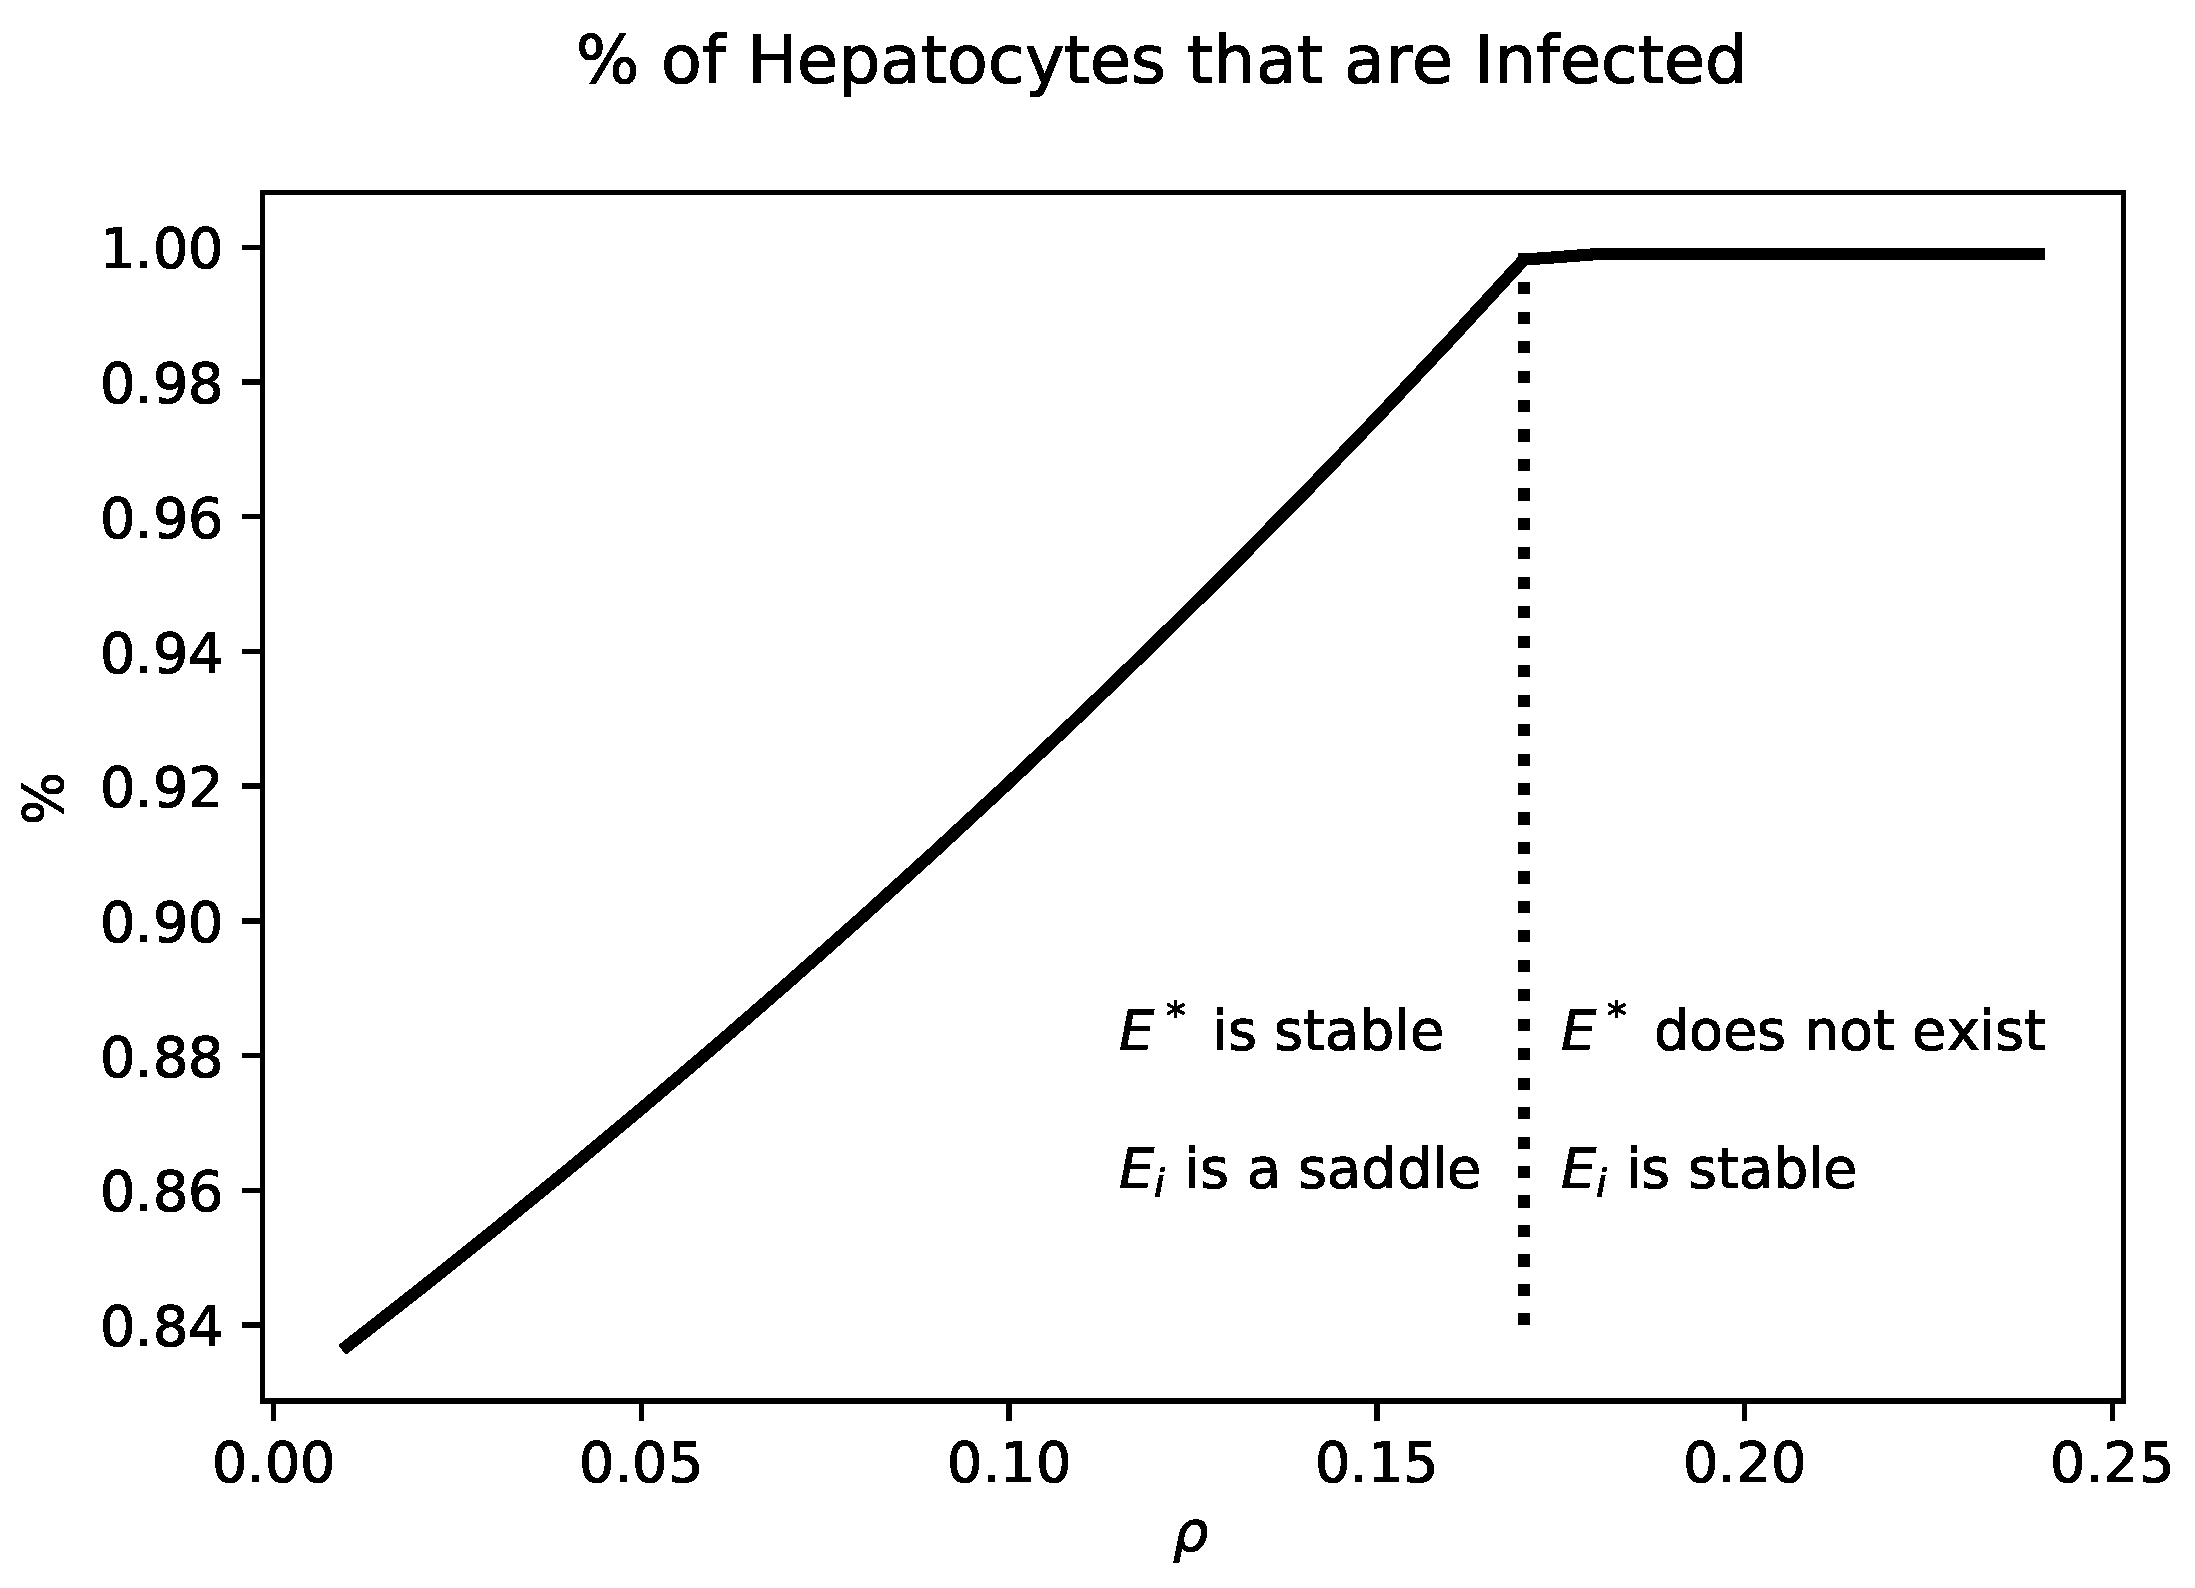
Figure 3 shows the percentage of infected hepatocytes for values of
that yield a chronic state. Increasing
increases the fraction of infected hepatocytes. When
,
collides with
. For values of
,
is no longer biologically relevant.
In drawing the connections between (
7)–(9) and (
14)–(16), we start by discussing the dynamics if the proliferation rate of infected hepatocytes is not severely impaired. This implies that
and
. Therefore,
exists and
does not.
Proposition 3. If and , then is unstable and is locally asymptotically stable.
Proof. The Jacobian matrix of the vector field corresponding to (
14)–(16) at
is:
The eigenvalues of the matrix are given by:
Since:
are positive and
is unstable.
The Jacobian matrix of the vector field corresponding to (
14)–(16) at
is:
The eigenvalues are the following,
If and , then and is locally asymptotically stable. □
According to Proposition 3, this model presents the following biological hypothesis: even if healthy and infected hepatocytes do not proliferate at the same rate, if the infected hepatocytes proliferate at a sufficiently high rate ( and ), then there will not be a significant population of healthy cells in the liver during chronic infection. Furthermore, with a sufficiently high infected hepatocyte proliferation rate, patients would be unlikely to experience oscillations in viral load and liver mass.
Impairing the maximum infected hepatocyte proliferation slightly impacts the following conditions:
and
. Although the chronic state
and the infected state
are both present,
is always unstable and the dynamics for (
14)–(16) are similar to the model analyzed in Hews et al. [
36].
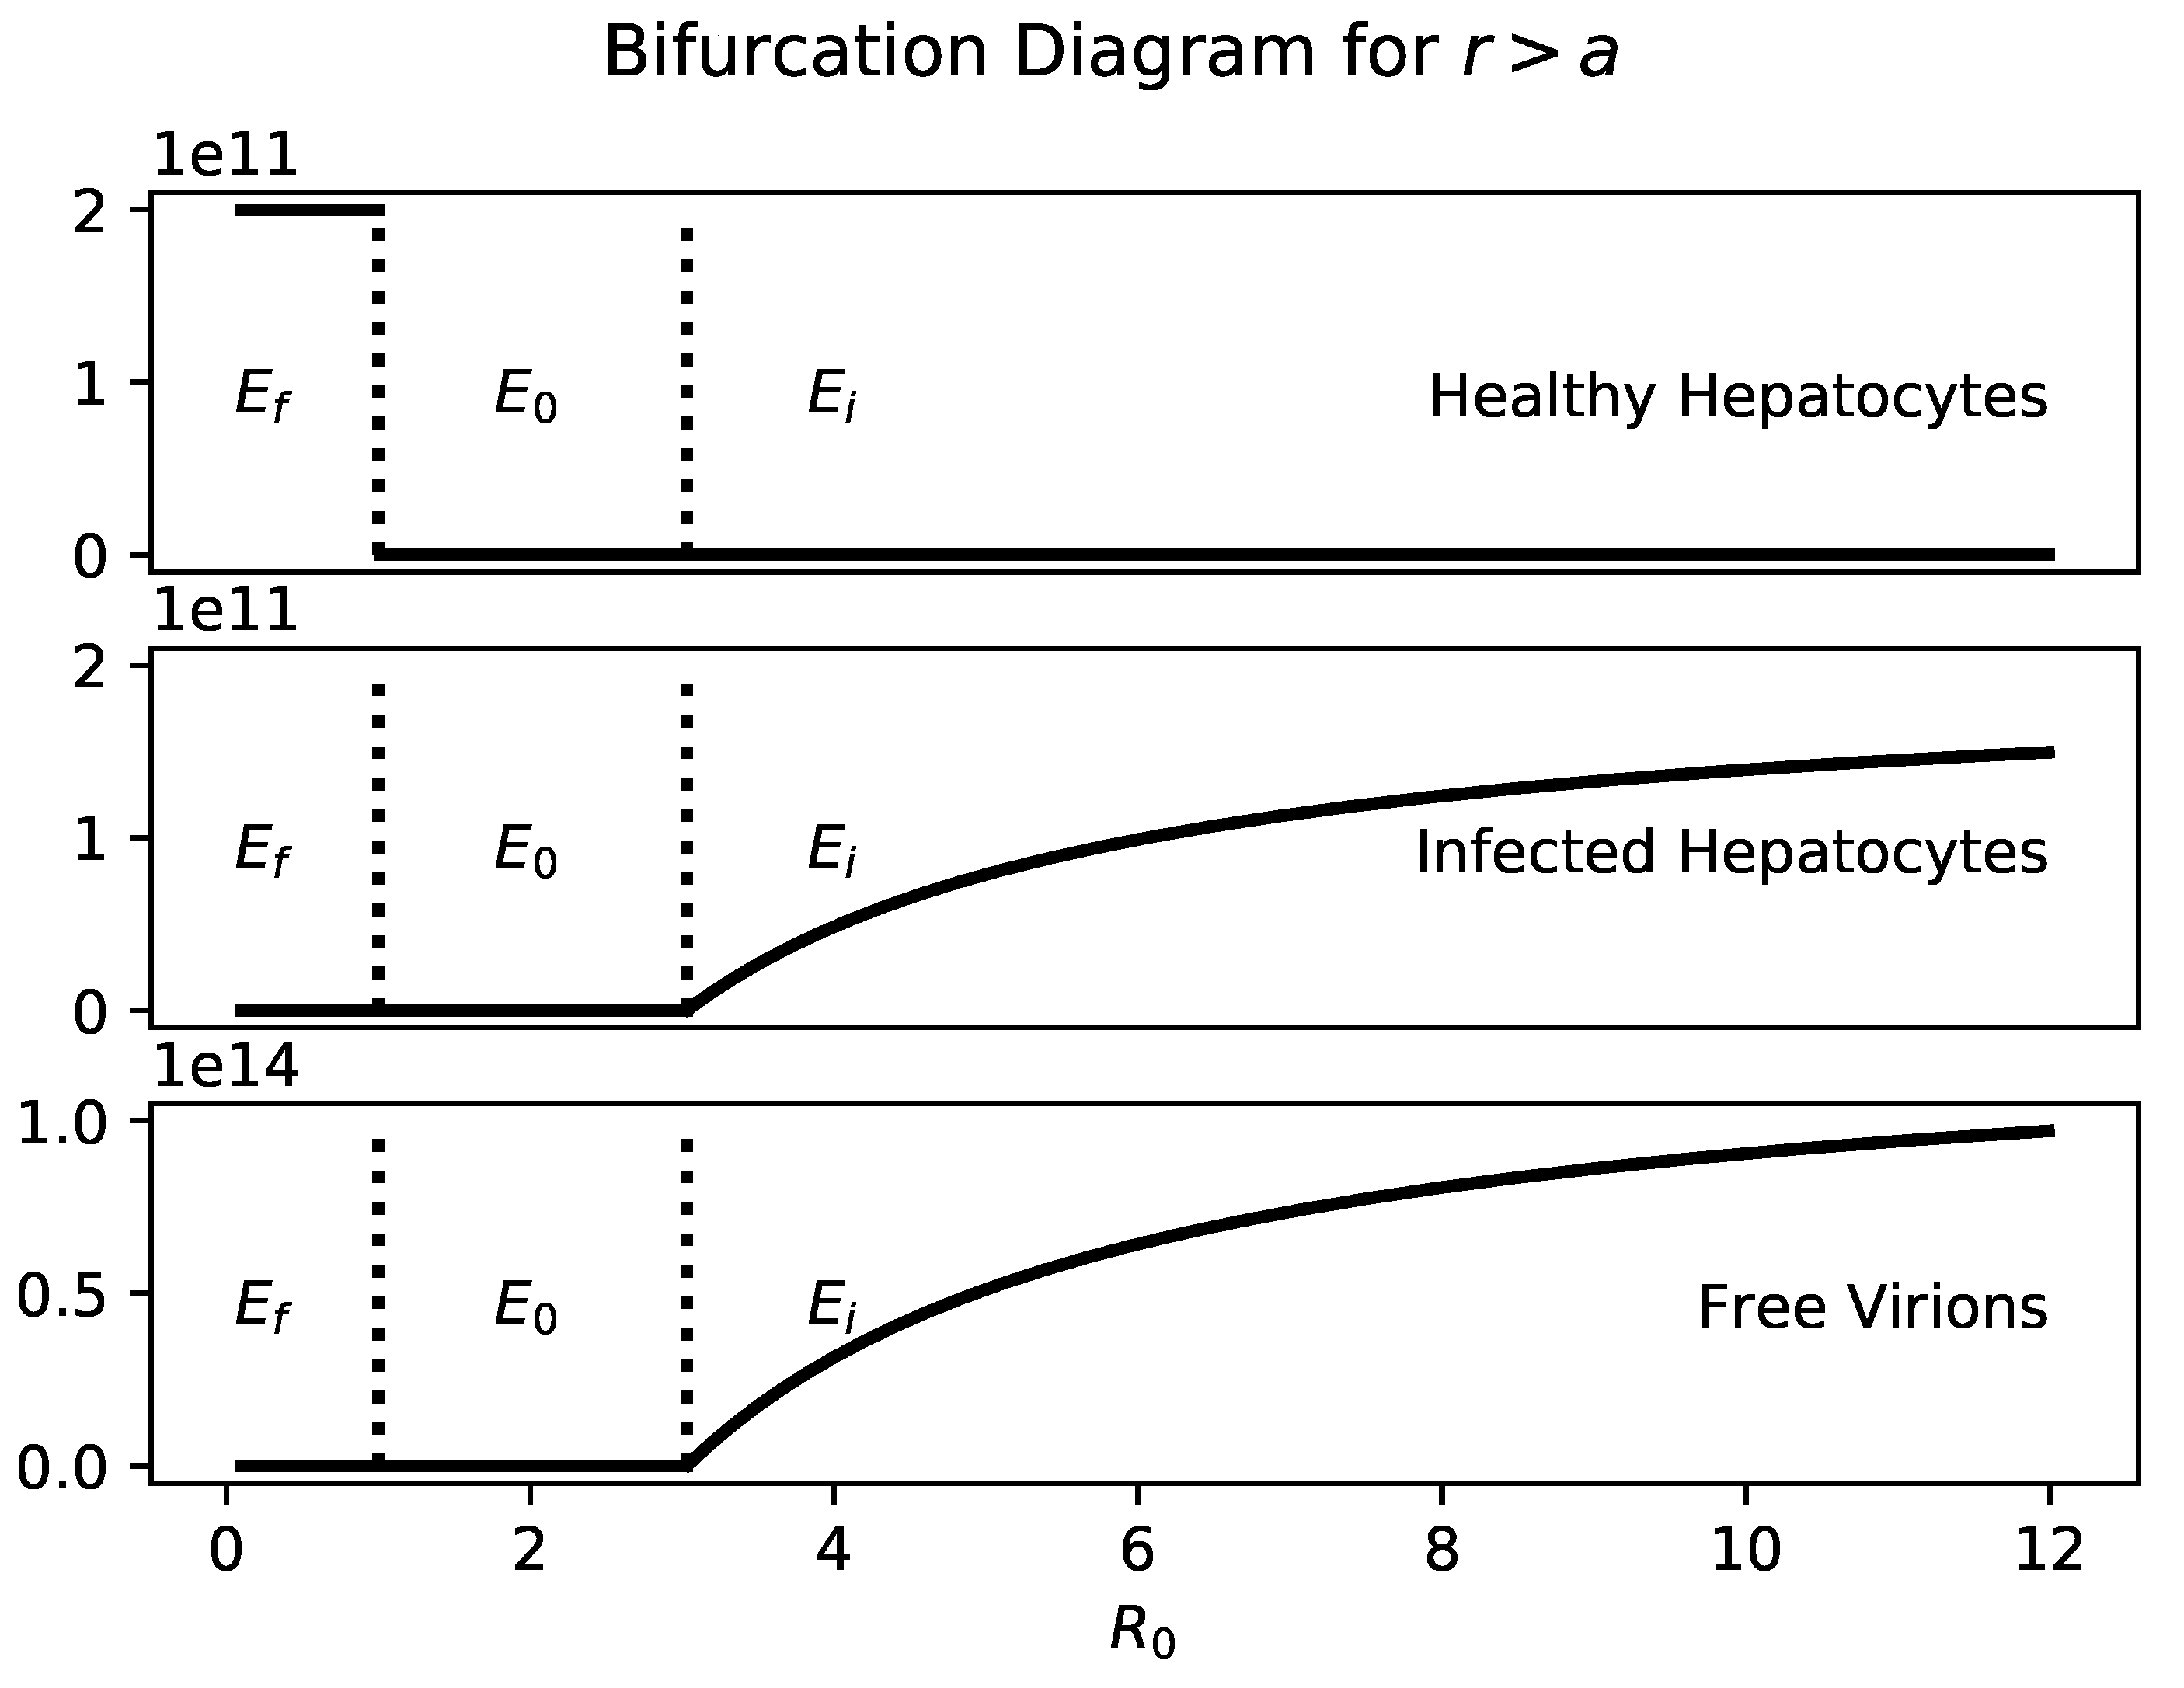
Proposition 4. For (14)–(16), if , then the following results hold. a. If , then is locally asymptotically stable and is a saddle;
b. If then is unstable and is a saddle.
Since
exists, the global stability of
cannot be determined. As in Hews et al. [
36], the severity of disease is controlled by
and
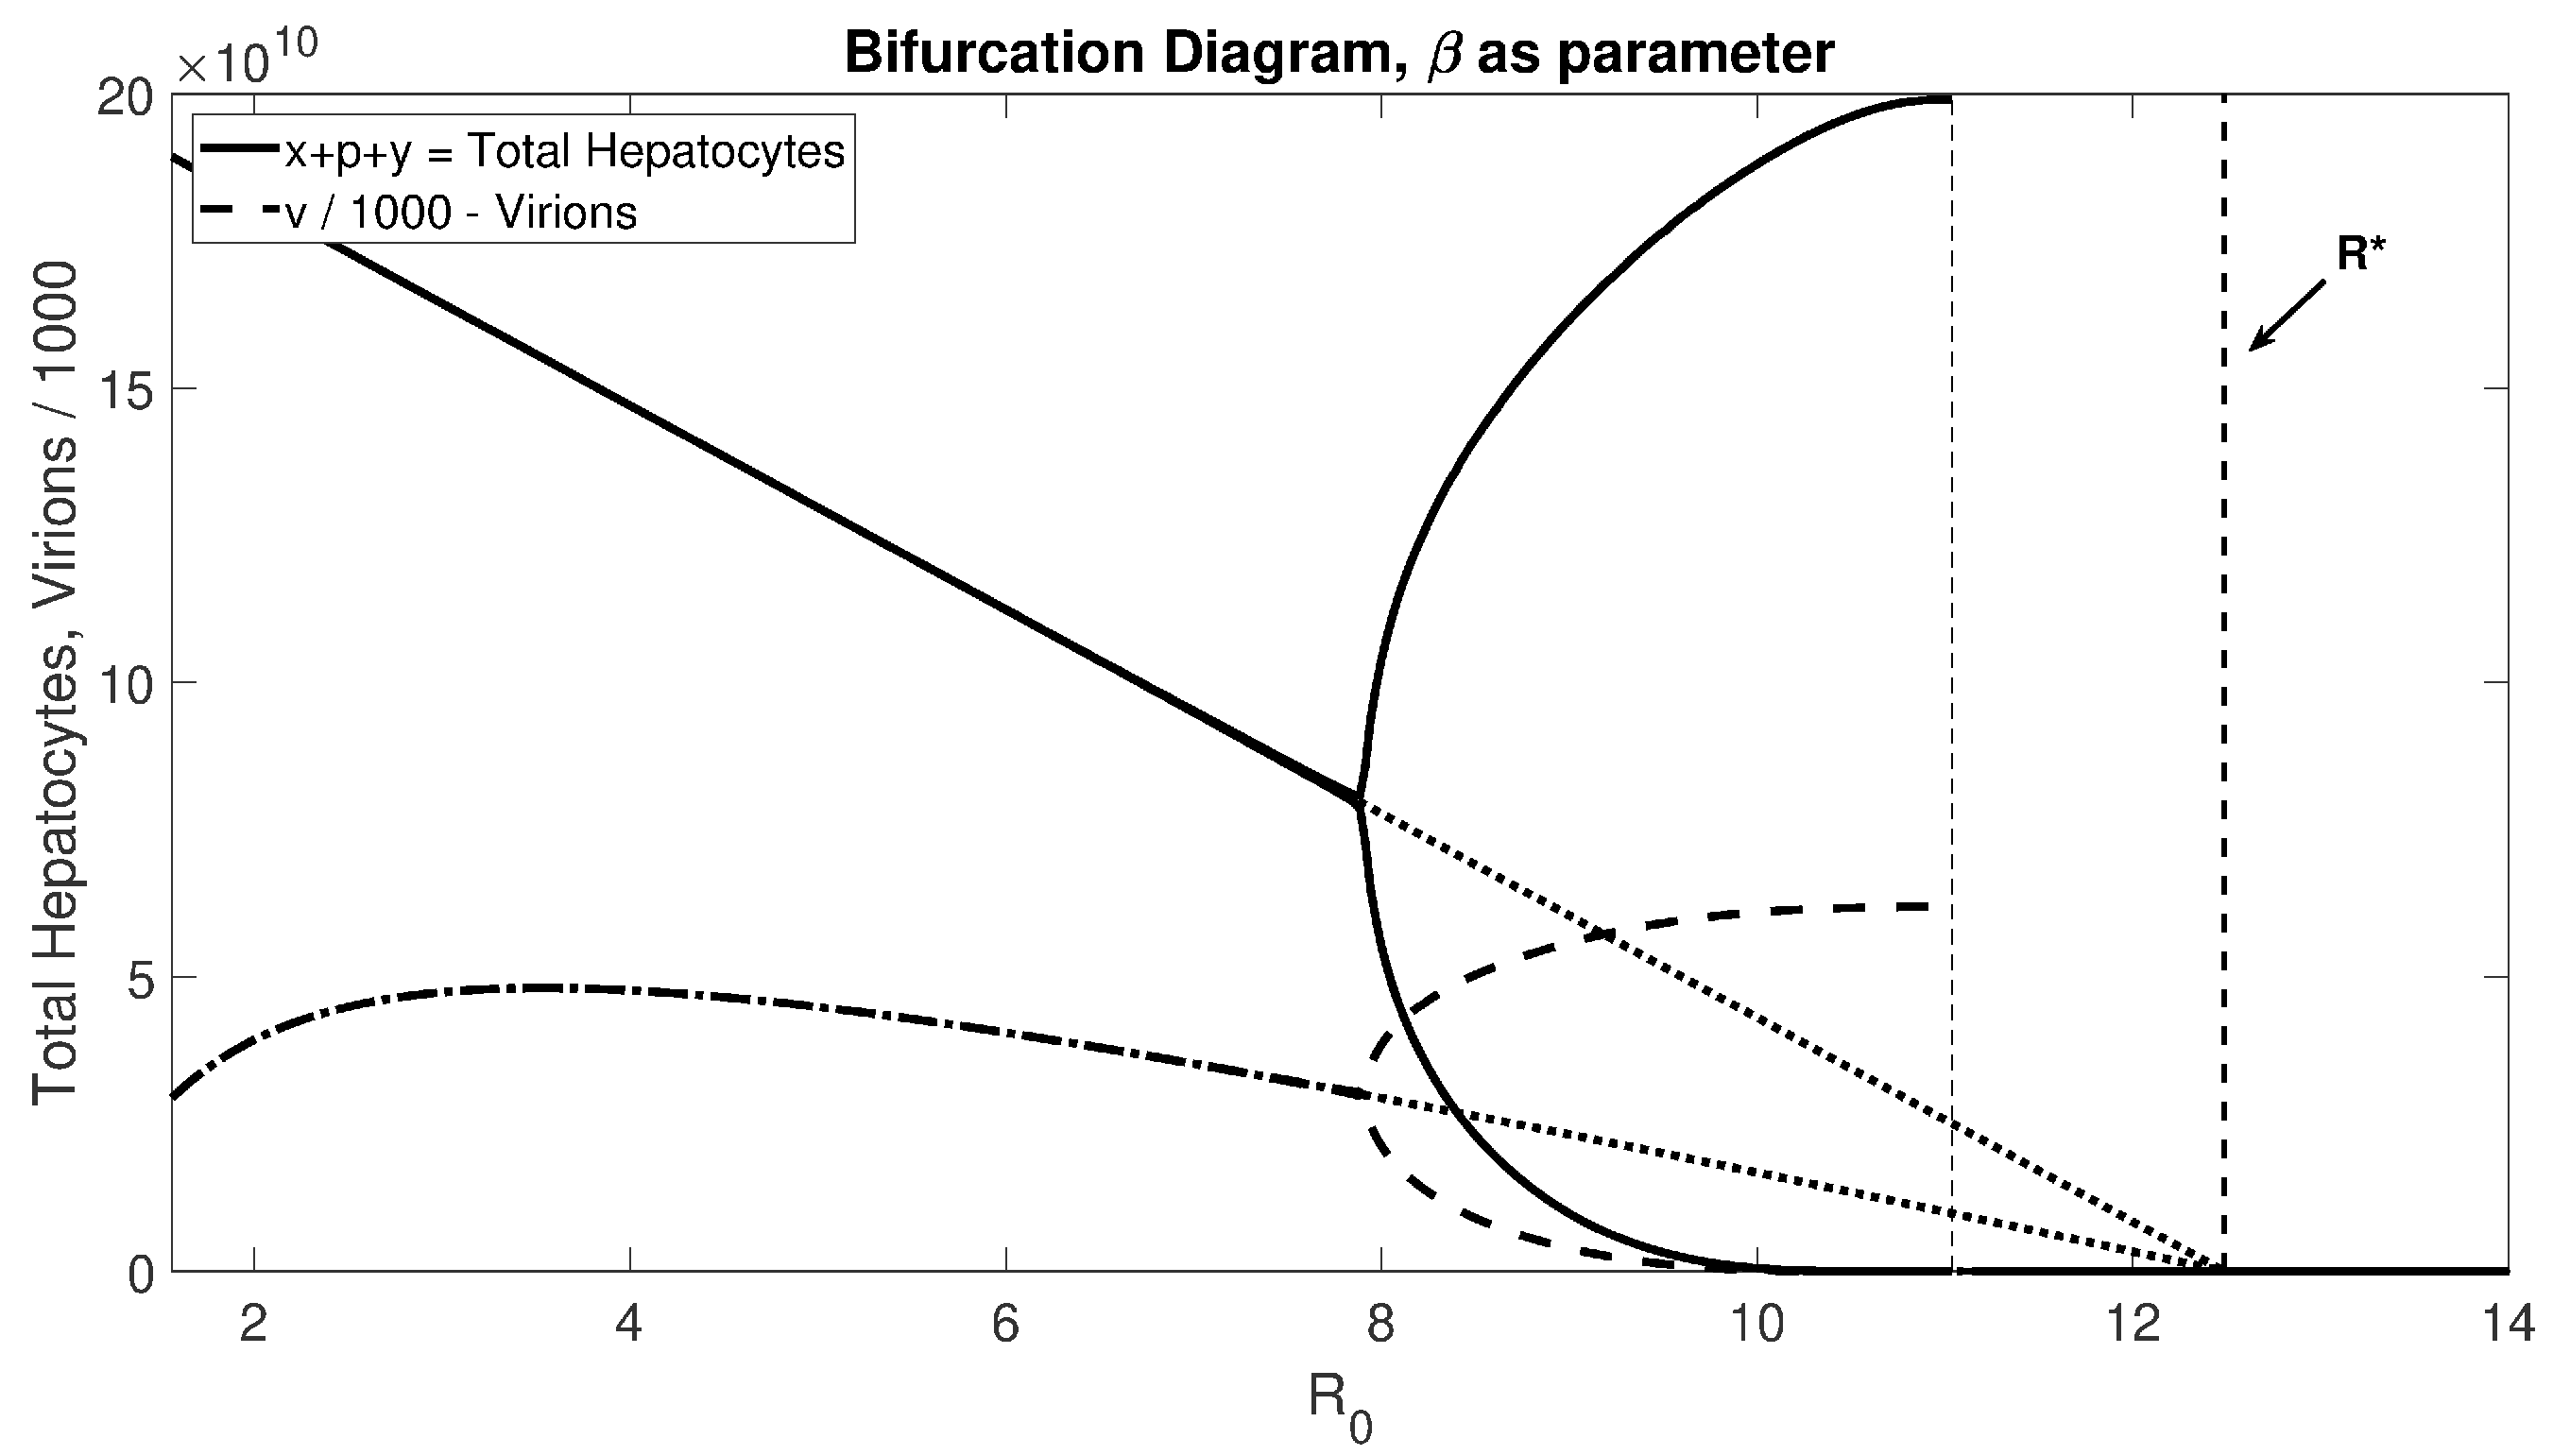
. The bifurcation diagram (
Figure 4) shows that for realistic
values, there will be stable oscillations before passing through the Hopf bifurcation to experience liver failure.
We prove the existence of the Hopf bifurcation point below. Due to the extensive computations, we assumed that
.
Figure 4 suggests that this proof is valid for small
as well. As the reproductive number crosses the bifurcation point of
, the stability of
is transferred to
as it crosses into the positive quadrant. Recall that
only exists in the positive quadrant when
. For the condition
to hold, the proliferation rate has to be sufficiently large; specifically,
.
Theorem 5. Let , and . If , then is locally asymptotically stable.
Proof. The eigenvalues of
J satisfy:
where:
Clearly,
and
when
exists. Let:
where,
Therefore,
when:
By the Routh–Hurwitz criteria, we determined a condition for to be locally asymptotically stable. □
Theorem 6. If , then there is a Hopf bifurcation at .
Proof. Let
. Then:
We showed above that
when
. Therefore, there exists an
such that
. Taking the partial derivative of
with respect to
r, we obtain:
When
, from (
20), we obtain:
Plugging (
22) into (
21) yields,
The two criteria (CH.1) and (CH.2) from Beretta and Kuang [
45] are satisfied. Therefore, there is a Hopf bifurcation at
. □
According to Proposition 4(b), Theorems 5 and 6, this model presents the following biological hypothesis: if the infected hepatocytes proliferation rate is significantly compromised, then there will be a significant population of healthy cells in the liver during chronic infection and patients would be likely to experience oscillations in viral load and liver mass.
Further impairing the maximum proliferation rate of infected hepatocytes implies that
and
. Notice that further reducing
causes convergence to the model discussed in Hews et al. [
36]. Since the existence of the Hopf bifurcation point is proven above, we will only evaluate the global stability result of
.
Proposition 7. If and , then is globally stable.
The proof for Proposition 7 is similar to that of Theorem 2, so we omit it here. These results show that dynamically, there is no benefit to including in the model. If the rate of proliferating infected hepatocytes is not significantly compromised, then one can safely assume that ; otherwise, one can safely assume that .
3. Global Stability Result for
For a sufficiently virulent infection and small proliferation rate of the infected hepatocytes, the liver will completely fail. Mathematically, this situation is represented by the global asymptotic stability of the liver failure state,
. This section builds towards proving that if
and
, then
is globally stable. This technique is modified from Hews et al. [
36]. The “blow-up transformation” has been used previously to study similar complex equilibrium [
46,
47,
48]. Notice that a similar argument can be used for (
7)–(9) to prove that if
and
, then
is globally stable.
Since there is a singularity at the liver failure state,
, we used a ratio dependent transformation to arrive at the global result. We used the transformation
, where
and
. This results in the following system,
The steady states of (
24)–(26) are:
where:
and:
Notice that
is nonnegative when
and
is nonnegative when
and
. The nontrivial steady states are preserved in that
and
.
has been blown up into two steady states:
and
. We call these the two trivial states. To find a global stability result for
, we show that if
and
, all steady states of (
24)–(26) are unstable and that
and
. Since
,
, and (
14)–(16) is bounded, this is enough to show if
and
, then
.
Lemma 8. and are always unstable.
Proof. The variational matrix of the system (
24)–(26) evaluated at
is:
Since , is always unstable.
The variational matrix of the system (
24)–(26) evaluated at
is:
, which is negative when
. On the other hand,
are given by the following matrix,
where:
The trace is negative when
. However,
which is positive when
. This condition and the condition for
contradict, so
is always unstable. □
Lemma 9. If , then .
Proof. Let
be a solution of:
Let
be a solution of:
is the only steady state of (
29) and (30) and is unstable when
. Since there are no other steady states,
are unbounded, and (
29) and (30) is a cooperative, monotone system, that is
. Let
and
, then by the comparison theorem,
for
. Therefore,
Therefore, . □
Theorem 10. If and , then .
Proof. To prove that
is globally stable, we need it to be the only steady state in
. Therefore, set
to ensure that
no longer exists. Since:
it is sufficient to show:
Let
. Then:
By Lemma (9), for all
, ∃
s.t. ∀
,
Combining (
32) and (
34) for
,
Letting
and solving for
yields:
Since
,
. Therefore,
. Since
,
s.t. ∀
,
. Therefore,
Thus, (
31) is satisfied. □
According to Lemma 8, Lemma 9, and Theorem 10, this model presents the following biological hypothesis: if there is a sufficiently virulent infection and a small proliferation rate of infected hepatocytes, then the liver will fail.
Note that Theorem 3.3 only provides sufficient conditions for the collapse of the hepatocyte population, which can happen before
is larger than
, as shown in
Figure 4. This leaves an open mathematical question for a necessary condition for the collapse of the hepatocyte population.
4. Discussion
The effectiveness of treatment may be measured by its effect on . Any reduction in that fails to cross from the right will not clear the infection and is a failure in this sense. However, it may still improve symptoms and reduce the likelihood of liver failure. If treatment reduces , then it is curative if this reduction can be maintained under the assumptions of the model. In the case of HBV, treatment with nucleoside analogues usually eventually fails. Mathematically, wanders under treatment, and while it may fall to less than one transiently, it eventually transits unity from the left. However, as a practical matter, need not be calculated to identify treatment failure.
The emergence of the cellular vitality index suggests a new way to classify the dynamics and plan the treatment of chronic HBV. Traditional therapies that target the virus affect only
, but
also determines when the liver fails. Given the limitation of the current standard of care, new treatment options are needed. Our model suggests that increasing healthy hepatocyte proliferation, decreasing infected hepatocyte proliferation, and increasing healthy and infected hepatocytes by the same factor should delay liver failure and promote patient survival. Since patients become resistant to all nucleoside analogues over time, further treatment options are needed. Our model proposes that controlling the proliferation rate should prolong the life of the liver. Increasing the distance between the cell vitality index and the reproduction number moves the Hopf bifurcation and decreases the likelihood of the onset of dangerous oscillations in liver damage. Specifically, the closer
to
, the more likely the system will experience an oscillation or a collapse; see
Figure 4. Thus, increasing the distance, for example by controlling the proliferation rate, can prevent this dangerous onset. Treatment options that control the proliferation rate of healthy and infected hepatocytes are not currently available and, to the best of our knowledge, are not currently being explored.
These model conclusions only hold if proliferation in infected cells leads to infected daughter cells. However, experimental evidence suggests that hepatocyte proliferation may destabilize and dilute viral DNA, thus aiding in clearing infection [
49], and that hepatocyte proliferation may be inversely associated with viral loads in experimental settings. Furthermore, modeling work by Goyal et al. [
42] suggests hepatocyte division may be an important mechanism in both clearing infection and protecting the liver from catastrophic cell loss. It is unclear, however, the degree to which these possible protective properties of proliferation are at work in acute vs. chronic infection.
The model analysis suggests that the modeling decision to include proliferating infected hepatocytes in an HBV model should depend on whether or not the proliferation rate of infected hepatocytes is severely impaired. If it is not, then including a slightly different proliferation rate of infected hepatocytes compared to uninfected cells adds needless complexity; the key dynamics will be essentially unaltered, so it is safe to assume that infected and uninfected cells proliferate at the same rate. On the other hand, if infection significantly impairs the proliferative potential of hepatocytes, then one can safely assume that infected cells do not proliferate; again, the dynamical behavior is insensitive to variations in the rate at which infected cells divide.
The analysis presented here also suggests a testable biological prediction, namely that one can determine if infected hepatocytes are proliferating to an appreciable degree, and yielding infected daughter cells, simply by searching for uninfected cells. If all cells in the liver are infected (beyond the acute phase of infection), then this model proposes that infected cells are proliferating at a high rate and generating infected progeny. The existence of a significant uninfected population implies the severely impaired proliferative potential of infected cells. It has been observed that the fraction of hepatocytes infected in a chronic HBV case progresses from nearly to 100% to only a few percent [
50]. This may be explained by a combination of gradual immune attrition of infected hepatocytes, possibly impaired viral replication, and weak proliferation. Mason et al. [
50] recently presented evidence that hepatocytes refractory to infection are selected over the course of chronic infection, with healthy clonal populations prevalent. Thus, it is likely that a strong proliferative advantage for healthy over infected cells can keep infected hepatocyte populations low through both Darwinian mechanisms and via the intrinsic population dynamics of the disease system.
Our minimal representation of the immune response is also a clear limitation, but by minimizing model dimensionality, we can more clearly elucidate the effect of comparative proliferation rates on the model dynamics. An essential component of the immune response, at least in acute HBV infection, may be noncytotoxic curing of infected cells with subsequent “immunity” to re-infection, considered in modeling works by Ciupe et al. [
16,
37]. This dynamic cannot be considered in our current framework and may have further implications for the role of proliferation among different hepatocyte populations.
Future work will also focus on using the model to explore the impact of treatments. Current antiviral therapies include standard interferon and PEGylated interferon therapies for short-term use and nucleoside/nucleotide analogues for long-term use [
51,
52,
53], but there are still open questions about the optimum timing and ordering of the treatments [
54,
55]. Models that have made slightly different assumptions have fit their models to existing datasets showing complex virus dynamics resulting from clinical trials [
22,
27,
29,
37,
38,
41,
43,
56,
57,
58].
One should take care, however, not to push this model, and therefore the hypothesis just presented, too far. The BVIM has typically been applied to infections of the blood (e.g., malaria and HIV). However, unlike blood, the tissues of the liver are not well mixed, which raises legitimate questions about the validity of an ODE description. Therefore, an important future project is to study a spatially explicit version of this model. The most obvious approach would be a partial differential equation model in which the basic dynamical properties modeled here are coupled with terms describing virion diffusion through the interstitium and perhaps a form of advection representing the passage of virions through the hepatic vasculature. At any rate, the significance of spatial effects is an open question that needs to be addressed before long.


