Abstract
Wireless technologies are being introduced in industrial applications since they provide certain benefits, such as the flexibility to modify the layout of the nodes, improving connectivity with monitoring and decision nodes, adapting to mobile devices and reducing or eliminating cabling. However, companies are still reluctant to use them in time-critical applications, and consequently, more research is needed in order to be massively deployed in industrial environments. This paper goes in this direction by presenting a novel wireless acquisition system aimed at industrial applications. This system embeds a low-cost technology, such as XBee, not frequently considered for deterministic applications, for deploying industrial applications that must fulfill certain QoS requirements. The use of XBee 900 MHz modules allows for the use of the 2.4 GHz band for other purposes, such as connecting to cloud services, without causing interferences with critical applications. The system implements a time-slotted media access (TDMA) approach with a timely transmission scheduling of the messages on top of the XBee 900 MHz technology. The paper discusses the details of the acquisition system, including the topology, the nodes involved, the so-called coordinator node and smart measuring nodes, and the design of the frames. Smart measuring nodes are implemented by an original PCB which were specifically designed and manufactured. This board eases the connection of the sensors to the acquisition system. Experimental tests were carried out to validate the presented wireless acquisition system. Its applicability is shown in an industrial scenario for monitoring the positioning of an aeronautical reconfigurable tooling prototype. Both wired and wireless technologies were used to compare the variables monitored. The results proved that the followed approach may be an alternative for monitoring big machinery in indoor industrial environments, becoming especially suitable for acquiring values from sensors located in mobile parts or difficult-to-reach places.
1. Introduction
Smart manufacturing, also known as Industry 4.0, involves improving production processes in terms of productivity, efficiency, safety and intelligence by means of integrating software powered devices for monitoring, predictive maintenance, supervision and control operations [1,2]. These operations require the use of advanced communication technologies capable of carrying the data to the analysis, storage and decision devices distributed along the processes. New communication technologies are being introduced in industrial environments to facilitate these operations [3,4]. In fact, network capabilities constitute a key dimension of cyber physical production systems (CPPS) [5], which are at the core of Industry 4.0 [6,7]. They are aimed at improving the connectivity among sensors, actuators and controllers, while providing the quality of service (QoS) requirements of the applications. In this scenario, wireless technologies are playing an increasing role in industrial applications, since they provide several benefits, when compared to wired technologies [8,9]. The major benefits are the enabling of configuration flexibility, supporting mobility, eliminating costly cabling and allowing for easier network expansion. In general, these advantages improve productivity and efficiency [10]. Currently, they are assumed to be in a critical point of massive deployment at production applications.
However, wireless technologies have been penalized by a lower reliability, integrity and security of the wireless links when compared to wired links. Most drawbacks are due to the nature of wireless communication technologies which have a negative impact in the predictability and error rate. Wireless technologies introduce new phenomena such as signal fading, interferences and propagation by different paths. These phenomena are particularly relevant in industrial environments, full of metallic surfaces and obstacles which may difficult wave propagation. In addition, a large number of industrial applications require stringent QoS requirements and cannot tolerate long communication delays or package losses.
Although wireless technologies are being introduced in industrial applications for noncritical operations, its usage in critical applications is currently under scrutiny. Consequently, more research is needed in order to introduce them massively for this kind of operations [10]. Several issues must be solved, e.g., mitigating the influence of interferences, especially those caused by other communication technologies, avoiding congestions and collisions in order to guarantee the QoS requirements of the applications and adequately managing the frequency spectrum [11,12]. Wireless technologies are starting to be accepted for some industrial operations. In [13], the typical latency values that different industrial applications require are discussed. In monitoring applications, they tend to be accepted at low sampling frequencies (lower than 10 Hz), which limits its usage for monitoring plants with faster dynamics since the evolution of the plant may be not adequately captured with such a low range of sampling frequencies.
Most low-power wireless technologies available for industrial applications in the context of Industry 4.0 operate at the 2.4 GHz frequency band, e.g., ZigBee, Bluetooth, ISA 100.11a WirelessHART and WIA-PA [13]. Although these technologies employ mechanisms to improve their coexistence, they are still vulnerable to transmissions from uncoordinated stations with similar technologies or issued with higher-power technologies such as WiFi [14], which typically use a transmission power which is 100 times higher than a typical IEEE 802.15.4 node [15]. WiFi technology is frequently found in industrial scenarios, particularly at the 2.4 GHz band. Several studies [16,17] have checked the apparition of interferences that may cause a degradation of the QoS of the applications. Although the use of the 5 GHz band is increasingly used at WiFi technology, it suffers from shorter coverage and more difficulties for avoiding obstacles. In addition, it is less common in industrial environments.
In this scenario, the only mainstream wireless low-power technology which operates outside the 2.4 GHz frequency band is ZigBee, at 900 MHz [14,18]. This is the technology chosen for our approach, since it provides a new communication channel which avoids interferences with WiFi technology. More specifically, XBee 900 MHz modules were employed. These are low-cost modules which implement the IEEE 802.15.4 protocol. These modules implement the CSMA/CA medium-access control method, which is not suitable for determinist applications since transmission times are not guaranteed [19].
In this research, the authors present a novel wireless acquisition system aimed at measuring through distributed sensors in industrial applications with QoS requirements. By using this system, it is possible to monitor mobile devices or difficult-to-reach sensors. It also improves configuration flexibility, eliminates costly cabling and allows for easier network expansion. In general, these advantages improve productivity and efficiency of the industrial processes [10]. The presented system avoids using the 2.4 GHz for critical communications. Thus, the interferences caused by most communication technologies, which typically operate in this band [14], may be avoided. Thus, WiFi 2.4 GHz provides a different channel for other noncritical operations related with integrating the process information or connecting to services available at the factory or in the cloud [4,17]. In addition, the authors designed a logical protocol based on time-slotted media-access policies (TDMA), which permit a central node to coordinate all transactions of the acquisition system according to a static schedule [20]. The use of this protocol for critical operations avoids congestions and collisions achieving a higher degree of determinism in order to guarantee the QoS requirements of the applications. The TDMA protocol was implemented over a low-cost wireless technology, such as XBee 900 MHz modules, not frequently considered for deterministic applications. An architecture, based on a star topology, with two types of nodes is also presented: the so-called Coordinator Node and Smart Measuring Nodes. The Coordinator Node was implemented over a real-time embedded platform, commonly accepted in industrial applications, such as the Compact RIO series, provided by National Instruments. In addition, the Smart Measuring Node device was specifically designed for easing the connection of the sensors. This module provides the XBee communication to the distributed sensors as well as edge processing capabilities. Finally, the proposed monitoring system extends the communication capabilities by adding wireless connectivity to the processes and may be used in combination with the wired capabilities of a commonly accepted platform for industrial scenarios, the Compact RIO series.
Experimental tests were carried out to validate the design of the system and evaluate its performance. The obtained experimental results proved that it may be used for a number of sensors in the range of teens of sensors, reaching sampling frequencies of up to 40 Hz, going beyond the frequency rate of 10 Hz, which is commonly accepted in [13]. The performance of the system was tested in industrial facilities. More particularly, it was used for acquiring the position of an aeronautical reconfigurable tooling prototype. The obtained results proved that the followed approach may be valid for monitoring diverse variables in big machinery at industrial facilities.
The layout of the article is as follows: Section 2 discusses some related studies. Section 3 presents the design of the monitoring system. The following section presents some experimental tests of the acquisition system. Section 5 discusses the results of the application in industrial facilities to the prototype aeronautical tooling. Finally, the article draws some conclusions.
2. Related Work
There are several standards available to be applied in monitoring applications [21]. Some industrial applications developed with wireless technologies are described in [22,23]. Sometimes, the IEEE 802.11 standard is used at industrial communications, but in general, it does not ensure the QoS requirements. Some studies propose using WiFi coordinated channels to achieve a real-time deterministic behavior at industrial applications [24]. Other studies propose algorithms specifically aimed at control applications [2]. However, these approaches are still experimental, and this technology does not seem adequate for stringent, deterministic applications.
The most popular standards used at industrial applications are based on the IEEE 802.15.4 standard, such as ZigBee, WirelessHART, ISA100.11a and WIA-PA [18]. The applicability of this standard to sensor networks for industrial applications is analyzed in [25]. The performance of this standard is compared against Bluetooth and WiFi under various conditions for embedded control systems [26].
Currently, there is a lot of research for introducing new MAC mechanisms to the IEEE 802.15.4 standard that make wireless sensor-actuator networks more deterministic. For example, the incipient IEEE 802.15.4e standard proposes a medium-access control (MAC) layer that supports collision-free wireless channel access mechanisms for industrial, commercial, and healthcare applications [27,28]. Other amendments are also under research, such as the introduction of time-slotted channel hopping (TSCH) techniques aimed at providing more predictable latency, higher energy efficiency and communication reliability [29]. Other experimental approaches aimed at providing deterministic and reliable communication have been proposed in [30]. However, these approaches are still under development and, currently, do not seem adequate for being implanted in production applications.
Some of the available IEEE 802.15.4 standards, such as WirelessHART, are starting to be accepted at industrial applications [31]. This standard, specifically aimed at industrial wireless sensor-actuator networks, adopts TDMA mechanisms at the MAC layer to ensure the schedulability of the applications [32]. However, it is not considered safe yet, and new mechanisms are being proposed [33]. In addition, WirelessHART-powered devices tend to be costly.
Undoubtedly, the most popular IEEE 802.15.4 technology is ZigBee. One of the advantages of this popularity is the availability of products at a very low cost, such as the XBee series. This technology has been thoroughly used in monitoring applications in different domains, such as remote healthcare, industrial control, fire detection and environmental monitoring. Some works describe the application in smart grids devices [34,35,36]. This technology is frequently used in home/building automation applications [37,38,39]. It is also an interesting alternative for outdoor applications, such as those found in agriculture [40,41]. This technology is used very commonly in industrial applications. For example, [42] presents a control and monitoring system for a robotic hand. In [43], it is used for controlling a vehicle. In [44], it is used to monitoring an assembly line. In [45], it is used for the diagnosis and detection of faults, based on power consumption modeling, in an industrial robot. In [46], its application for industrial trace heating is described. In [47], a data acquisition application deployed inside ships is described. The design of a sensor node for structural health monitoring is presented in [48].
One of the advantages of ZigBee/IEEE 802.15.4 technology is that it is the only mainstream technology able to operate outside the 2.4 GHz band [18]. Actually, some applications operate at the 868 and 900 MHz bands [41,49,50,51], proving that XBee modules are already mature modules to be introduced at industrial applications.
Finally, some studies in the literature propose different architectures that allow the integration of process data acquired with ZigBee with cloud infrastructures using different technologies [17,23,52,53]. This approach allows the separation of the traffic generated from the processes to the cloud services improving the efficiency of the factories.
3. Design of a Wireless Monitoring System
This section describes the design of a wireless monitoring system, including the architecture, network configuration and topology, design of the frames and the ad hoc experimental sensor board. The proposed monitoring system is aimed at monitoring industrial processes by obtaining several measures from diverse sensors distributed in distances in the range of several meters. The presented monitoring system was tested for validation purposes indoors by means of several validation tests carried out at the university facilities. In addition, the system was tested with an aeronautical reconfigurable tooling prototype at industrial premises. The system is aimed at monitoring big machinery.
The operational requirements for such a monitoring system are as follows:
- Sampling frequency: The monitoring system should be able to monitor real-time sensor data acquired from distributed places at frequencies ranging from 10 to 40 Hz (100–25 ms).
- Types of sensors: Different kinds of sensors should be connected: Analog sensors, in the range 0–3.3 V. In the future, digital sensors connected by means of the SPI bus could be also considered.
- Operating distance: Since the monitoring system is aimed at monitoring big machinery indoors in industrial environments, it should at least reach distances of up to 10–15 m.
- Amount of sensors: In the range of teens of sensors should be connected to the monitoring system. The number of sensors may change according to the sampling frequency used.
- WiFi compatible: WiFi technology is frequently used in industrial scenarios for different, noncritical applications. The monitoring system should be able to avoid or mitigate the loss of packages due to the interferences caused by this technology.
- Bounded time: The monitoring system should be able to minimize jitter in order to provide precise measures.
- Allow both wired and wireless connections: The monitoring system must be able to allow wired connections, for critical sensors, as well as wireless connections, in order to reduce cabling and measure difficult to reach places.
- Able to work in industrial environments: The monitoring system must blend technologies which are commonly accepted in industrial scenarios.
3.1. Architecture of the Monitoring System
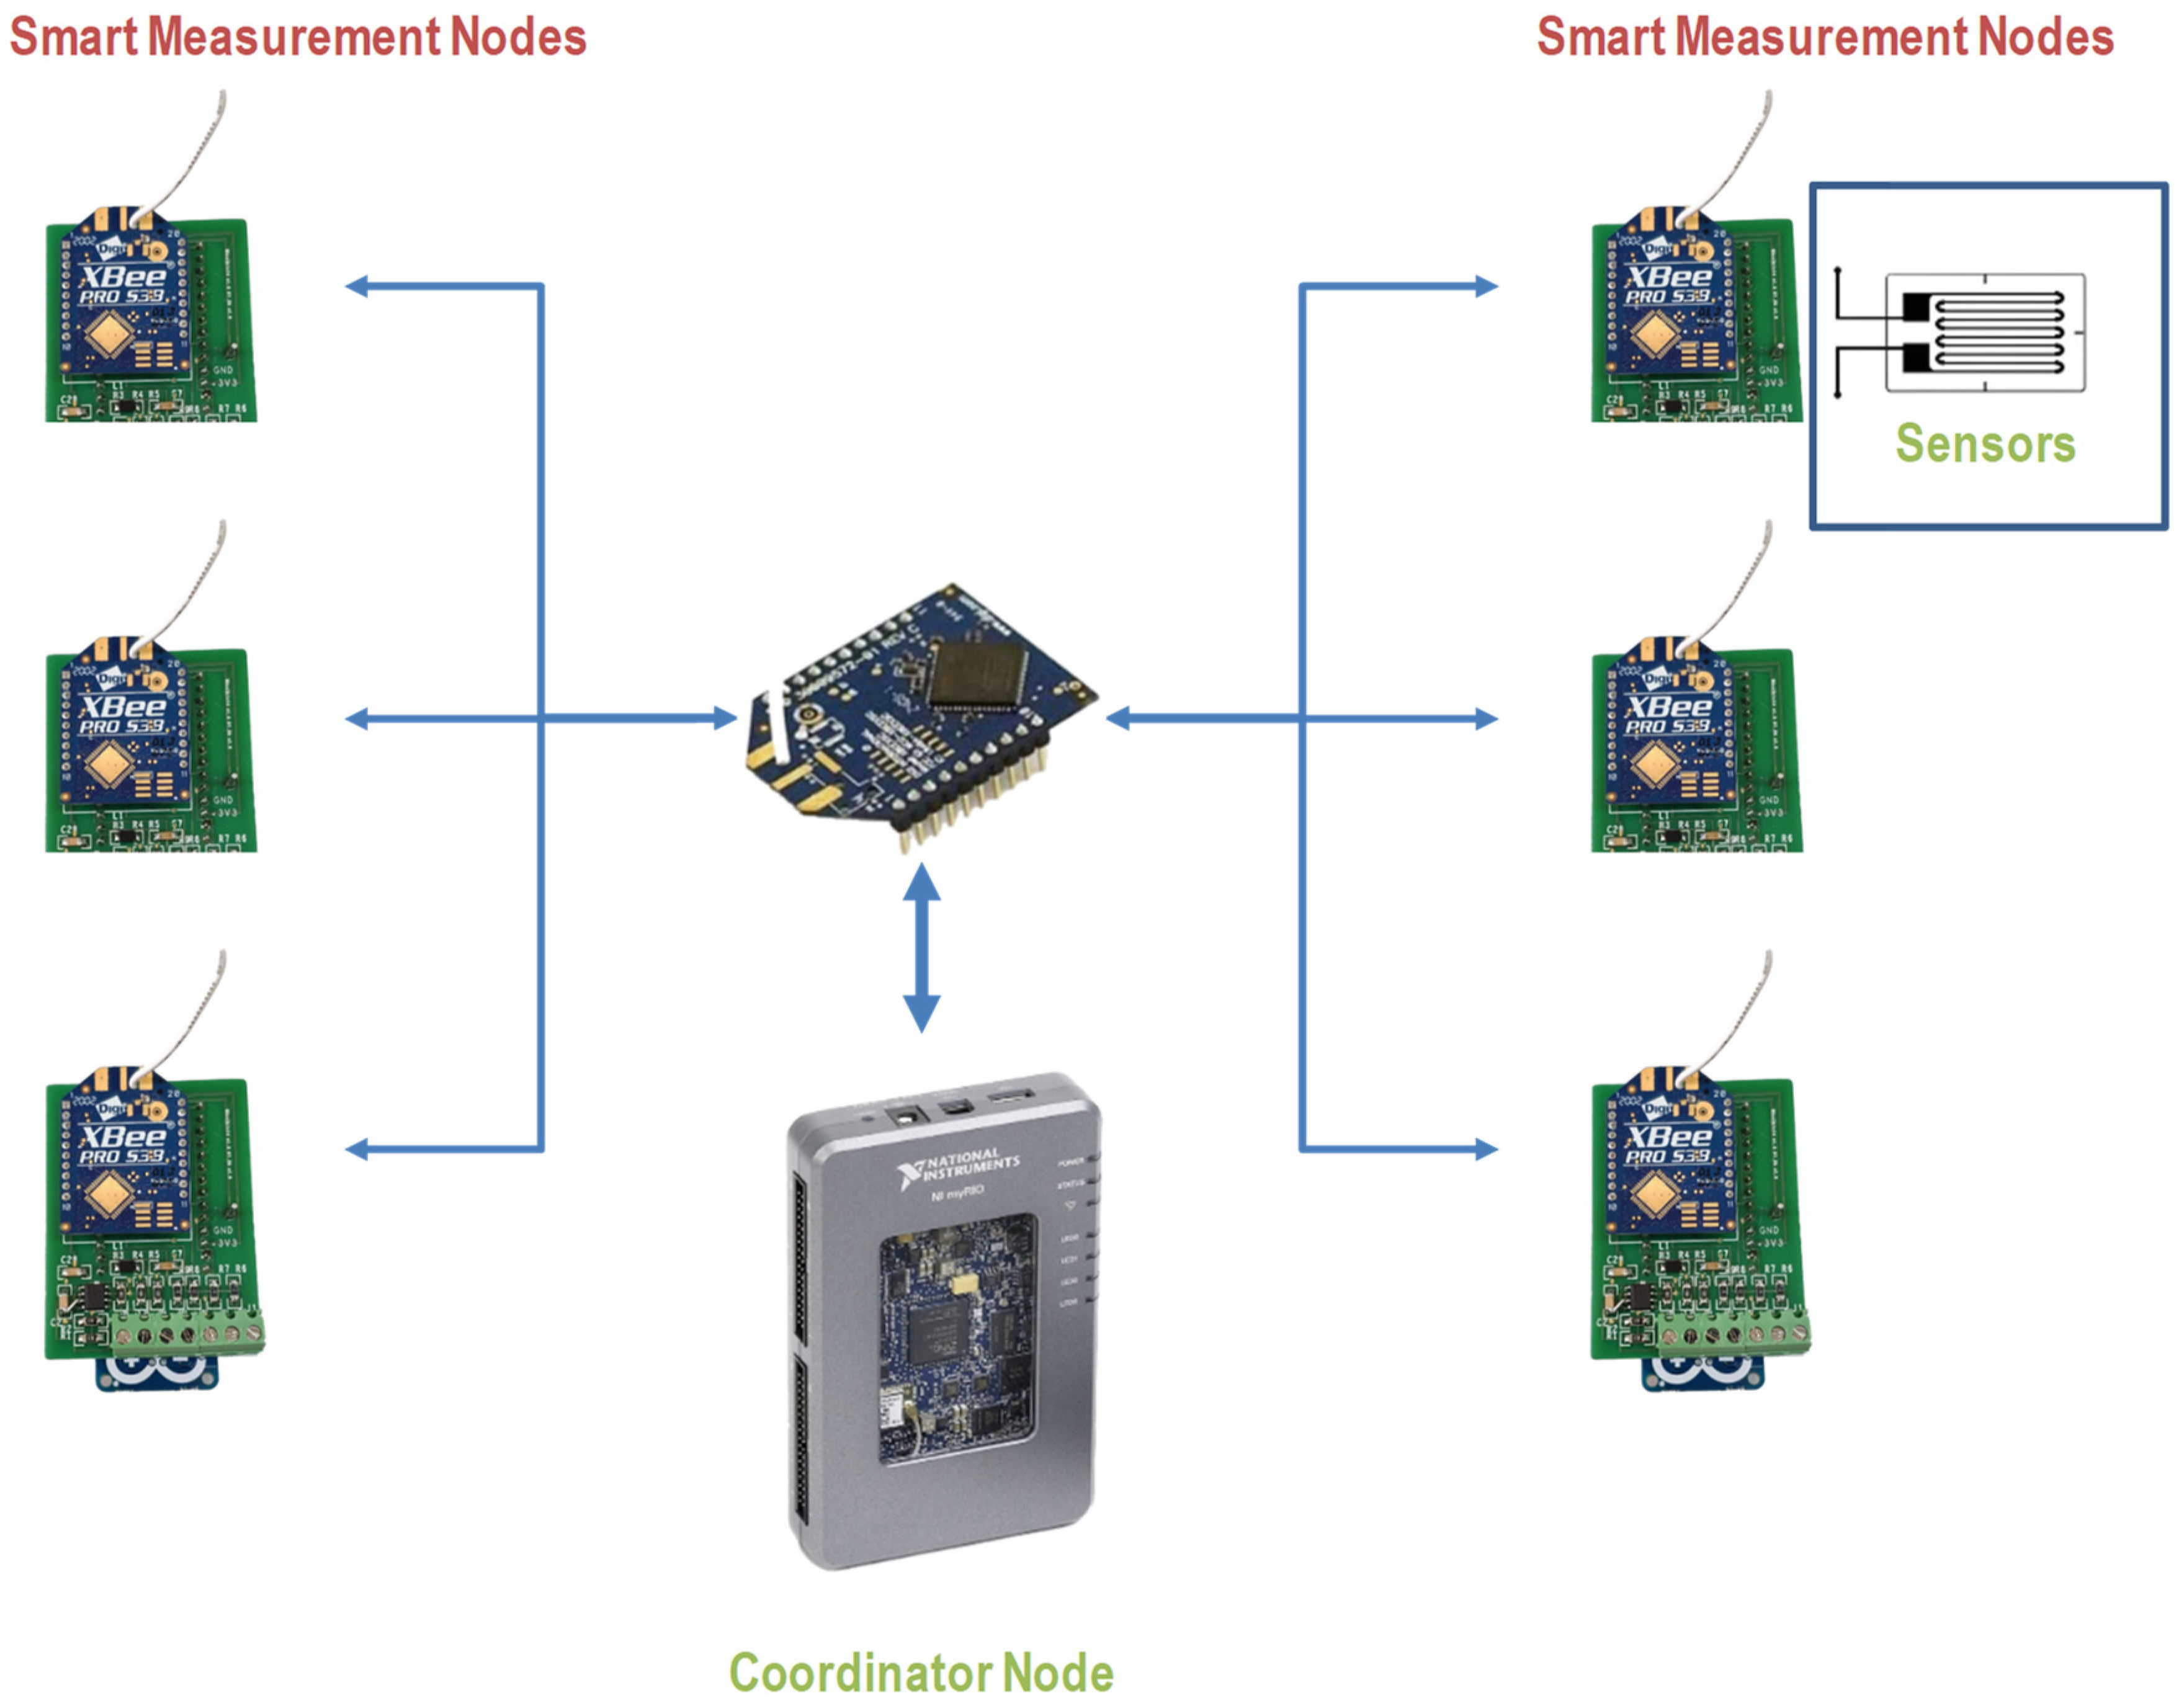
This subsection describes the architecture proposed for the monitoring system (see Figure 1). It is implemented by means of a star topology, since it allows scheduling the communication traffic of the system in a more deterministic way. Two kinds of nodes are used: The Coordinator Node (CN), at the core of the star topology, which centralizes all operations of the monitoring system. It holds the transaction clock, and it is responsible for storing the values of the remote sensors. This node manages the wireless communication with the Smart Measuring Nodes (SMN), according to a schedule that fulfils the time requirements of the planned system. The Smart Measuring Nodes are responsible for acquiring the values of the process sensors and providing the network connectivity with the Coordinator Node. A prototype for the Smart Measuring Nodes was specifically designed for easing the connectivity of the sensors located remotely. The designed module allows the acquisition of up to four analog sensors per node.
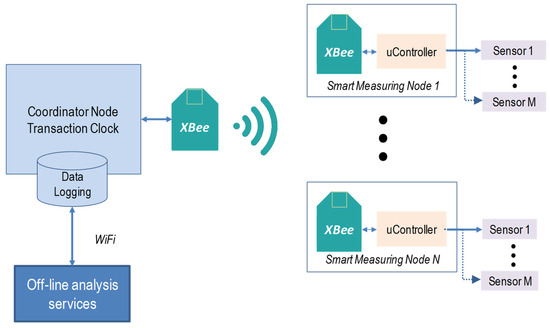
Figure 1.
General architecture overview for the wireless monitoring system.
XBee wireless technology, which is based on the IEEE 802.15.4 standard, was chosen to connect the Coordinator Node to the Smart Measuring Nodes. This technology was chosen, for several reasons: (1) It is a well-proven, robust and low-cost technology; (2) it is a technology able to operate outside the 2.4 GHz band (namely, at the 900 MHz band), so that interferences with WiFi technology may be avoided; (3) it provides low jitter, so that the required sampling frequencies of the monitoring system may be achieved; (4) it is a very flexible technology that may be configured for different topologies and scenarios. Even though XBee technology is typically used at noncritical applications, it is highly configurable. For this work, a configuration was selected which fulfils the QoS requirements of the monitoring system. In particular, the XBee 900HP antennas were chosen since they operate at the 900 MHz band, providing a communication channel without interferences with WiFi technology. In addition, they allow selecting the transmission signal power at different levels in order to adapt the quality of the signal to different scenarios.
The Coordinator Node is the key component of the architecture, since it holds the transaction clock and manages the network messages with all Smart Measuring Nodes, which are responsible for acquiring the values of the sensors next to the process. Moreover, critical applications may require a combination of wired and wireless connections, acquiring specific sensors to be acquired by means of wired connections, whereas other sensors can be acquired by wireless means. In this scenario, it is necessary to select a platform for the Coordinator Node that fulfils all the following requirements:
- 1.
- Industrial usage and acceptation, since it may be used in industrial scenarios and applications.
- 2.
- Real-time embedded platform, since the Coordinator Node requires a precise clock for centralizing wireless communications with Smart Measuring Nodes and a real-time programming capabilities.
- 3.
- Scalable platform that allows to implement hybrid (i.e., by means of wired and wireless links) connectivity with the sensor devices.
3.2. Logical TDMA Protocol over XBee
XBee modules implement the CSMA/CA as medium-access control (MAC) mechanism. Unfortunately, this method is not suitable for deterministic applications since it is difficult to schedule the network traffic. In addition, WiFi, as well as most wireless sensor networks, operates at the 2.4 GHz band, which may generate uncoordinated traffic, which may create additional problems to ensure determinism. For these reasons, XBee 2.4 GHz modules are not frequently used in critical applications.
In industrial scenarios, this problem may be circumvented by avoiding the 2.4 GHz band, so that critical applications may use less crowded spectrum bands so that wireless traffic may be more easily scheduled. This approach could improve the behavior of deterministic applications. For this work, XBee modules able to work in the 900 MHz band were selected, but this approach is also valid for other spectrum bands such as the 868 MHz band.
In addition, the authors designed a new protocol aimed at providing higher determinism while improving the QoS of the wireless applications. This new protocol implements, at a logical level, the time-slotted TDMA medium-access control approach. Thus, the schedulability of the applications may be achieved, assuming that uncoordinated traffic is going to be reduced due to the use of the less crowded 900 MHz band. This approach guarantees a certain degree of QoS, even though technologies not specifically designed for critical applications, such as XBee, are used.
It is assumed that time is centralized in one node, the Coordinator Node. The proposed protocol allows the following operations:
- Broadcast measurement command: The Coordinator Node sends broadcast messages to all available Smart Measuring Nodes. These messages are received by all devices at the same time to read the values of the configured sensors.
- Unicast measurement command: The Coordinator Node sends one unicast message to a specific Smart Measuring Node. These kinds of messages may expand the use of the protocol and make it more flexible.
- Distributed values collection command: Smart Measuring Nodes send the values of the connected sensors to the Coordinator Node, which is responsible for collecting the data.
- Remote configuration: The configuration of the system is centralized at the Coordinator Node which is responsible for sending the configuration messages to the Smart Measuring Nodes before the operation. Thus, by keeping the configuration centralized, the system may be more easily reconfigured for different scenarios.
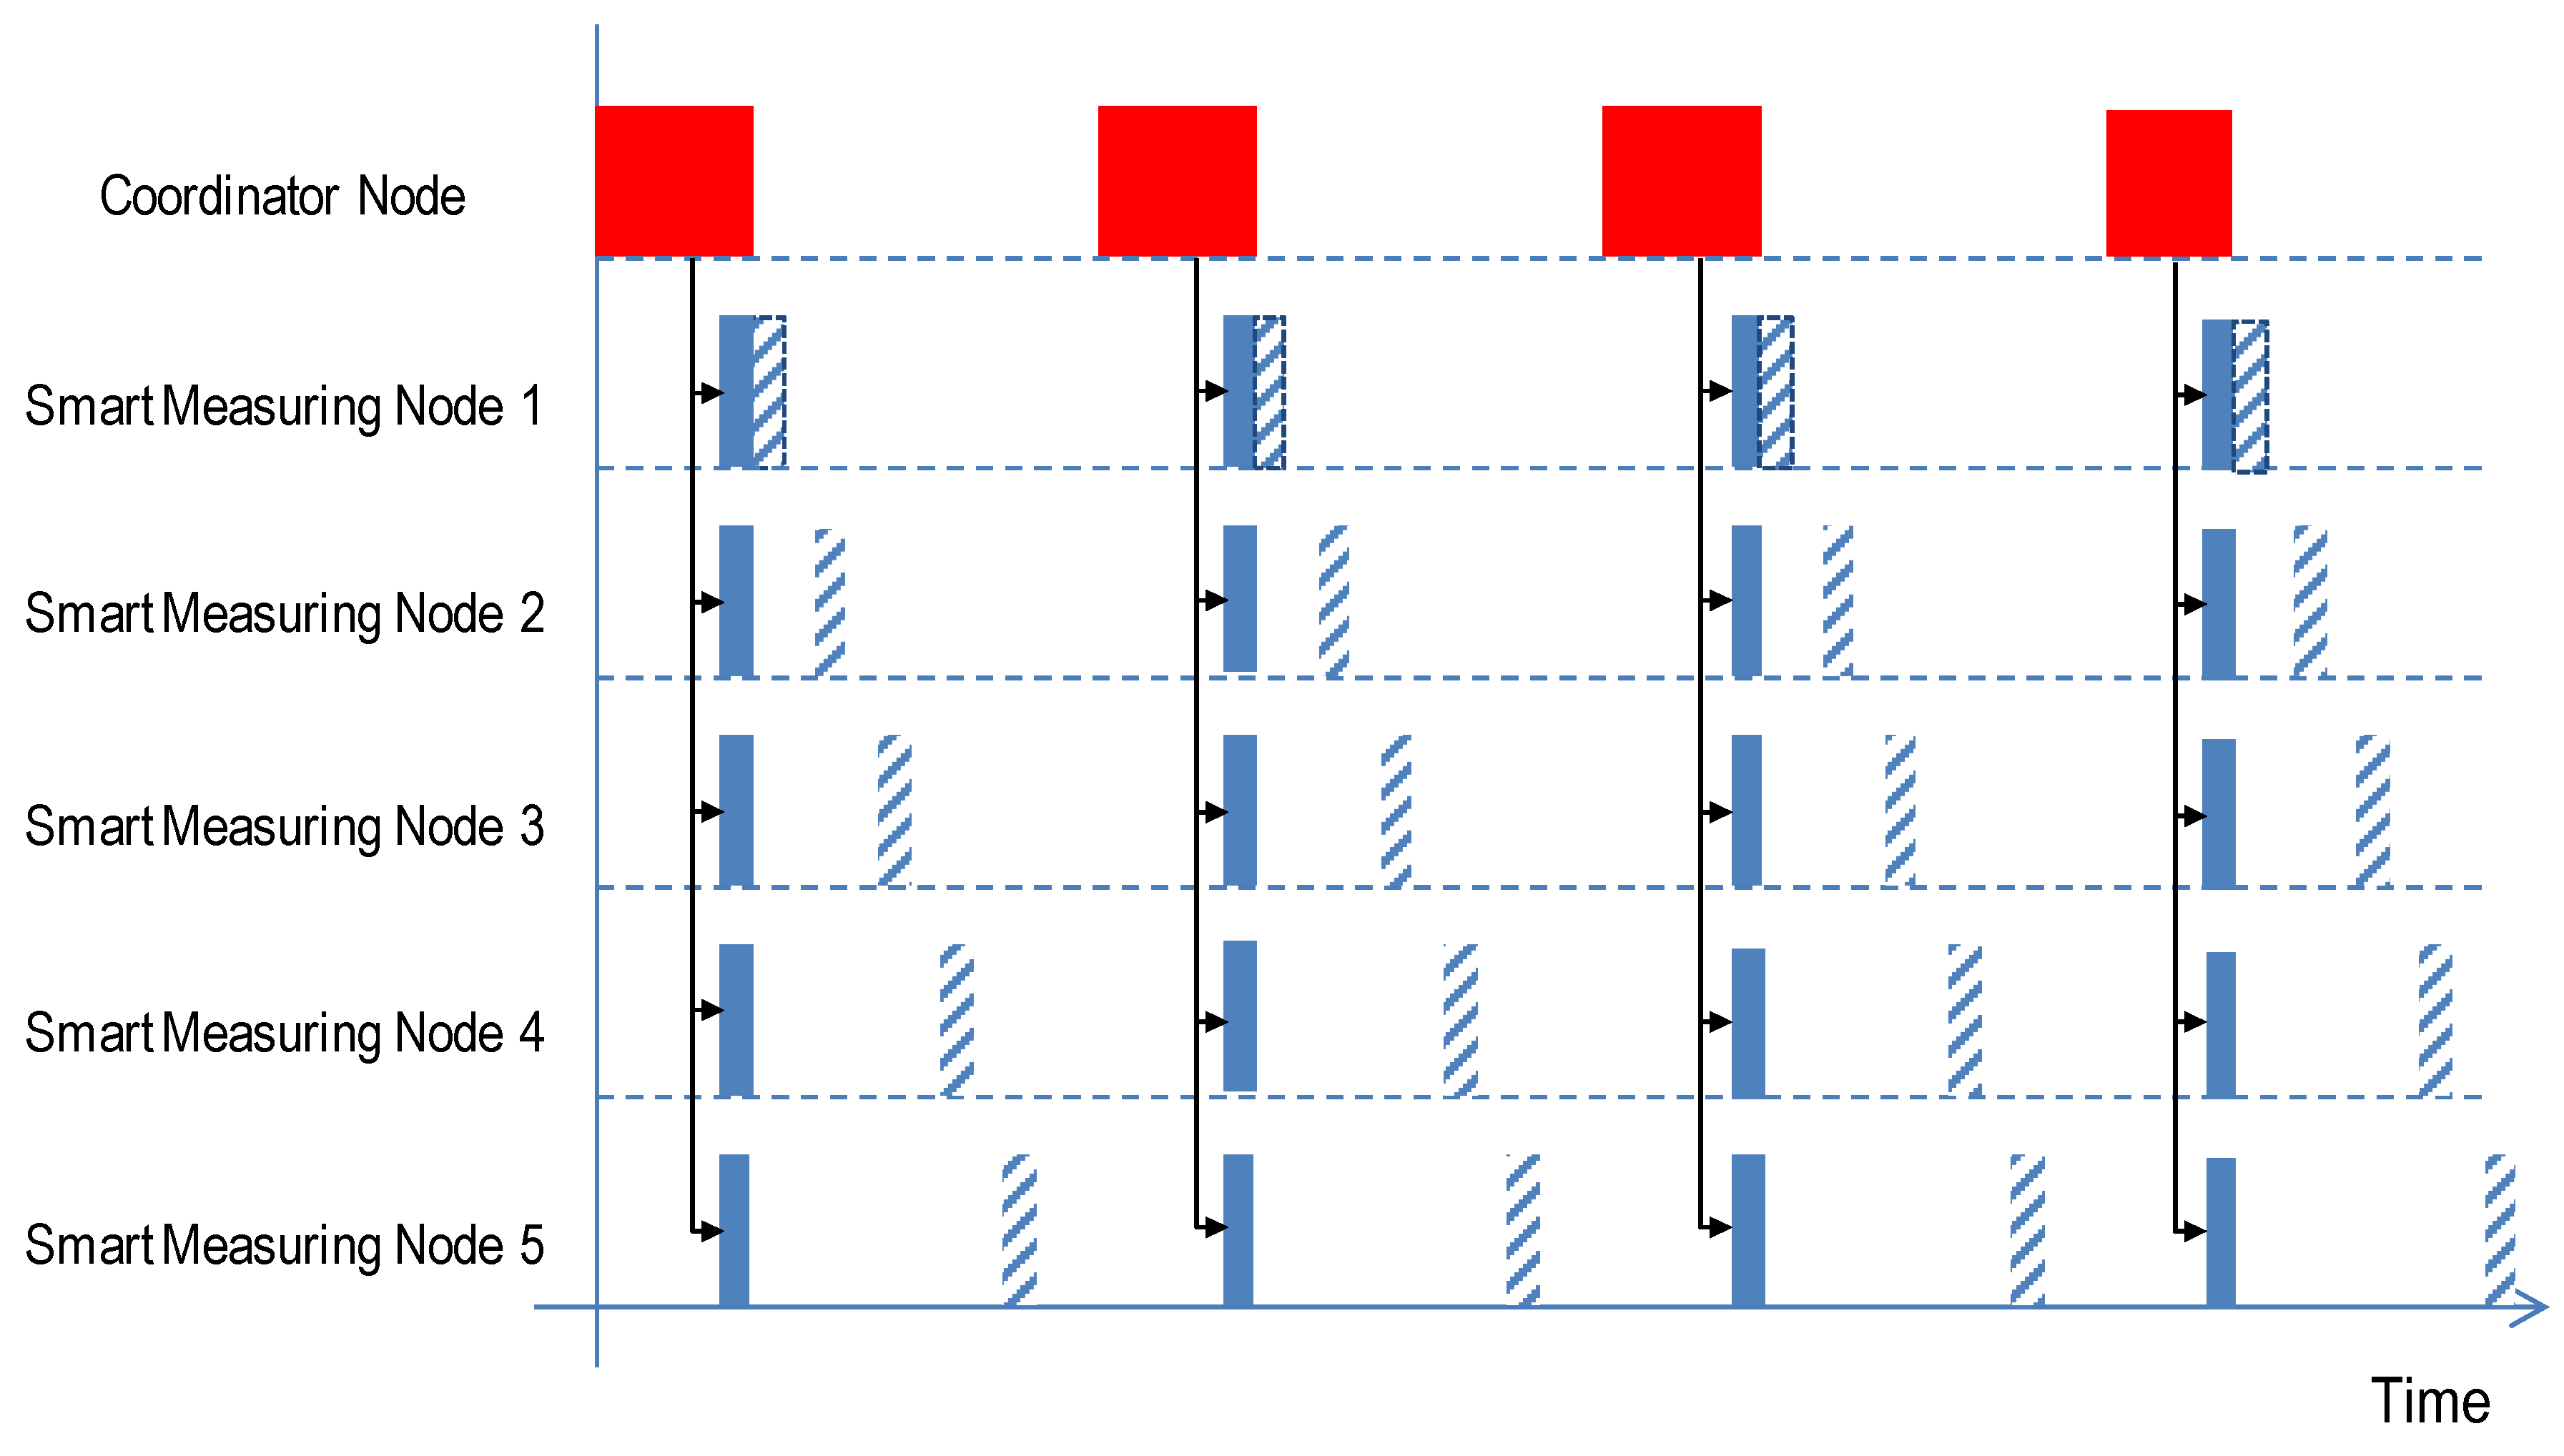
Figure 2 illustrates the behavior of the protocol for the distributed acquisition. The Coordinator Node delivers broadcast measurement orders in a timely manner, according to the scheduled plan. These messages are received at the same time at all Smart Measuring Nodes with very low jitter, as proven later. On the reception of the messages, they sample the values of the connected sensors, according to the selected configuration. The use of different time offsets at every device for sending the messages improves the determinism of the protocol since only one device is able to access the medium in a specific time instant. In this way, the medium access is scheduled at a logical level from the applications, bypassing the behavior of the XBee modules. These offsets are issued separately to every smart device node at the configuration stage, by means of specific messages. Figure 2 shows the processing at the nodes and the messages (arrows) among them at distributed measuring operation. Remote configuration messages are also used for specifying other issues such as the identification of the nodes, the number of connected sensors, the number of samples taken at every measurement command and the sampling time among them.
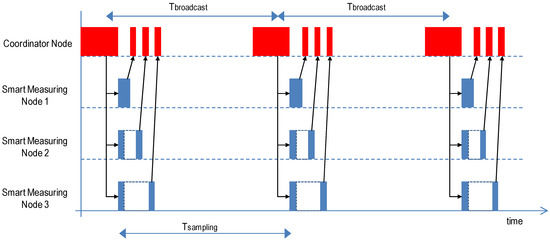
Figure 2.
Chronogram for simple sampling distributed monitoring operation. Processing of the nodes and exchanged messages.
XBee modules can be programmed in two operation modes, AT and API, but only the second mode is flexible enough to implement the proposed protocol aimed at monitoring applications. API mode allows for a deeper manipulation of the frames. However, it requires programming at a deeper level so that programs access the information of the frames. Basically, the API operation mode defines four blocks: (1) start delimiter, 0x7E; (2) length of the frame, 2 bytes; (3) API-specific structure, which is the core of the designed protocol and contains several bytes according to the functionality of the protocol, 14 bytes in Figure 2 (from byte 4 to byte 17); and (4) checksum, which is used for error control purpose, 1 byte. Designed frames are serialized to the XBee modules, which are responsible for the transmission.
The functionality of the protocol is implemented by means of four different types of frames.
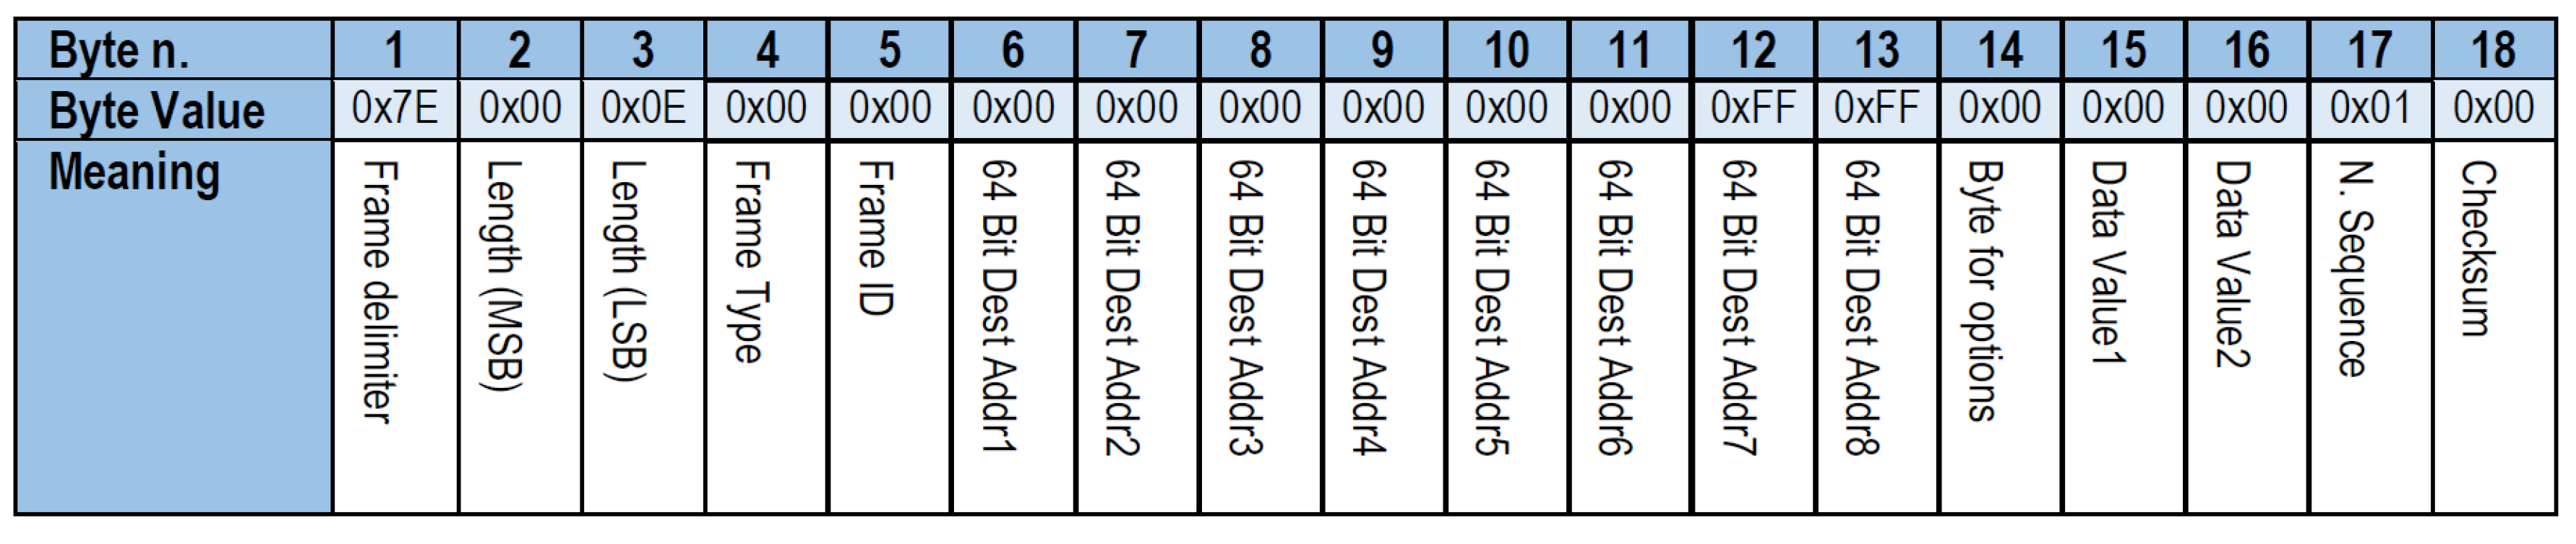
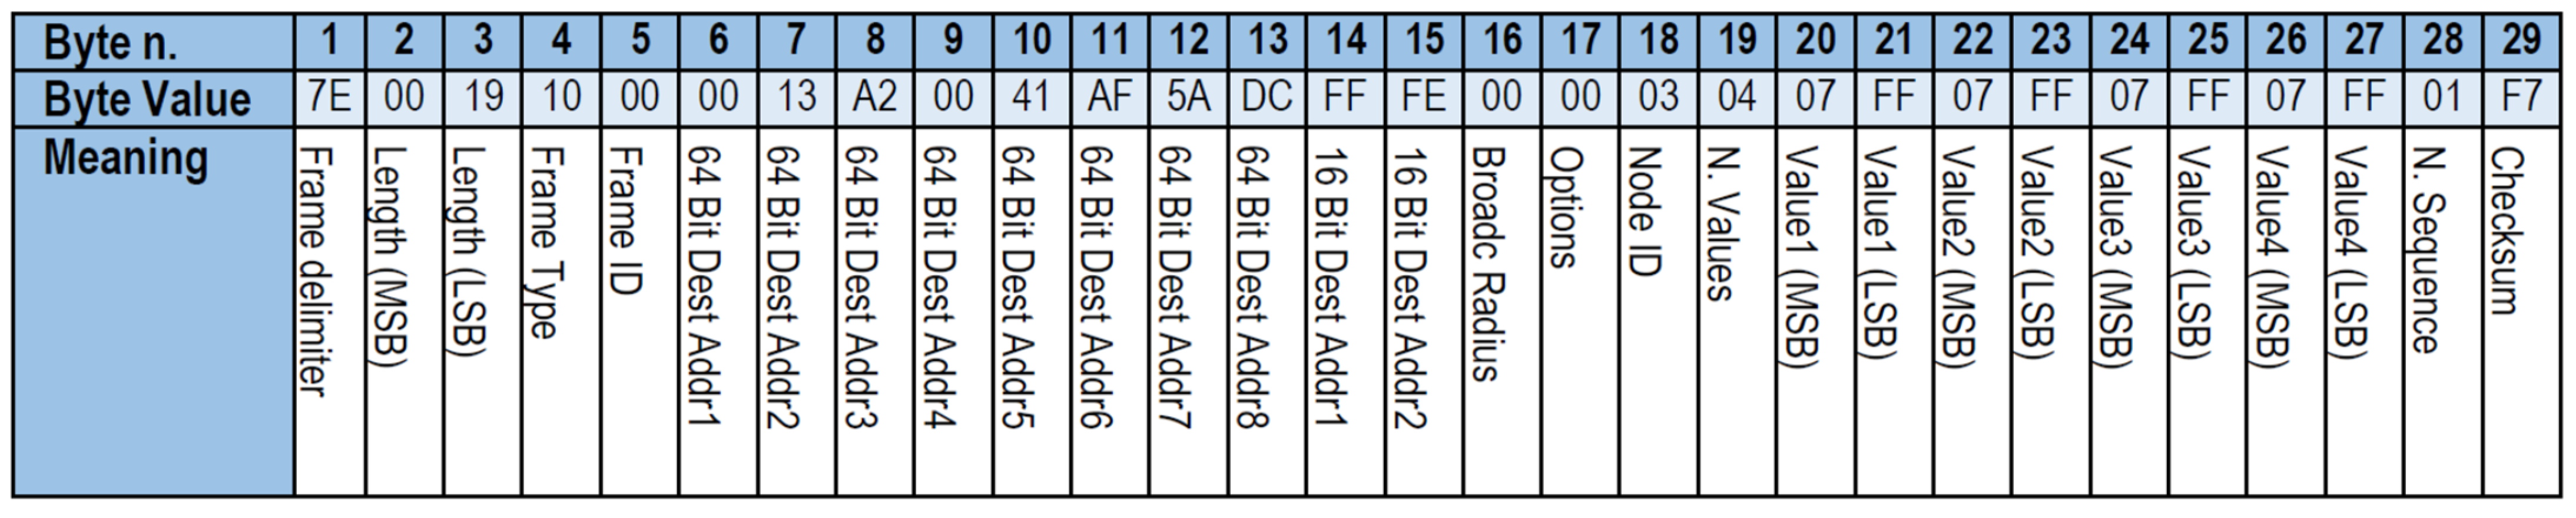
Figure 3 shows a broadcast measurement command frame sent from the Coordinator Node to the Smart Measuring Nodes, as shown in Figure 2. This frame is used by the Coordinator Node to request the XBee module to broadcast a measuring order to all remote nodes. When the Smart Measuring Nodes are in measuring operation, this order triggers the process of reading the sensors and sending the values to the Coordinator Node. The whole frame accounts for 18 bytes, but the length of the frame field only considers the size of the API-specific structure. For this reason, it shows a length of 0x000E bytes (14 bytes). Next, the most relevant fields are described. The 0x000000FF value is used as the broadcast destination address (64 bits) in XBee. The broadcast measurement order is identified at the DataValue1 and DataValue2 fields with 0x00 and 0x00 values, respectively. Every frame carries the Number of Sequence which is used at the Smart Measuring Nodes to identify whether any frame was lost. In addition, every frame carries the checksum to detect transmission errors.
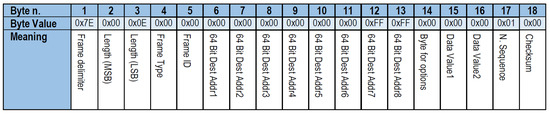
Figure 3.
Broadcast command frame sent from the Coordinator Node to the Smart Measuring Nodes.
Sometimes, it may be necessary to send a frame to a specific Smart Measuring Node. This just requires setting the specific destination address of one XBee module (e.g., 0x0013A200 41AF5A69). Thus, the same frame can be used for Unicast measurement command operations, just by changing the destination address.
Figure 4 shows the structure of the frame sent from one Smart Measuring Node to the Coordinator Node. It represents an example of frame issued by a node with identifier 0x03 for delivering back to the Coordinator Node the acquired values. This frame is created by the device microcontroller and serialized for transmission to the attached XBee module. Most relevant fields include the destination address of the XBee module attached to the Coordinator Node (e.g., 0x0013A20041AF5ADC); the identifier of the Smart Measuring Node (NodeId), 0x03; the number of values sent; in Figure 4, four sensors were connected to the board, 0x04; the actual value sent for all four sensors, 0x07FF; the sequence number, 0x01 and finally the checksum for error detection. This frame allows for a maximum number of 255 nodes. Since two bytes are used for transmitting the values read from the sensors, a resolution of up to 16 bits is allowed, which should be enough for most industrial systems. The size of the frame may change depending on the number of values carried in the frame. This number depends on the configuration of the system. In addition, the format of the frames allows for different configurations. This permits sending values read simultaneously from different sensors at the board, the so-called simple sampling or sending values read from the sensors at different time instants, the so-called multiple sampling. The parameters that describe this behavior are determined at the configuration stage.
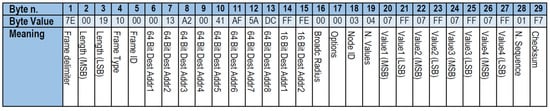
Figure 4.
Frame used by the microcontroller at the Smart Measuring Nodes to send the values acquired from the sensors.
Configuration frames are issued at the configuration stage, at start-up time. In this stage, the Coordinator Node sends the configuration to every Smart Measuring Node accordingly. Once Smart Measuring Nodes are configured, they enter into the measuring operation stage as configured. Currently, the systems executes a static plan which must be designed before starting up the system, and it is not possible to change it in real-time. Although this feature may be implemented in the future, the authors believe that this approach may be suitable for a large number of industrial applications.
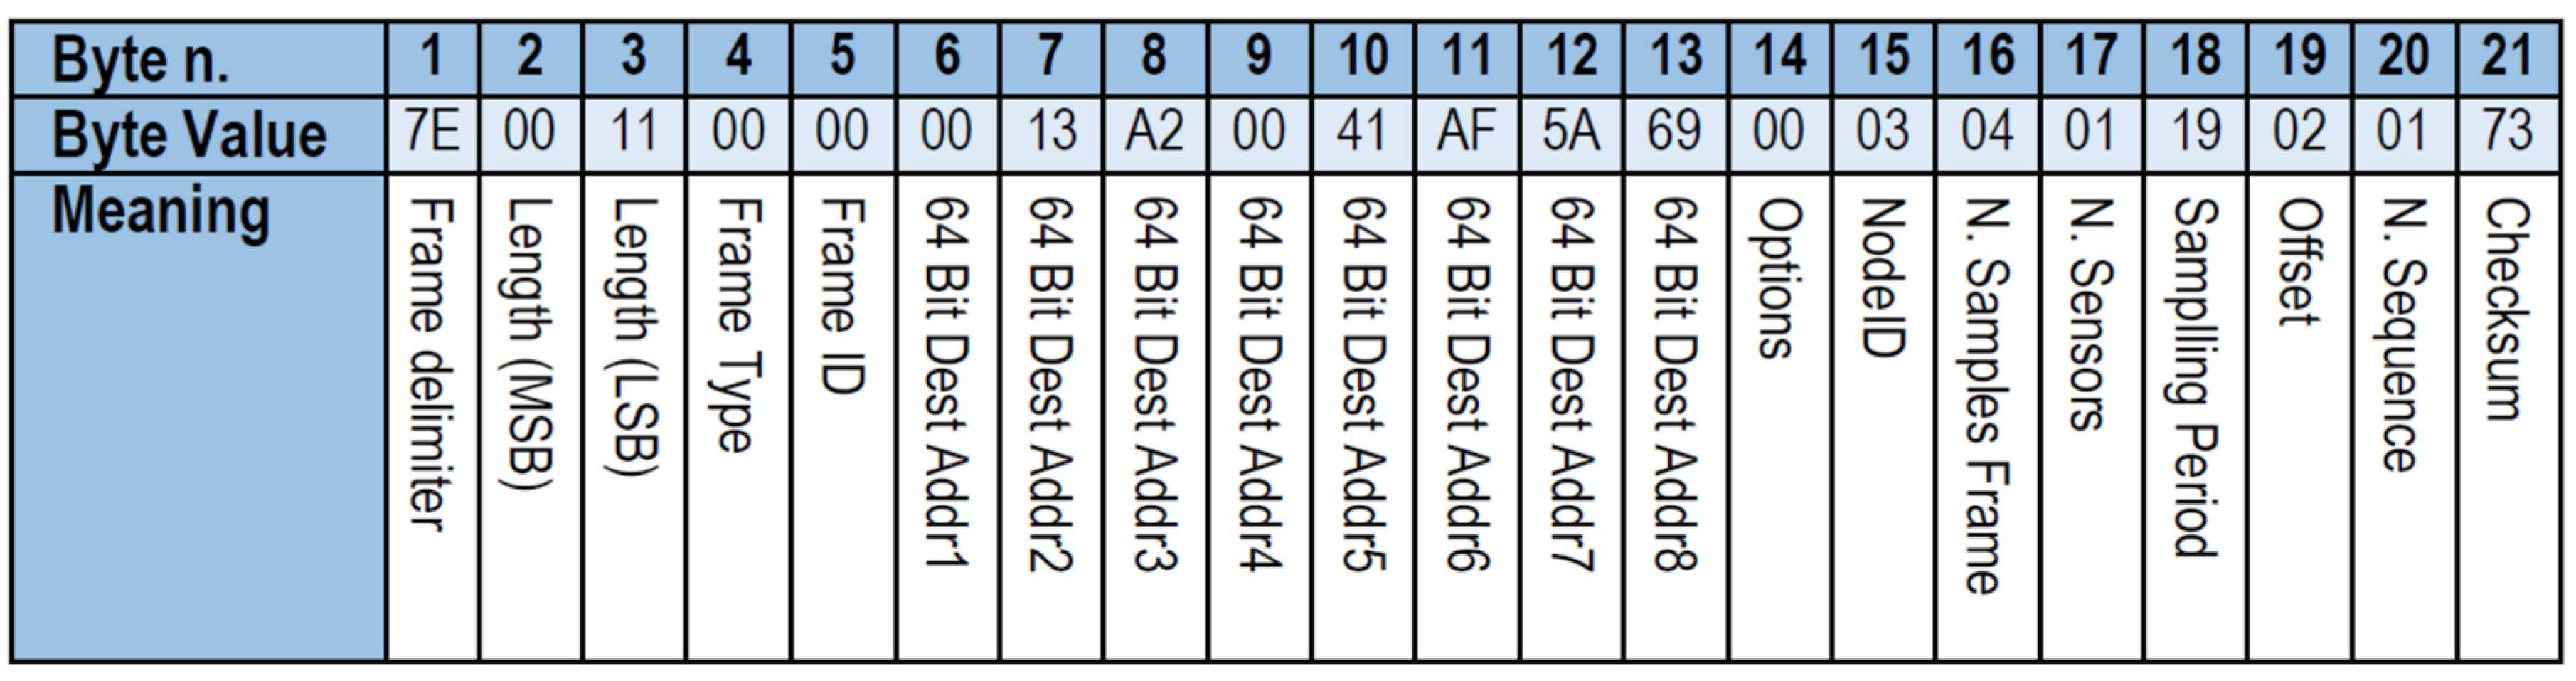
Figure 5 shows the structure of a configuration frame with one example. This frame allows for different configurations at the nodes. Configuration frames are issued to the devices attached to the destination address specified in the frame, (0x0013A20041AF5A69 in Figure 5). The frame sets the NodeId to the device, 0x03. The configuration allows simple sampling and multiple sampling, which consist on taking several samples after the reception of one measurement order. Several parameters are related to this feature. For example, in Figure 5, four samples are taken per frame, N.SamplesFrame, and only one sensor of the board is used, N.Sensors. The sampling period used between measurement messages in this case is 25 ms, SamplingPeriod [ms] = 0x19. The offset defines the time interval that the smart node must wait from the reception of the command to its transmission. Several slots are defined for the offset. Finally, the checksum is used to detect transmission errors.
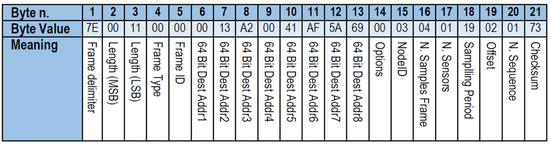
Figure 5.
Configuration frame sent by the Coordinator Node to one Smart Measuring Node.
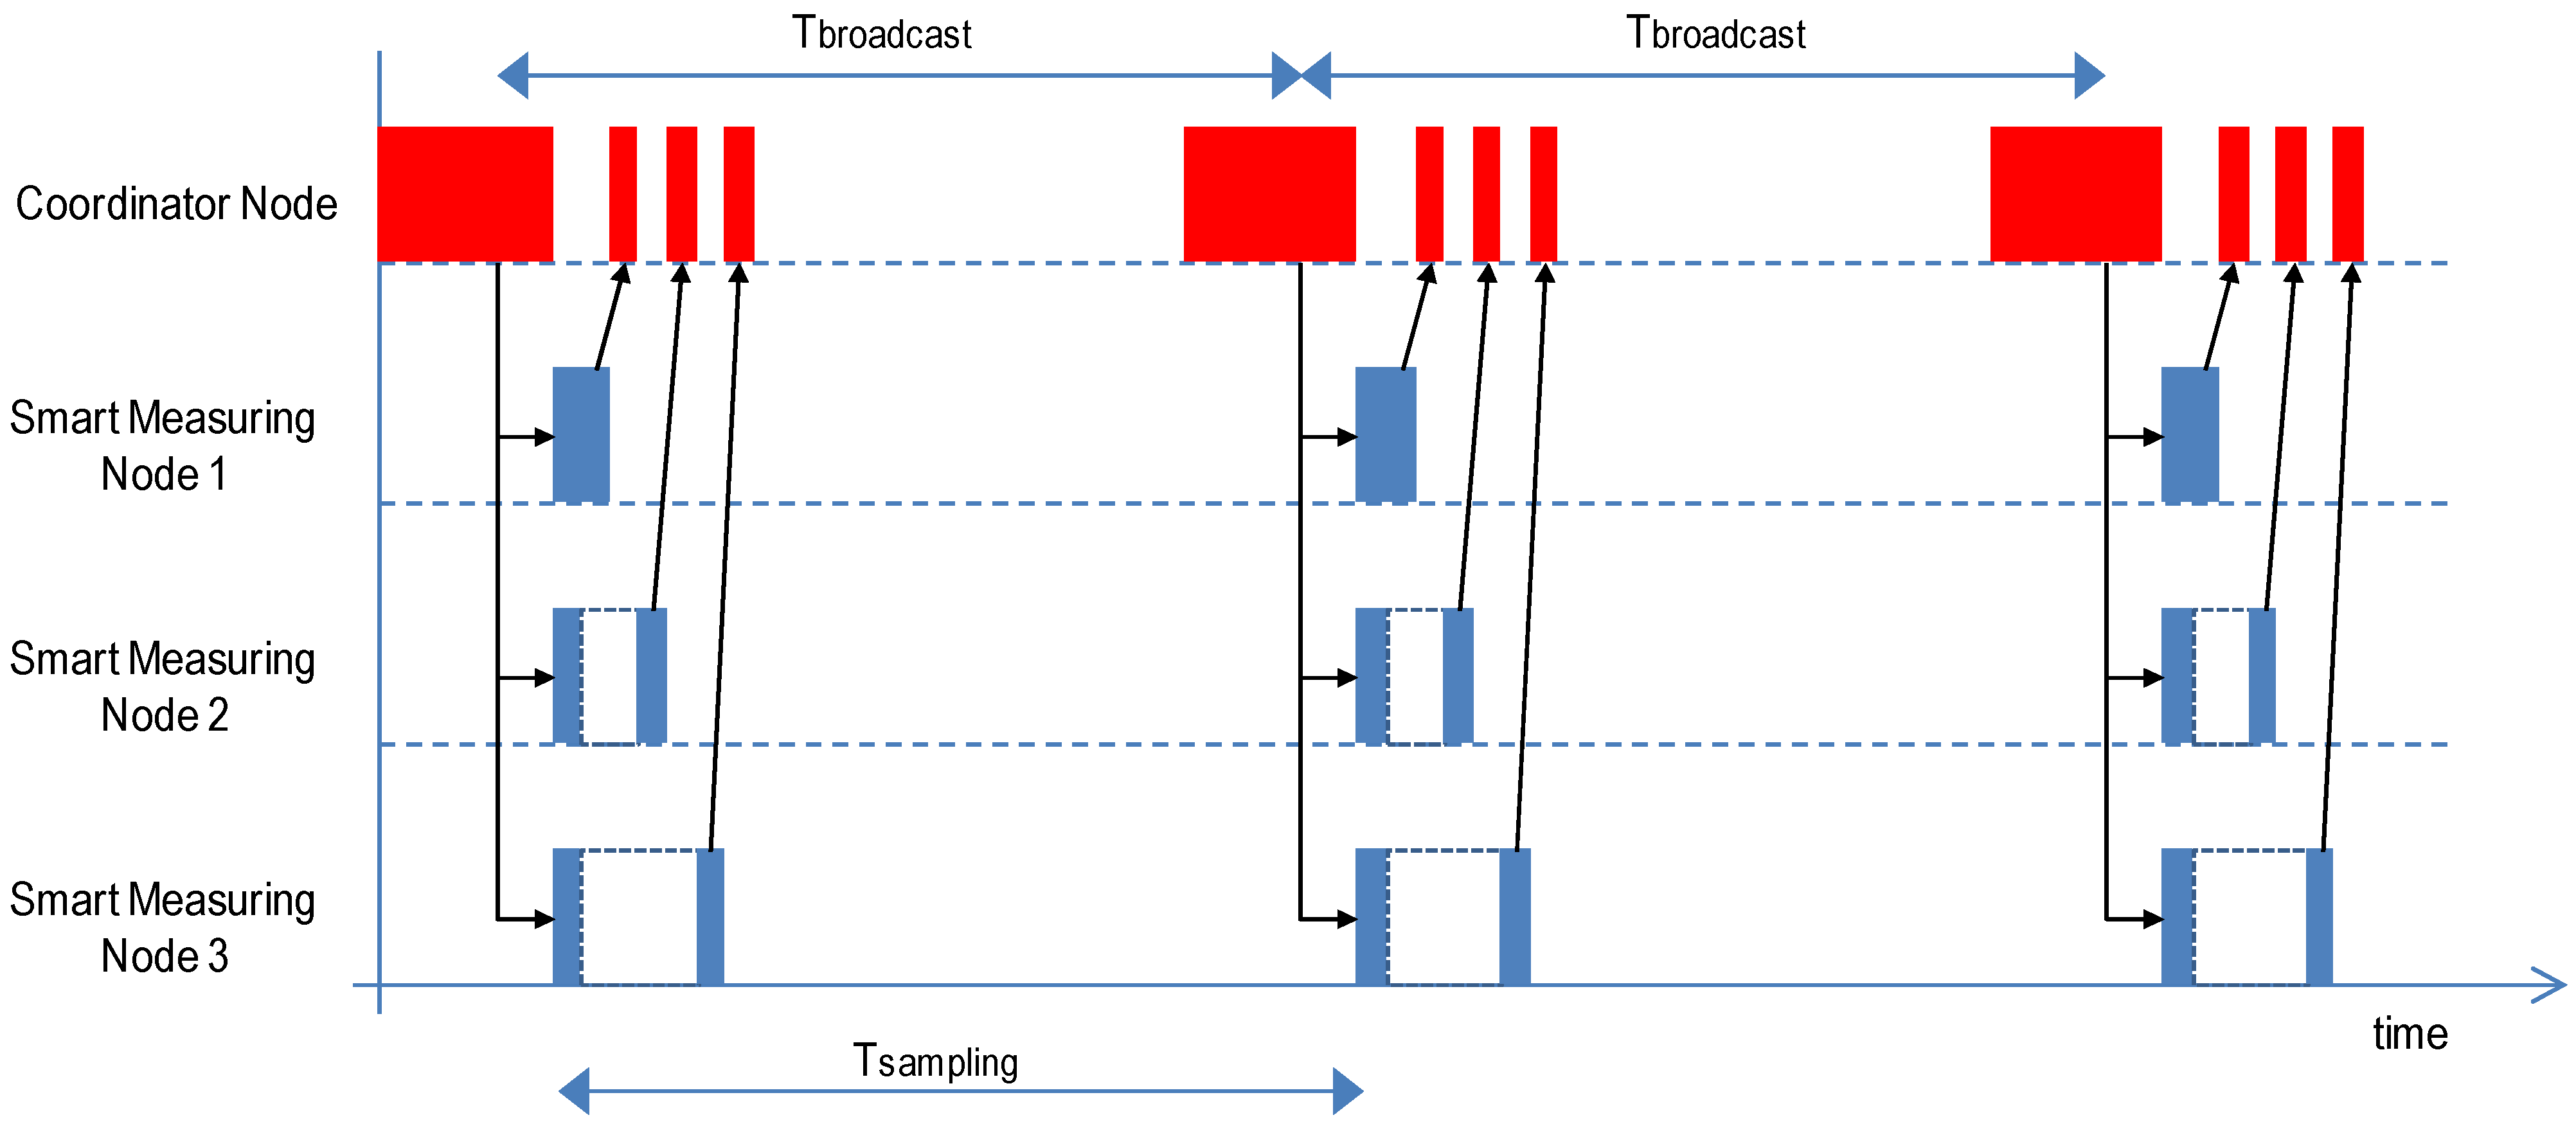
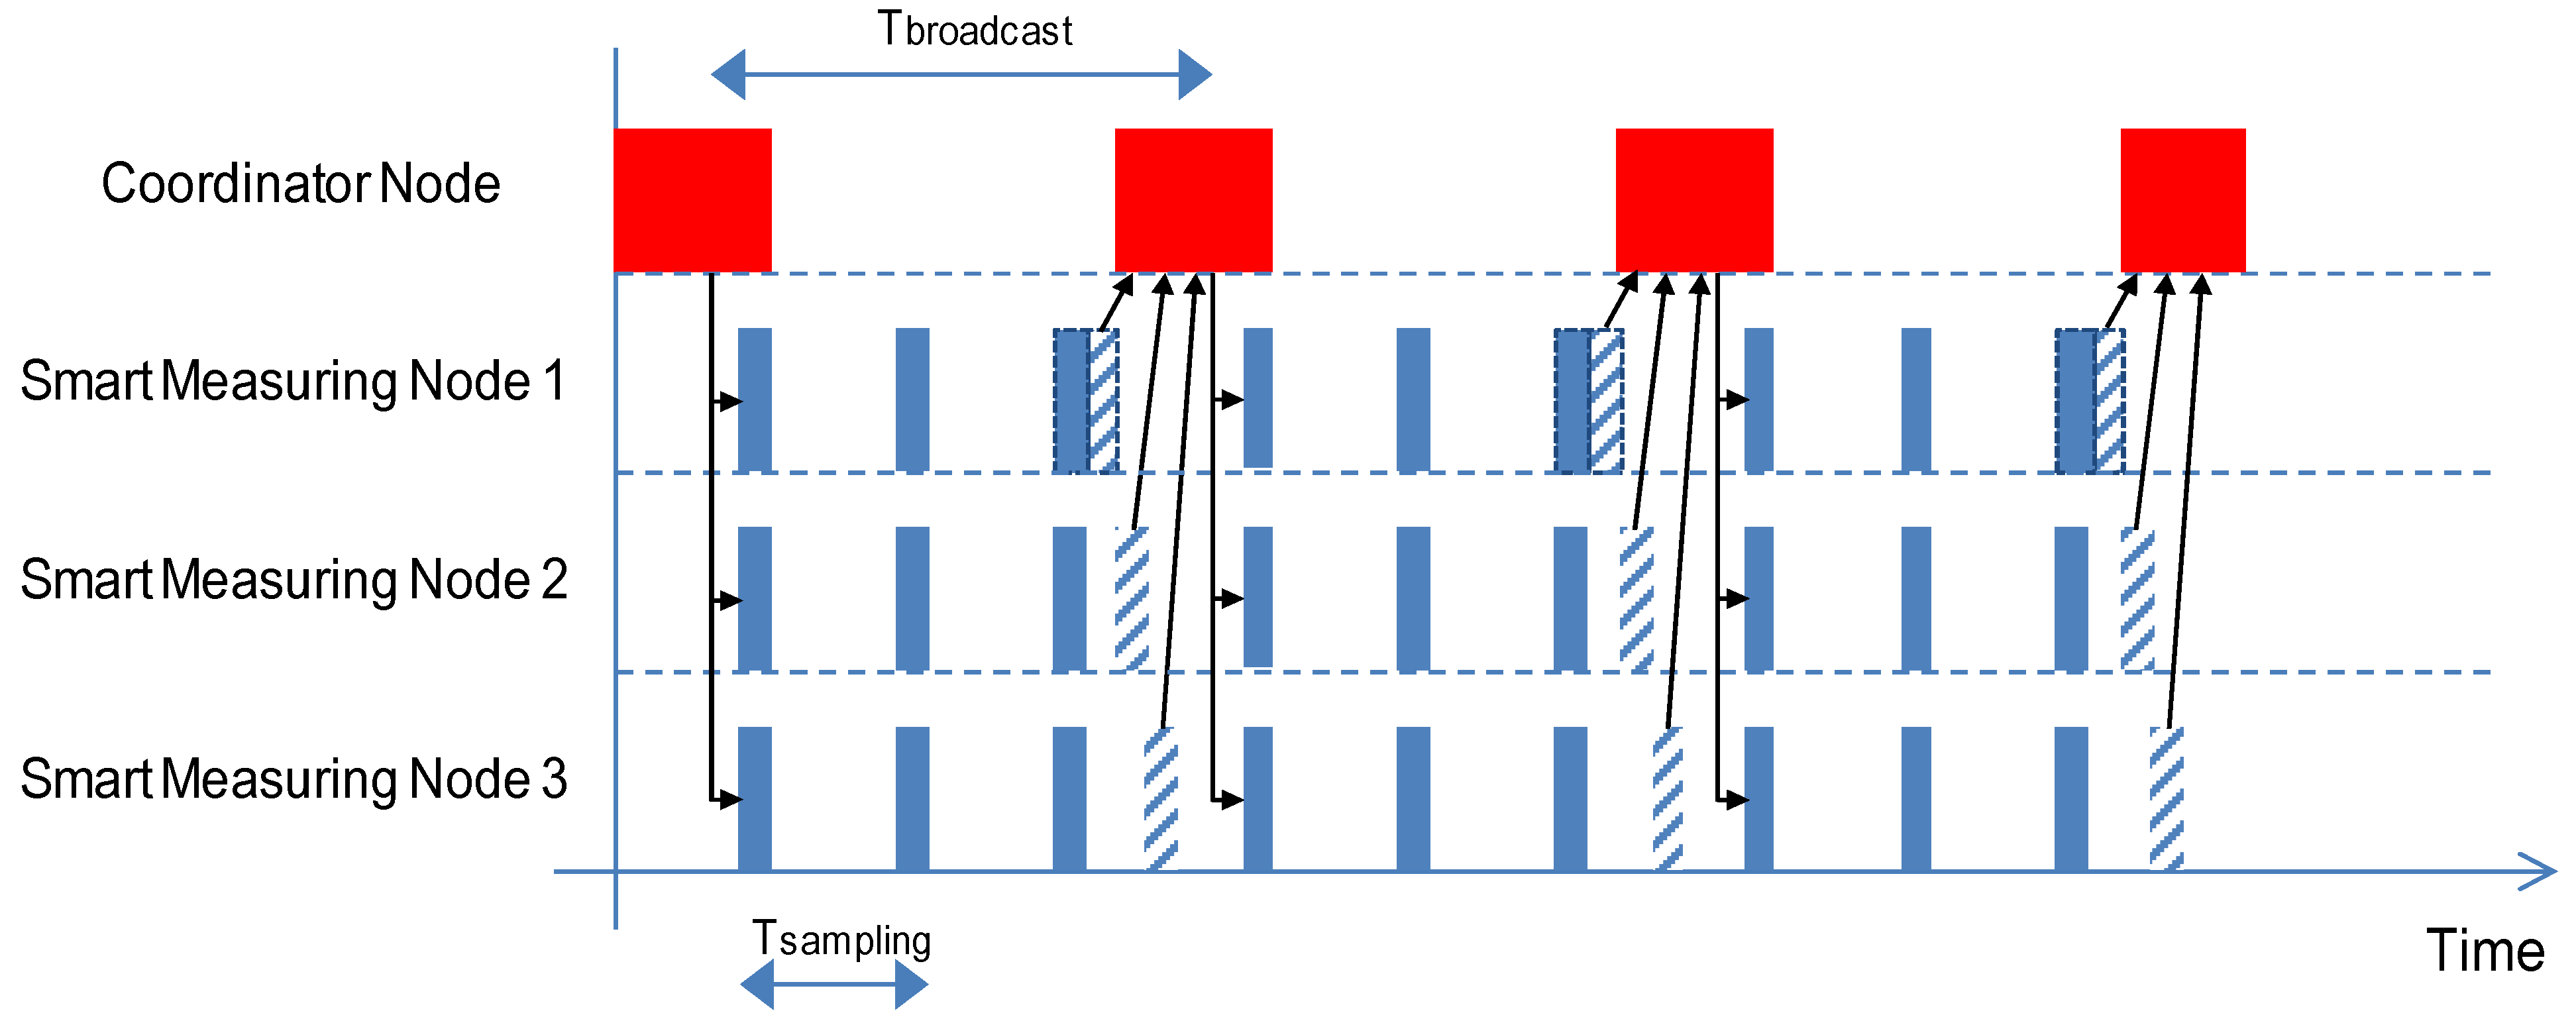
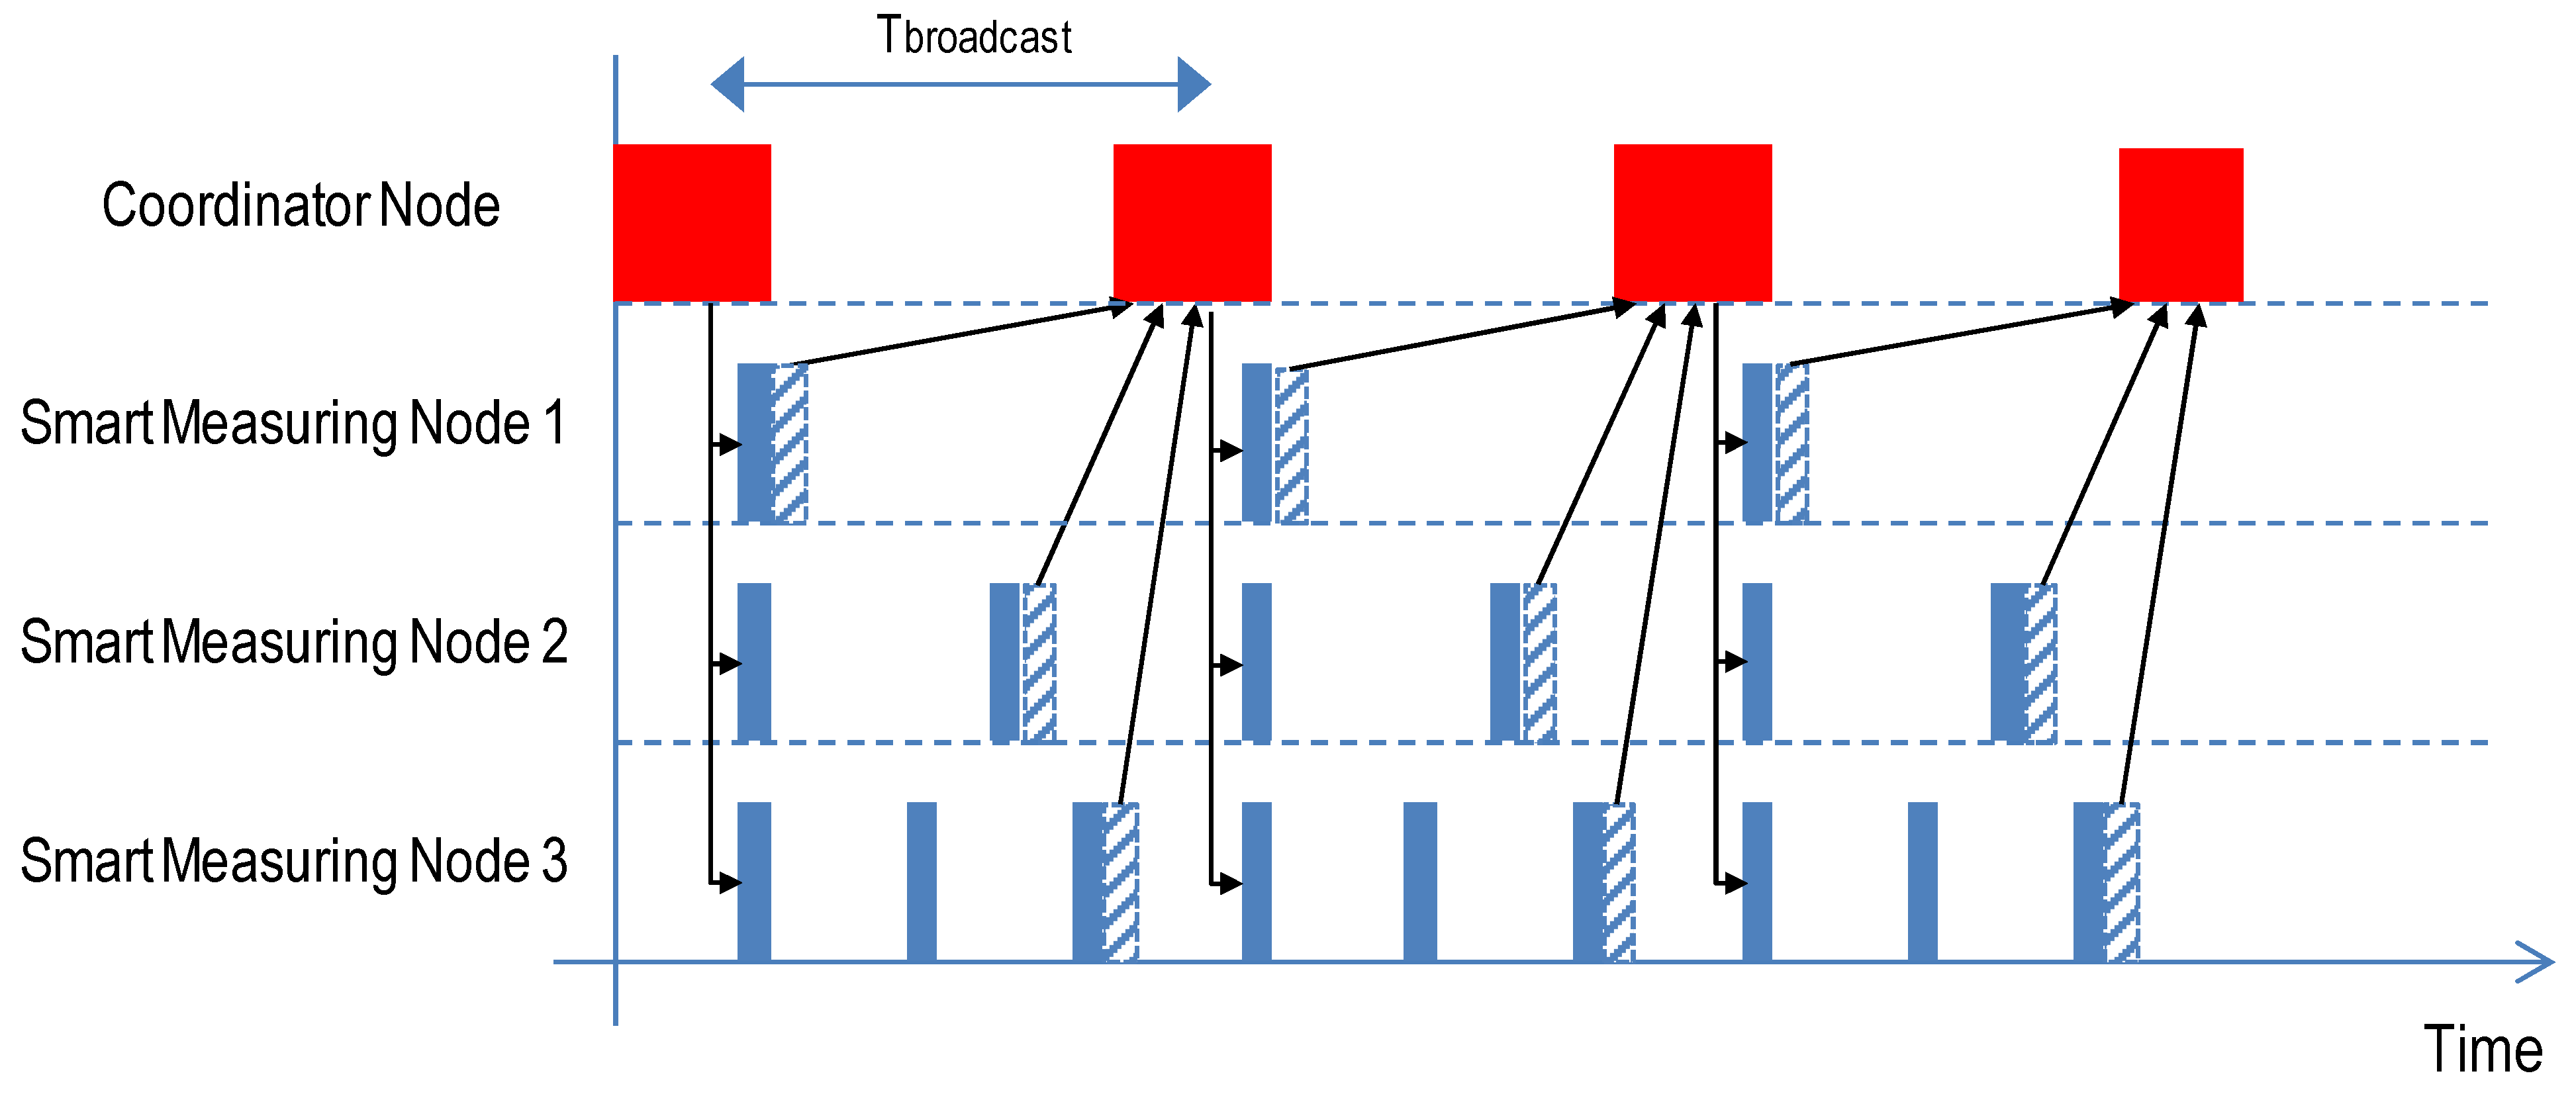
Figure 6 shows the behavior of the system when nodes are configured for multiple sampling operations. It can be appreciated that the monitoring system behaves differently to Figure 2. In this configuration, when Smart Measuring Nodes receive a broadcast measuring order, it is their responsibility to sample at the required sampling frequency until a new broadcast measuring command is delivered by the Coordinator Node. This information is set up at the configuration stage, by means of the N.SamplesFrame and SamplingPeriod parameters sent in the frame of Figure 5. The offset indicates how much time the smart measuring node must hold the frame before sending it to the Coordinator Node. In this frame, an offset value of 0x02 means that it must wait two time slots to send the data collected. Thus, determinism is ensured since other devices, e.g., Smart Measuring Node 1 and Smart Measuring Node 2, may send the frames at offset = 1 and offset = 2, respectively. This configuration is repeated every time that Smart Measuring Nodes receive a broadcast measurement command, which is issued periodically according to the plan scheduled at the Coordinator Node.
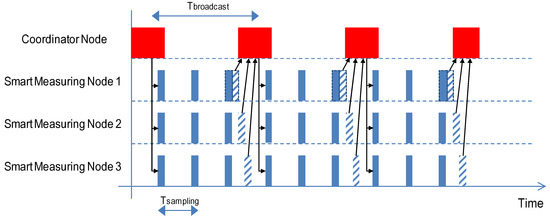
Figure 6.
Chronogram for distributed monitoring operation. Processing of the nodes and exchanged messages when multiple sampling operation is used.
In Figure 6, three Smart Measuring Nodes were configured to take measures synchronously. The broadcast measuring command is issued periodically at Tbroadcast intervals, and every node takes three measures of the attached sensors at Tsampling intervals. The correct use of the offsets allows one to increment the sampling period at the Smart Measuring Nodes. Figure 6 shows the broadcast measuring command and distributed collected values messages.
3.3. Implementation of the Monitoring System
This subsection describes the hardware and software used to implement the wireless monitoring system. Figure 7 illustrates the hardware used.
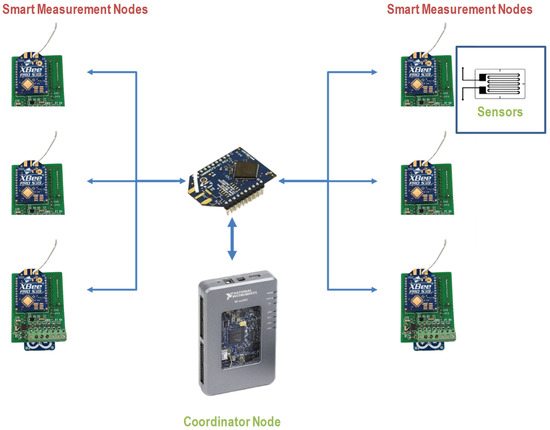
Figure 7.
Hardware implementation of the monitoring system.
At the core of the monitoring system, a National Instruments (NI) myRIO 1900 device was used as Coordinator Node. This is a real-time embedded board made by National Instruments powered with a dual-core ARM Cortex-A9 and a Xilinx FPGA. It may be used to develop real-time embedded applications since it provides several analog and digital inputs/outputs. It runs on top of a Linux RTOS, and it is programmed in LabVIEW. The Linux RTOS supports a filesystem which has been used for datalogging. Although the NI myRIO is aimed primarily at education, it is a very powerful device which mimics other devices of the CompactRIO series, also developed by National Instruments. These provide powerful computing platforms which allow for the combination of different modules, including controllers and different reconfigurable IO modules to create real-time embedded industrial control systems. Controllers work over a Linux-based RTOS and can be programmed with LabVIEW, C, C++ or Java. They are robust devices, which are widely used in industrial applications. Thus, the presented implementation could be exported easily to these industrial devices. As Figure 7 shows, one XBee module is connected to the Coordinator Node by means of a serial link. The serial communication between the XBee module and the NI myRIO can be easily programmed from LabVIEW by means of the NI VISA device. The LabVIEW application realizes the following operations: (1) configure the XBee modules at start up; (2) periodically send the broadcast/unicast measurement commands, according to the planned schedule; (3) collect the frames sent by the Smart Measuring Nodes; (4) detect the integrity of the frames issued by the Smart Measuring Nodes and discard the wrong or late packages; (5) extract the sensor data from the frames and (6) save monitoring values to disk for offline analysis.
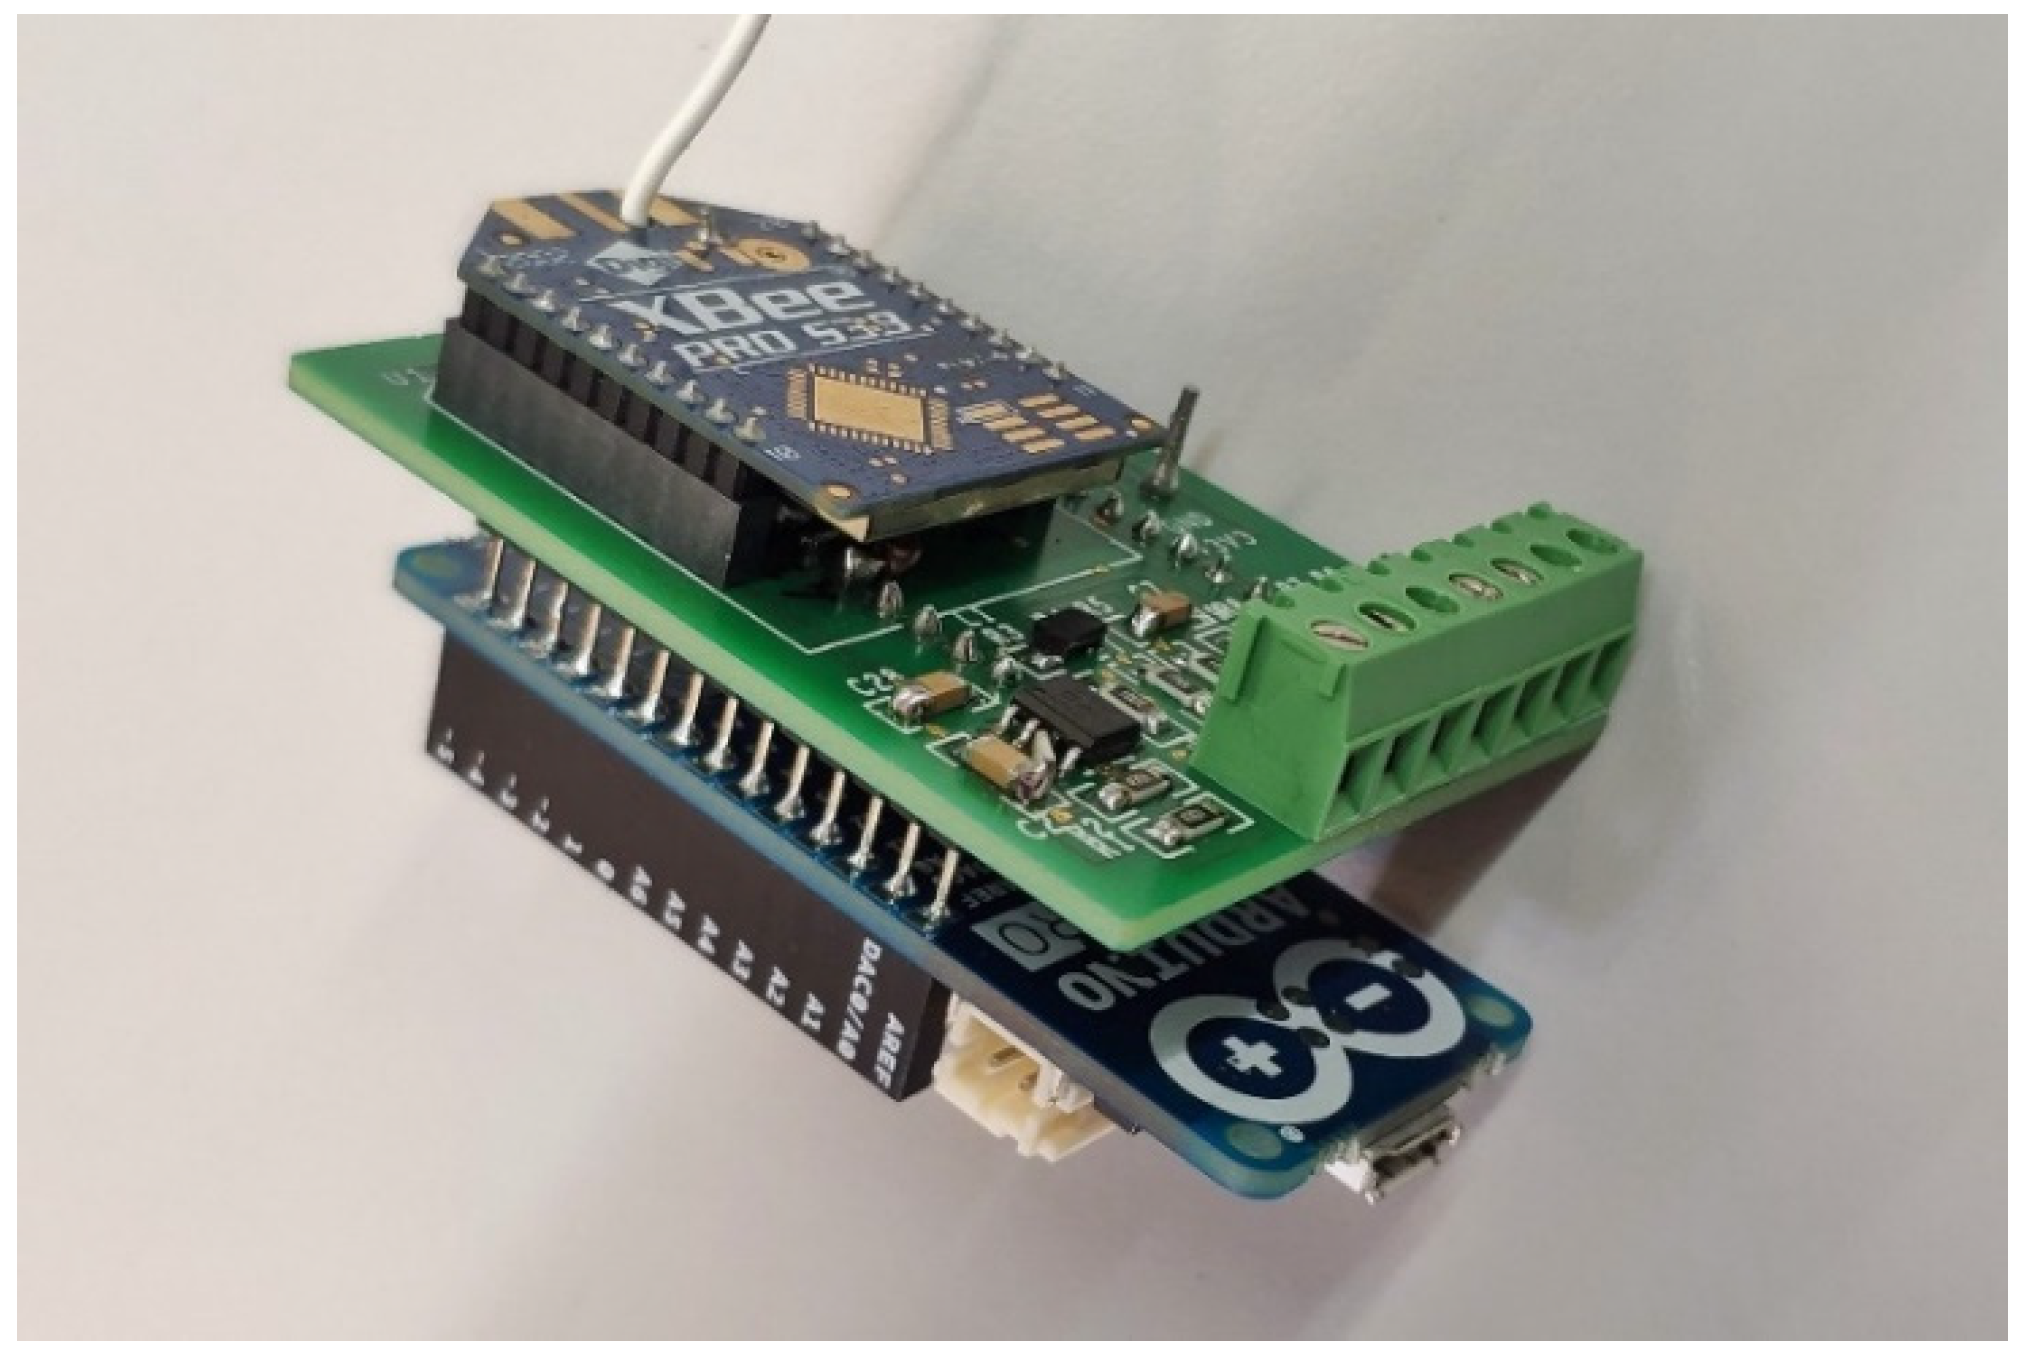
A prototype board for the Smart Measuring Node was designed based on commercial off-the-shelf components in order to simplify the construction of the board (see Figure 8). An Arduino MKR Zero board, based on a 32-bit SAMD microcontroller, was selected for processing purposes. The Arduino MKR Zero may be easily programmed by means of the open-source ArduinoIDE, which makes it easy to write code and upload it. Among other peripherals, it features seven channels of twelve bits analog to digital converters and supports a Li-Po single cell, 3.7 V battery along with an expansion connector compatible with the small form-factor Arduino pinout. Wireless communications are implemented by means of XBee Pro S3B modules, which communicates with the Arduino MKR board by means of an asynchronous (UART) port. An original printed circuit board (PCB) was specifically designed and manufactured to assemble both components. It also features a low-power input to the microcontroller along with a reference voltage, to increase the voltage resolution of the ADC, and four analogue inputs fitted with simple RC low pass filters. This board eases the connectivity of the analogue sensors, which should be in the range of 0–3.3 V, while keeping the expansion port of the Arduino board free to connect other boards as long as they do not interfere with the signals used in this project.
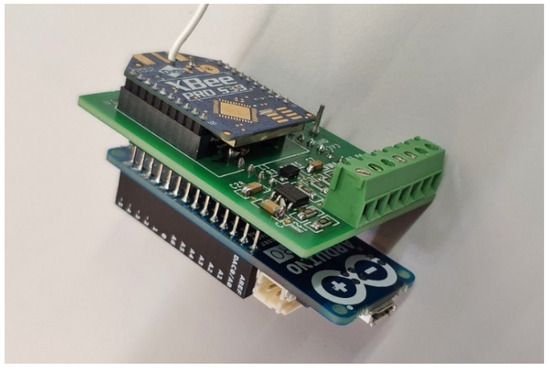
Figure 8.
Detail of the Smart Measuring Node prototype board.
The microcontroller application is responsible for: (1) configuring the Smart Measuring Nodes according to configuration frames issued at system start up; (2) receiving the multicast/unicast measurement orders; (3) reading the values of the connected sensors accordingly; (4) sending the frames with the readings of the sensors; and (5) identifying wrong or late frames sent by the Coordinator Node.
XBee modules are very flexible and must be properly configured in order to achieve an optimal performance of the applications. A star topology was built for better bounding of the transmission time of the applications. This configuration was implemented by setting the Coordinator Node in the Indirect Message Coordinator mode and the Smart Measuring Nodes as the Indirect Message Poller. The maximum number of hops across the network was set to 1 in order to configure the start topology. Unicast retries were disabled to allow low sampling at the nodes and achieving higher determinism. The broadcast multitransmits and unicast retries were also disabled. The transmission power of the XBee modules was set to the highest value (+24 dB). For the serial communication between the processing nodes and XBee modules, a baud rate of 115,200 bauds without parity was selected; this is the maximum baud-rate allowed by the Arduino MKR Zero. Thus, it is possible to achieve lower sampling periods. Table 1 summarizes the major parameters used.

Table 1.
Most relevant XBee configuration parameters.
3.4. Applicability to Different Scenarios
This section illustrates how the acquisition system may be scheduled for coping with different measurement scenarios. Basically, the system schedule requires finding a plan that allows timely sending all messages in the transactions. Currently, the system is designed to work with a static plan, which is used for configuring the Smart Measuring Nodes accordingly. The use of a static plan is a simple approach, but it may be adequate for a great number of industrial applications, especially in monitoring applications. Regardless, this approach could be extended to introduce more flexibility by introducing similar techniques to the flexible time triggered (FTT) paradigm, which has been introduced in wired networks such as CAN [54] or Ethernet [55] and at a logical level over TCP/IP [56].
In order to arrange a schedule, it is necessary to define the size of the time slots of the TDMA. These slots depend on the latency of the broadcast/unicast measurement and the distributed values collection frames. These latencies were experimentally measured at different scenarios in the next section.
The applicability of the monitoring system is illustrated by means of two selected scenarios. The first scenario involves sampling synchronously 20 sensors at a frequency of 10 Hz (i.e., every 100 ms). This scenario is shown in Figure 9. For this scenario, five Smart Measuring Nodes would be used, connecting four sensors each. According to the experimental tests carried out in Section 4, it is necessary to define a slot for the broadcast measuring command, which takes less than 12 ms (Table 2). The frames with the collected samples have a length of 29 bytes (4 values are sent, one per attached sensor). According to the experimental values for the latency presented below a slot of 15 ms should be adequate. Consequently, according to the experimental values acquired in Section 4, the schedule is feasible, since the sum of the maximum latency for the five slots needed for sending the measured values to the Coordinator Node plus the latency of the broadcast frame is lower than 100 ms. Those messages that are not received in the defined slot are discarded and considered as lost messages.
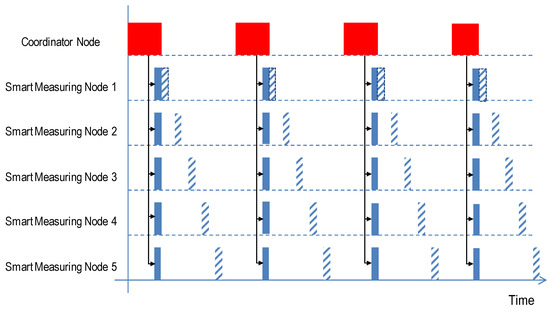
Figure 9.
Scenario 1: distributed simple sampling of 5 SMNs with 4 connected sensors each.
Table 2.
Maximum and minimum latency values and jitter at the reception of a broadcast measuring command.
The configuration parameters for all Smart Measuring Nodes are: SamplesFrame = 1; N.Sensors = 4; and SamplingPeriod = 0. Every SMN has a different value for the Offset in order to define when the values are sent. These configuration parameters are issued at the configuration stage.
The second scenario, see Figure 10, involves using multiple sampling, as in Figure 6. However, in this scenario, different sampling periods were selected. Namely, a sampling frequency of 10 Hz was chosen for Smart Measuring Node 1, 20 Hz for Smart Measuring Node 2 and 30 Hz for Smart Measuring Node 3, yielding sampling periods of 100, 50 and 33.3, ms respectively. Let us assume that the numbers of attached sensors to SMN1, SMN2 and SMN3 are 4, 2 and 1, respectively. Consequently, the size of the frames would be of 29 bytes for SMN1, 29 bytes for SMN2 and 27 bytes for SMN3.
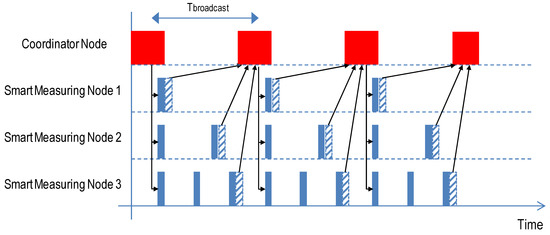
Figure 10.
Scenario 2: combination of several SMNs using different sampling configurations.
In this scenario, the maximum latency for the sending messages is again below 12 ms. According to the values shown below, a slot value of 15 ms seems adequate for sending the frames with the collected values. Thus, the system could be achieved by periodically sending one broadcast measuring command every 100 ms and configuring the sampling interval to 50 and 33.3 ms, respectively, at each node. The messages that are not received at the defined time slot are discarded, and the message is lost. Thus, according to the experimental values acquired in Section 4, the schedule is feasible.
The configuration parameters for SMN1 are: SamplesFrame = 1; N.Sensors = 4; SamplingPeriod = 0 and Offset = 0. For SMN2, they are SamplesFrame = 2; N.Sensors = 2; SamplingPeriod = 50 and Offset = 50. Finally, for SMN3, they are SamplesFrame = 3; N.Sensors = 1; SamplingPeriod = 33 and Offset = 66.
4. Experimental Tests of the Monitoring System
This section describes the tests carried out to validate the design of the proposed wireless monitoring system. Several tests were carried out to analyze the behavior at different scenarios.
4.1. Latency and Jitter for Broadcast Measurement Command Frames
This test is aimed at measuring the minimum latency and jitter of a broadcast measurement command frame. Frames were sent periodically by the Coordinator Node, executed over the NI myRIO platform, to the Smart Measuring Nodes. To better synchronize the distributed measures, messages were sent according to the transaction clock, centralized at the Coordinator Node. Hence, latency and jitter for this operation were key values in order to achieve an appropriate behavior of the monitoring system.
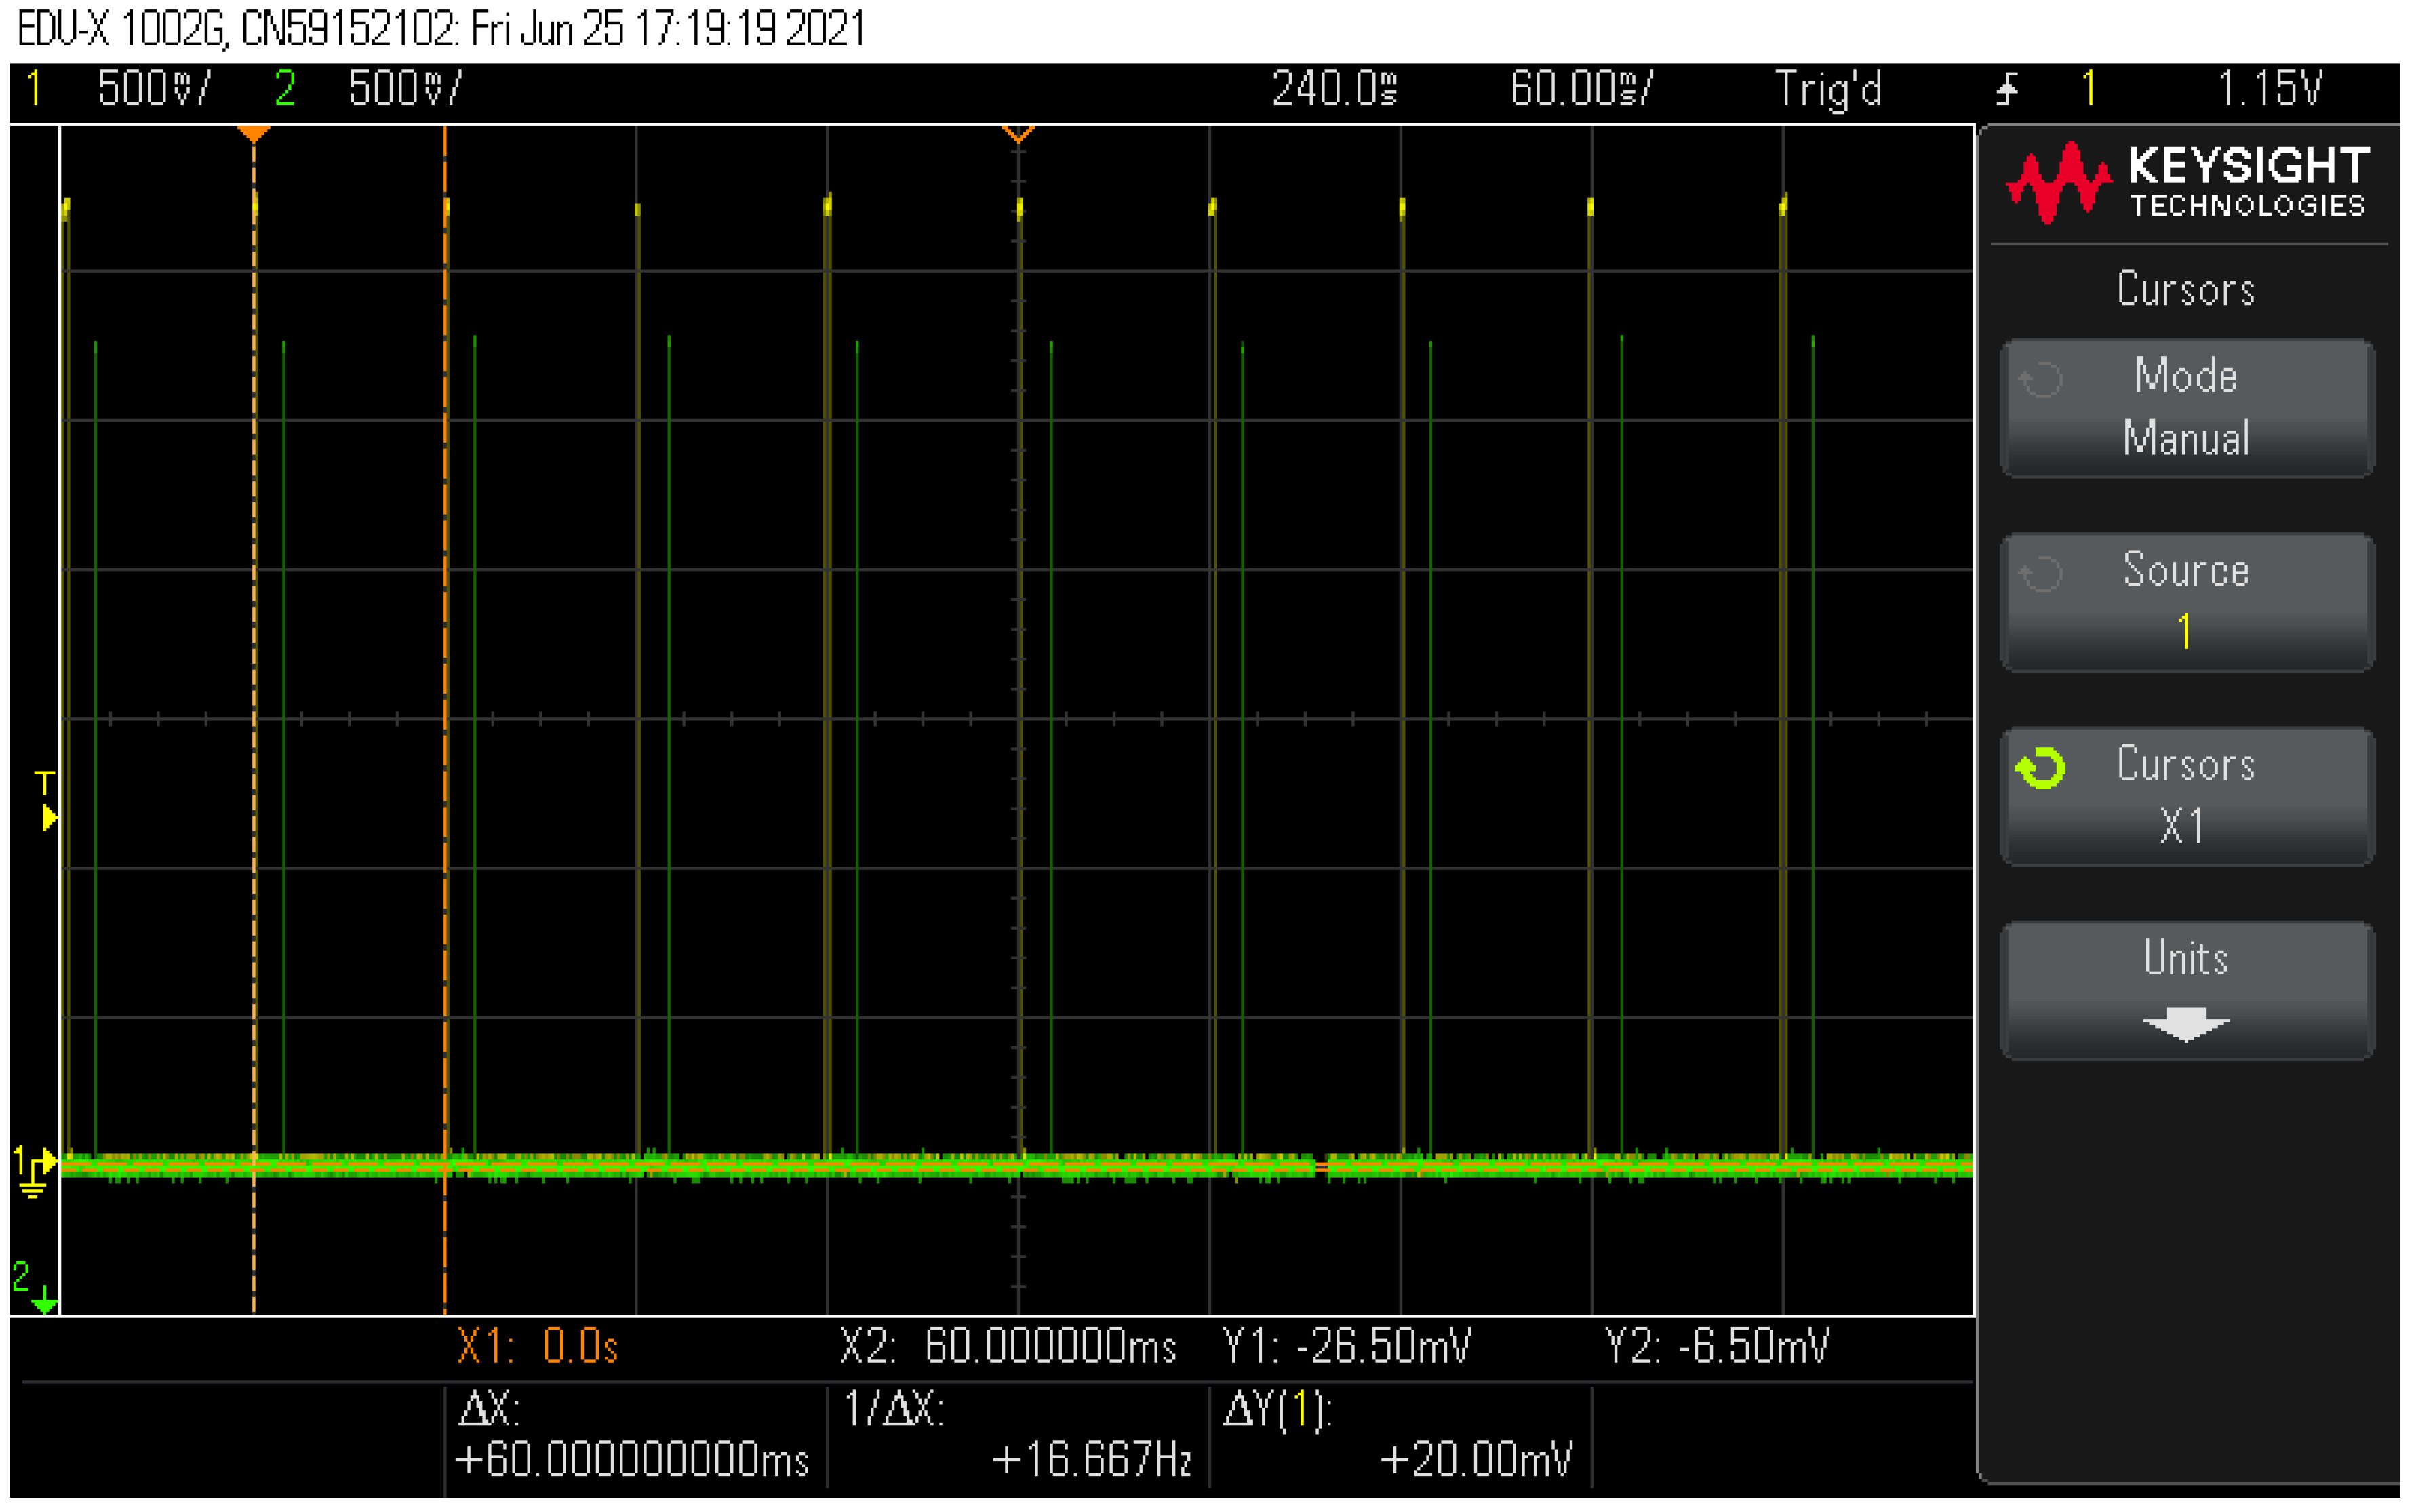
Latency was measured with an oscilloscope (see Figure 11). Specifically, it was measured the instant in which the Coordinator Node sends the broadcast measurement message (in yellow) and the reception at the Smart Measuring Node (in green). The duration of the test was of 10 min, and frames were sent periodically at a rate of 60 ms. Oscilloscope data were captured using the persistence property to obtain the maximum and minimum latency values of the test. Figure 11 shows the results when both devices were located at a very short distance. In such cases, the measured values were 9.62 and 10.60 ms, respectively. Consequently, the transmission latency of a broadcast measurement command is around 10 ms, with a jitter of 0.98 ms. Figure 12 shows the repeatability of the measure at a different time scale. Yellow lines indicate when the broadcast measurement command is issued by the Coordinator Node, whereas green lines show when these messages are received at the Smart Measuring Nodes.
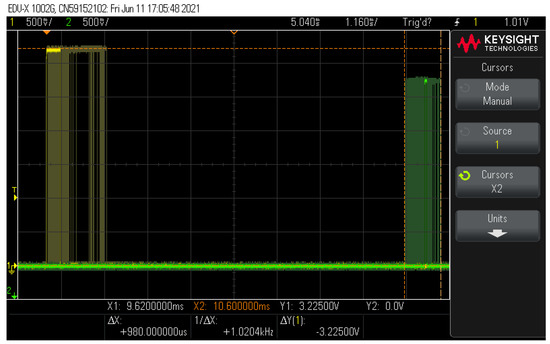
Figure 11.
Minimum and maximum latency for a broadcast measurement command frame.
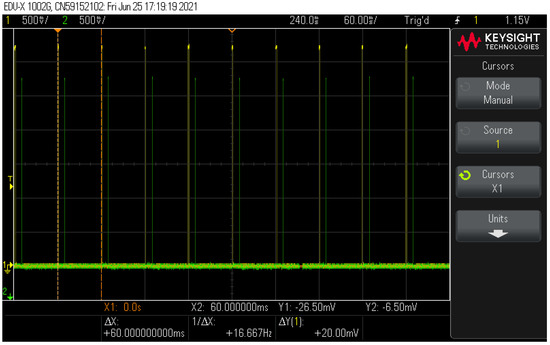
Figure 12.
Periodical sending of a broadcast measurement frame at 60 ms.
This test was repeated at different distances. Table 2 shows the values obtained. It can be appreciated that there is not a big difference for the distances used at the experiments. Average delay was around 10 ms, and jitter was around 1 ms. Only for longer distances of around 12 m did the value of the jitter increase. However, this value may be acceptable for some applications depending on the dynamics of the process.
4.2. Synchronous Reception of Broadcast Measurement Commands
This test is aimed at checking if several Smart Measuring Nodes take the measurements simultaneously. For that purpose, an oscilloscope was used to check that they receive the broadcast measurement command frame synchronously. Namely, three Smart Measuring Nodes were used. The duration of the tests was 5 min. Several distances were used, ranging from 0 to 15 m. Broadcast measurement frames were sent periodically every 60 ms. Results are shown at Table 3. It can be appreciated how the jitter among the three Smart Measuring Nodes was below 1 ms for all the experimental tests.
Table 3.
Reception jitter at three different Smart Measuring Nodes at different distances.
4.3. Reception of Simple Sampling Distributed Frames from Several SMNs
This test is aimed at reproducing the behavior of Figure 2. The Coordinator Node sends a broadcast measurement order and collects the measurements issued by three Smart Measuring Nodes, each acquiring the values of four attached sensors. Frames sent by each Smart Measuring Node had 29 bytes as in Figure 4. The measuring order was sent periodically every 60 ms. Slots of 15 ms were defined for every Smart Measuring Node to send its values. Table 4 shows the time instants in which the Coordinator Node received the data from every Smart Measuring Node. This test was executed for 10 min, so that 10,000 frames were issued by every Smart Measuring Node. It could be observed that messages from the Smart Measuring Nodes arrived in a timely manner. The maximum value-reception value for the last Smart Measuring Node was less than 56 ms, enabling an overall sampling period of 60 ms. Results shown in Table 4 proved that the system could acquire the values of up to 12 sensors (four sensors connected to every Smart Sampling Node) at a frequency of 60 ms.
Table 4.
Reception timestamps of Smart Measuring Nodes at the Coordinator Node (in ms).
4.4. Latency and Jitter for Distributed Values Collection Frames Using Different Sizes
The length of the frames issued by the Smart Measuring Nodes may vary according to the configuration selected, i.e., how many sensors were selected for measuring and whether simple versus multiple sampling capabilities were used. The designed Smart Measuring Node prototype board may carry frames with the values measured by one to four sensors (from 23 to 29 bytes). In addition, in the case of using the multiple sampling, the number of values may be multiplied by the number of samples per measurement command. For example, a frame for measuring the values of four sensors, using simple sampling, carries four values, and the size of the frame is of 29 bytes. When multiple sampling is used with four sensors and sampling four times each between measurements, the commands would carry sixteen values, yielding a frame of 53 bytes.
This test is aimed at evaluating the latency of the distributed values collection frames sent by the Smart Measuring Nodes to the Coordinator Node. This information is required in order to design an adequate schedule. All tests lasted 5 min. Results in Table 5 prove that latency depends on the size of the frames, but even for the longest frames, 53 bytes carrying 16 values, the jitter is bounded to 1 ms.
Table 5.
Reception timestamps of Smart Measuring Nodes at the Coordinator Node (in ms).
4.5. Jitter at the Measuring Instant in Multiple Sampling Operations
This test is aimed at checking the use of the multiple sampling capability. In these operations, the sampling time is left to the Smart Measuring Node microcontroller between two broadcast measurement commands. This approach increments the payload of the messages but allows for a higher sampling resolution.
For that purpose, a broadcast period of 120 ms was selected, and several sampling periods were used, namely 60, 40, 30 and 24 ms, yielding to 2, 3, 4 and 5 samples per broadcast measurement command. Table 6 shows the jitter at the measuring instant.
Table 6.
Jitter for the measuring instant at multiple sampling operations.
Results prove that the value of jitter increments when the schedule is tighter. This may become acceptable for some operations depending on the dynamics of the process.
4.6. Lost/Wrong Packages at Several Distances
This test is aimed at obtaining the error rate at different distances. This test was carried out for a duration of 20 min with a sampling time of 60 ms. The total number of sent frames was of 20,000 frames for this test. In addition, the number of lost/wrong frames when a wall of brick was in the middle was checked. Table 7 shows the experimental results, including the total number of lost/wrong frames and the percentage over the total number of frames. It can be appreciated that this value is remarkably low, even when there is a wall of bricks between the Coordinator Node and the Smart Measuring Node.
Table 7.
Lost/wrong frames at different distances even with a brick wall in between.
5. Validation of the Monitoring System in an Industrial Scenario
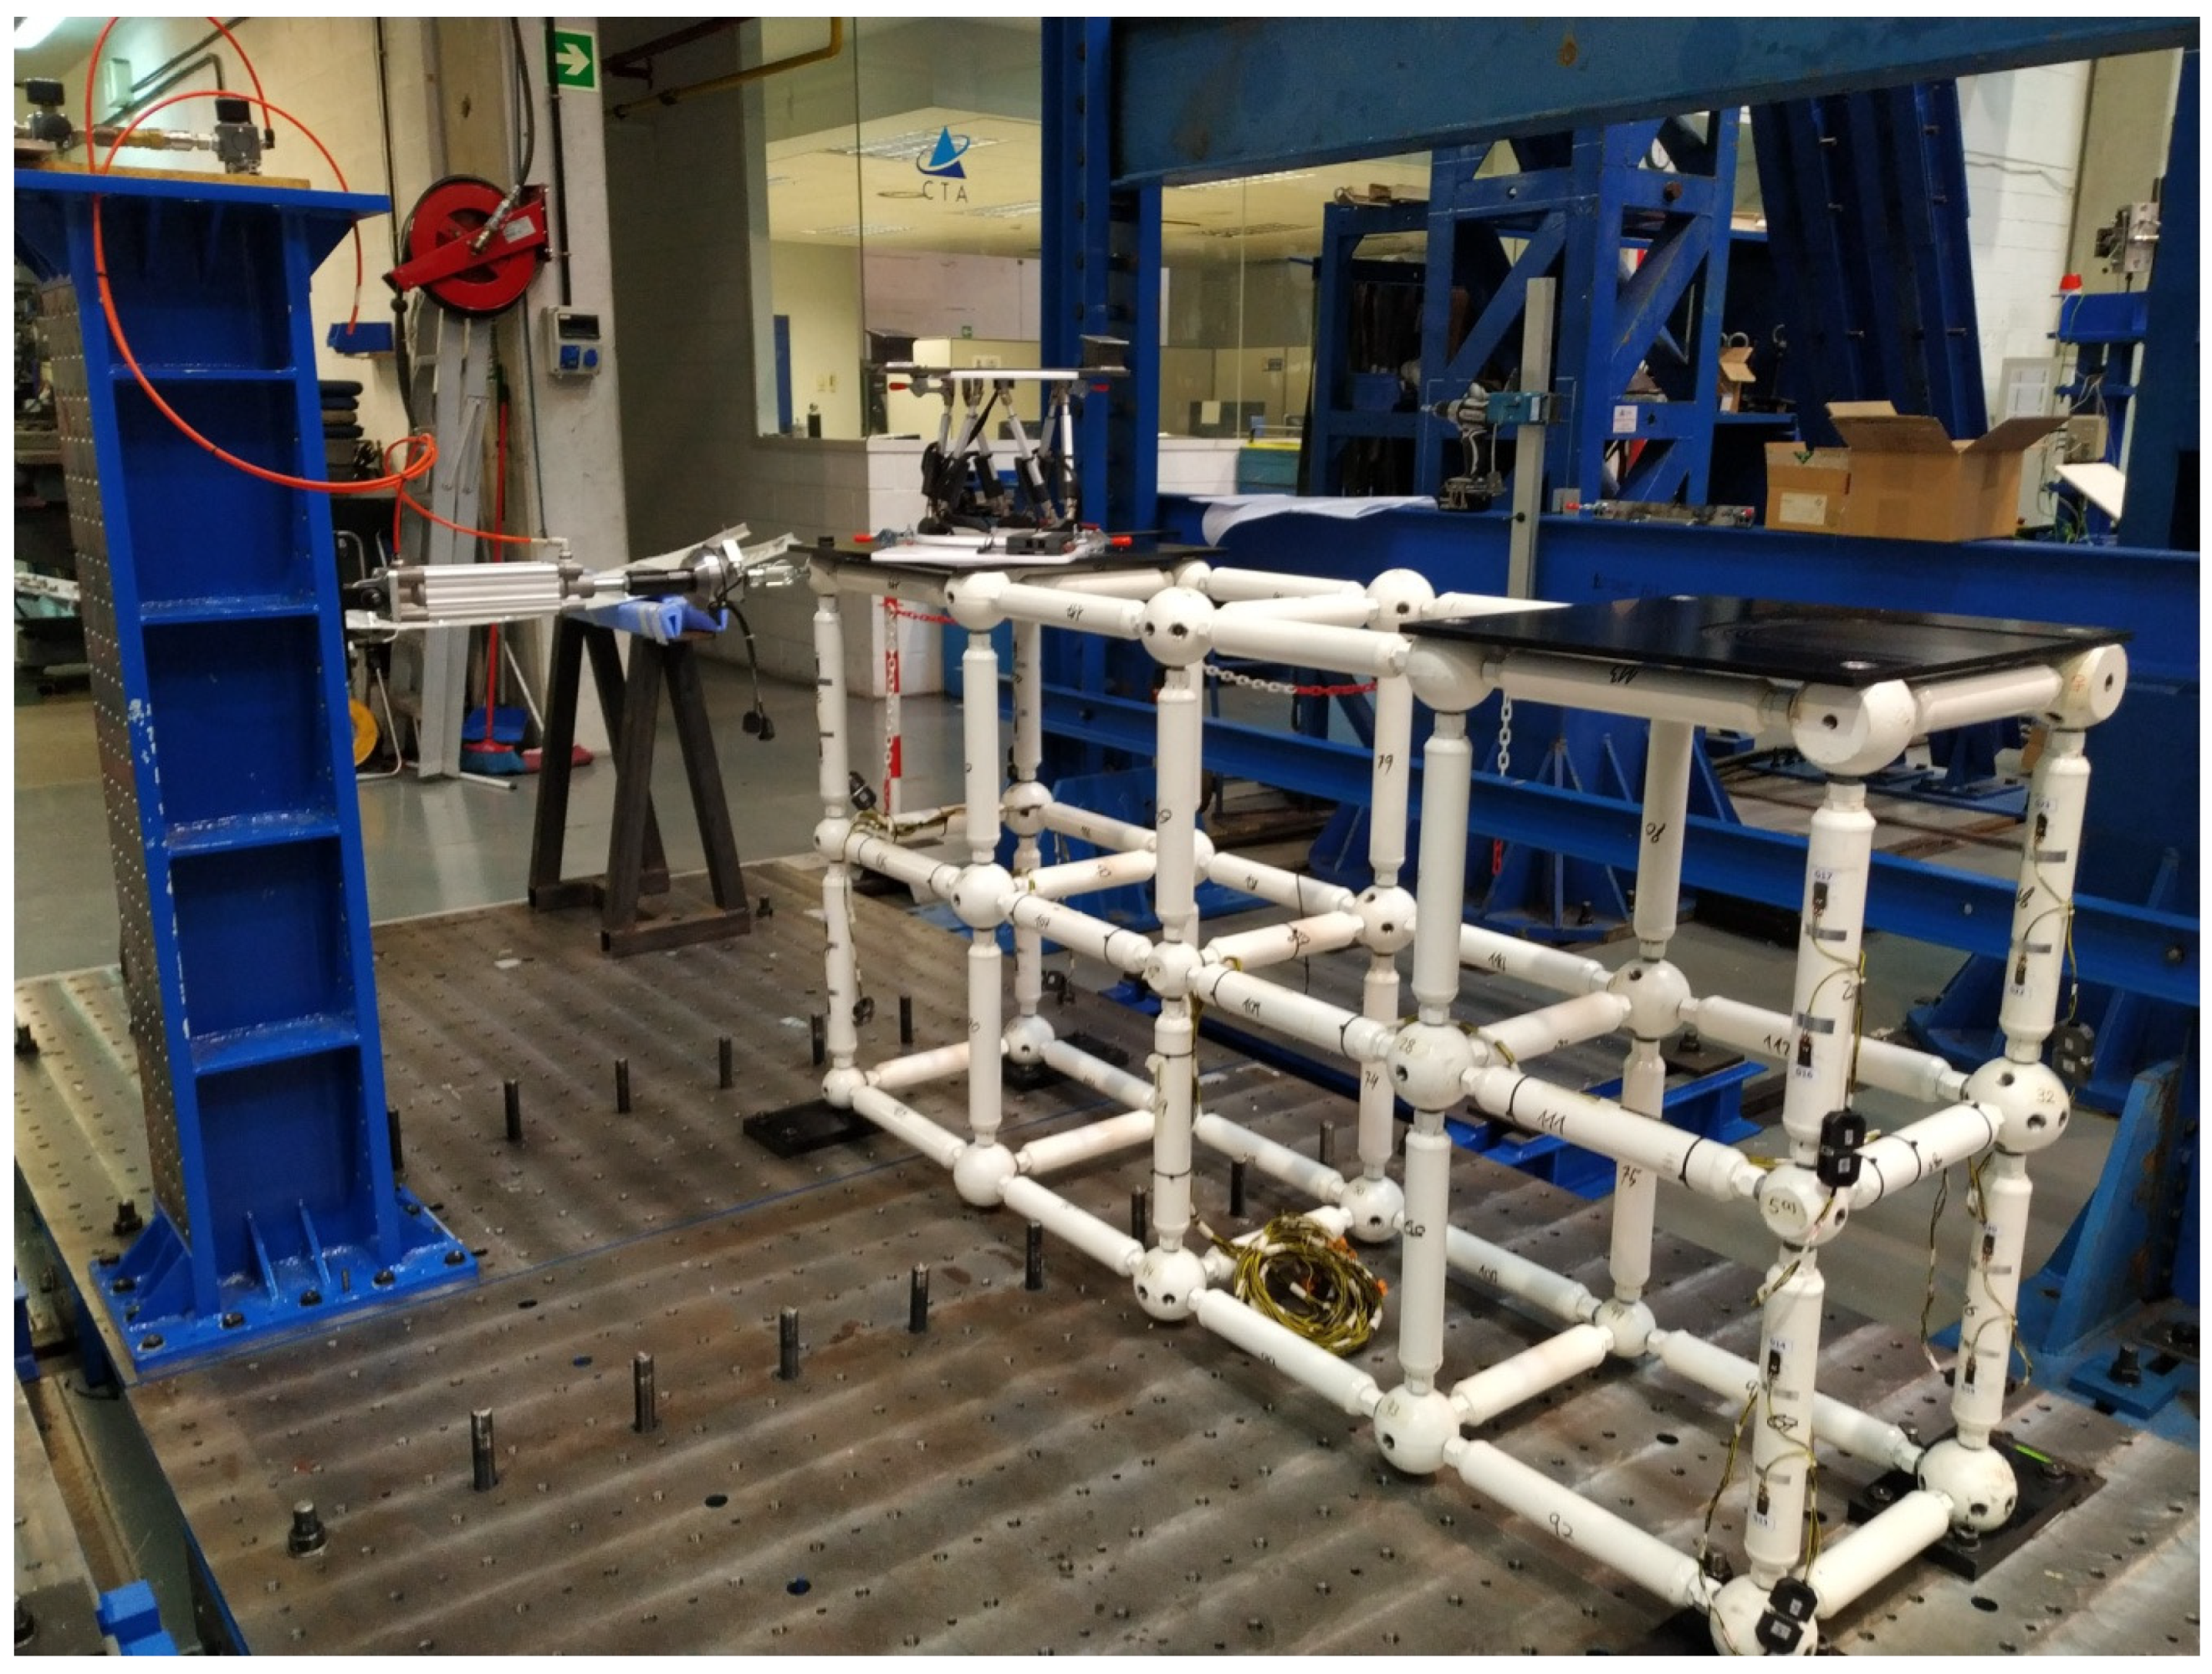
This section focuses on validating the use of the monitoring system in an industrial scenario. For that purpose, an aeronautical reconfigurable tooling prototype, based on a bar-knot structure, which was developed in the context of the SMAR3NAK research project, funded by the Basque Government (see Figure 13), was chosen. Tests were carried out at the premises of the CTA Foundation, located at the Miñano Technological Park, in Alava, Spain. This tooling prototype is aimed at adopting different shapes so that different aeronautical parts can be assembled with the same tooling.

Figure 13.
Aeronautical reconfigurable tooling prototype based on bar-knot structure in which the monitoring system was tested.
The general objective is evaluating the performance of the proposed wireless monitoring system to monitor strategic sensors located in big machinery in industrial premises, while using wired links for monitoring other sensors. In this case, the operation of positioning an aeronautical reconfigurable tooling prototype was selected. This operation involves monitoring several sensors, located at strategic positions of the tooling prototype, to detect external disturbances that could affect the manufacturing process. Sensors were connected by means of Smart Measuring Nodes. The data acquired by wireless means were compared with the data obtained from the same sensors by using wired links. Experimental tests were carried out at three different distances, namely, 0.30, 6.10 and 12.30 m. All tests lasted around 3 min, since this time is considered adequate for monitoring the bar-knot structure under ramp- and step-provoked disturbances.
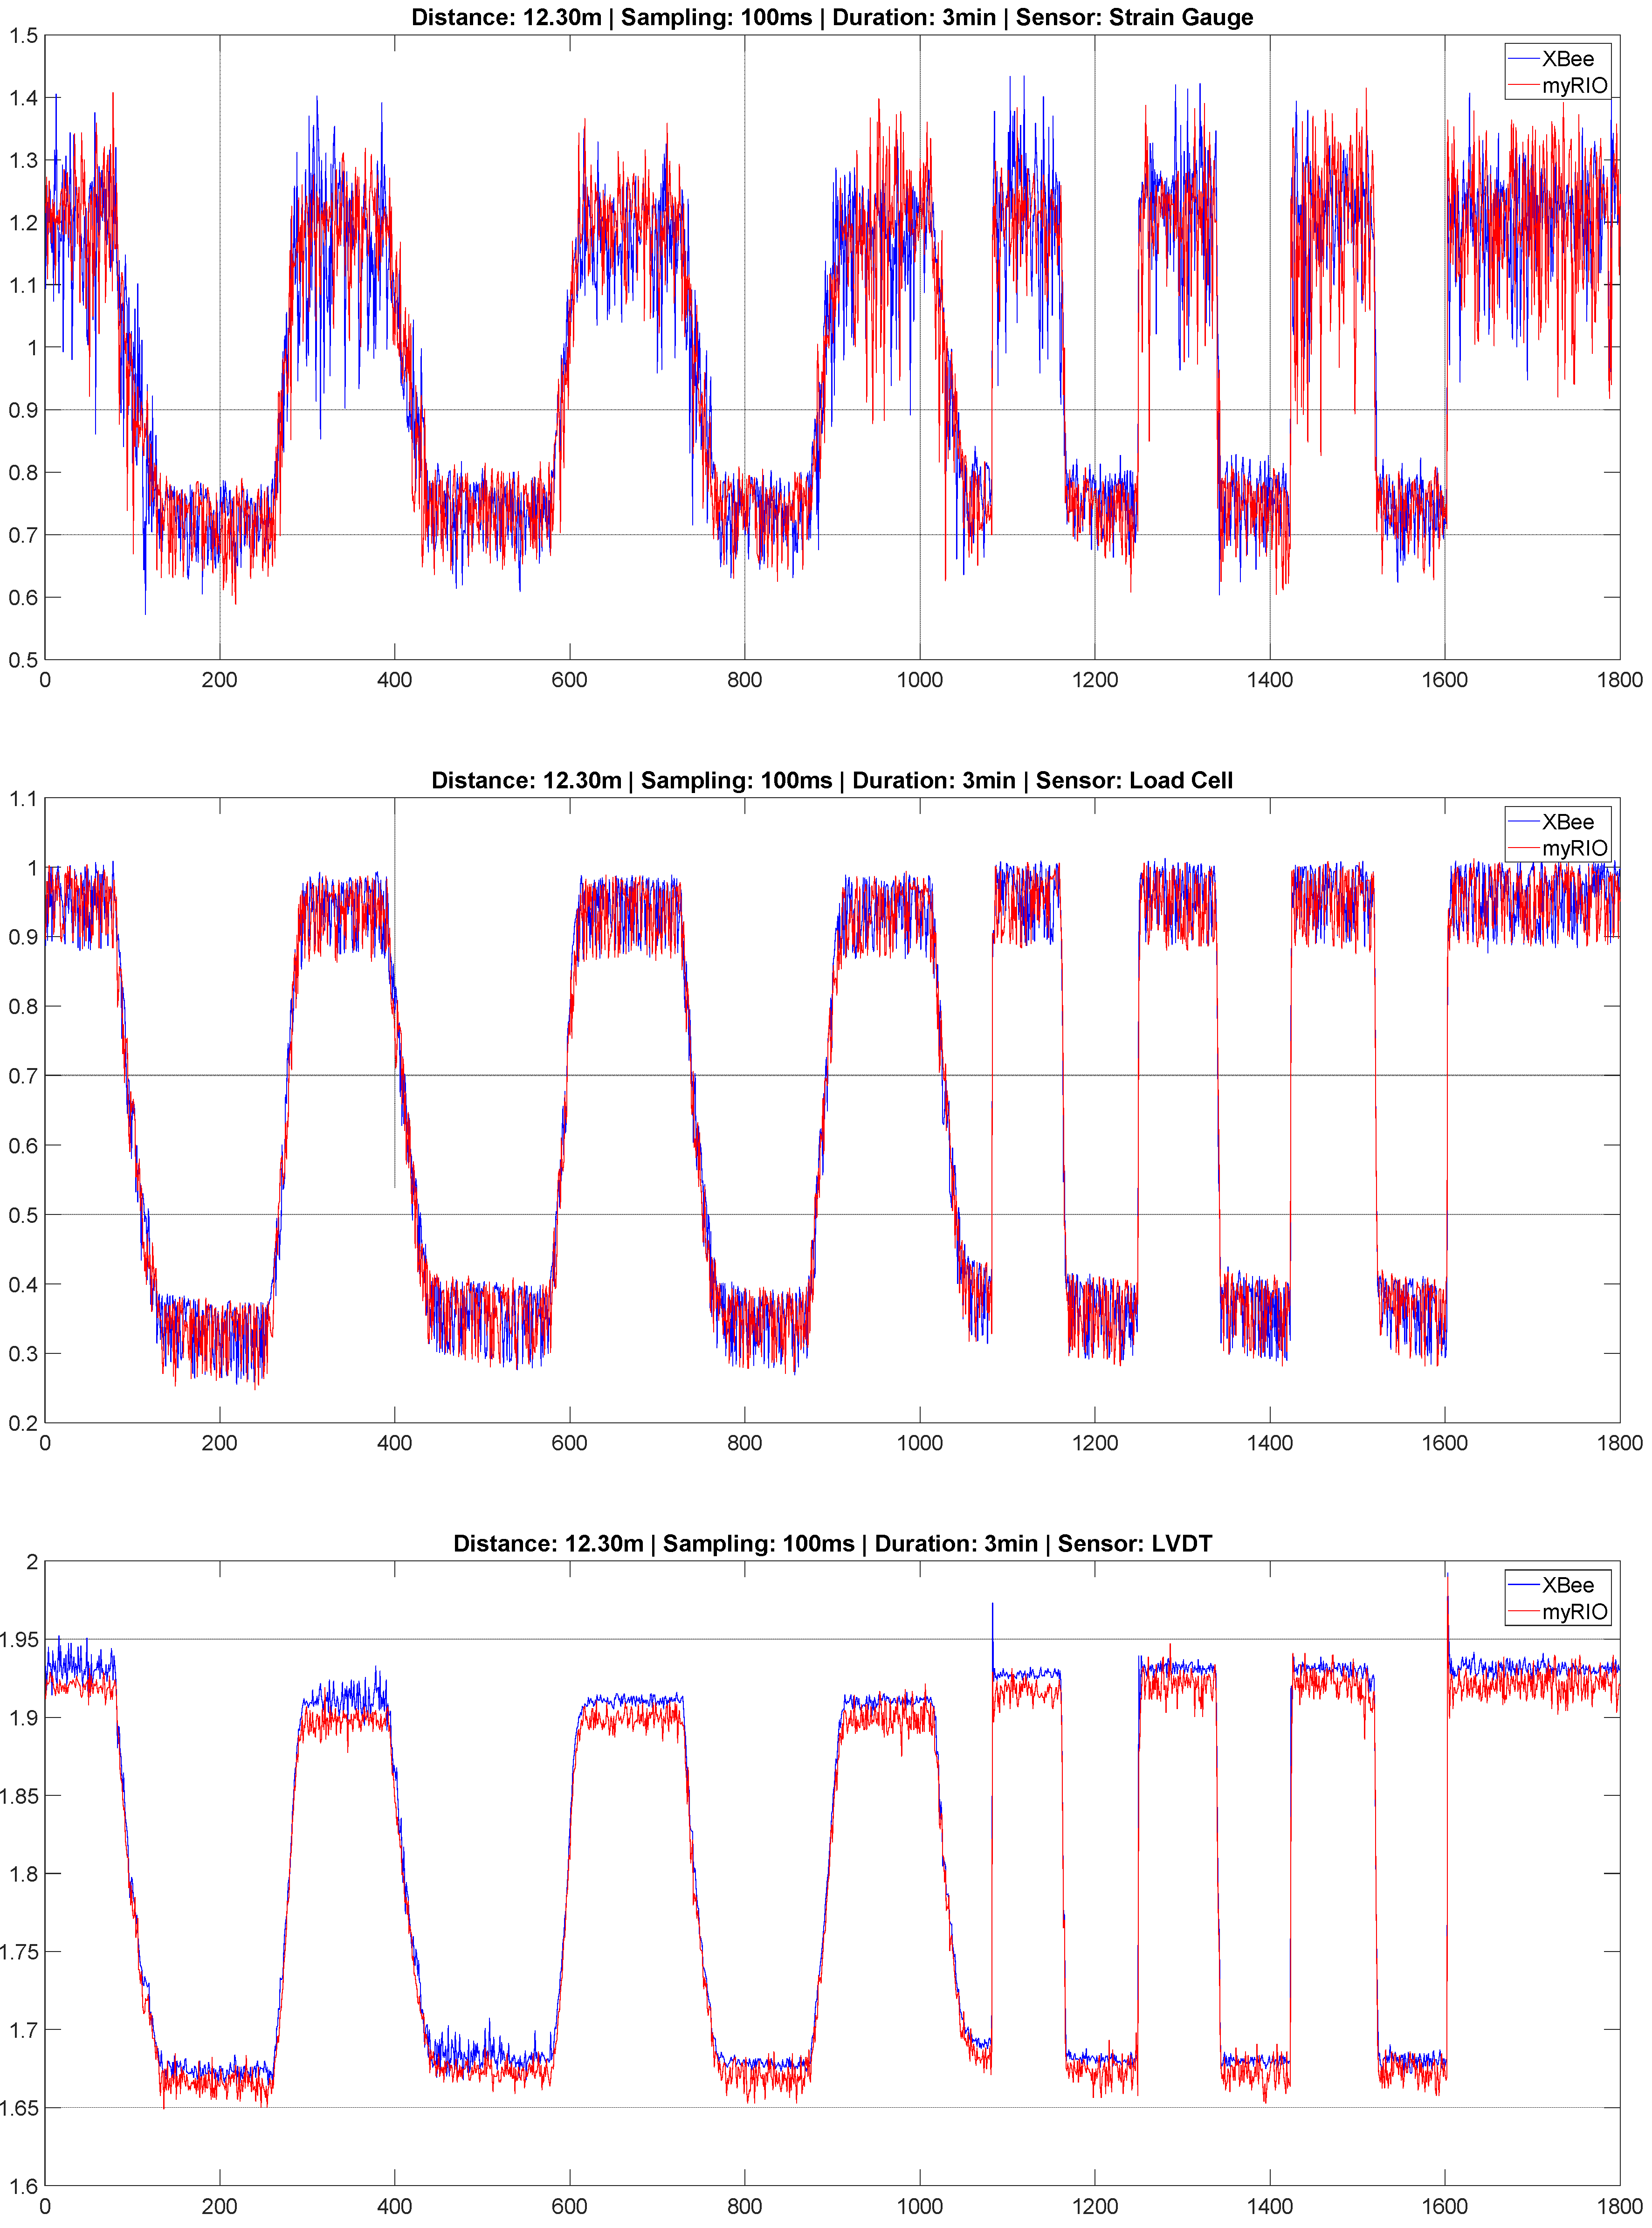
For validation purposes, three different types of sensors attached to the structure were considered. Namely, a strain gauge, a LVDT sensor and a load cell were used to monitor the mechanical strain in a critical bar and the displacement and force values in the knot where the external disturbance is applied. Figure 14 shows the voltage output signals for each sensor. The measurement values obtained with the Smart Measuring Node are shown in blue, while the values obtained by wired links are shown in red. Values were acquired at a distance of 12.30 m from the structure.
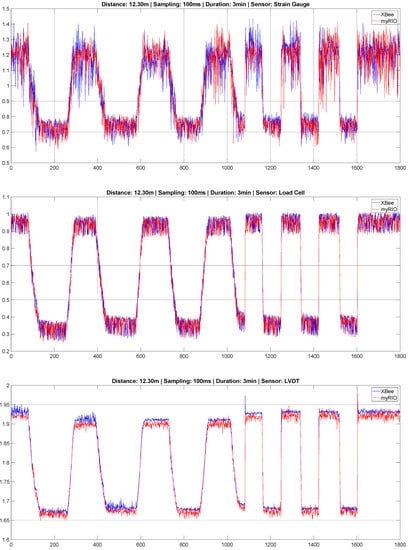
Figure 14.
Comparison values acquired with sensors located at the bar-knot structure when an external disturbance is applied. Frequency: 10 Hz; Measuring/acquisition separation: 12.30 m. Test duration 3 min. Strain-gauge (top); LVDT (medium) and Load-cell (bottom). Wireless values shown in blue and wired values in red.
It should be noted that the Smart Measuring Node, powered by an Arduino MKR, only provides a resolution of 12 bits, whereas the NI myRIO provides a resolution of 16 bits. In industrial scenarios, a resolution of 12 bits is frequently considered adequate for a great range of applications.
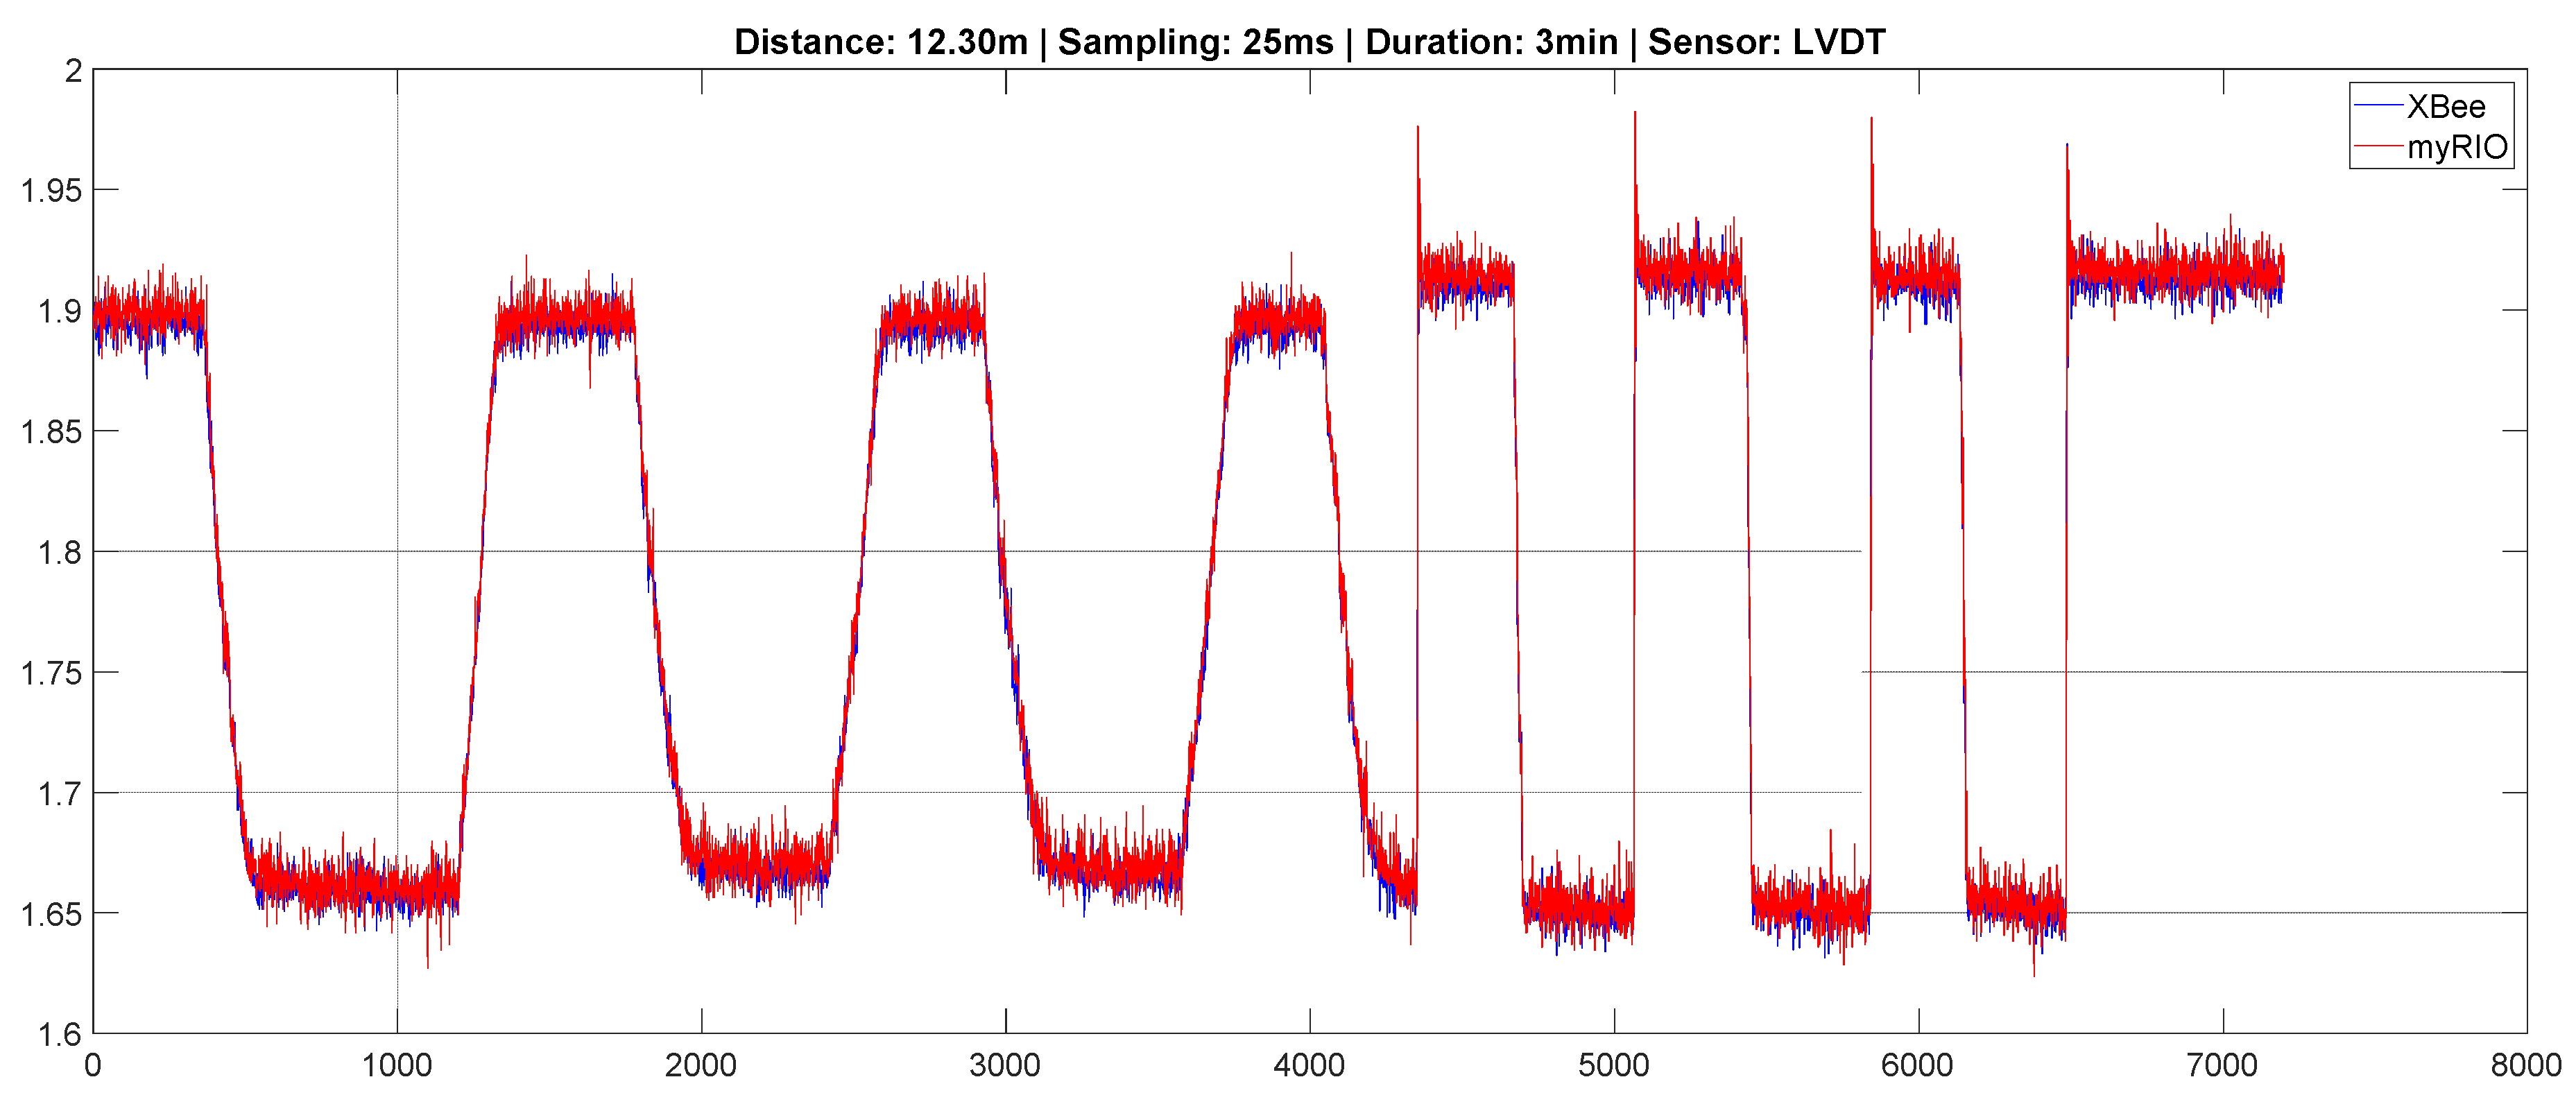
Figure 15 compares the values obtained in a different test performed at a frequency of 40 Hz. In this test, only the LVDT sensor was used. Wireless captured values are shown in blue and wired values in red. In this case, the multiple sampling feature was configured. The monitoring system was configured to sample four times every 100 ms, producing an effective sampling time of 25 ms.
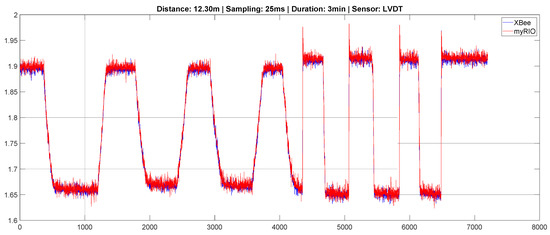
Figure 15.
Comparison values acquired with sensors located at the bar-knot structure when a force is applied. Frequency: 40 Hz; Measuring/acquisition separation: 12.30 m. Test duration 3 min. LVDT sensor. Wireless values shown in blue and wired values in red.
6. Conclusions
This work presents a novel wireless acquisition system aimed at industrial applications with QoS requirements. This system eases the tasks of monitoring mobile devices/parts and difficult-to-reach sensors. It also improves configuration flexibility and eliminates costly cabling. These benefits improve productivity and efficiency in industrial processes. The use of the 2.4 GHz frequency band was avoided for critical communications, in order to reduce interferences caused by other communication technologies, which typically operate in this band. Thus, the 2.4 GHz channel may also be used for other tasks related to noncritical operations, such as connecting industrial devices with services available at the factory or in the cloud. The authors also designed a logical protocol for critical operations aimed at avoiding congestions and collisions and a device to ease the connection to the process sensors.
The details of the acquisition system were discussed, including: the topology and configuration of the selected communication technology, XBee at 900 MHz; the nodes involved, the so-called Coordinator Node and Smart Measuring Nodes; and the design of the logical protocol and frames. The proposed system was implemented over a real-time embedded platform commonly accepted in industrial applications, such as the Compact RIO series, provided by National Instruments. In addition, a module, the so-called Smart Measuring Node, was specifically designed for easing the connection of the sensors. This module also provides the communication as well as edge processing capabilities.
XBee 900 MHz modules were used for establishing the communications between the nodes, Coordinator Node and Smart Measuring Nodes, due to the fact that it is a low-cost, well-proven and easily available technology. However, this is a highly configurable technology and must be carefully configured in order to achieve the QoS requirements of industrial monitoring applications. However, this technology is based on CSMA/CA MAC policies which do not ensure determinism. For this reason, the authors designed a logical protocol based on time-slotted media-access policies (TDMA), which permit a central node to coordinate all transactions of the acquisition system according to a static schedule. Since the 900 MHz band is not so crowded at industrial environments as the 2.4 GHz, a higher degree of determinism may be achieved. This approach leaves free the use of WiFi 2.4 GHz for other operations related to integration of the information or connecting to services available at the factory or in the cloud. The proposed monitoring system extends the communication capabilities of the Compact RIO series by adding wireless connectivity to the processes and may be used in combination with the wired capabilities that this platform already offers.
Experimental tests were carried out to validate the design of the system and evaluate its performance. The obtained experimental results proved that it may be used for a number of sensors in the range of teens of sensors, reaching sampling frequencies of up to 40 Hz at distances of up to 12–15 m. The performance of the system was tested in industrial facilities. More particularly, it was used for acquiring the position of an aeronautical reconfigurable tooling prototype. The obtained results proved that the followed approach may be valid for monitoring diverse variables in big machinery in industrial facilities.
Author Contributions
Conceptualization, I.C., O.B. and J.V.; methodology, I.C. and J.M.G.-G.; software, I.C., E.V. and A.F.; validation, E.V., A.F. and J.V.; formal analysis, I.C. and J.M.G.-G.; investigation, I.C., E.V. and A.F.; writing—original draft preparation, I.C. and J.M.G.-G.; writing—review and editing, P.F.-B., O.B., C.N. and J.V.; visualization, C.N.; supervision, I.C. and O.B.; project administration, I.C., O.B. and J.V. All authors have read and agreed to the published version of the manuscript.
Funding
This research was funded by the Basque Government, through the project EKOHEGAZ (ELKARTEK KK-2021/00092), Diputación Foral de Álava (DFA) through the project CONAVANTER, and to the UPV/EHU through the project GIU20/063.
Institutional Review Board Statement
Not applicable.
Informed Consent Statement
Not applicable.
Acknowledgments
The authors wish to express their gratitude to the Basque Government, Diputación Foral de Álava (DFA) and UPV/EHU.
Conflicts of Interest
The authors declare no conflict of interest.
Abbreviations
The following abbreviations are used in this manuscript:
| IIoT | Industrial Internet of Things |
| WSN | Wireless Sensor Networks |
| CPPS | Cyber Physical Production Systems |
| QoS | Quality of Service |
| CSMA/CA | Carrier Sense Multiple Access with Collision Avoidance |
| TDMA | Time-Slotted Media Access |
| MAC | Medium-Access Control |
| TSCH | Time-Slotted Channel Hopping |
| RTOS | Real-Time Operating System |
| PCB | Printed Circuit Board |
| UART | Universal Asynchronous Receiver-Transmitter |
| FTT | Flexible Time Triggered |
| CN | Coordinator Node |
| SMN | Smart Measuring Node |
| LVDT | Linear Variable Differential Transformer |
References
- A Global Nonprofit Partnership of Industry, Government and Academia. The Industrial Internet Consortium. 2014. Available online: http://www.iiconsortium.org (accessed on 20 June 2021).
- Branz, F.; Antonello, R.; Schenato, L.; Tramarin, F.; Vitturi, S. Time-Critical Wireless Networked Embedded Systems: Feasibility and Experimental Assessment. IEEE Trans. Ind. Inform. 2020, 16, 7732–7742. [Google Scholar] [CrossRef]
- Malik, P.K.; Sharma, R.; Singh, R.; Gehlot, A.; Satapathy, S.C.; Alnumay, W.S.; Pelusi, D.; Ghosh, U.; Nayak, J. Industrial Internet of Things and its Applications in Industry 4.0: State of the Art. Comput. Commun. 2021, 166, 125–139. [Google Scholar] [CrossRef]
- Wollschlaeger, M.; Sauter, T.; Jasperneite, J. The future of industrial communication: Automation networks in the era of the internet of things and industry 4.0. IEEE Ind. Electron. Mag. 2017, 11, 17–27. [Google Scholar] [CrossRef]
- Garcia, M.V.; Perez, F.; Calvo, I.; Moran, G. Developing CPPS within IEC-61499 based on low cost devices. In Proceedings of the IEEE World Conference on Factory Communication Systems, Palma de Mallorca, Spain, 27–29 May 2015. [Google Scholar]
- Khaitan, S.K.; McCalley, J.D. Design techniques and applications of cyberphysical systems: A survey. IEEE Syst. J. 2015, 9, 350–365. [Google Scholar] [CrossRef]
- Xu, H.; Yu, W.; Griffith, D.; Golmie, N. A survey on industrial internet of things: A cyber-physical systems perspective. IEEE Access 2018, 6, 78238–78259. [Google Scholar] [CrossRef]
- Raza, M.; Aslam, N.; Le-Minh, H.; Hussain, S.; Cao, Y.; Khan, N.M. A Critical Analysis of Research Potential, Challenges, and Future Directives in Industrial Wireless Sensor Networks. IEEE Commun. Surv. Tutor. 2018, 20, 39–95. [Google Scholar] [CrossRef]
- Seferagić, A.; Famaey, J.; De Poorter, E.; Hoebeke, J. Survey on wireless technology trade-offs for the industrial internet of things. Sensors 2020, 20, 488. [Google Scholar] [CrossRef] [PubMed] [Green Version]
- Candell, R.; Kashef, M.; Liu, Y.; Lee, K.B.; Foufou, S. Industrial wireless systems guidelines: Practical considerations and deployment life cycle. IEEE Ind. Electron. Mag. 2018, 12, 6–17. [Google Scholar] [CrossRef]
- Huang, V.K.L.; Pang, Z.; Chen, C.-J.A.; Tsang, K.F. New trends in the practical deployment of industrial wireless: From noncritical to critical use cases. IEEE Ind. Electron. Mag. 2018, 12, 50–58. [Google Scholar] [CrossRef]
- Park, P.; Ergen, S.C.; Fischione, C.; Lu, C.; Johansson, K.H. Wireless Network Design for Control Systems: A Survey. IEEE Commun. Surv. Tutor. 2018, 20, 978–1013. [Google Scholar] [CrossRef]
- Li, X.; Li, D.; Wan, J.; Vasilakos, A.V.; Lai, C.-F.; Wang, S. A review of industrial wireless networks in the context of Industry 4.0. Wirel. Netw. 2017, 23, 23–41. [Google Scholar] [CrossRef]
- Bartolomeu, P.; Alam, M.; Ferreira, J.; Fonseca, J. Survey on low power real-time wireless MAC protocols. J. Netw. Comput. Appl. 2016, 75, 293–316. [Google Scholar] [CrossRef]
- Watteyne, T.; Adjih, C.; Vilajosana, X. Lessons learned from large-scale dense IEEE802.15.4 connectivity traces. In Proceedings of the IEEE International Conference on Automation Science and Engineering, Gothenburg, Sweden, 24–28 August 2015; pp. 145–150. [Google Scholar]
- Calvo, I.; Barambones, O.; Chouza, A.; Abrahams, S.; Beckers, G.; Slechten, D.; Velasco, J. Building Wireless Control Applications with XBee and LabVIEW. Appl. Sci. 2019, 9, 2379. [Google Scholar] [CrossRef] [Green Version]
- Froiz-Míguez, I.; Fernández-Caramés, T.M.; Fraga-Lamas, P.; Castedo, L. Design, implementation and practical evaluation of an IoT home automation system for fog computing applications based on MQTT and ZigBee-WiFi sensor nodes. Sensors 2018, 18, 2660. [Google Scholar] [CrossRef] [PubMed] [Green Version]
- Raposo, D.; Rodrigues, A.; Sinche, S.; Silva, J.S.; Boavida, F. Industrial IoT monitoring: Technologies and architecture proposal. Sensors 2018, 18, 3568. [Google Scholar] [CrossRef] [Green Version]
- Raza, S.; Faheem, M.; Guenes, M. Industrial wireless sensor and actuator networks in industry 4.0: Exploring requirements, protocols, and challenges—A MAC survey. Int. J. Commun. Syst. 2019, 32, 4074. [Google Scholar] [CrossRef]
- Ergen, S.C.; Varaiya, P. TDMA scheduling algorithms for wireless sensor networks. Wirel. Netw. 2010, 16, 985–997. [Google Scholar] [CrossRef] [Green Version]
- Li, T.; Abe, H.; Tateno, S.; Hachiya, Y. Comparison of wireless communication technologies in remote monitoring systems. In Proceedings of the International Conference on Control, Automation and Systems, Daegwallyeong, Korea, 17–20 October 2018; pp. 591–595. [Google Scholar]
- Devan, P.A.M.; Hussin, F.A.; Ibrahim, R.; Bingi, K.; Khanday, F.A. A Survey on the Application of WirelessHART for Industrial Process Monitoring and Control. Sensors 2021, 21, 4951. [Google Scholar] [CrossRef]
- Dobrilovic, D.; Brtka, V.; Stojanov, Z.; Jotanovic, G.; Perakovic, D.; Jausevac, G. A Model for Working Environment Monitoring in Smart Manufacturing. Appl. Sci. 2021, 11, 2850. [Google Scholar] [CrossRef]
- Tramarin, F.; Vitturi, S.; Luvisotto, M.; Zanella, A. On the Use of IEEE 802.11n for Industrial Communications. IEEE Trans. Ind. Inform. 2016, 12, 1877–1886. [Google Scholar] [CrossRef]
- Du, W.; Navarro, D.; Mieyeville, F. Performance evaluation of IEEE 802.15.4 sensor networks in industrial applications. Int. J. Commun. Syst. 2015, 28, 1657–1674. [Google Scholar] [CrossRef] [Green Version]
- Okdem, S.; Aldabash, O. Measuring IEEE 802.15.4 Protocol Performance over Embedded Control Systems. In Proceedings of the International Conference on Artificial Intelligence and Data Processing Symposium, Malatya, Turkey, 21–22 September 2019; pp. 1–5.
- Sahoo, P.K.; Pattanaik, S.R.; Wu, S.-L. A reliable data transmission model for IEEE 802.15.4e enabled wireless sensor network under wifi interference. Sensors 2017, 17, 1320. [Google Scholar] [CrossRef] [Green Version]
- De Guglielmo, D.; Brienza, S.; Anastasi, G. IEEE 802.15.4e: A survey. Comput. Commun. 2016, 88, 1–24. [Google Scholar] [CrossRef]
- De Guglielmo, D.; Al Nahas, B.; Duquennoy, S.; Voigt, T.; Anastasi, G. Analysis and Experimental Evaluation of IEEE 802.15.4e TSCH CSMA-CA Algorithm. IEEE Trans. Veh. Technol. 2017, 66, 1573–1588. [Google Scholar] [CrossRef]
- Koutsiamanis, R.A.; Papadopoulos, G.Z.; Fafoutis, X.; Del Fiore, J.M.; Thubert, P.; Montavont, N. From Best Effort to Deterministic Packet Delivery for Wireless Industrial IoT Networks. IEEE Trans. Ind. Inform. 2018, 14, 4468–4480. [Google Scholar] [CrossRef] [Green Version]
- Hassan, S.M.; Ibrahim, R.; Bingi, K.; Chung, T.D.; Saad, N. Application of Wireless Technology for Control: A WirelessHART Perspective. Procedia Comput. Sci. 2017, 105, 240–247. [Google Scholar] [CrossRef]
- Sha, M.; Gunatilaka, D.; Wu, C.; Lu, C. Empirical Study and Enhancements of Industrial Wireless Sensor—Actuator Network Protocols. IEEE Internet Things J. 2017, 4, 696–704. [Google Scholar] [CrossRef]
- Yang, D.; Ma, J.; Xu, Y.; Gidlund, M. Safe-WirelessHART: A novel framework enabling safety-critical applications over industrial WSNs. IEEE Trans. Ind. Inform. 2018, 14, 3513–3523. [Google Scholar] [CrossRef]
- de Souza, R.W.R.; Moreira, L.R.; Rodrigues, J.J.P.C.; Moreira, R.R.; de Albuquerque, V.H.C. Deploying wireless sensor networks—Based smart grid for smart meters monitoring and control. Int. J. Commun. Syst. 2018, 31, e3557. [Google Scholar] [CrossRef]
- Alfergani, A.; Khalil, A.; Rajab, Z. Networked control of AC microgrid. Sustain. Cities Soc. 2018, 37, 371–387. [Google Scholar] [CrossRef]
- Medina-García, J.; Martín, A.D.; Cano, J.M.; Gómez-galán, J.A.; Hermoso, A. Efficient wireless monitoring and control of a grid-connected photovoltaic system. Appl. Sci. 2021, 11, 2287. [Google Scholar] [CrossRef]
- Shareef, H.; Al-Hassan, E.; Sirjani, R. Wireless home energy management system with smart rule-based controller. Appl. Sci. 2020, 10, 4533. [Google Scholar] [CrossRef]
- Baqer, N.K.; Al-Modaffer, A.M.; AlKaldy, E.A. A study of delay and data traffic of IEEE 802.15.4 ZigBee-Based WSN in a smart home. Int. J. Adv. Sci. 2018, 8, 956–962. [Google Scholar] [CrossRef]
- Cheng, Y.; Fang, C.; Yuan, J.; Zhu, L. Design and application of a smart lighting system based on distributed wireless sensor networks. Appl. Sci. 2020, 10, 8545. [Google Scholar] [CrossRef]
- Luo, C.; Mohsenimanesh, A.; Laguë, C. Parallel point-to-point tracking for agricultural Wide-Span Implement Carrier (WSIC). Comput. Electron. Agric. 2018, 153, 302–312. [Google Scholar] [CrossRef]
- Tagarakis, A.C.; Kateris, D.; Berruto, R.; Bochtis, D. Low-Cost Wireless Sensing System for Precision Agriculture Applications in Orchards. Appl. Sci. 2021, 11, 5858. [Google Scholar] [CrossRef]
- Dalef, H.H.; Aziz, F.A.; Hasan, W.Z.W.; Ariffin, M.K.A.M. Development of wireless controlling and monitoring system for robotic hand using Zigbee protocol. J. Comput. Theor. Nanosci. 2018, 15, 656–662. [Google Scholar] [CrossRef]
- Sivatharun, A.; Haripriya, D. Hand gesture controlled vehicle using accelerometer with the help of zigbee pairs. Int. J. Eng. Adv. Technol. 2018, 7, 127–130. [Google Scholar]
- Gogolák, L.; Fürstner, I. Wireless sensor network aided assembly line monitoring according to expectations of industry 4.0. Appl. Sci. 2021, 11, 1–18. [Google Scholar]
- Sabry, A.H.; Nordin, F.H.; Sabry, A.H.; Abidin Ab Kadir, M.Z. Fault Detection and Diagnosis of Industrial Robot Based on Power Consumption Modeling. IEEE Trans. Ind. Electron. 2020, 67, 7929–7940. [Google Scholar] [CrossRef]
- Heykants, R.; Hodgson, J.; Campbell, R.; Leblanc, N. Applying wireless communications technology to industrial trace heating. In Proceedings of the IEEE Petroleum and Chemical Industry Committee Conference (PCIC), Vancouver, BC, Canada, 9–12 September 2019; pp. 109–120. [Google Scholar]
- Xiang, C.; Li, B. Research on ship intelligent manufacturing data monitoring and quality control system based on industrial Internet of Things. Int. J. Adv. Manuf. Tech. 2020, 107, 983–992. [Google Scholar] [CrossRef]
- Siddheswar, S.; Biplab, S.; Uma, D. Design of wireless sensor node to measure vibration and environment parameter for structural health monitoring application. Adv. Intell. Syst. Comput. 2015, 343, 59–65. [Google Scholar]
- Wu, F.; Rüdiger, C.; Yuce, M.R. Real-time performance of a self-powered environmental IoT sensor network system. Sensors 2017, 17, 282. [Google Scholar] [CrossRef] [PubMed] [Green Version]
- Xie, P.; French, G.; O’Ríordáin, S.; Kennedy, N.; Edwards-Murphy, F.; Leahy, P.; Popovici, E. Sensing wind for environmental and energy applications. In Proceedings of the 25th IET Irish Signals & Systems Conference and 2014 China-Ireland International Conference on Information and Communications Technologies, Limerick, Ireland, 26–27 June 2014; pp. 64–69. [Google Scholar]
- Olasupo, T.O. Wireless Communication Modeling for the Deployment of Tiny IoT Devices in Rocky and Mountainous Environments. IEEE Sens. Lett. 2019, 3, 1–4. [Google Scholar] [CrossRef]
- Lin, K.-F.; Lin, S.-S.; Hung, M.-H.; Kuo, C.-H.; Chen, P.-N. An embedded gateway with communication extension and backup capabilities for ZigBee-based monitoring and control systems. Appl. Sci. 2019, 9, 456. [Google Scholar] [CrossRef] [Green Version]
- Lian, K.-Y.; Hsiao, S.-J.; Sung, W.-T. Intelligent multi-sensor control system based on innovative technology integration via ZigBee and Wi-Fi networks. J. Netw. Comput. Appl. 2013, 36, 756–767. [Google Scholar] [CrossRef]
- Almeida, L.; Pedreiras, P.; Fonseca, J.A.G. The FTT-CAN protocol: Why and how. IEEE Trans. Ind. Electron. 2002, 49, 1189–1201. [Google Scholar] [CrossRef]
- Pedreiras, P.; Gai, P.; Almeida, L.; Buttazzo, G.C. FTT-Ethernet: A flexible real-time communication protocol that supports dynamic QoS management on ethernet-based systems. IEEE Trans. Ind. Inform. 2005, 1, 162–172. [Google Scholar] [CrossRef]
- Noguero, A.; Calvo, I.; Pérez, F.; Almeida, L. FTT-MA: A Flexible Time-Triggered Middleware Architecture for Time Sensitive, Resource-Aware AmI Systems. Sensors 2013, 13, 6229–6253. [Google Scholar] [CrossRef] [PubMed] [Green Version]


Publisher’s Note: MDPI stays neutral with regard to jurisdictional claims in published maps and institutional affiliations. |
© 2021 by the authors. Licensee MDPI, Basel, Switzerland. This article is an open access article distributed under the terms and conditions of the Creative Commons Attribution (CC BY) license (https://creativecommons.org/licenses/by/4.0/).