Article

Fault Detection for Pitch System of Wind Turbine-Driven Doubly Fed Based on IHHO-LightGBM

1
School of Energy and Power Engineering, Changsha University of Science & Technology, Changsha 410114, China
2
Hubei Key Laboratory of Power System Design and Test for Electrical Vehicle, Hubei University of Arts and Science, Xiangyang 441053, China
*
Author to whom correspondence should be addressed.
Appl. Sci. 2021, 11(17), 8030; https://doi.org/10.3390/app11178030
Submission received: 12 August 2021 / Revised: 24 August 2021 / Accepted: 24 August 2021 / Published: 30 August 2021
(This article belongs to the Special Issue Reliability Theory and Applications in Complicated and Smart Systems)

Abstract

:
To address the issue of a large calculation and difficult optimization for the traditional fault detection of a wind turbine-based pitch control system, a fault detection model, based on LightGBM by the improved Harris Hawks optimization algorithm (light gradient boosting machine by the improved Harris Hawks optimization, IHHO-LightGBM) for the wind turbine-based pitch control system, is proposed in this article. Firstly, a trigonometric function model is introduced by IHHO to update the prey escape energy, to balance the global exploration ability and local development ability of the algorithm. In this model, the fault detection false alarm rate is used as the fitness function, and the two parameters are used as the optimization objects of the improved Harris Hawks optimization algorithm, to optimize the parameters, so as to achieve the global optimal parameters to improve the performance of the fault detection model. Three different fault data of the pitch control system in actual operations of domestic wind farms are used as the experimental data, the Pearson correlation analysis method is introduced, and the wind turbine power output is taken as the main state parameter, to analyze the correlation degree of all the characteristic variables of the data and screen the important characteristic variables out, so as to achieve the effective dimensionality reduction process of the data, by using the feature selection method. Three established fault detection models are selected and compared with the proposed method, to verify its feasibility. The experimental data indicate that compared with other algorithms, the fault detecting ability of the proposed model is improved in all aspects, and the false alarm rate and false negative rate are lower.

1. Introduction

In recent years, governments of various countries increased the investment in the wind power industry, when the concepts of carbon neutrality and carbon peaking were put forward one after another, which led to the sharp decline in wind energy cost and the rapid development of wind energy [1]. The GWEC (Global Wind Energy Council) predicted, in its report, that 2021 will become a record year for the wind energy industry, and it is estimated that 78 GW of wind energy will be added in 2021 [2]. Moreover, by the end of 2024, the newly installed capacity on land and at sea is expected to reach 348 GW, and the cumulative installed capacity of wind power will reach nearly 1000 GW. However, the sustainable development of the wind power industry is facing a very serious problem, that is, the cost per unit of wind power energy output is higher than that per unit of fossil fuels. Therefore, in the field of new energy, it is necessary to reduce the high operation and maintenance costs, while ensuring the safe operation of wind turbines.
Wind turbines are prone to failure when running in a complex environment. The pitch control system, one of the most important components of the wind turbine, is also the component with the highest failure rate [3]. The pitch control system consists of the hub and blade, which changes the angle of attack of the blade to adjust the power [4]. The changeable external wind conditions and the complex internal system structure of the pitch control system are prone to lead to abnormal output power, blade damage, and even unit collapse, resulting in a high occurrence rate of pitch motor failure and pitch bearing failure. Failure of pitch bearing would cause the machine to stop [5]. Pitch misalignment could cause performance worsening, undesired rotor loads, and severe damage of the turbine [6,7,8]. Once the propeller system fails, the downtime will be prolonged and the reliability of the wind turbine will be reduced, which will cause serious production losses [9].
The methods of wind turbine fault detection can be categorized in two ways, the model-based method [10] and the data-driven method [11]. Model-based fault detection technology has been applied in much research [12,13]. The commonly used model-based fault detection methods in industry mainly contain the equivalent space method [14], parameter estimation method [15], state estimation method [16], etc. The biggest disadvantage of the model-based method is its low robustness, which depends on the current dynamic parameters of wind turbines and does not have universality. With the rise in machine learning, the data-driven method is widely used. This method uses signal processing, feature extraction, and machine learning-related knowledge to detect wind turbine faults. The data-driven method has high accuracy and good robustness. Since it does not require precise modeling, it can be freely applied to other wind turbines. The data-driven method can make use of a huge amount of offline data stored in the SCADA system [17], and the accuracy of the data-driven fault detection model will also improve with the increase in data volume. Therefore, data-driven methods have also received more attention. Through the early fault diagnosis of the pitch system, the operator can take a more active maintenance strategy [18]. At present, many mature data-driven fault detection methods have been put into practice. This topic will also focus on the data-driven wind turbine fault detection method.
SVM [19] is an enduring statistical learning theory-based machine learning method. The generalization capability of the SVM is heightened by reducing the structural risk of the model, and the empirical risk and confidence range are minimized, thus achieving the purpose of obtaining good statistical laws under the condition of a small statistical sample size. The algorithm of SVM is more efficient and can fit the data effectively. In regards to the large-scale wind turbine fault diagnosis, there is also much research around SVM-based fault detection methods. A multi-sensory system based on SVM is proposed by Santos, P. et al. [20], which achieved good results in wind turbine misalignment and imbalance faults. Agasthian, A. [21] optimized SVM by using the cuckoo algorithm, which can address the problem of the poor detection performance of SVM, when multiple faults occur. Pandit, R.K. et al. [22] applied SVM to wind turbine power curve modeling, to evaluate the performance of wind turbines. In this study, the advantages and disadvantages of the proposed nonparametric technology are emphasized, to construct a fault detection algorithm for a wind power generation system based on the power curve. However, when faced with multidimensional data, the performance of SVM begins to decline.
Random forest [23] is easy to implement, fast to run, and shows strong performance in real-world tasks. Zhang, D.H. [24] combined random forest with XGboost, on the basis of using the most advanced wind turbine simulator FAST, which avoids the over-fitting issue of a single algorithm in multidimensional data. Jia, R. et al. [25] put forward a multi-domain characteristic fault detection device based on random forest and complex empirical mode decomposition. The fault features of signals can be effectively extracted by this method and the fault diagnosis of wind turbines can be realized with higher fault detection accuracy than traditional classification methods. Li, M.S. et al. [26] put forward an RF-based fault detecting method, which combines the short-term memory network of the residual generator with RF algorithm decision-making. The early malfunction of a machine in arduous conditions can be significantly detected by this method.
The gradient boosting decision tree is proposed by Friedman, J.H. [27], which has good robustness against nonlinear data. Cai, R. et al. [28] used XGBoost as the basis for modeling, which improves the accuracy of the wind speed forecast and the generalization ability of the model. Yuan, TK et al. implemented a stacking model based on RF, XGBoost, and GBDN, to distinguish the hitch of the gearbox, and solves the problems of traditional lifting algorithms, containing inefficiency, low accuracy, and bad timely function when processing huge amounts of engineering data of wind turbine operations.
However, the role of parameter selection in the data-driven fault detection model is not able to be ignored, and a parameter optimization algorithm is needed to reach the global optimal function model in time. In view of the significance of the class-imbalanced data, Tang, M. et al. [29] put forward a cost-sensitive large margin distribution machine. Long, W. et al. [30] proposed an improved grey wolf optimizer for high-dimensional data processing. Xue, B. et al. [31] used improved practice swarm optimization to mend the performance of multiple classifiers. Tang, M. et al. [32] optimized the LDM model by using the state transition algorithm, and achieved good classification results.
The Harris Hawks optimizer is a nature-inspired optimization algorithm. The algorithm was inspired by the team collaboration and hunting manner of the Harris eagle population in America. The algorithm not only has strong global search ability, but also has the advantage of having less parameters to be adjusted. Compared with other established meta-heuristic technologies, the HHO algorithm is also quite competitive, and will bring good performance in industrial fields.
In order to address the problem of difficult optimization for the fault detection parameters of the wind turbine-based pitch control system, a novel element-based optimization algorithm, combined with the LightGBM algorithm, is applied in this article. An improved HHO is used to select the optimal parameters of LightGBM, and a wind turbine fault detection based on LightGBM, optimized by improved HHO, is proposed to improve the fault detecting ability.

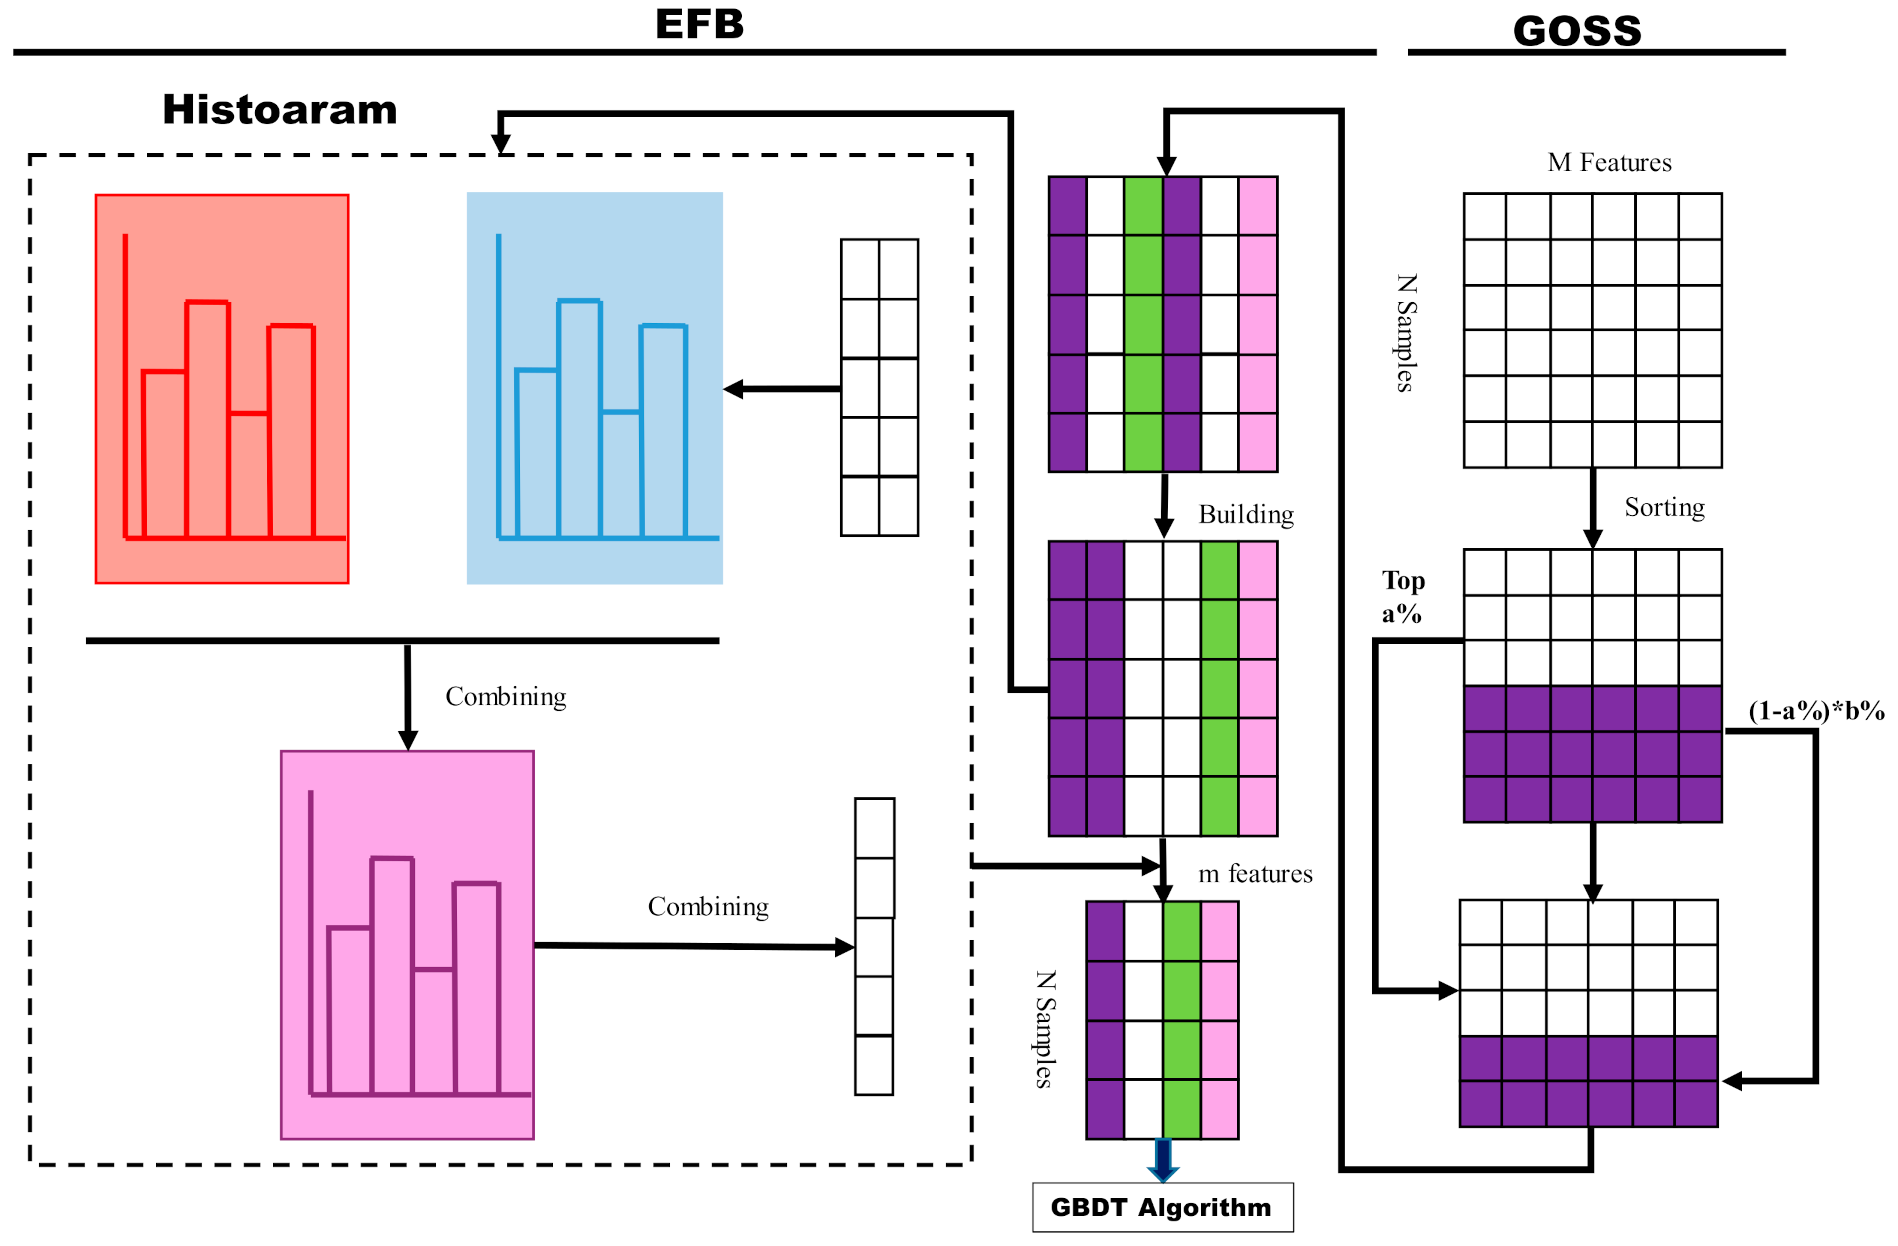
2. Light Gradient Boosting Machine

The gradient boosting decision tree (GBDT) is one of the most widely used machine learning models in industry and it aims to iteratively train the weak classifier (decision tree) [33], to achieve an optimized model with a good training effect and hardly any over-fitting. On the contrary, GBDT will take much more time to reach the same training effect when faced with massive amounts of industrial data. The original idea that was put forward by LightGBM was to improve the performance of GBDT with massive amounts of data, to make the GBDT more suitable for industrial practice.
Since the light gradient boosting machine (LightGBM) [34] was released by Microsoft Corporation in 2017, its performance has immediately attracted wide attention. LightGBM is a framework for implementing the GBDT algorithm. On the basis of XGBoost [35], LightGBM proposes a decision tree algorithm based on Hisgram, adopts gradient-based one-side sampling, uses the leaf growth strategy with depth restriction, and supports efficient parallel training, which makes LightGBM have a better training speed, less consumption, and better accuracy, making it more suitable for processing massive amounts of data. Figure 1 is a schematic diagram of a decision tree algorithm based on Hisgram, adopts GOSS. Figure 2 is a comparison of two tree growth methods.
When given a supervised learning dataset   X = X i , y i } i = 1 N , LightGBM needs to find a mapping relationship F x ^ to approximate the function F(x), to minimize the expected value of the loss function Ψ(y, F(x)).
F ^ =     argmin F E y , x Ψ ( y , F ( x ) ) ,
At this time, the regression tree t = 1 T f i x is used to approximate the final model.
F T X   =   t = 1 T f i x ,
The regression tree can be expressed in another way, which is wq(x),     1 ,   2 , , J , in which J represents the quantity of leaf nodes, q represents the decision rules of the tree, w represents the sample weight, and the objective function O b j t could be represented as follows:
O b j t = i = 1 n Ψ y i , F t 1 x i + f t x i + k Ω f k ,
where Ω f k represents a regular item.
LightGBM apply the Newton–Raphson method to quickly approach the objective function, and the following can be obtained:
O b j t i = 1 n g i f t x i + 1 2 h i f t 2 x i + k Ω f k ,
Among them,   g i ,   h i represent the loss function of first order and second order, respectively, i.e., the following:
g i = F t 1 x i Ψ ( y i , F t 1 x i ,
h i = F t 1 x i 2   Ψ ( y i , F t 1 x i ,
The sample set of leaf j can be represented by Ij, Equation (6) can be simplified as follows:
O b j t i = 1 n [ g i f t x i + 1 2 h i f t 2 x i ] + k Ω f k ,
Given the tree structure q(x), the limit value of the best weight sum w j * and L T * of each leaf node can be obtained by quadratic programming, as follows:
w j * = i I j g i i I j h i + λ ,
L T * = 1 2 j = 1 J i I j g i 2 i I j h i + λ ,
The calculation formula of gain is as follows:
G = 1 2 [ i I L g i 2 i I L h i + λ + i I R g i 2 i I R h i + λ i I g i 2 i I h i + λ ]   ,
Obviously, the LightGBM algorithm is better for processing high-latitude data than the GBDT algorithm.

3. Harris Hawks Optimizer

In 2019, Heidari, Mirjalili et al. [36] proposed a novel element-based algorithm, which was named the Harris Hawks optimizer. The HHO algorithm includes the following three main processes: search stage, transition stage, and development stage.

3.1. Search Stage

Harris eagles have a strong observation ability, which can help them track and detect preys. In HHO, the Harris eagle population is widely distributed inside. Harris eagles randomly inhabit some places to wait and monitor their preys, and to detect their preys according to two strategies. If the chance q of each habitat strategy is equal, when q < 0.5, Harris eagles will inhabit according to the position of other members and prey; when q > 0.5, Harris eagles will inhabit the big trees in the range of eagles. The specific model is as follows:
X t + 1 = X r a n d t r 1 X r a n d t 2 r 2 X t                                     q 0.5               X r a b b i t t X m t r 3 L B + r 4 U B L B       q < 0.5                       ,
where X t + 1 is the location vector of the next iteration of the Harris eagle. X r a n d t   is the location vector of the prey. X t is the location vector of the Harris eagle in the current iterative process.   Further ,   r 1 , r 2 , r 3 , r 4 , q are the random numbers within (0, 1). LB and UB are the lower bound and upper bound of variables, which specify the value range of the variables. X r a n d t means the randomly selected Harris eagle position. Additionally, X m t   represents the mean position vector. The calculation expression is represented as follows:
X m t = 1 N i = 1 N X i t   ,

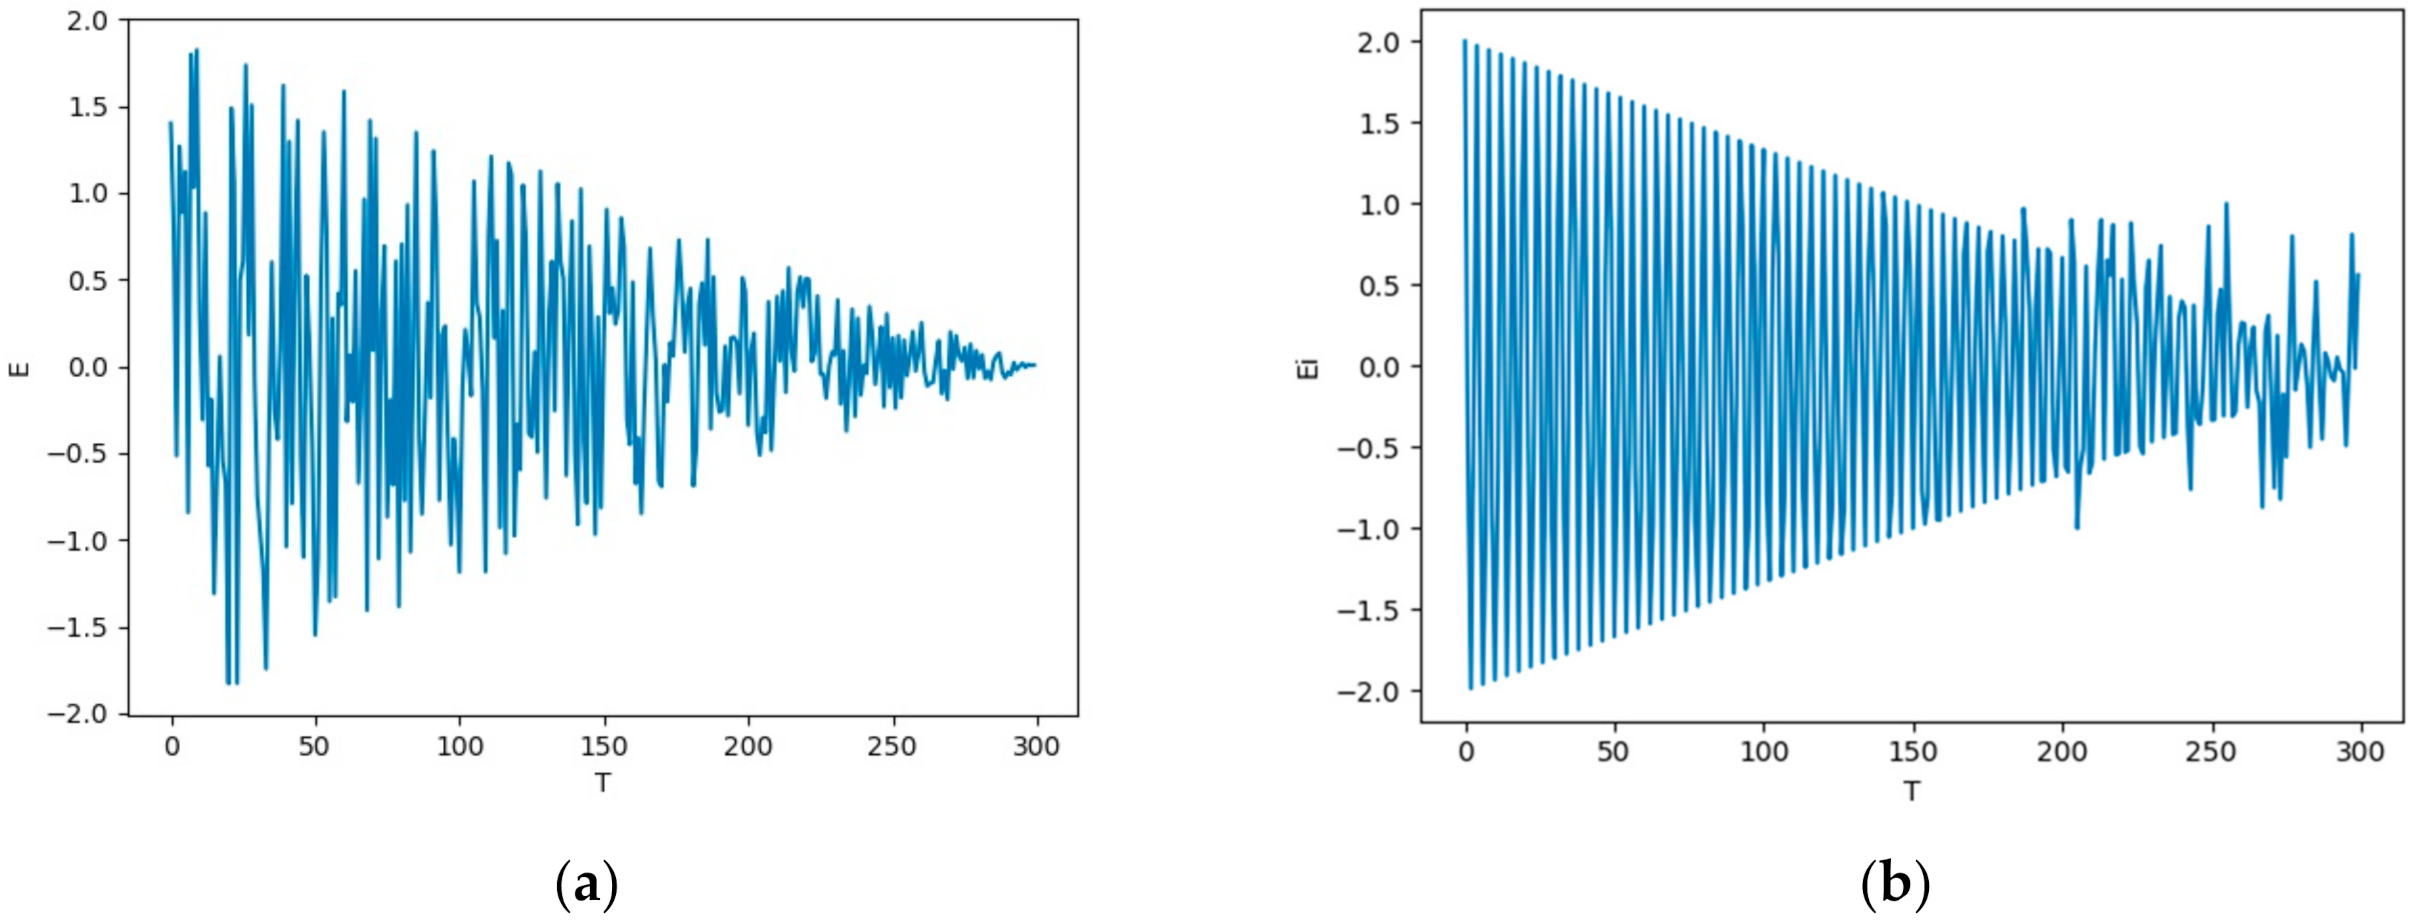
3.2. Transition Stage—Trigonometric Function Model-Based Escape Energy Strategy

The HHO algorithm transforms between searching and different development behaviors, according to the escape energy, which is defined as E, as follows:
E = 2 E 0 1 t T ,
In the original HHO algorithm, the HHO algorithm converts between searching and different development behaviors, according to the escape energy E of the prey, but the escape energy only performs a local search in the last phase of iteration, which is easy to fall into local optimization. In order to ensure a strong development ability of the algorithm and overcome the shortage of the algorithm, which can only perform a local search in the last phase, a modified updating method of escape energy E i is proposed in this paper, as follows:
E i = 2 cos π t 2 1 t T + E 0 sin π t 2 ,
Among them, T means the complete iteration times, and t means the immediate iteration times. E0 represents the incipient escape energy of the quarry. E0 is a random number at (−1, 1) with each iteration. At the time of E i > 1 , it is the search stage, and at the time of E i < 1 , it is the development stage.
It can be observed, from Figure 3, that global searching and local searching will be carried out in turn in the early stage of the iteration, and the possibility of global searching is retained on the premise of local searching in the later stage.

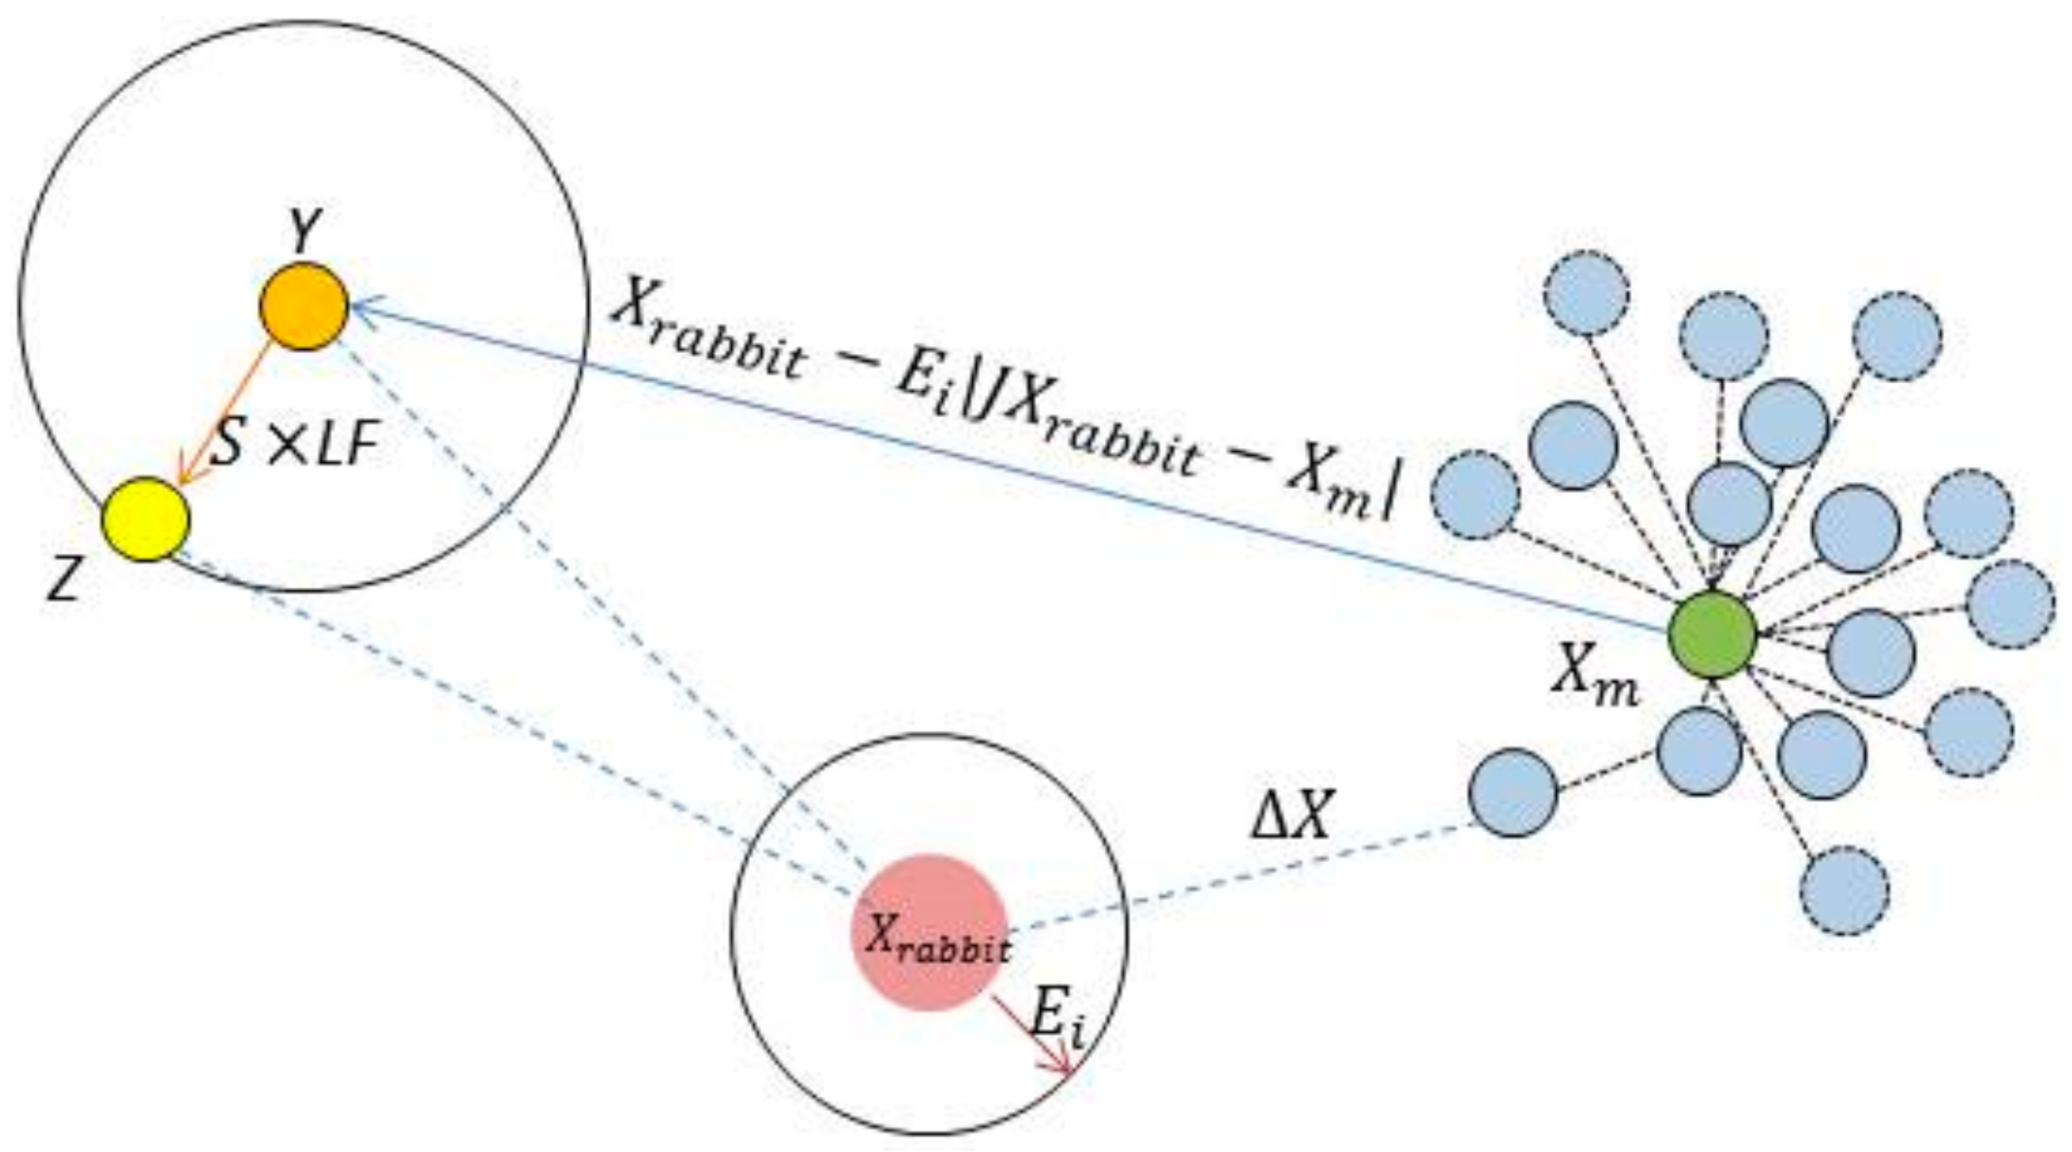
3.3. Development Stage

The development stage simulates the siege behavior and predation behavior of the Harris eagle. On the basis of success probability r and escape energy E i of the prey, the development stage is divided into four predation strategies.

3.3.1. Soft Siege

When r 0.5 and E i 0.5 , the location of the soft besiege strategy is updated according to Equation (15), as follows:
X t + 1 = Δ X t E i J X r a b b i t X t ,
Δ X t = X r t X t ,
where Δ X t is the difference between the location vector of the quarry and the position vector of the Harris eagle in the T-th iteration.   J = 2 1 r 5 indicates the distance of each stochastic jump of prey in the process of the escaper. r 5 represents a random number within (0, 1). J expresses a random number in the range of [0, 2]. This section may be divided by subheadings. It should provide a concise and precise description of the experimental results, their interpretation, as well as the experimental conclusions that can be drawn.

3.3.2. Hard Siege

When r 0.5 and E i < 0.5 , at this time, a hard besiege strategy is adopted, and the position is updated according to Equation (17), as follows:
X t + 1 = X r a b b i t t E i Δ X t ,

3.3.3. Soft Siege of Gradual Fast Dive

When r < 0.5 and E i 0.5 , it is easier for the prey to escape, so when performing a soft siege of gradual fast dive, it is necessary to form a more intelligent siege mode, and the following two strategies need to be introduced.
The first strategy update is Formula (18), as follows:
Y = X r a b b i t t E i J X r a b b i t t X t ,
The second strategy update is Formula (19), as follows:
Z = Y + S × L F D ,
Among them, D represents the problem dimension. S represents a random vector of the 1 × D dimension, LF is the Levy flight equation. Many birds in nature also follow the rule of Levy flight, which is one of the most effective methods to find targets. The expression is shown in Equation (20), as follows:
L F x = 0.01 × u × ν ν 1 β ,   σ = Γ 1 + β × sin π β 2 Γ 1 + β 2 × β × 2 β 1 2 1 β ,
where u and v are random numbers in the range, which are taken as 1.5.
Therefore, the position of the population in the soft siege of progressive rapid dive can be updated by Equation (21),   as   follows :
X t + 1 = Y             if     F Y   < F X t Z             if     F Z   < F X t   ,

3.3.4. Hard Siege of Gradual Fast Dive

When r < 0.5 and E i < 0.5 , the position at this time is updated according to Equation (22), when performing the hard besiege of the progressive rapid dive, as follows:
X t + 1 = Y             if     F Y   < F X t Z             if     F Z   < F X t ,
where the new update strategy of Y and Z is represented by Formulas (23) and (24), as follows:
Y = X r a b b i t t E J X r a b b i t t X m t ,
Z = Y + S × L F D ,
Figure 4 is the sketch map of the process of IHHO.

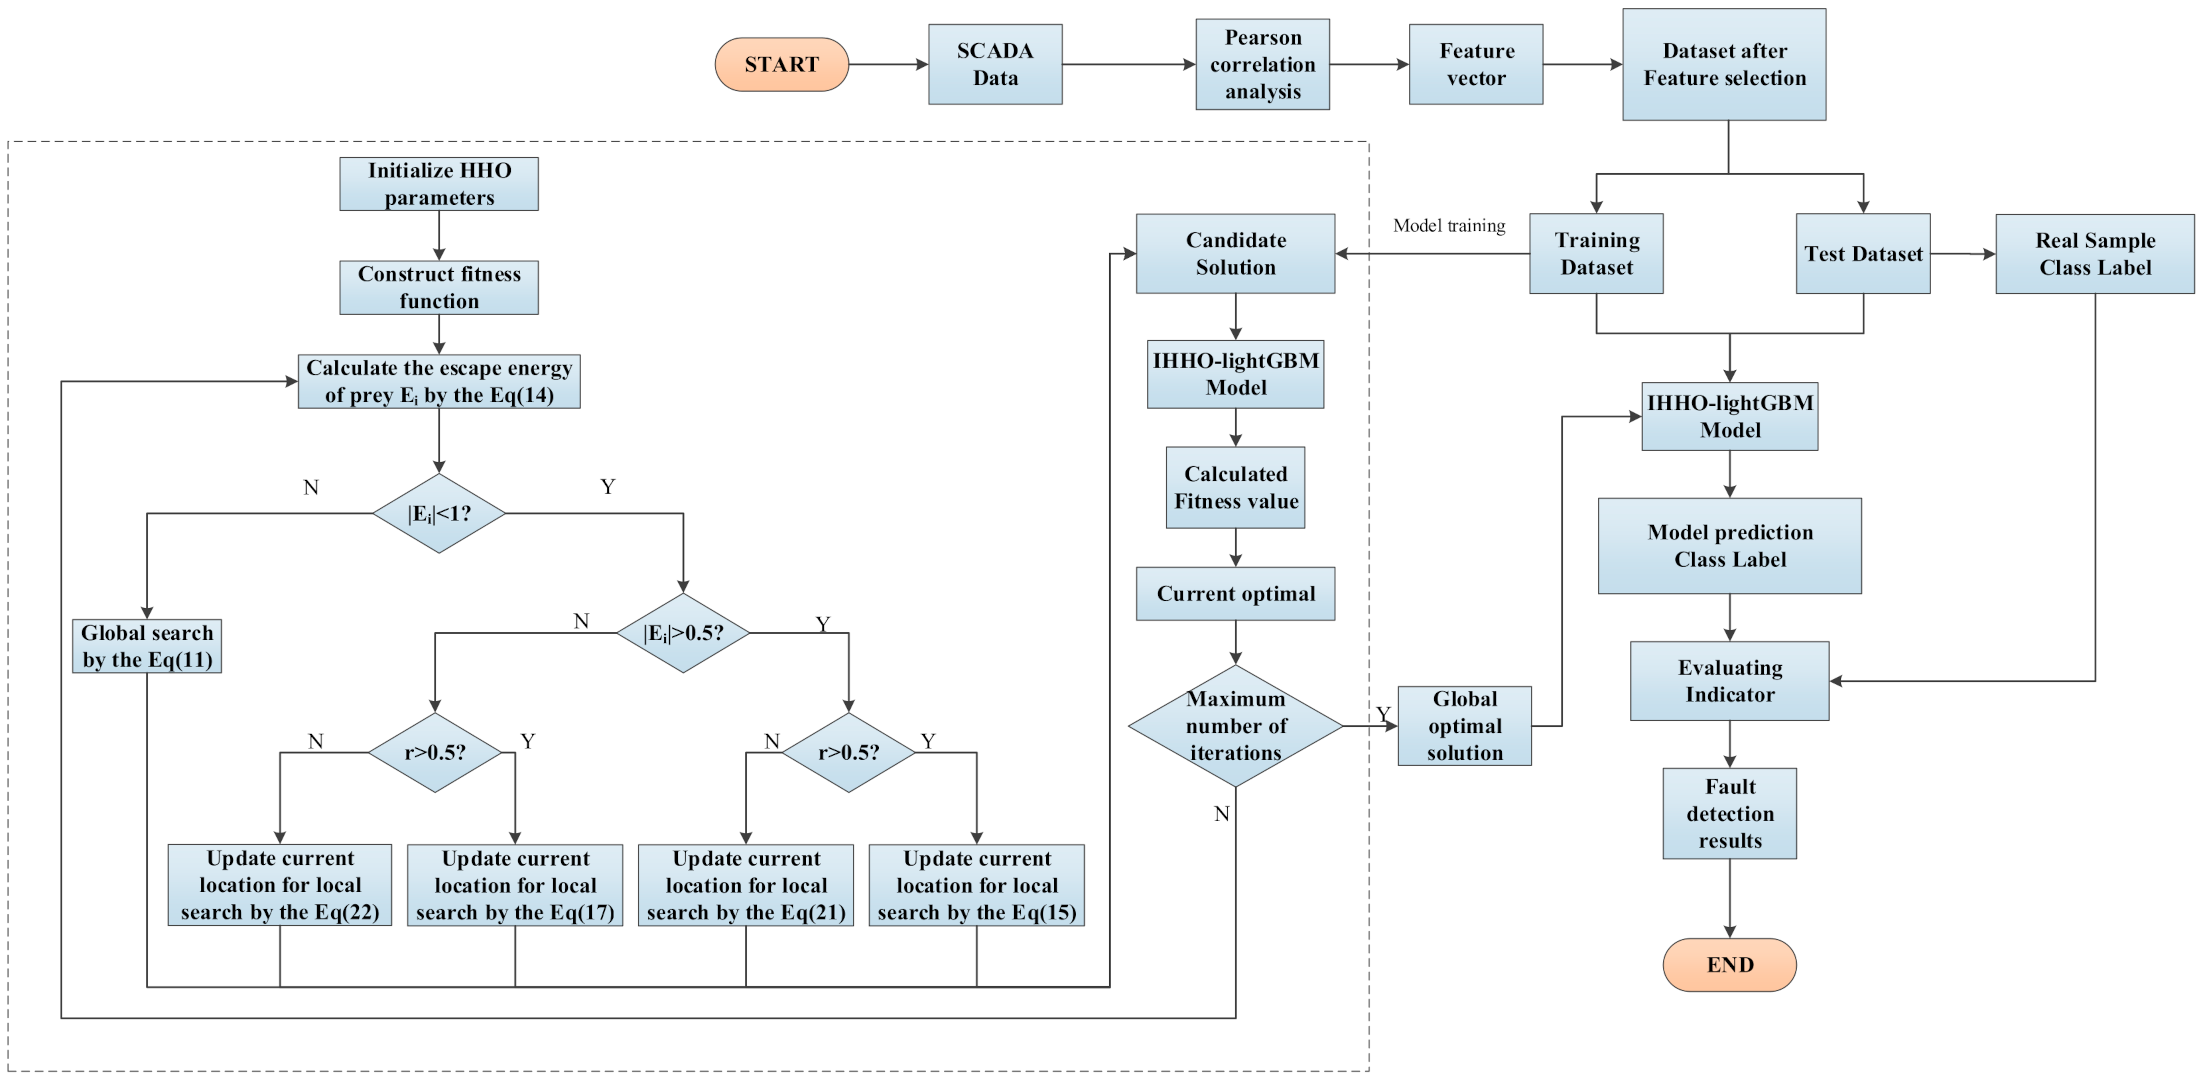
4. IHHO-LightGBM Fault Detection Model

4.1. Data Cleaning and Preprocessing

Data of the wind turbine-based pitch control system are collected by various sensors on the wind turbine, and then signals are collected by the SCADA system. However, in the process of wind turbine operation, sensors are easily affected by unstable environmental factors and their own anomalies, and the collected data will be missing and abnormal. Therefore, it is very important to clean and preprocess the data.
First, we should process the original data and delete the data which vacancy values with the status quantity of “0”.
Because the operation of the pitch system directly affects the power output of the wind turbine, the most important parameter of the pitch control system is power output. Based on the principal component analysis of wind turbine data, [37] the Pearson correlation coefficient will be used to analyze the correlation between power output, which used as the main variable, and other parameters in the process of feature selection, and the parameters with a high correlation with the pitch control system will be retained, to perform the second cleaning and processing of the data.
Figure 5 is the Fault detection flow chart of wind turbine pitch system based on improved HHO-LightGBM.

4.2. Optimization of Algorithm Flow

This experiment mainly optimizes the minimum number δ of leaf nodes and data ω on the leaves of the decision tree in the improved HHO-LightGBM model.
For the two parameters of the samples, their functions and value ranges are shown in Table 1 below:
When optimizing LightGBM with the improved Harris Hawks optimizer, the above two parameters are set as a two-dimensional vector X (t + 1) ( Δ , Ω ). The fitness of each individual is calculated during each iteration of the algorithm. If the fitness after iteration is better than the current stage, it will be replaced; otherwise, the current state vector will be abandoned and the next iteration will be carried out until the maximum iteration times are met.

4.3. Pseudo-Code of Optimization Algorithm

The IHHO-LightGBM model is as the Algorithm 1 follows:
Algorithm 1 IHHO-LightGBM algorithm
Inputs:  fitness = FAR , HHO(objf, lb, ub, dim, SearchAgents_no, Max_iter),
LightGBM( Δ , Ω )
Outputs: FAR, FNR, F1-score
1: Initialize the random population Xi(i = 1, 2, …, N)
2: while (stopping condition is not met) do
3: Calculate the fitness values of hawks
4: Set X r a b b i t as the location of rabbit (best location)
5: for (each hawk (Xi)) do
6:  Update the initial energy E0 and jump strength J
7:  Update the E i using Equation (14)
8:  if (| E i | ≥ 1) then
9:   Update the location vector using Equation (11)
10: if (| E i | < 1) then
11:   if (r ≥0.5 and | E i | ≥ 0.5) then
12:    Update the location vector using Equation (15)
13: else if (r ≥0.5 and | E i | < 0.5) then
14:    Update the location vector using Equation (17)
15: else if (r <0.5 and | E i | ≥ 0.5) then
16:    Update the location vector using Equation (21)
17: else if (r <0.5 and | E i | < 0.5) then
18:    Update the location vector using Equation (22)
19: Return X r a b b i t
20: L G B Δ , Ω   X r a b b i t  
21: L G B Δ , Ω   test   dateset
22:   Y _ p r e d L G B Δ , Ω train   dataset
23: F A R , F N R ,   F 1 s c o r e c o n f u s i o n _ m a t r i x   Y _ p r e d ,   Y _ t e s t

5. Fault Detection of Wind Turbine-Based Pitch Control System

The experimental data are yearly real-time operation data of the SCADA system, from a 1.5 MW wind turbine in a wind power plant, Inner Mongolia, and the interval is 1 min. We selected the datasets including a pitch control emergency stop fault, pitch control motor fault, and pitch control power supply alarm. The data of a wind turbine in the wind farm in a certain month are selected, from 30 min before the wind turbine pitch failure begins to 30 min after the failure ends. The fault data structure is as Table 2:
The Original data of the wind turbine is as Table 3:

5.1. Performance Evaluation Index of Fault Detection Model

The normal state and fault state of the pitch control system are labeled as Q = [0, 1], respectively, and the dataset containing two parts. The IHHO-LightGBM algorithm is used to detect WT fault. To reasonably evaluate the effectiveness of fault detection, the false negative rate (FNR) and false alarm rate (FAR), proposed by the confusion matrix as well as the F1-score, are used as the evaluation index of fault detection. The dichotomous mixing matrix is shown in Table 4 below:
Under the second classification, the evaluation indexes of fault detection are as follows:
FNR = FN TP + FN   ,
FAR = FP TN + FP ,
Precision = TP TP + FP ,
Recall = TP TP + FN ,
F 1 score = 2 Precision Recall Precision + Recall ,
TP means the quantity of negative samples defined as negative; FN means the quantity of negative samples defined as positive; FP means the quantity of positive samples defined as negative; TN means the quantity of positive samples defined as positive.

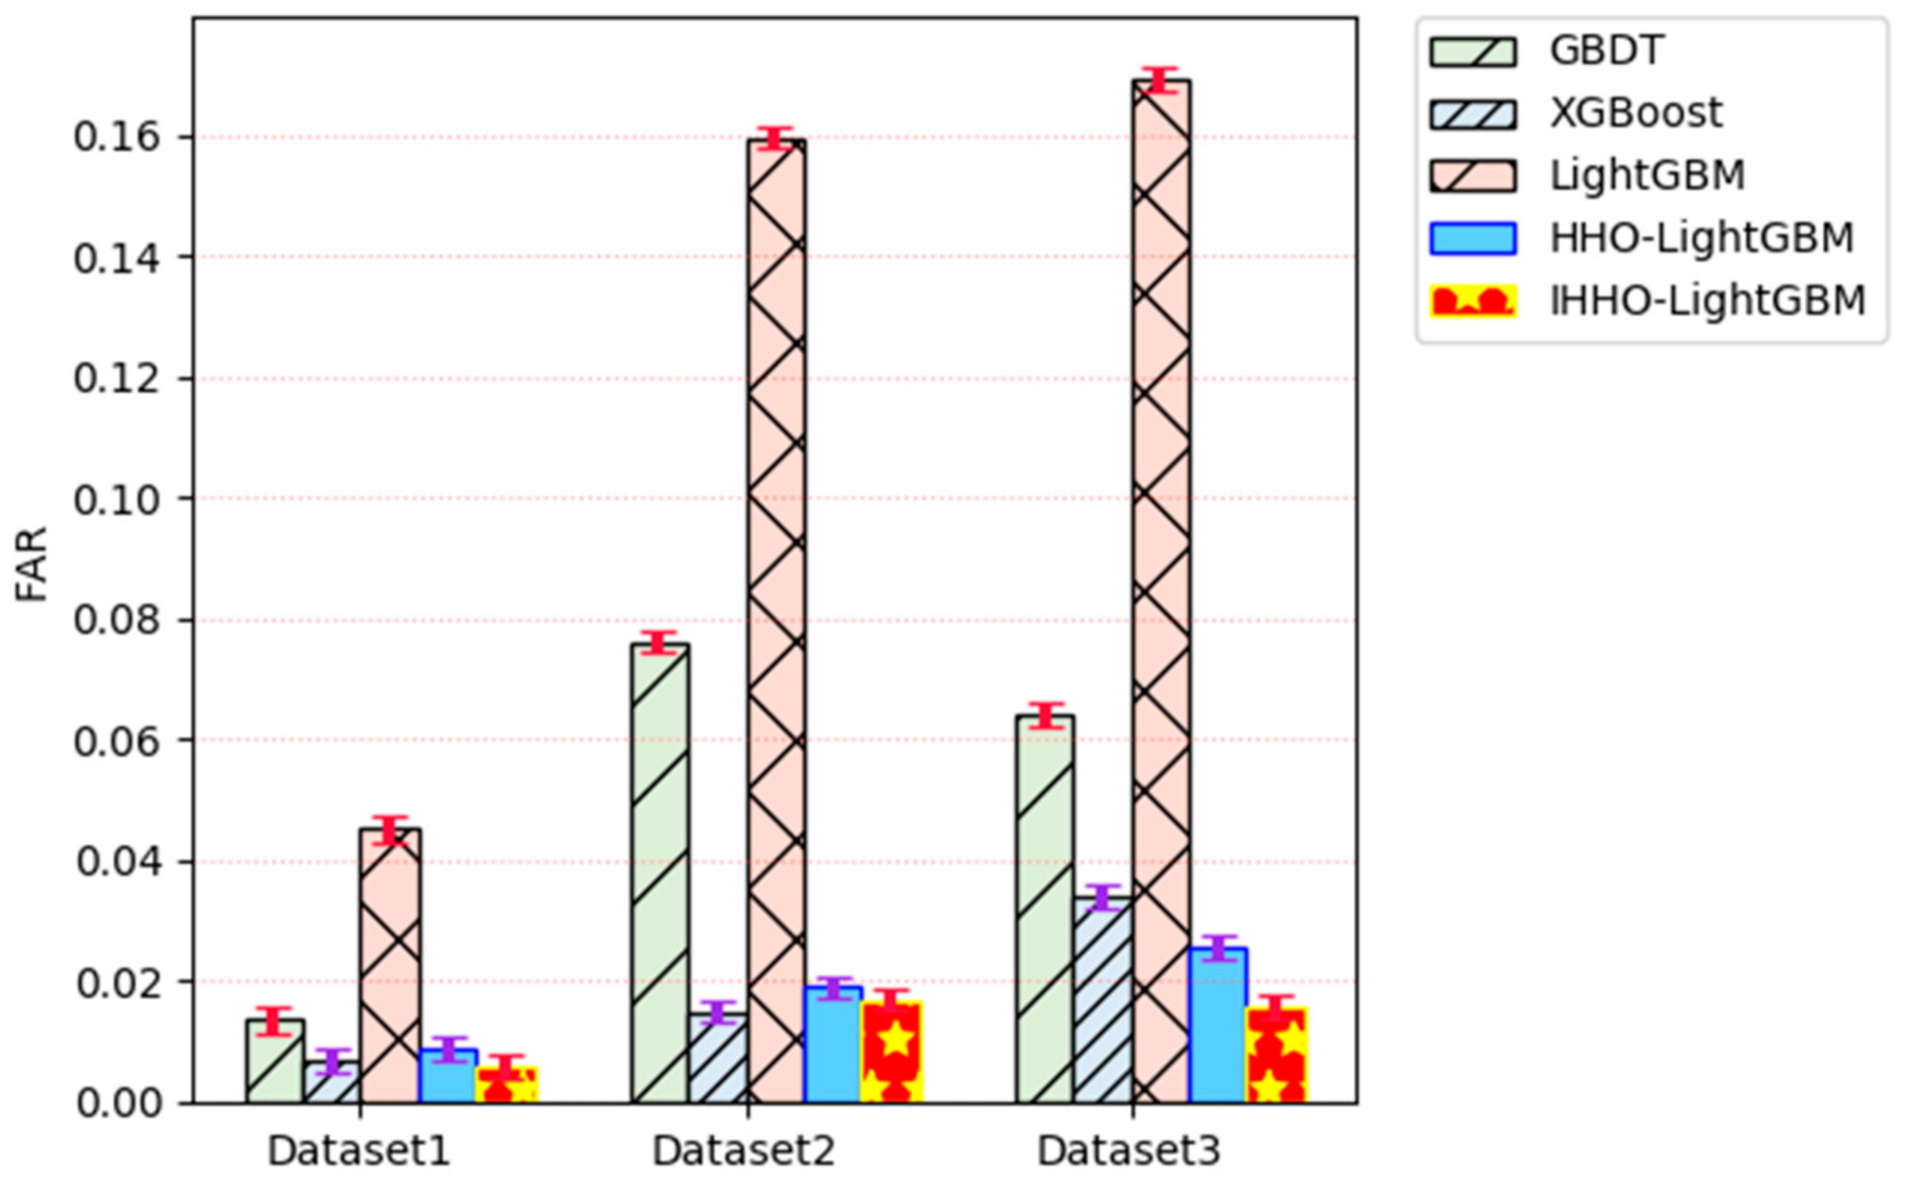
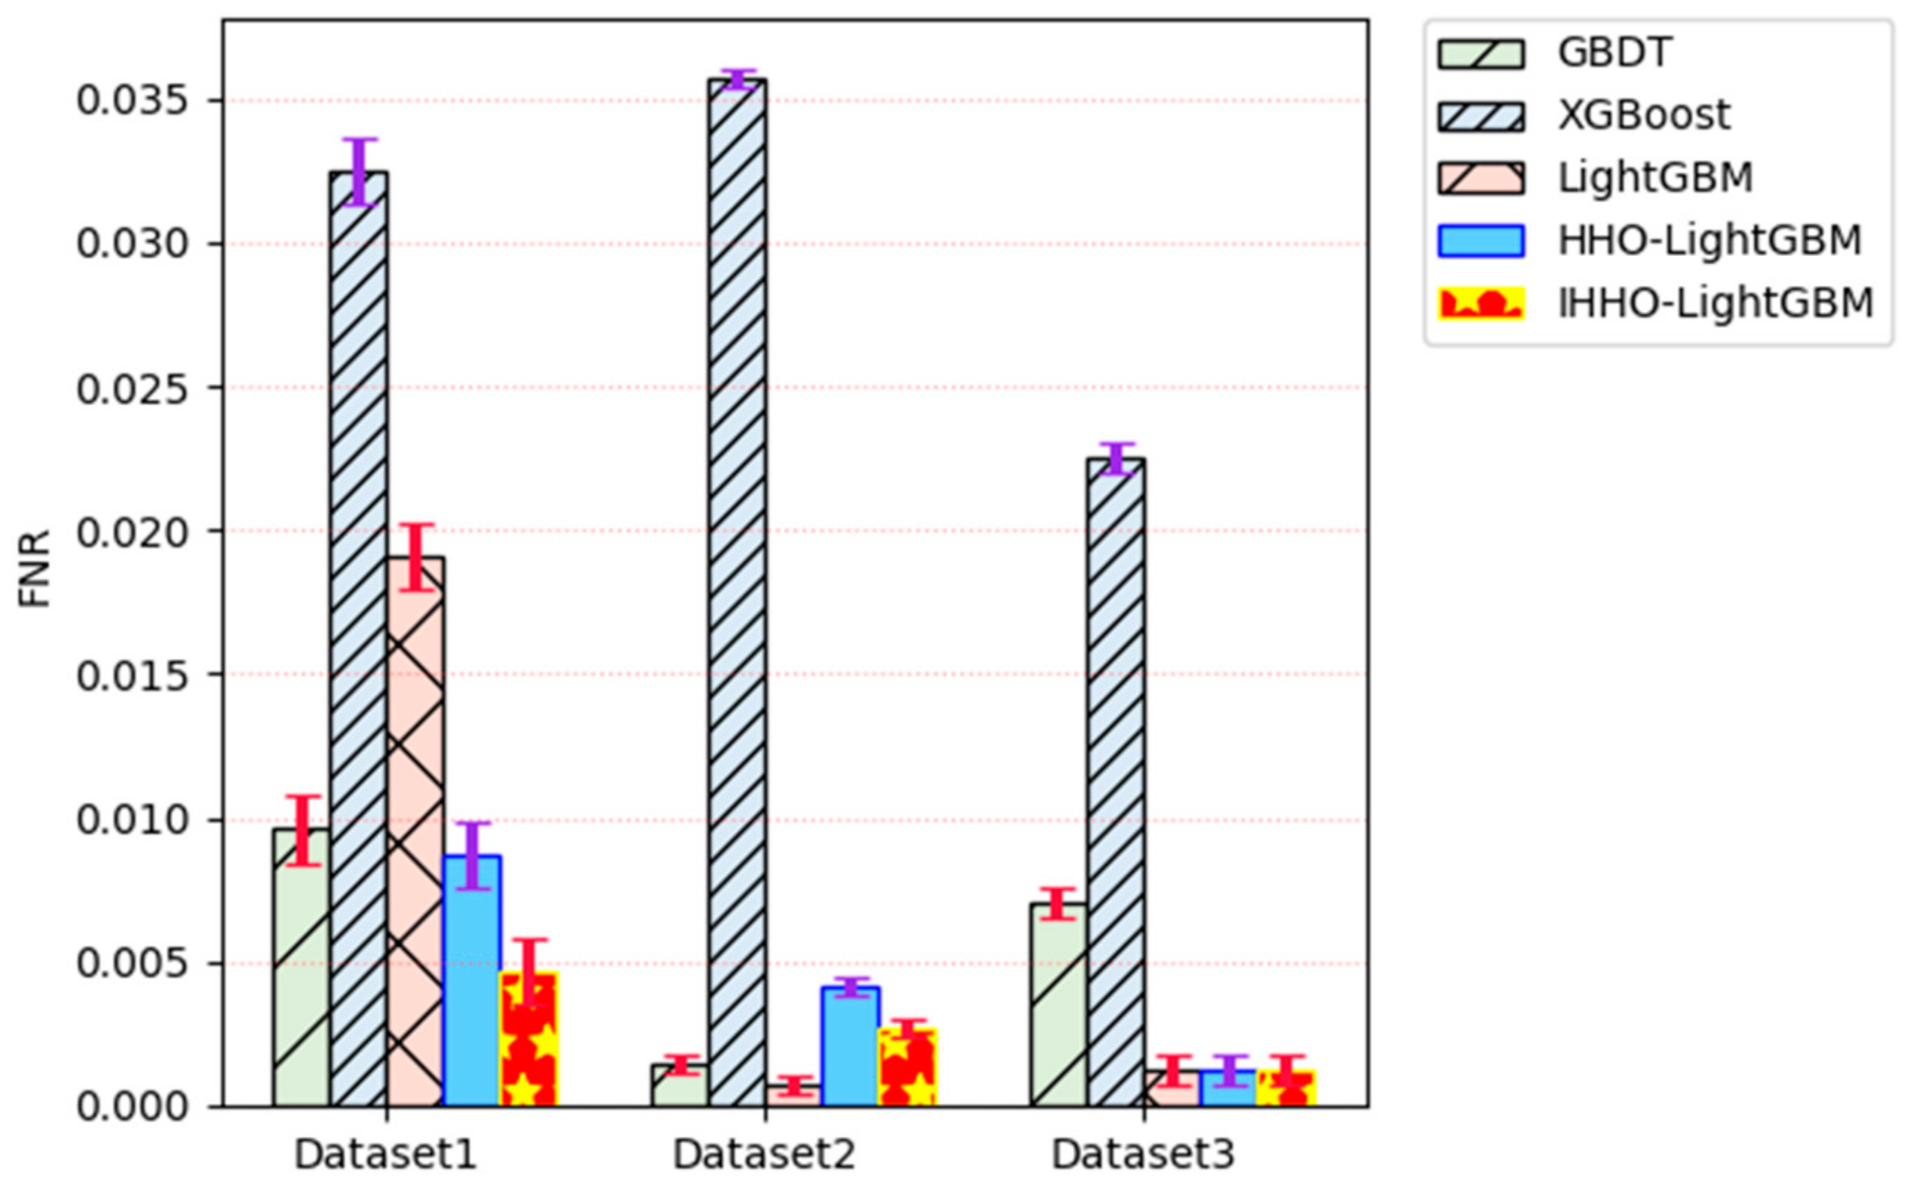
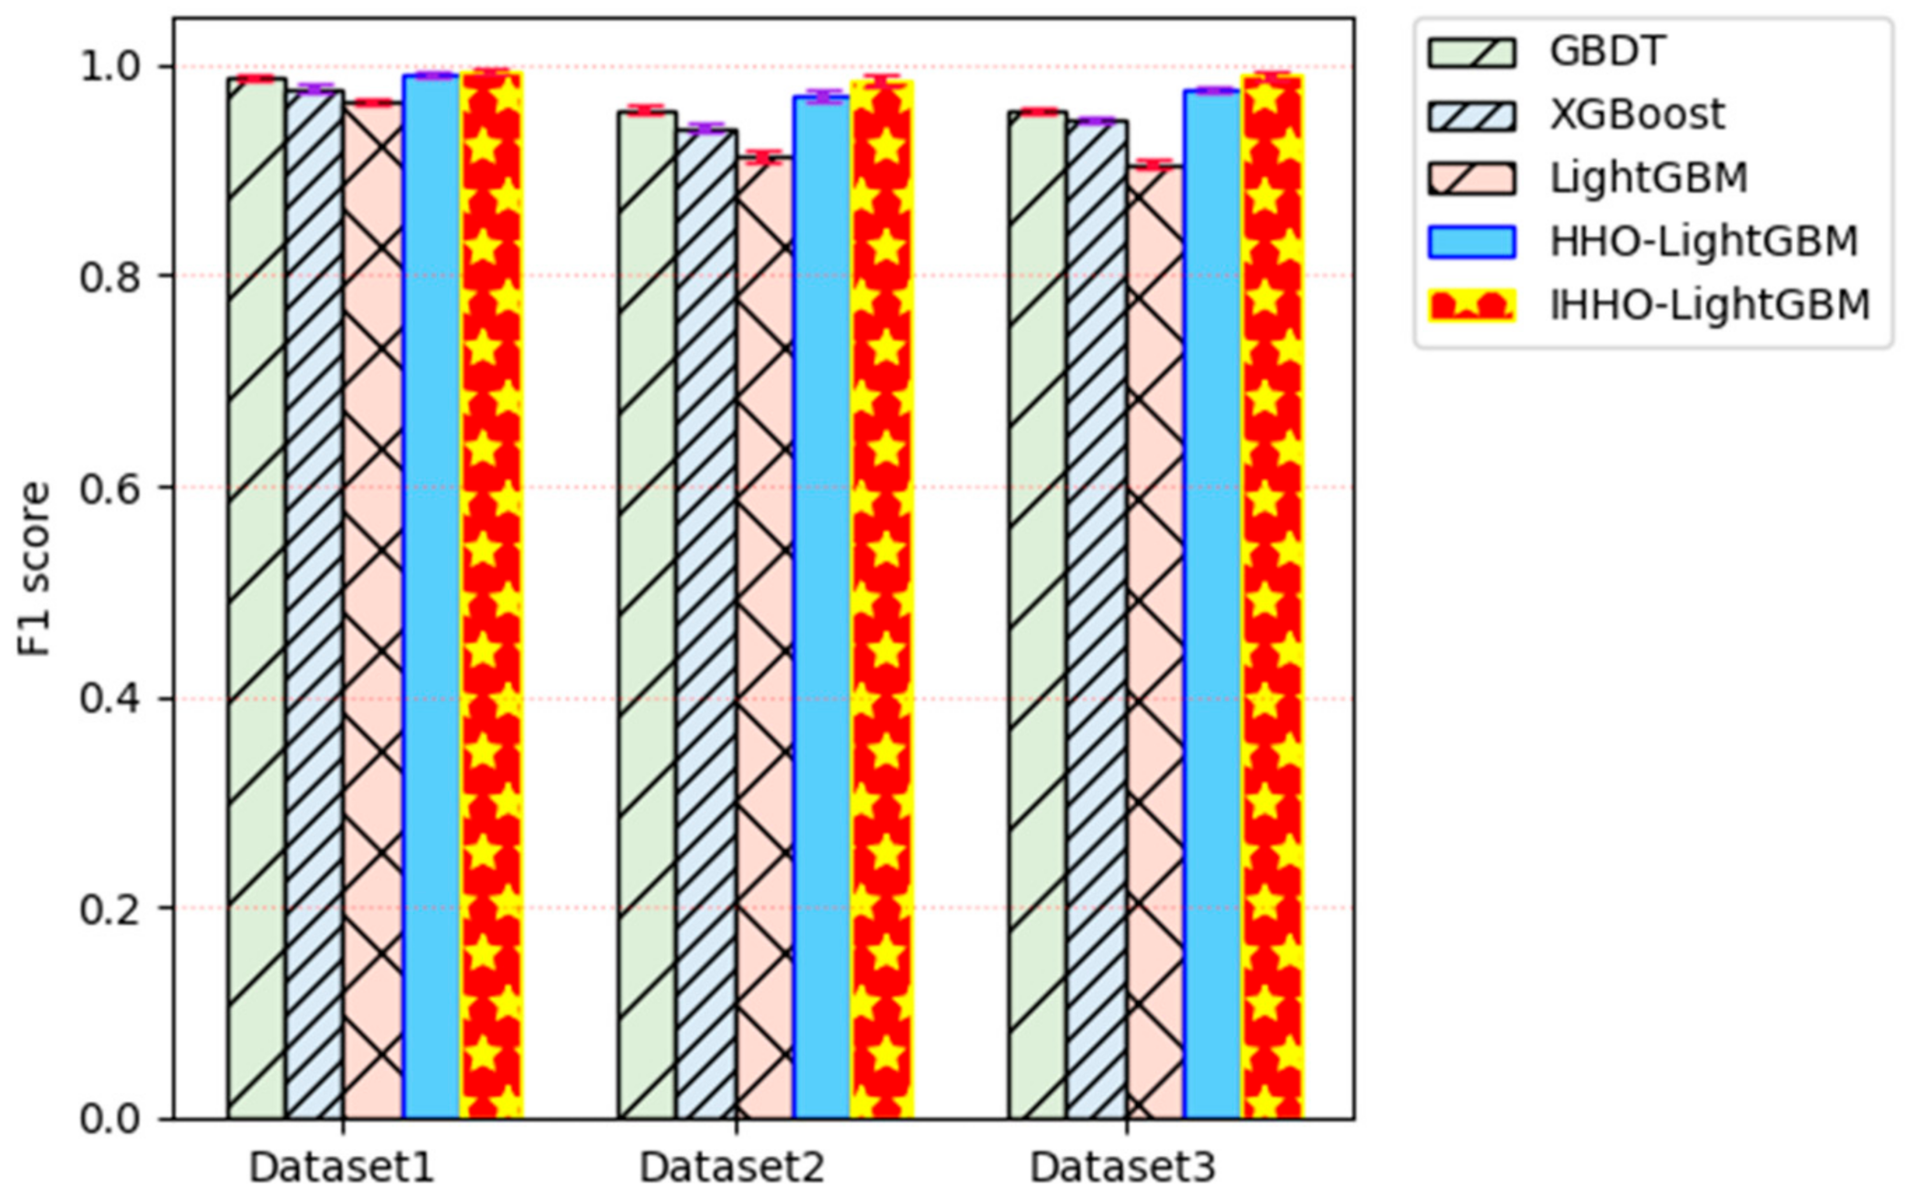
5.2. Experimental Results

To confirm the superiority of the IHHO-LightGBM in the pitch control system fault detection, yearly WT operation data of the SCADA system for a 1.5 MW wind turbine in a wind power plant in Inner Mongolia is selected, and the datasets, including pitch control emergency stop fault, pitch control motor fault, and pitch control power supply alarm, are selected from the normal working condition data of SCADA, which are recorded as dataset 1~3. To compare with the following three established fault detection methods: GBDT, XGBoost, and LightGBM, and various evaluation standards in three various datasets are employed.
The FNR and FAR of those three failure datasets are displayed in Figure 6 and Figure 7. The result showed that compared with the other three algorithms, the IHHO-LightGBM algorithm works better than the HHO-LightGBM in FAR (around 0.6~1.69%) and FNR (around 012~0.47%). The XGBoost algorithm works the worst with FNR, it reaches 3.57%, and the LightGBM algorithm works the worst with FAR, in the case of a large amount of data, it reaches 16.92%. Compared with the GBDT, XGBoost, and LightGBM algorithms, the FAR of IHHO is reduced by 0.08–15.34%, and the FNR is reduced by 0.14–3.3%.
The F1-scores of those three failure datasets are displayed by Figure 8. The F1-score is available for assessment in the case of a large amount of data. One algorithm will have a better performance when the F1-score gets closer to one. It is clear that the fault detecting ability of IHHO-LightGBM is very stable with an F1-score around 98.52~99.32%.
In conclusion, IHHO-LightGBM has shown a better FAR, FNR, and F1-score. It is found, through comparison, that the fault detecting ability of LightGBM optimized by the improved HHO algorithm is obviously improved.

6. Conclusions

In view of the difficulty in optimizing parameters, due to the multi-dimensional characteristics of the fault detection model of the wind turbine-based pitch control system, an improved HHO-LightGBM-based fault detection method is proposed, by analyzing and comparing the shortcomings of traditional algorithms. The accuracy of fault detection is improved. The innovations are mainly embodied in the works as below:
(1)
The trigonometric function model is introduced into HHO to update the prey escape energy, so as to balance the global exploration ability and local development ability of the algorithm, and to overcome the problem that the original HHO algorithm is easy to fall into local optimization;
(2)
A fault detection method of the wind turbine-based pitch control system, based on improved HHO-LightGBM, is proposed. In this model, the false alarm rate of fault detection is used as the fitness function, and two parameters of LightGBM are used as the optimization objects of the improved Harris Hawks optimization algorithm, to optimize the parameters, so as to achieve the global optimal parameters to improve the fault detection model performance and apply it to the actual fault detection of the pitch control system.
Different types of pitch control system fault samples are selected from the experimental data, and the evaluation indexes are the FNR, FAR, and F1-Score. It is shown, in the comparison results, that the improved HHO-LightGBM has significantly improved the detection performance of the multi-type pitch control system faults, and has lower FAR and FNR than the other three methods.
In the face of various unbalanced datasets, the improved HHO-LightGBM has good performance. In terms of the fault detection of wind turbines, this method can effectively reduce the fault incidence and improve the operation stability of wind turbines. At present, a single algorithm can no longer meet our demand for improving fault detecting ability, and there will be more excellent combined algorithms in the future.

Author Contributions

Writing—review and editing, conceptualization and methodology, nomenclature, M.T.; software, validation and original draft, data curation and visualization, Z.P.; writing—review and editing, H.W. All authors have read and agreed to the published version of the manuscript.

Funding

This work was supported in part by the National Natural Science Foundation of China (Grant Nos. 62173050 and 61403046), the Natural Science Foundation of Hunan Province, China (Grant No. 2019JJ40304), Changsha University of Science and Technology “The Double First Class University Plan” International Cooperation and Development Project in Scientific Research in 2018 (Grant No. 2018IC14), the Research Foundation of the Education Bureau of Hunan Province (Grant No.19K007), Hunan Provincial Department of Transportation 2018 Science and Technology Progress and Innovation Plan Project (Grant No. 201843), Energy Conservation and Emission Reduction Hunan University Student Innovation and Entrepreneurship Education Center, Innovative Team of Key Technologies of Energy Conservation, Emission Reduction and Intelligent Control for Power-Generating Equipment and System, CSUST, Hubei Superior and Distinctive Discipline Group of Mechatronics and Automobiles (XKQ2021003 and XKQ2021010), Major Fund Project of Technical Innovation in Hubei (Grant No. 2017AAA133), Graduate Scientific Research Innovation Project of Changsha University of Science & Technology (No. 2021-89).

Institutional Review Board Statement

Not applicable.

Informed Consent Statement

Not applicable.

Data Availability Statement

The data that support the findings of this study are available from the corresponding author, upon reasonable request.

Conflicts of Interest

The authors declare no conflict of interest.

References

  1. Cui, Q.; Liu, Y.; Ali, T.; Gao, J.; Chen, H. Economic and climate impacts of reducing China’s renewable electricity curtailment: A comparison between CGE models with alternative nesting structures of electricity. Energy Econ. 2020, 91, 104892. [Google Scholar] [CrossRef]
  2. Global Wind Energy Council. GWEC| GLOBAL WIND REPORT 2021. Available online: https://gwec.net/global-wind-report-2021/ (accessed on 1 March 2021).
  3. Tavner, P.; Qiu, Y.; Korogiannos, A.; Feng, Y. The correlation between wind turbine turbulence and pitch failure. In Proceedings of the European Wind Energy Conference and Exhibition, Brussels, Belgium, 14–17 March 2011; pp. 94–96. [Google Scholar]
  4. Yin, X.; Zhang, W.; Jiang, Z.; Pan, L.J.M.S.; Processing, S. Adaptive robust integral sliding mode pitch angle control of an electro-hydraulic servo pitch system for wind turbine. Mech. Syst. Signal Process. 2019, 133, 105704. [Google Scholar] [CrossRef]
  5. He, L.; Hao, L.; Qiao, W. Remote Monitoring and Diagnostics of Pitch Bearing Defects in a MW-Scale Wind Turbine Using Pitch Symmetrical-component Analysis. In Proceedings of the 2019 IEEE Energy Conversion Congress and Exposition (ECCE), Baltimore, MD, USA, 29 September–3 October 2019; pp. 1–6. [Google Scholar]
  6. Sales-Setién, E.; Peñarrocha-Alós, I. Robust estimation and diagnosis of wind turbine pitch misalignments at a wind farm level. Renew. Energy 2020, 146, 1746–1765. [Google Scholar] [CrossRef]
  7. Kusiak, A.; Verma, A. A Data-Driven Approach for Monitoring Blade Pitch Faults in Wind Turbines. IEEE Trans. Sustain. Energy 2010, 2, 87–96. [Google Scholar] [CrossRef]
  8. Astolfi, D. A Study of the Impact of Pitch Misalignment on Wind Turbine Performance. Machines 2019, 7, 8. [Google Scholar] [CrossRef] [Green Version]
  9. Pérez, J.M.P.; Márquez, F.P.G.; Tobias, A.; Papaelias, M. Wind turbine reliability analysis. Renew. Sustain. Energy Rev. 2013, 23, 463–472. [Google Scholar] [CrossRef]
  10. Cho, S.; Gao, Z.; Moan, T. Model-based fault detection, fault isolation and fault-tolerant control of a blade pitch system in floating wind turbines. Renew. Energy 2018, 120, 306–321. [Google Scholar] [CrossRef]
  11. Yin, S.; Ding, S.X.; Haghani, A.; Hao, H.; Zhang, P. A comparison study of basic data-driven fault diagnosis and process monitoring methods on the benchmark Tennessee Eastman process. J. Process. Control 2012, 22, 1567–1581. [Google Scholar] [CrossRef]
  12. Xi, L.; Wu, J.N.; Xu, Y.C.; Sun, H.B. Automatic Generation Control Based on Multiple Neural Networks With Actor-Critic Strategy. IEEE Trans. Neural Netw. Learn. Syst. 2021, 32, 2483–2493. [Google Scholar] [CrossRef]
  13. Nazir, M.; Khan, A.Q.; Mustafa, G.; Abid, M. Robust fault detection for wind turbines using reference model-based approach. J. King Saud Univ.-Eng. Sci. 2017, 29, 244–252. [Google Scholar] [CrossRef] [Green Version]
  14. Han, W.; Wang, Z.; Shen, Y. Fault estimation for a quadrotor unmanned aerial vehicle by integrating the parity space approach with recursive least squares. Proc. Inst. Mech. Eng. Part G J. Aerosp. Eng. 2018, 232, 783–796. [Google Scholar] [CrossRef]
  15. Jung, C.; Schindler, D. Wind speed distribution selection—A review of recent development and progress. Renew. Sustain. Energy Rev. 2019, 114, 13. [Google Scholar] [CrossRef]
  16. Witczak, M.; Rotondo, D.; Puig, V.; Nejjari, F.; Pazera, M. Fault estimation of wind turbines using combined adaptive and parameter estimation schemes. Int. J. Adapt. Control. Signal Process. 2018, 32, 549–567. [Google Scholar] [CrossRef]
  17. Zhao, Y.Y.; Li, D.S.; Dong, A.; Kang, D.H.; Lv, Q.; Shang, L. Fault Prediction and Diagnosis of Wind Turbine Generators Using SCADA Data. Energies 2017, 10, 1210. [Google Scholar] [CrossRef] [Green Version]
  18. Godwin, J.; Matthews, P. Classification and Detection of Wind Turbine Pitch Faults Through SCADA Data Analysis. Int. J. Progn. Health Manag. 2013, 4. [Google Scholar] [CrossRef]
  19. Vapnik, V. The Nature of Statistical Learning Theory; Springer Science & Business Media: Berlin, Germany, 2013. [Google Scholar]
  20. Santos, P.; Villa, L.F.; Renones, A.; Bustillo, A.; Maudes, J. An SVM-Based Solution for Fault Detection in Wind Turbines. Sensors 2015, 15, 5627–5648. [Google Scholar] [CrossRef] [Green Version]
  21. Agasthian, A.; Pamula, R.; Kumaraswamidhas, L.A. Fault classification and detection in wind turbine using Cuckoo-optimized support vector machine. Neural. Comput. Appl. 2019, 31, 1503–1511. [Google Scholar] [CrossRef]
  22. Pandit, R.K.; Infield, D.; Kolios, A. Comparison of advanced non-parametric models for wind turbine power curves. IET Renew. Power Gener. 2019, 13, 1503–1510. [Google Scholar] [CrossRef] [Green Version]
  23. Breiman, L. Random forests. Mach. Learn. 2001, 45, 5–32. [Google Scholar] [CrossRef] [Green Version]
  24. Zhang, D.H.; Qian, L.Y.; Mao, B.J.; Huang, C.; Huang, B.; Si, Y.L. A Data-Driven Design for Fault Detection of Wind Turbines Using Random Forests and XGboost. IEEE Access 2018, 6, 21020–21031. [Google Scholar] [CrossRef]
  25. Jia, R.; Ma, F.Q.; Dang, J.; Liu, G.Y.; Zhang, H.Z. Research on Multidomain Fault Diagnosis of Large Wind Turbines under Complex Environment. Complexity 2018, 13. [Google Scholar] [CrossRef] [Green Version]
  26. Li, M.S.; Yu, D.; Chen, Z.M.; Xiahou, K.S.; Ji, T.Y.; Wu, Q.H. A Data-Driven Residual-Based Method for Fault Diagnosis and Isolation in Wind Turbines. IEEE Trans. Sustain. Energy 2019, 10, 895–904. [Google Scholar] [CrossRef]
  27. Friedman, J.H. Greedy function approximation: A gradient boosting machine. Ann. Stat. 2001, 29, 1189–1232. [Google Scholar] [CrossRef]
  28. Cai, R.; Xie, S.; Wang, B.Z.; Yang, R.J.; Xu, D.S.; He, Y. Wind Speed Forecasting Based on Extreme Gradient Boosting. IEEE Access 2020, 8, 175063–175069. [Google Scholar] [CrossRef]
  29. Tang, M.; Ding, S.X.; Yang, C.; Cheng, F.; Shardt, Y.A.W.; Long, W.; Liu, D. Cost-sensitive large margin distribution machine for fault detection of wind turbines. Clust. Comput. 2019, 22, 7525–7537. [Google Scholar] [CrossRef]
  30. Long, W.; Jiao, J.J.; Liang, X.M.; Tang, M.Z. An exploration-enhanced grey wolf optimizer to solve high-dimensional numerical optimization. Eng. Appl. Artif. Intell. 2018, 68, 63–80. [Google Scholar] [CrossRef]
  31. Xue, B.; Zhang, M.J.; Browne, W.N. Particle Swarm Optimization for Feature Selection in Classification: A Multi-Objective Approach. IEEE Trans. Cybern. 2013, 43, 1656–1671. [Google Scholar] [CrossRef]
  32. Tang, M.; Hu, J.; Kuang, Z.; Wu, H.; Zhao, Q.; Peng, S. Fault Detection of the Wind Turbine Variable Pitch System Based on Large Margin Distribution Machine Optimized by the State Transition Algorithm. Math. Probl. Eng. 2020, 2020. [Google Scholar] [CrossRef]
  33. Safavian, S.R.; Landgrebe, D. A survey of decision tree classifier methodology. IEEE Trans. Syst. Man Cybern. 1991, 21, 660–674. [Google Scholar] [CrossRef] [Green Version]
  34. Ke, G.; Meng, Q.; Finley, T.; Wang, T.; Chen, W.; Ma, W.; Ye, Q.; Liu, T.-Y. LightGBM: A highly efficient gradient boosting decision tree. In Proceedings of the 31st Annual Conference on Neural Information Processing Systems, Long Beach, CA, USA, 4–9 December 2017; pp. 3147–3155. [Google Scholar]
  35. Chen, T.; Guestrin, C. XGBoost: A scalable tree boosting system. In Proceedings of the 22nd ACM SIGKDD International Conference on Knowledge Discovery and Data Mining, San Francisco, CA, USA, 13–17 August 2016; pp. 785–794. [Google Scholar]
  36. Heidari, A.A.; Mirjalili, S.; Faris, H.; Aljarah, I.; Mafarja, M.; Chen, H.L. Harris hawks optimization: Algorithm and applications. Future Gener. Comput. Syst. 2019, 97, 849–872. [Google Scholar] [CrossRef]
  37. Castellani, F.; Astolfi, D.; Natili, F. SCADA Data Analysis Methods for Diagnosis of Electrical Faults to Wind Turbine Generators. Appl. Sci. 2021, 11, 3307. [Google Scholar] [CrossRef]
Figure 1. A decision tree algorithm based on Hisgram, adopts GOSS.
Applsci 11 08030 g001
Figure 2. Comparison of level-wise tree growth and leaf-wise tree growth.
Applsci 11 08030 g002
Figure 3. (a) Variation curve of E; (b) variation curve of Ei.
Applsci 11 08030 g003
Figure 4. The process of IHHO.
Applsci 11 08030 g004
Figure 5. Fault detection flow chart of wind turbine pitch system based on improved HHO-LightGBM.
Applsci 11 08030 g005
Figure 6. FAR of four algorithms for fault detection.
Applsci 11 08030 g006
Figure 7. FNR of four algorithms for fault detection.
Applsci 11 08030 g007
Figure 8. F1-score of four algorithms for fault detection.
Applsci 11 08030 g008
Table 1. Tuning parameters.
ParameterFunctionValue Range
Δ the minimum number of leaf nodes and determines the complexity of the model[2, 31]
Ω data on leaves of decision tree and deal with overfit[50, 300]
Table 2. Dataset description.
Fault TypeFault-FreeFaultyTotal Number of Features
pitch control emergency stop fault18281387211
pitch control motor fault49171509211
pitch control power supply alarm2854852211
Table 3. Original data of the wind turbine.
FeatureTime
06:1506:1606:1706:1808:2008:2108:2208:23
rotor_speed17.4717.4817.4717.3717.4817.4517.4617.45
converter_motor_speed1750.11754.41755.11748.31743.41755.61749.21747.3
converter_power773.1710.1800.2794.3810.6856.3877.5851.3
Table 4. Confusion matrix of classification results.
ActualForecast
Forecast FaultyForecast Normal
Actual FaultyTPFN
Actual NormalFPTN
Publisher’s Note: MDPI stays neutral with regard to jurisdictional claims in published maps and institutional affiliations.

