Article

Investigations of Muon Flux Variations Detected Using Veto Detectors of the Digital Gamma-rays Spectrometer

1
Institute of Nuclear Physics Polish Academy of Sciences, Radzikowskiego 152, 31-342 Krakow, Poland
2
Department of Climatology, Jagiellonian University in Krakow, Gronostajowa 7, 30-387 Krakow, Poland
*
Author to whom correspondence should be addressed.
Appl. Sci. 2021, 11(17), 7916; https://doi.org/10.3390/app11177916
Submission received: 20 July 2021 / Revised: 19 August 2021 / Accepted: 25 August 2021 / Published: 27 August 2021
(This article belongs to the Special Issue Research on Cosmic Rays and Their Impact on Human Activities)

Abstract

:
This paper presents the results of cosmic ray muons flux monitoring registered by a digital gamma-ray spectrometer’s active shield made of five large plastic scintillators. In traditional, i.e., analogue active shields working in anticoincidence mode with germanium detectors, the generated data are used only as a gating signal and are not stored. However, thanks to digital acquisition applied in designed novel gamma-ray spectrometers enabling offline studies, it has not only become possible to use generated data to reduce the germanium detector background (cosmic rays veto system) but also to initialize long-term monitoring of the muon flux intensity. Furthermore, various analyses methods prove the relevance of the acquired data. Fourier analyses revealed the presence of daily (24 h), near-monthly (27 days) and over bi-monthly (68 days) cycles.

1. Introduction

Low-background gamma-ray spectrometry is commonly used in research studies of materials characterized by trace concentrations of gamma-ray emitting radioisotopes. Hence, it finds applications in various fields of science, such as from neutrino physics to environmental research [1,2,3]. In such investigations, it is vital to use advanced shielding systems to reduce the background radiation of gamma-ray detectors (mainly HPGe).
One of the main components of background radiation is terrestrial gamma radiation, which spectrometers’ passive shield can efficiently reduce. However, passive shield layers and their width must be appropriately selected in order to minimize the impact of internal gamma radiation from traces of radionuclides present in the shield’s construction materials and any isotopes produced by interactions of cosmic rays with those materials. In low-background detection systems, contributions from air radioactivity, namely radon and its daughter isotopes, are not negligible [2,4].
Another important source of background radiation in gamma-ray spectrometers are particles of secondary cosmic rays. At sea level, the secondary particles flux consists of hadrons, neutrons, gamma quanta, electrons, muons, nucleons and antinucleons [5]. Of these charged particles, muons are the most abundant, with a mean energy of around 4 GeV. The intensity of the muon flux depends on the zenith angle θ of the incident particle, which at sea level can be expressed as follows (1):
( θ ) = I ( 0 ° ) c o s n ( p ) ( θ ) ,
where n(p) is the particle momentum-dependent exponent and n ≈ 2 for muons with energies of a few GeV [6]. This relation explains the necessity of shielding gamma-ray detectors in both vertical and horizontal directions. The most significant contribution to the radiation background is from particles with 0 ° zenith angle (vertical direction) [1].
Secondary cosmic rays passing through the shielding may deposit their energy in the germanium crystal (producing continuous background component) as well as generate neutrons and photons via several processes such as muon-induced hadronic and electromagnetic cascades, muon capture and muon-induced spallation reactions [2,7,8].
The cosmic rays background component can be reduced by using active shields consisting of detectors (plastic scintillators or multiwire Charpak chamber) surrounding a passive shield. In the case of particle detection (in the preset coincidence time window) by the active shield’s detector and the germanium detector, the signal from the latter is not stored. This is the principle of the so-called classical (analogue) cosmic ray veto system.
However, the development of digital signal processing systems allowed one to apply digital analyzers (digitizers) as critical components of nuclear spectroscopy electronics and substitute a few discrete electronic devices used in analogue electronics. Such a device provides information about the registration time, energy and pulse shape of each significant signal generated by the detector. Furthermore, using digital analyzer allows all generated data to be stored for later processing (offline), enabling the application of various data exploration techniques. Since 2018, a low-background, gamma-ray spectrometer with an active shielding and digital acquisition system has been operating in the Department of Nuclear Physical Chemistry, at the Institute of Nuclear Physics Polish Academy of Sciences (IFJ PAN), in Krakow, Poland [1].
In this paper, we present the results of analyses of data generated by the spectrometer’s active shielding. As mentioned above, these data are used to reduce the germanium detector background. Furthermore, offline data analysis makes it possible to develop a continuous cosmic-ray muons monitoring system. Hence one device, namely a low-background, digital gamma-ray spectrometer, can simultaneously performs experiments from two branches of physics, namely low-background gamma-ray spectrometry and astrophysics.

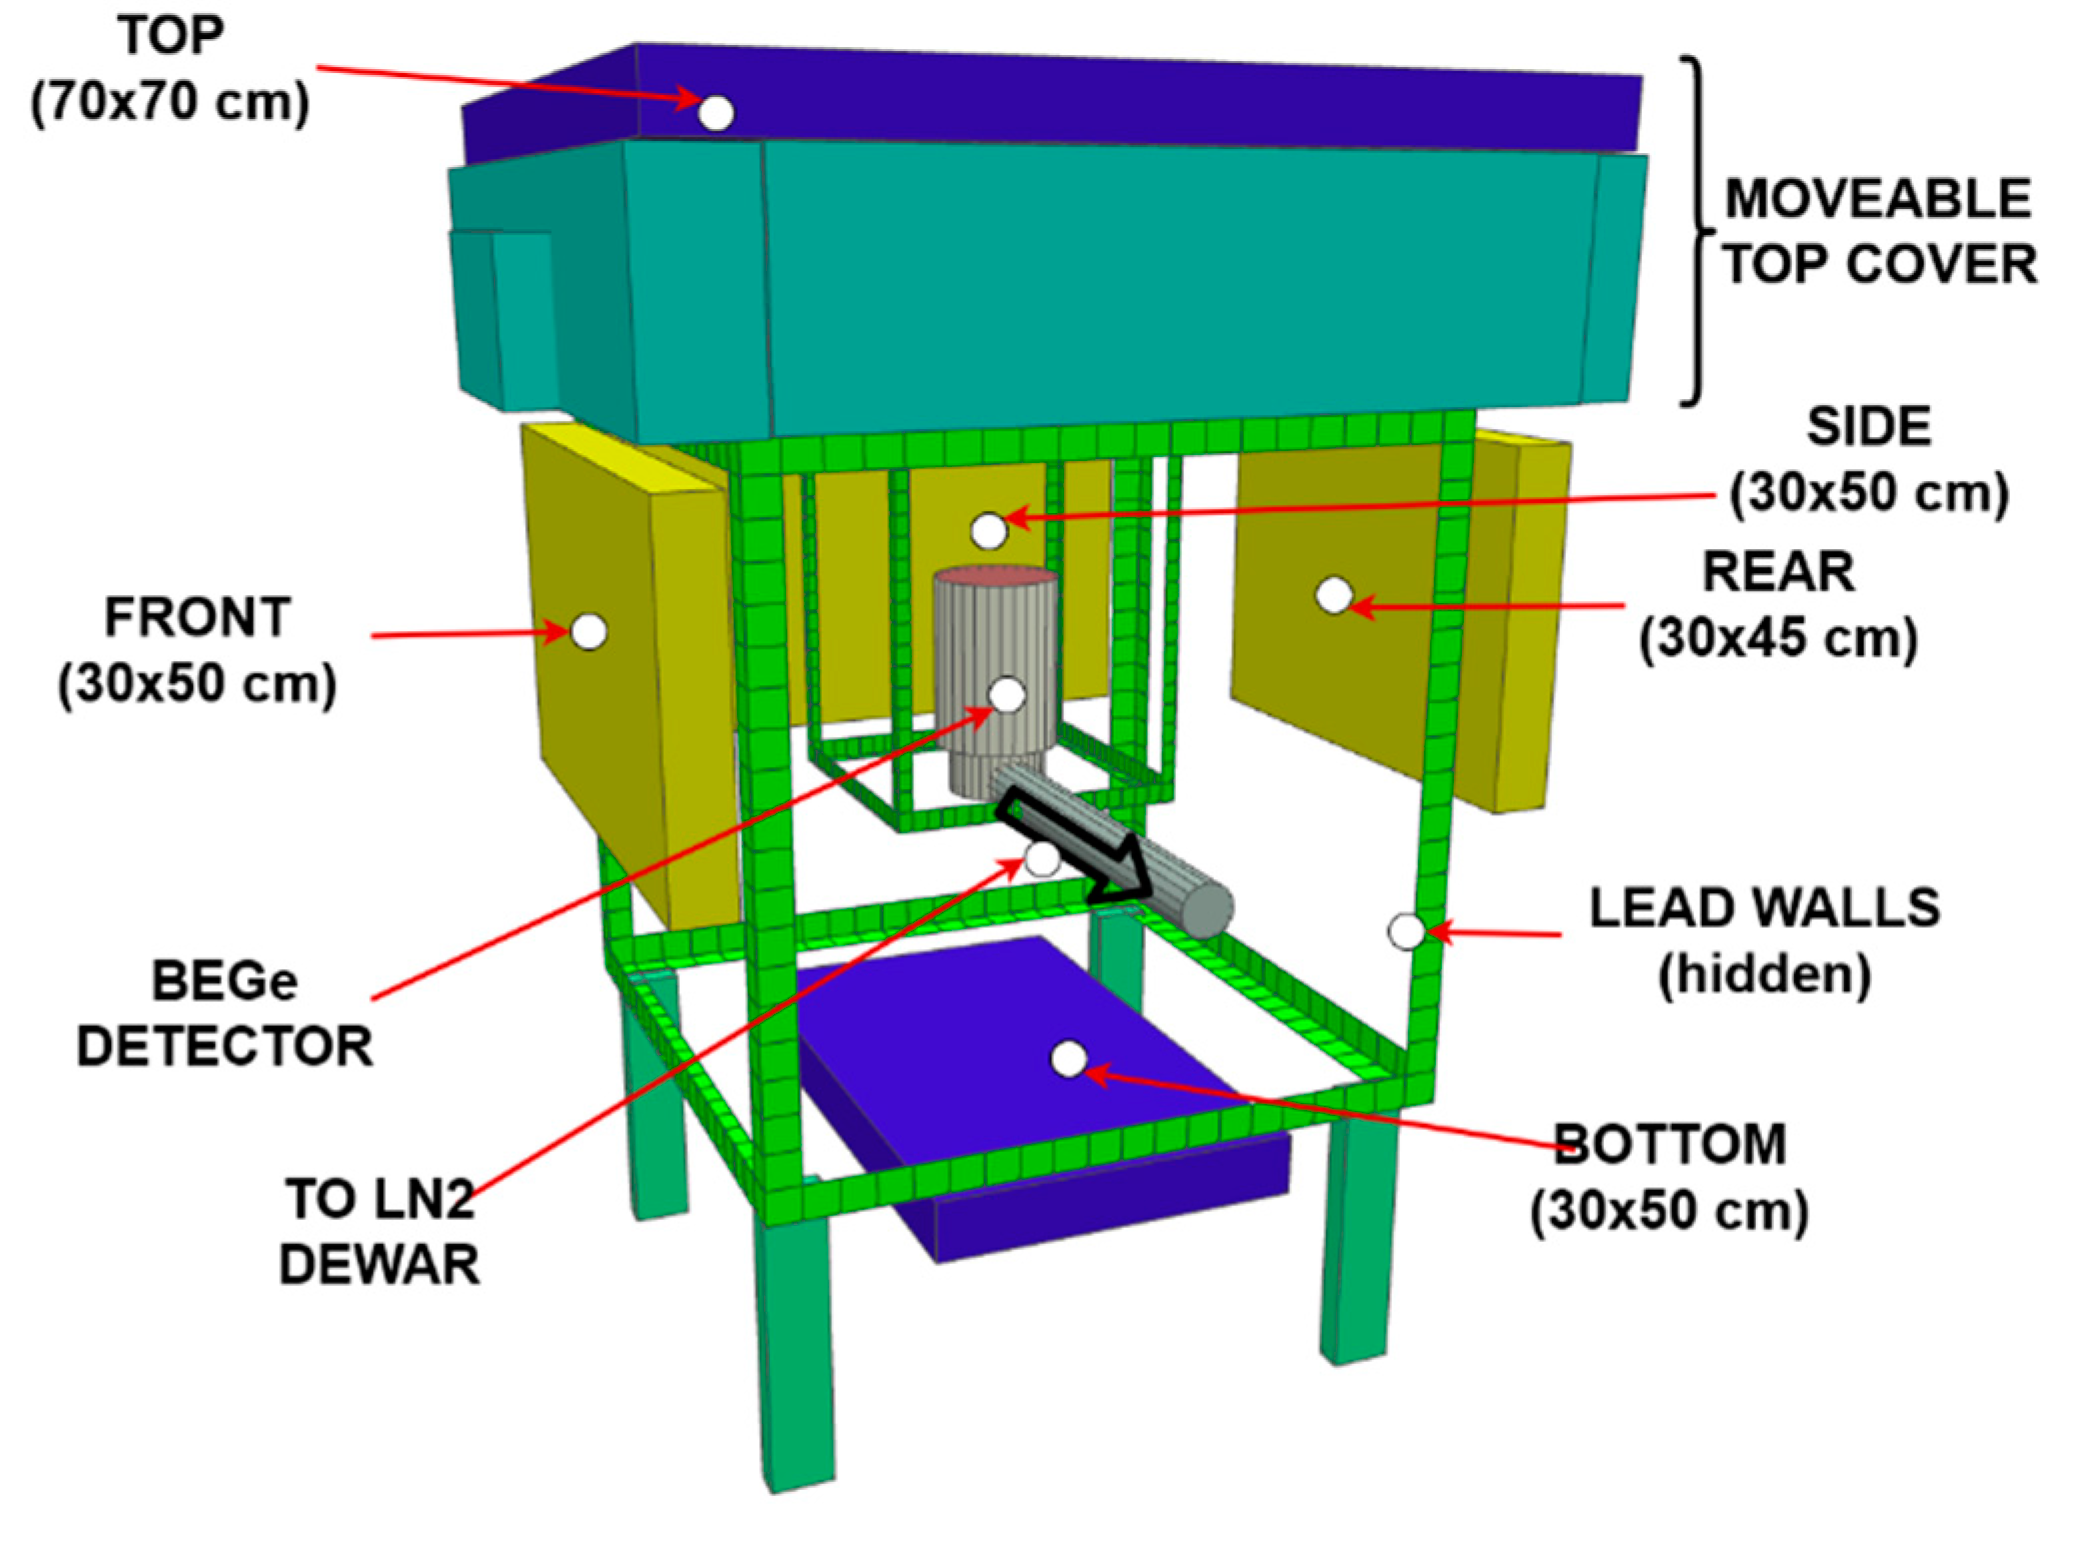
2. Materials and Methods

The spectrometer is equipped with a Broad Energy Germanium detector BE5030 (Canberra, USA) with relative efficiency of ≥48% and a composite passive shield in a cubic shape with an internal layer made of lead cast over 2500 years ago. The active shielding consists of five large, five cm thick plastic scintillation detectors EJ-200 with photo-multipliers ET 9900 (Scionix, Nl). These detectors are mounted outside the passive shield. TOP and BOTTOM detectors are placed horizontally while the latter three—FRONT, SIDE and REAR—are placed vertically. The relative positioning of all spectrometer’s detectors is depicted in Figure 1. The detectors’ preamplifier signals are transmitted directly to the inputs of a digitizer DT5725 (CAEN, Italy), where data acquisition and signal pre-processing are performed.
The digital analyzer DT5725 allows simultaneous acquisition of data generated by up to eight detectors (at this moment, in our setup six inputs are occupied) with a maximum time resolution of 4 ns. Registered data consist of pulse time registration, height (proportional to deposited particle energy) and shape. Raw data generated by the digitizer are stored in a PC as six files (in *.csv format), which are further processed using purposely written software VETO. Commissioning and optimization processes of the described spectrometer and software development and its properties are discussed in detail in [1].
The data were collected from 1 September 2018 to 30 April 2020. Since the described spectrometer is primarily used to measure low-active gamma-ray emitting samples, the obtained data may be divided into two groups, namely short and long-period data. Short period data consist of data generated by scintillation detectors during single gamma-rays spectrometric measurement, which last up to 6 days. Data acquisition is stopped at the end of measurements in order to replace the sample in the spectrometer’s chamber and/or refill the liquid nitrogen dewar. Such breaks last up to 30 min, after which the subsequent gamma-ray spectrometric measurement along with registration of cosmic ray particles by scintillators is restarted. The long-period data consist of all digitizer output files generated from 1 September 2018 to 30 April 2020. During this time, 256 gamma-spectrometric measurements were carried out, and as a result 1280 output files of scintillation detectors were generated (total size 270 GB). In this paper, data generated by scintillators TOP (horizontal) and FRONT (vertical) were used to analyze the long-term modulations of muon flux.
For this work, the atmospheric pressure data were obtained thanks to the cooperation with the Institute of Meteorology and Water Management National Research Institute. Data are collected at the Meteorological Station located at the Kraków-Balice Airport. The station is located 6 km west of IFJ PAN, and data were recorded hourly with a high accuracy of 0.1 hPa. The measurements contain pressure values at the station level of 237 m asl (above sea level). It is worth mentioning that the pressure values did not differ from the long-term data series. Only a clear diurnal course was found, which exceeded 1 hPa. The lowest pressure values are recorded in the afternoon, while the highest at night and in the morning. These hours coincide with the strongest and weakest convective movements in the atmosphere, respectively.
In the case of analyses of variations of cosmic rays intensity using detectors located at ground level, atmospheric pressure effects must be taken under consideration [9,10]. The influence of atmospheric pressure on the intensity of the cosmic ray flux is defined as the barometric effect, which includes the following components [11]:
  • Absorption having a negative impact on the intensity of the muon flux. With increasing atmospheric pressure (and thus the amount of matter in the air column), the probability of absorption and scattering of particles is increased;
  • Decay also demonstrating the negative effect, including the increase in the number of muons decays with increasing atmospheric pressure, which is caused by the increase in the height at which muons are generated;
  • Generation defines the positive impact on the muon flux intensity and considers the increase in the number of pions produced with increasing pressure.
Near the Earth’s surface, the dominant factor is absorption one; considering that air density is usually the highest near the ground, the knowledge of the atmospheric pressure at the level at which the detection is performed is sufficient for determining the value of the barometric effect [12].
The normalized deviation of the recorded muon flux from the average depends on the change in atmospheric pressure [13]:
Δ I I = β P Δ P ,
where Δ I I is the normalized deviation of muon count rate, Δ P is the deviation of the atmospheric pressure from the mean and βP is the so-called barometric coefficient.
The βP coefficient (expressed in (%/hPa)) can be determined by assuming a linear correlation between changes in the normalized muon flux intensity and variations in atmospheric pressure. Therefore, it is essential to estimate the βP value only during the most geomagnetically quiet days [14].
Pressure corrected data are analyzed using various statistical tools. In order to investigate any correlation between subsequent registered events, the autocorrelation function (ACF) of a sequence of time intervals between pulses generated by detectors is determined. The autocorrelation function indicates the Pearson correlation coefficient between values of the same series as a function of time lag. Furthermore, Fast Fourier Transform (FFT) of a given time series is performed, allowing the investigation of any periodic components. Prior transformation, mean and linear trends have been subtracted from the sequence.
In the case of long-period data, a threshold normalization procedure was necessary. The spectrometer’s configuration and optimization procedures allow a fixed threshold level for the scintillators spectra to 300th ADC channel to be set [1]. This procedure allowed redundant data (mainly registered gamma rays) which did not increase the effectiveness of the cosmic ray veto system to be reduced up to around 24 times However, to limit the influence of any signal threshold level fluctuations or gain changes in the digital acquisition circuit which may have occurred in data collected over a long period and cause uncontrolled changes in the recorded number of counts, normalization of the spectra discrimination level was carried out [14]. The normalization procedure involved cutting off part of the energetic spectra located below the ADC channel containing 30% of the maximum number of counts recorded in one channel in a given spectrum (i.e., the highest point in the energy spectrum, see Figure 2). The prepared output files were used to determine a time series of hourly muon count rates for the whole period considered.

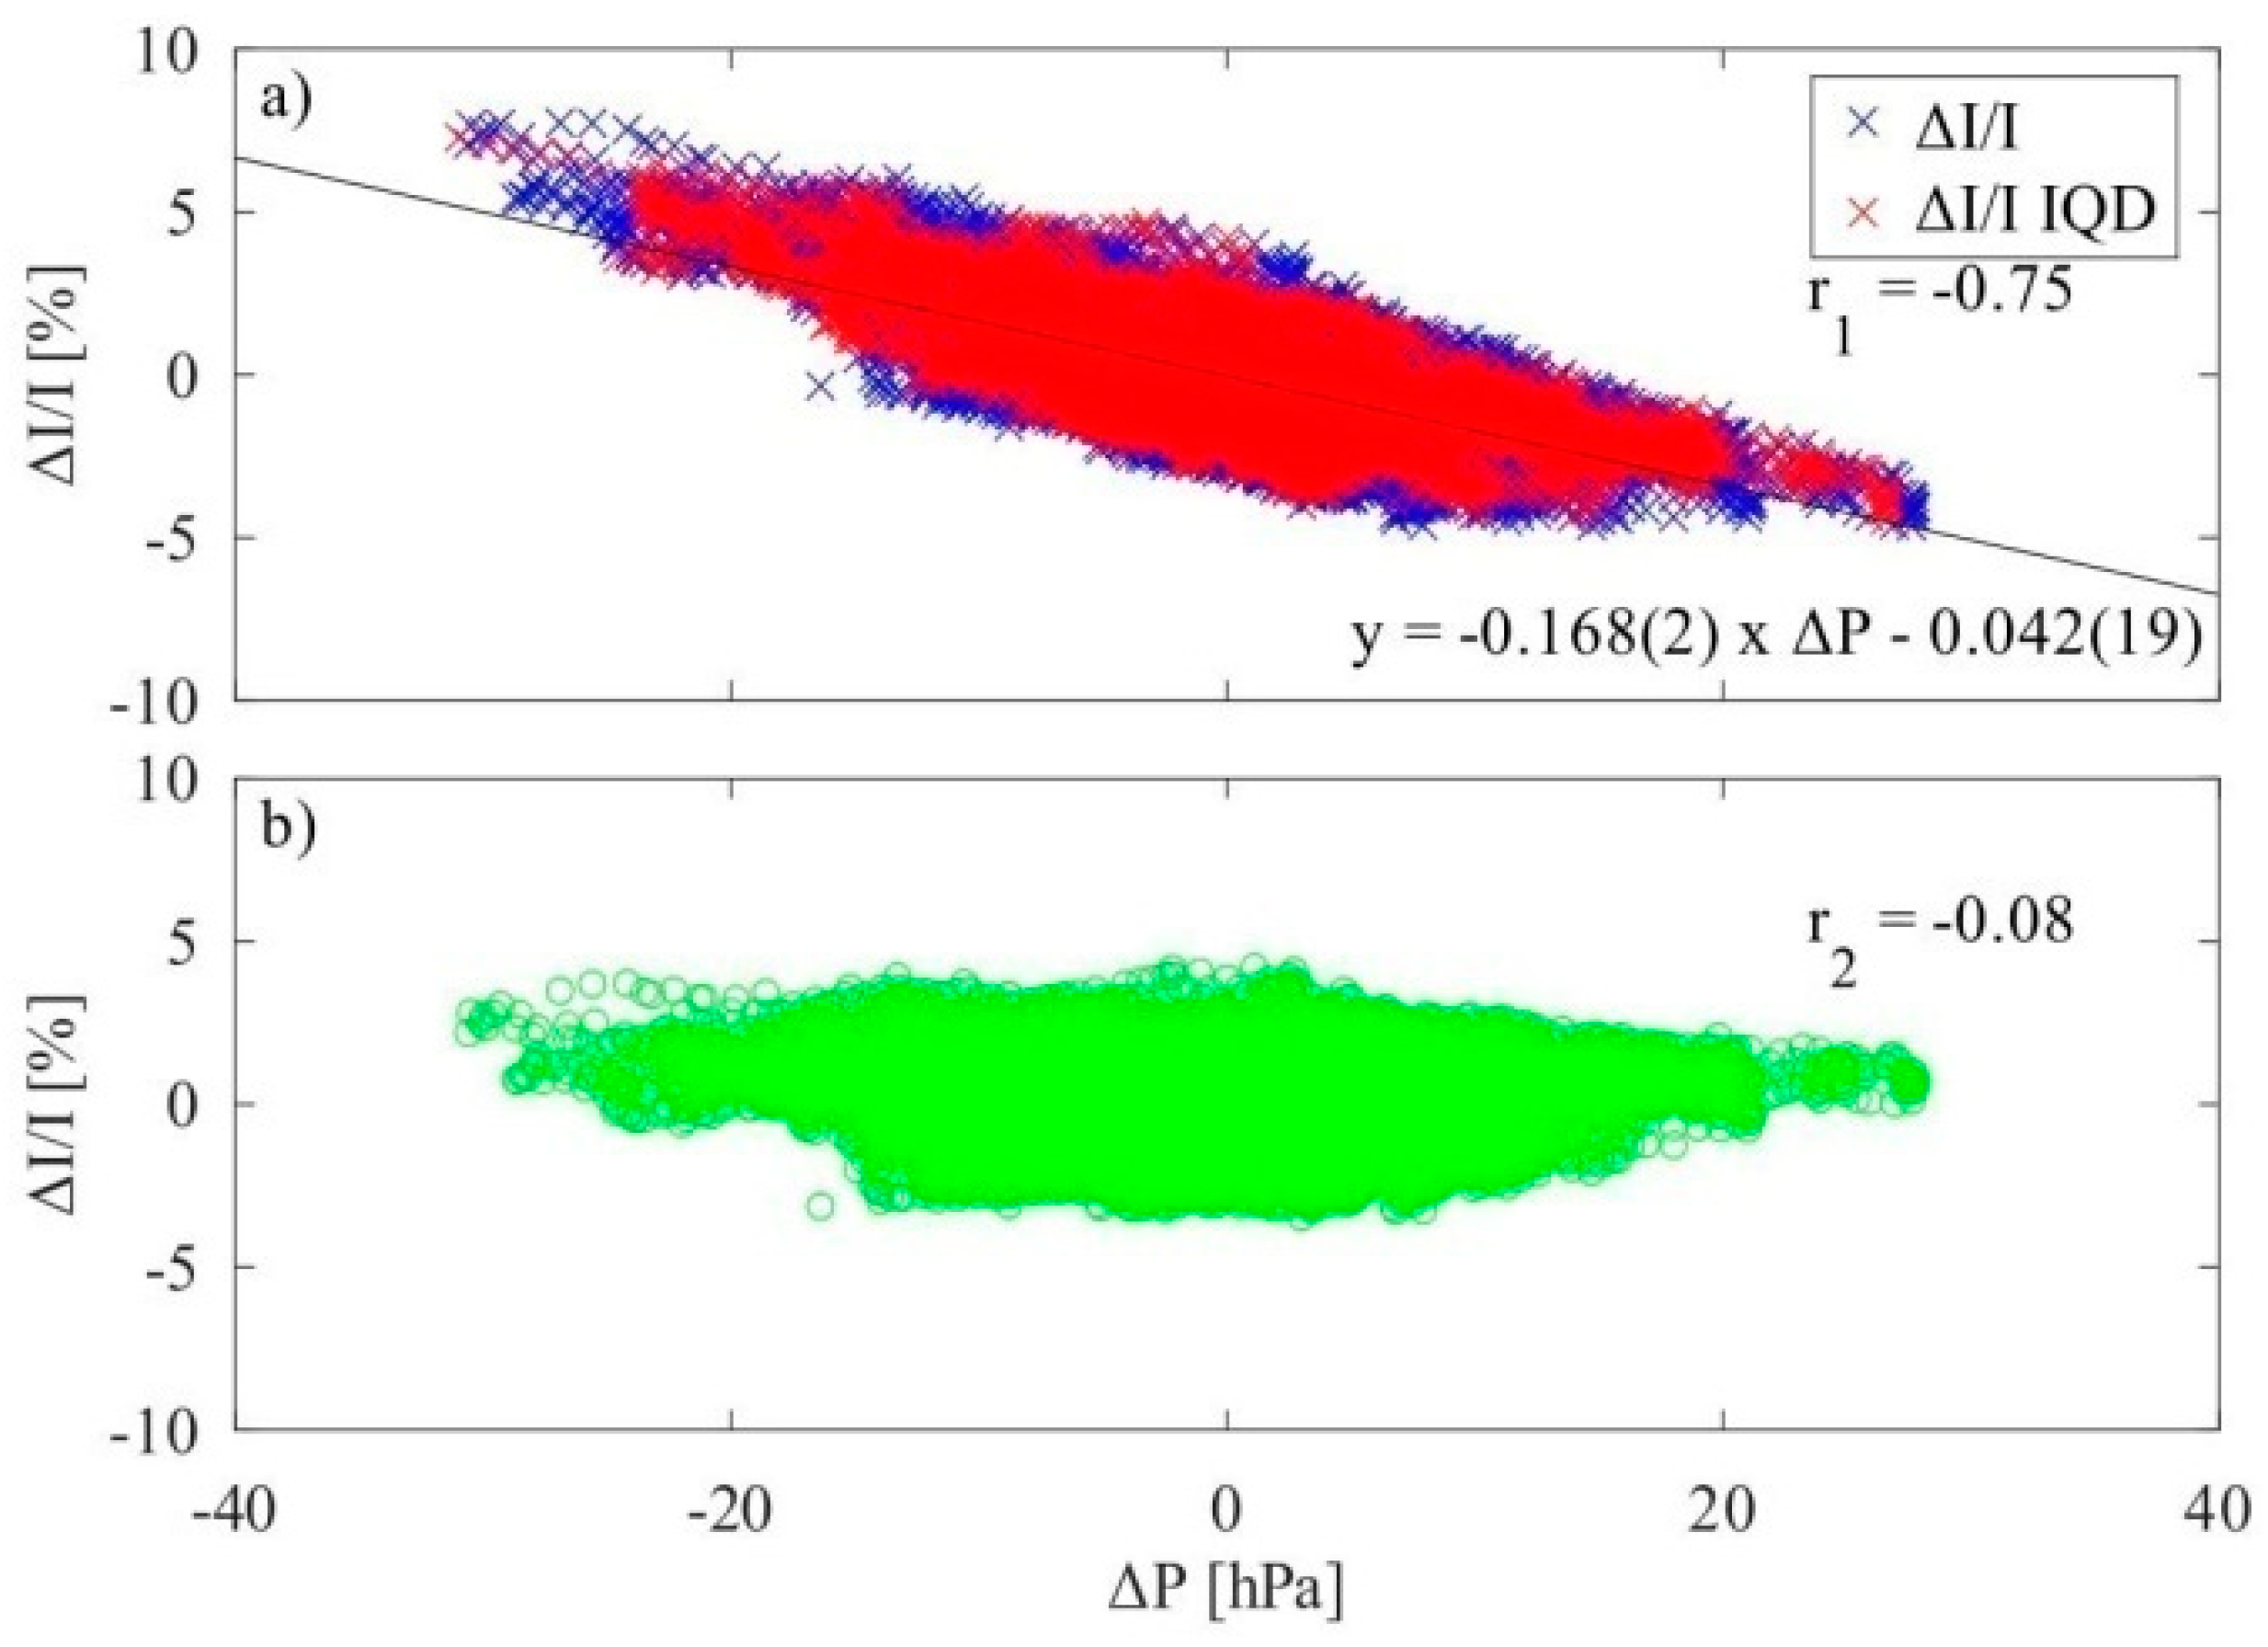
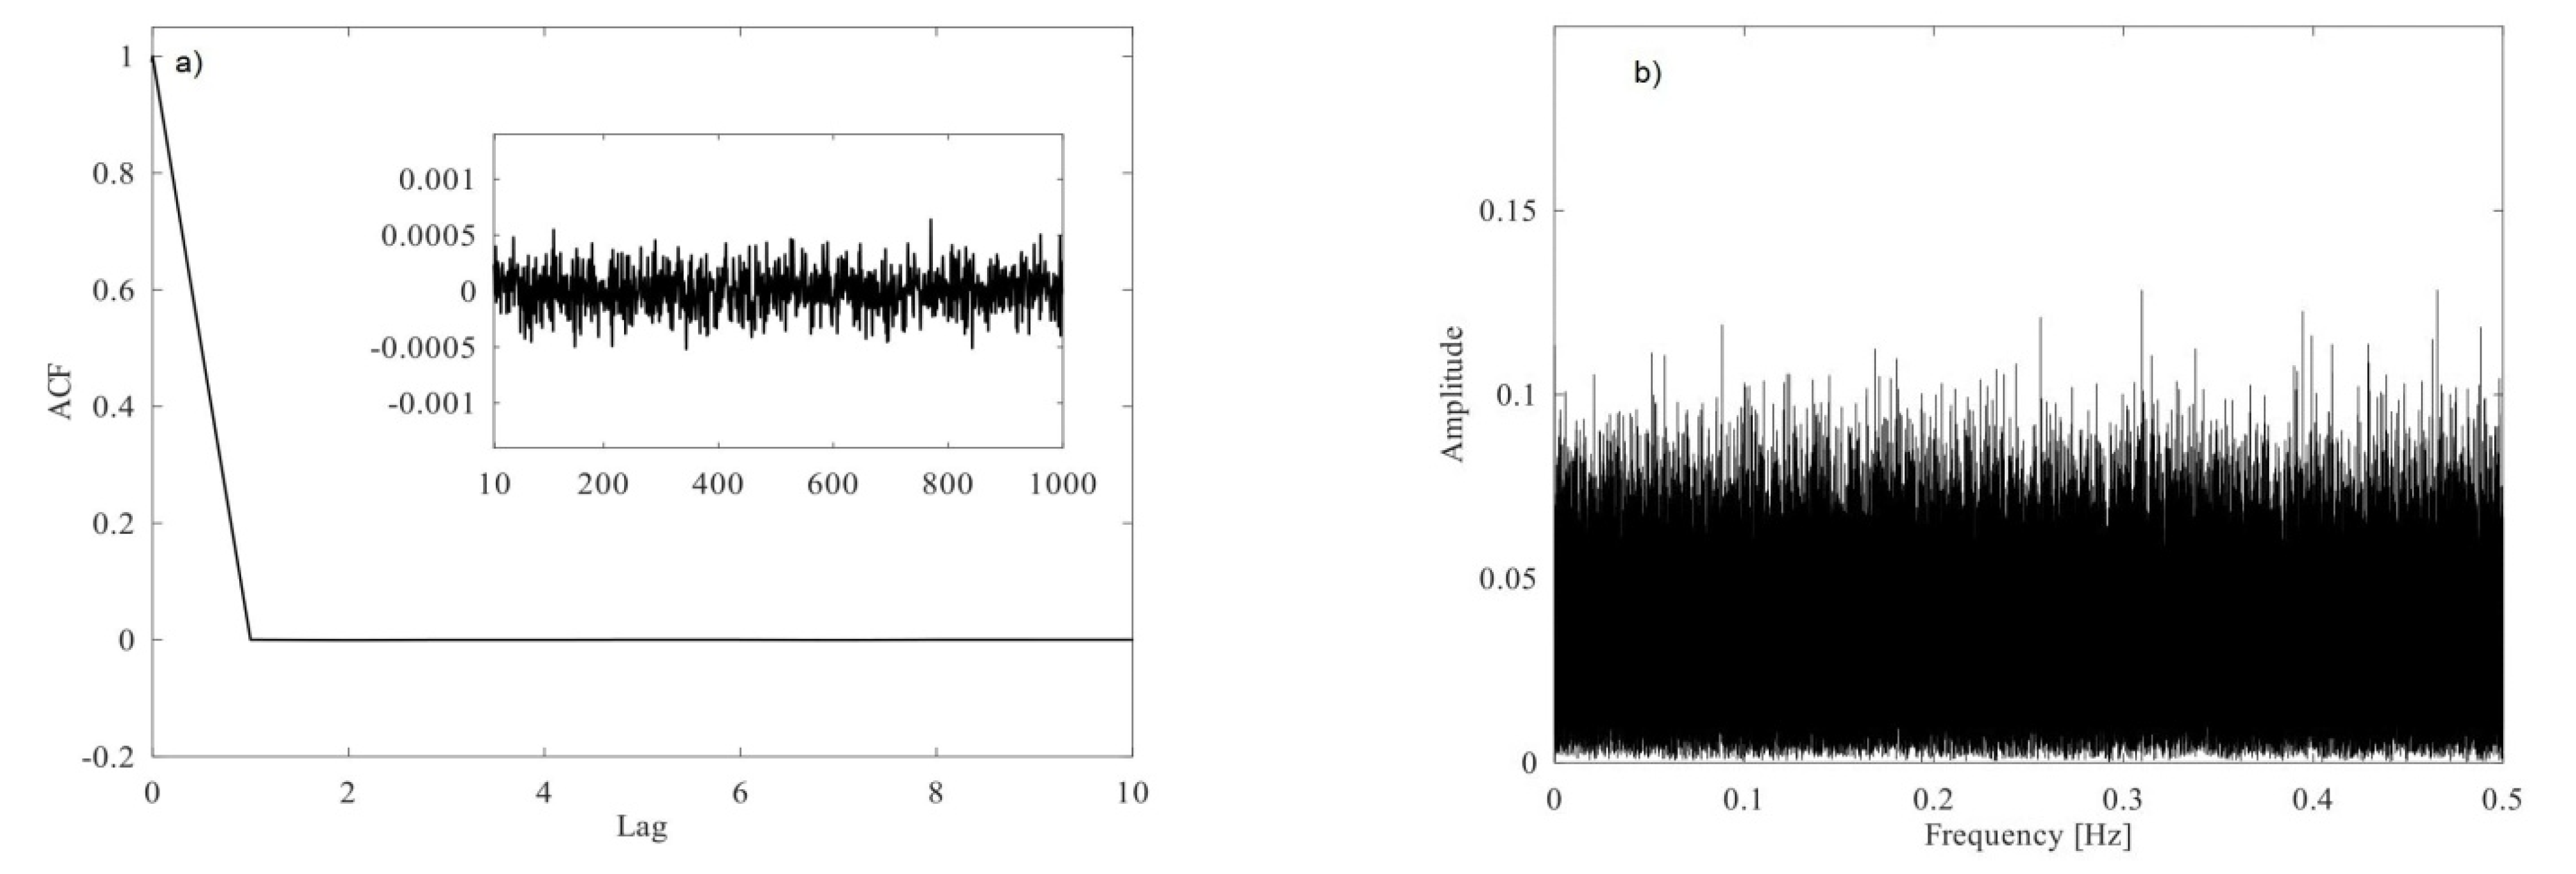
3. Results and Discussion

3.1. Short Period Data

Distributions of pulses generated by the scintillators in unit time t should correspond to Poisson distributions with an expected value equal to λt. This value (for a chosen time interval) depends mainly on the area of the detector and its vertical or horizontal position. Figure 3 presents distributions of the numbers of counts registered in one second by the scintillation detectors TOP, BOTTOM and FRONT. In order to obtain experimental data (the cyan, red and pink lines in Figure 3), Poisson distributions were fitted with expected count rates λTOP = 71.93 counts/s (black), λBOTTOM = 18.88 counts/s (green) and λFRONT = 14.43 counts/s (blue) for TOP, BOTTOM and FRONT detectors, respectively. The horizontal detectors registered more particles in unit time than the FRONT detector, which was placed vertically. Additionally, Figure 3 demonstrates a great amount of data registered by a digital gamma-ray spectrometry system and supports the demand for the optimization process. Such factsare in accordance with previous research results described in [1]. Further data analyses involved the verification of the presence of correlated structures in detector signals. The gamma-ray measurement investigation lasted approximately 119 h.
Figure 4a presents values of the ACF in the examined series in cases of up to ten events lag and from 10–1000 events lags. The ACF values oscillate around zero, indicating that there were no correlations in this signal. This means that practically every registered muon can be considered as a single independent event. The same results were achieved for other scintillators, implying that singular scintillators detect non-correlated cosmic-ray muons. Additionally, conducted analyses proved that signals generated by scintillation detectors are stochastic Poisson processes [15].
Figure 4b shows the obtained results from FFT analysis of the sequence of counts registered in one second by the TOP detector. A flat frequency spectrum (and, consequently, flat power spectrum) proves that data generated by the individual scintillation detectors during single gamma-ray spectrometric measurement correspond to white noise, and it is impossible to detect, using single scintillators, correlated muons created in the same air-shower event. This is because the time resolution of an active shield scintillator is mainly determined by two signal shaping parameters: the rise time of the trapezoid generated by the digitizer’s energy filter and the length of its flat part [1]. Since the main purpose of the constructed active shield, muon detection, requires correct evaluation of the pulse height, the total shaping time is around 12 µs, much longer than the intervals between any possible registered cosmic-ray particles generated in the same air-showers.
Bearing in mind the previous results, coincidence events of signals from different scintillators have been studied. Coincidence events from four scintillation detectors, namely TOP, BOTTOM, FRONT and REAR, were found using the VETO software. The detection system registered 471 events of four-fold coincidences during the investigated gamma-spectrometric measurement. Figure 5 presents the distribution of the coincidence events found as a function of the maximum time interval between pulses from the same event. Due to the non-linear geometric positioning of the considered scintillators, generated signals must come from at least two correlated muons from the same air-shower. Furthermore, the width of the distribution (σ = 12 ns) is comparable with the digitizer time resolution, and correlated muons time travel through the distance between scintillators. This feature is interesting from the novel CREDO project point of view [16], which focuses on studying cosmic rays and cosmic-ray ensembles. The presented detection system includes five plastic scintillators, which may play the role of a reference detector, that are complementary to other detection systems (e.g., smartphones’ cameras) already applied in the CREDO project [16].

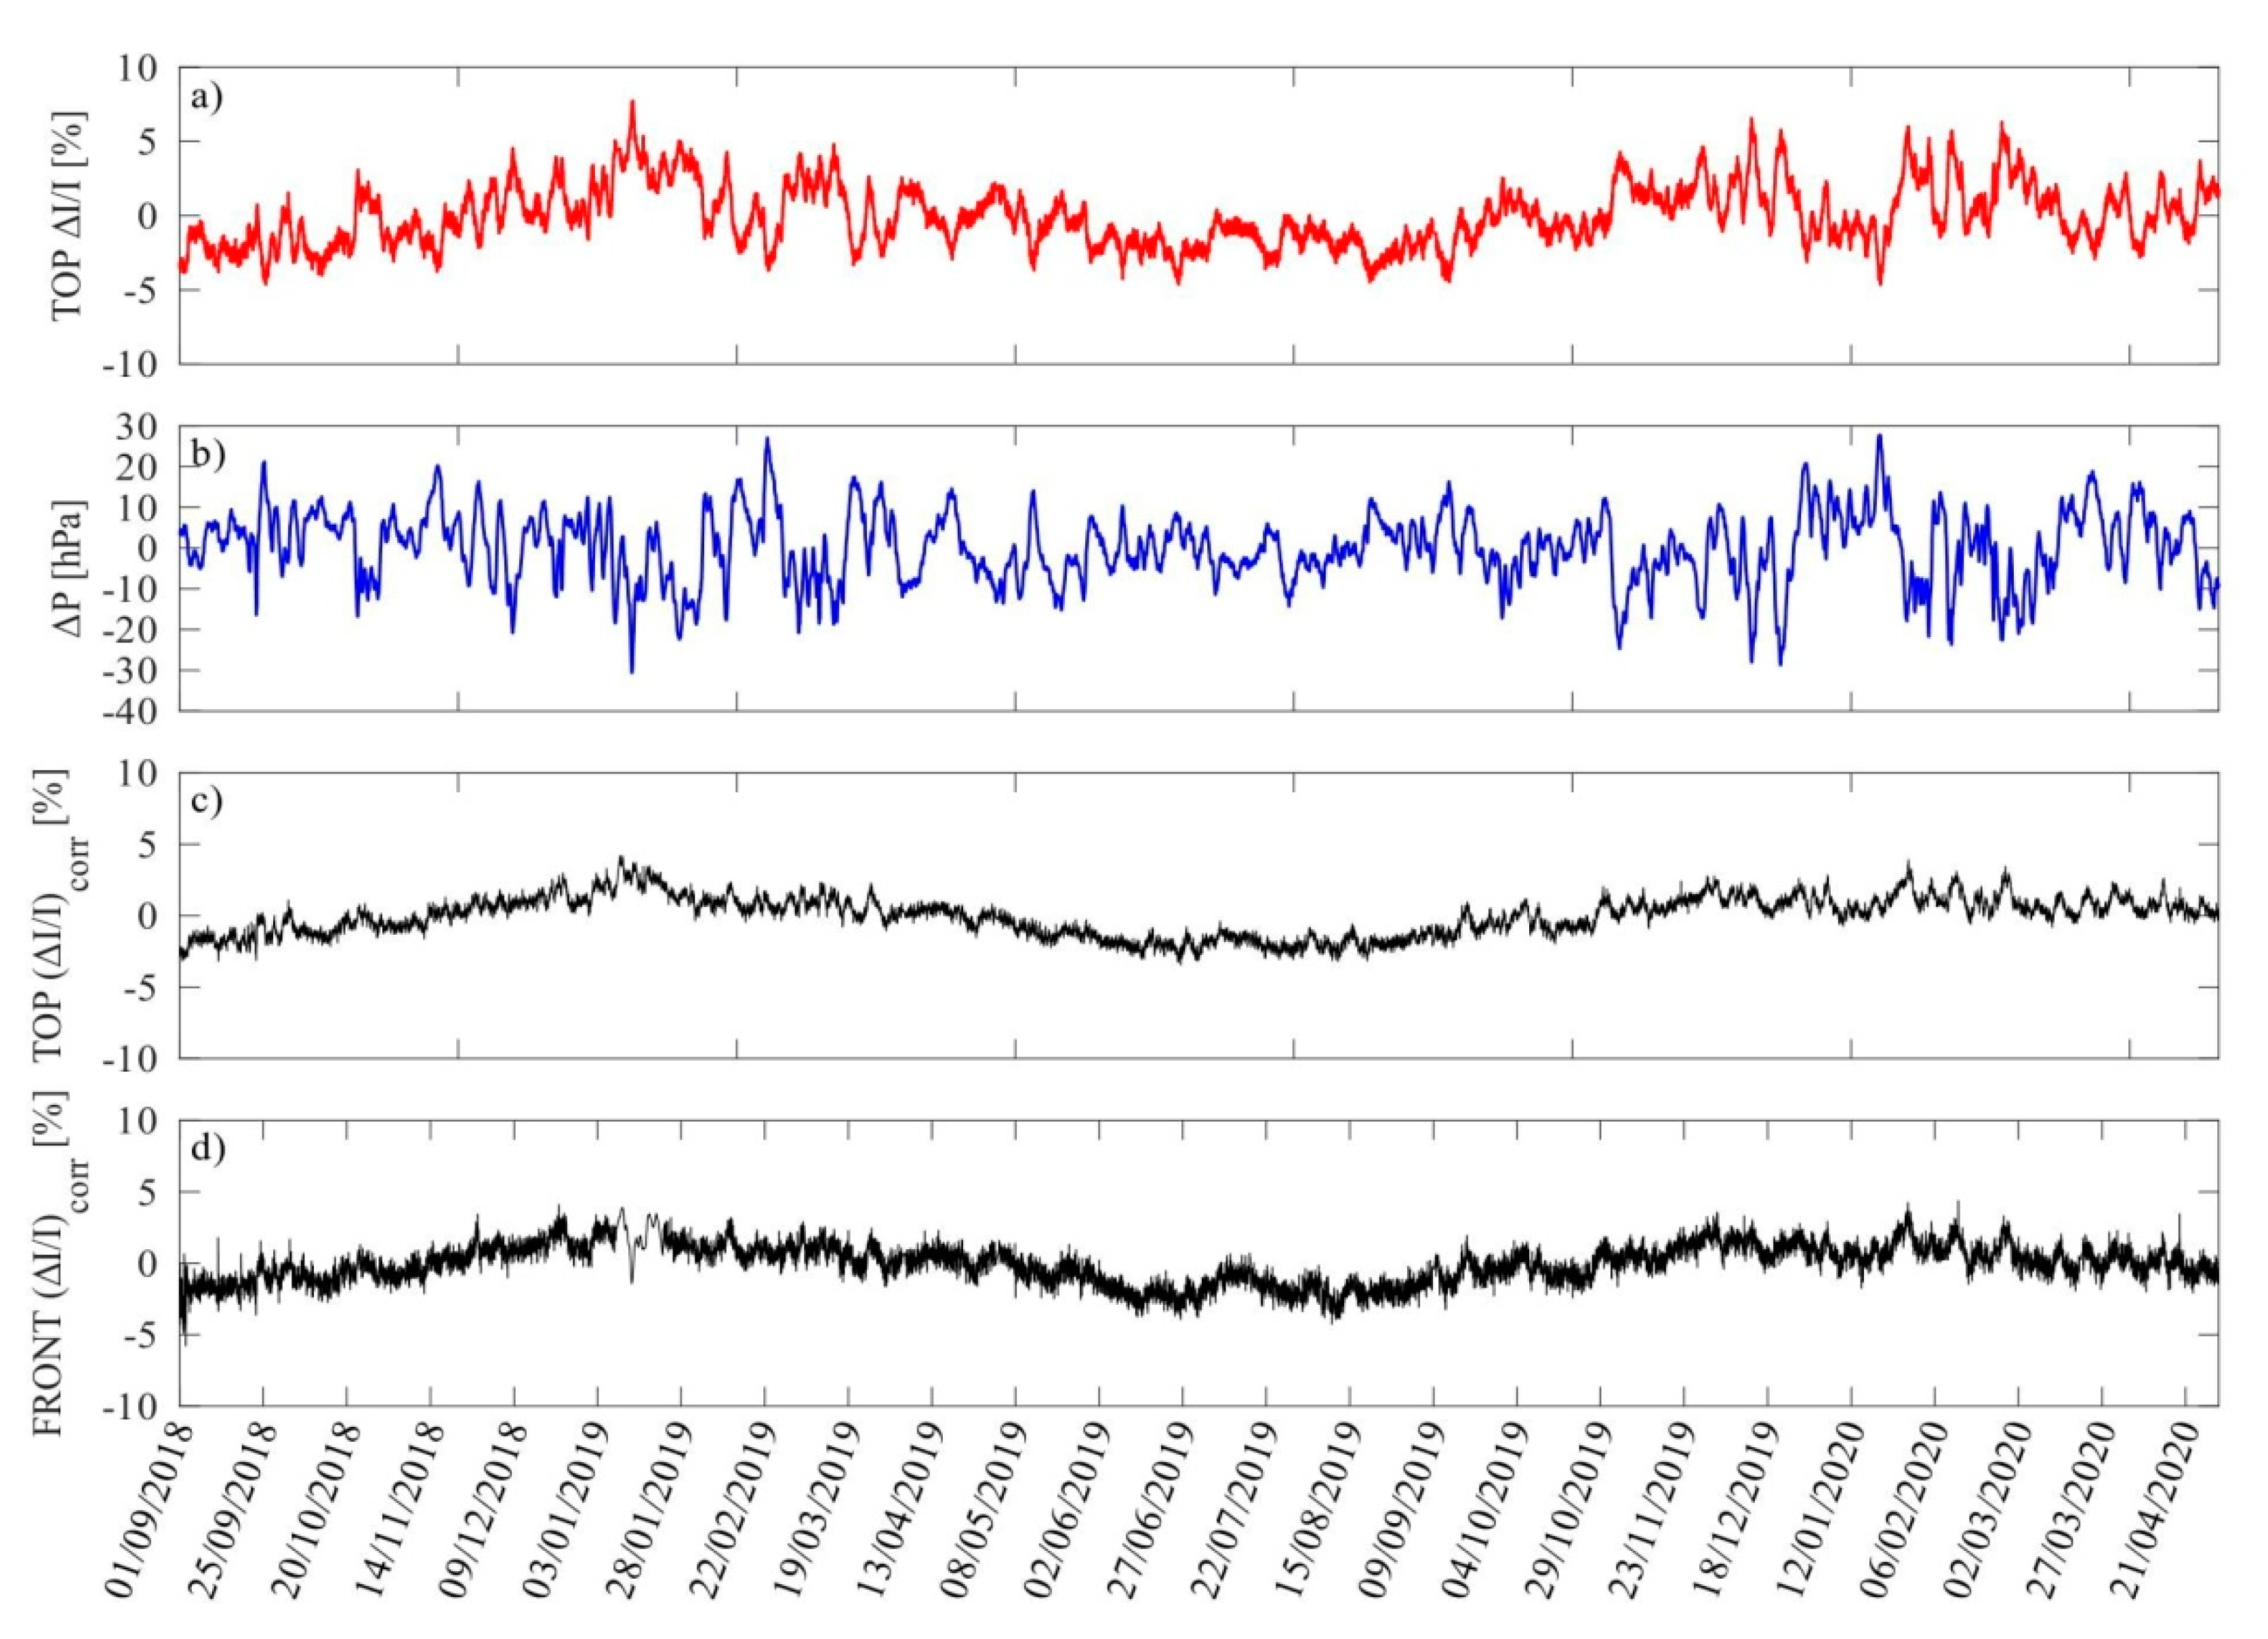
3.2. Long-Period Data

For long-period data, the barometric coefficient βP was established. During investigations, only data collected on the ten most quiet days of every month were used. The list of those days was acquired from the International Quiet Days (IQD) database (http://wdc.kugi.kyoto-u.ac.jp/qddays/ accessed on 14 February 2021) [17]. Figure 6a presents relative deviation of the muon count rate Δ I I as a function of pressure deviation ∆P. The blue markers represent all data from the period studied, while the red markers represent data recorded only on IQD days. The correlation coefficient between these values and the pressure changes indicates strong negative correlation ( r 1 , T O P = 0.75 ). The β P coefficient was determined by a least squares fit, and its value was βP,TOP = −0.168(2) %/hPa. The value was used to correct the data and to eliminate the dependence of the muon flux intensity on the atmospheric pressure using the Equation (2). The obtained results are presented in Figure 6b. The value of the correlation coefficient after data correction r 2 , T O P = 0.08 confirms a significant reduction in this dependence. In the case of the FRONT detector, analyses were performed to allow an estimate of β P , F R O N T = 0.153 ( 2 ) %/hPa, which reduced the data correlation from r1,FRONT = −0.72 to r2,FRONT = 0.09.
Figure 7a shows the normalized intensity of the muon flux registered by the detector TOP before correction for changes in atmospheric pressure (which are depicted in Figure 7b). The pressure corrected data demonstrated in Figure 7c,d for scintillator TOP and FRONT, respectively, show less variability. It should be noted that seasonal variation is still clearly visible; however, seasonal changes do not affect the final results for the analyzed period (20 months).
Fast Fourier transform analysis was conducted on the pressure-corrected data, and the obtained results are presented in Figure 8.
In the case of the TOP detector, the FFT algorithm allowed identification of the diurnal periodicity (24 h) with harmonics components (12 h and 8 h) of muon flux caused by the rotation of the Earth and its relative motion in the solar magnetic field, modulated by solar wind [18,19]. Furthermore, a periodic component with a period of around 27 days was identified. This variability is associated with the effect of the Sun’s rotation, causing variations in both intensity of solar wind particles and their speed [18,20]. In addition, a periodicity of about 68 days is noticeable in the frequency spectrum but its origin is unclear. Takai et al. (2016) [21] conducted a frequency analysis of the eight-year time series of muon flux recorded during the MARIACHI experiment. The authors identified a signal component, among others, with a period of about 62.5 days (which is the closest to the result obtained in presented research), but unfortunately its interpretation was not provided. Hence the 68day periodicity needs to be further analyzed.
The results of the FFT analyses of the signal generated by detector FRONT (Figure 8b) confirmed diurnal (with 12 h harmonics). In addition, there are 27 and 68 days periodicities in the horizontal component of cosmic ray flux registered by the vertical scintillator.

4. Conclusions

This paper presents the capabilities of a low-background digital gamma-ray spectrometer which expand its fields of applications and the analysis techniques to correct and extract information of the data generated by an active shield detector. Usually, such data are used only to reduce the germanium detector radiation background; thus, it is not saved or analyzed. Our approach, involving digital data acquisition and offline analysis, allows both tasks to be fulfilled simultaneously.
In the case of short period time series (i.e., data generated by a single scintillator during a single gamma-spectrometric measurement), research studies indicated that, according to expectations, the number of pulses generated by scintillators in unit time (in our case, 1 s) follows a Poisson distribution, and the time intervals between the pulses are not correlated. Moreover, by using the fast Fourier transform, the absence of periodic structures in these series was demonstrated.
Relatively long period data were defined as the hourly mean count rates of the registered cosmic rays. Investigations demonstrated strong negative correlations between the recorded muon flux and atmospheric pressure at ground level. The estimated barometric coefficients allowed data generated by detectors TOP and FRONT to be corrected for pressure. These corrected data were used in the analysis by using the FFT technique, and periodic components have been identified in both time series, including those related to the rotation of the Earth (with a period of 24 h) and the rotation of the Sun (a period of about 27 days). The periodicity with a 68 days period remains unexplained.
To summarize, by using a digital data acquisition system, it is possible to expand the research potential of the low-background gamma-ray spectrometer by numerous methods to explore collected measurement data and to allow monitoring of cosmic-ray muons flux registered by the active shield’s detectors. Moreover, this device may find applications in the CREDO scientific project and other investigations focused on various phenomena correlated with the intensity of muon flux (e.g., earthquakes [22]).

Author Contributions

Conceptualization, J.W.M. and K.G.; methodology, K.G., J.W.M. and P.H.; software, K.G.; validation, K.G., J.W.M., Z.U., R.K. and P.H.; formal analysis, K.G.; investigation, K.G., J.W.M., R.K. and Z.U.; data curation, K.G. and Z.U.; writing—original draft preparation, K.G., J.W.M. and R.K.; writing—review and editing, K.G., J.W.M., R.K., Z.U., P.H., E.N. and K.B.; visualization, K.G., E.N. and K.B. All authors have read and agreed to the published version of the manuscript.

Funding

This research received no external funding.

Institutional Review Board Statement

Not applicable.

Informed Consent Statement

Not applicable.

Data Availability Statement

Not applicable.

Acknowledgments

Not applicable.

Conflicts of Interest

The authors declare no conflict of interest.

References

  1. Gorzkiewicz, K.; Mietelski, J.W.; Kierepko, R.; Brudecki, K. Low-background, digital gamma-ray spectrometer with BEGe detector and active shield: Commissioning, optimisation and software development. J. Radioanal. Nucl. Chem. 2019, 322, 1311–1321. [Google Scholar] [CrossRef] [Green Version]
  2. Wen, X.; Zhou, F.; Fukuwa, N.; Zhu, H. A simplified method for impedance and foundation input motion of a foundation supported by pile groups and its application. Comput. Geotech. 2015, 69, 301–319. [Google Scholar] [CrossRef]
  3. Gilmore, G.; Hemingway, J.D. Practical Gamma-ray Spectrometry; Wiley: Chichester, UK, 1995. [Google Scholar]
  4. Núñez-Lagos, R.; Virto, A. Shielding and background reduction. Appl. Radiat. Isot. 1996, 47, 1011–1021. [Google Scholar] [CrossRef]
  5. Griender, P.K.F. Cosmic Rays at Earth: Researcher’s Reference Manual and Data Book, 1st ed.; Elsevier Science B.V.: Amsterdam, The Netherlands, 2001; ISBN 0444507108. [Google Scholar]
  6. Cecchini, S.; Spurio, M. Atmospheric muons: Experimental aspects. Geosci. Instrum. Methods Data Syst. 2012, 1, 185–196. [Google Scholar] [CrossRef] [Green Version]
  7. Jovančević, N.; Krmar, M.; Mrda, D.; Slivka, J.; Bikit, I. Neutron induced background gamma activity in low-level Ge-spectroscopy systems. Nucl. Instrum. Methods Phys. Res. Sect. A Accel. Spectrom. Detect. Assoc. Equip. 2010, 612, 303–308. [Google Scholar] [CrossRef]
  8. Kudryavtsev, V.A.; Spooner, N.J.C.; McMillan, J.E. Simulations of muon-induced neutron flux at large depths underground. Nucl. Instrum. Methods Phys. Res. Sect. A Accel. Spectrom. Detect. Assoc. Equip. 2003, 505, 688–698. [Google Scholar] [CrossRef] [Green Version]
  9. Savic, M.; Dragic, A.; Veselinovic, N.; Udovicic, V.; Banjanac, R.; Jokovic, D.; Maletic, D. Effect of pressure and temperature corrections on muon flux variability at ground level and underground. arXiv 2016, arXiv:1701.00164. [Google Scholar]
  10. Maghrabi, A.; Almutayri, M. Atmospheric Effect on Cosmic Ray Muons at High Cut-Off Rigidity Station. Adv. Astron. 2016, 2016, 1–9. [Google Scholar] [CrossRef]
  11. Dorman, L.I. Cosmic Rays in the Earth’s Atmosphere and Underground. 2004. Available online: https://link.springer.com/book/10.1007/978-1-4020-2113-8?page=1#toc (accessed on 24 August 2021). [CrossRef]
  12. Dayananda, M.A. Correlation Studies of Cosmic Ray Flux and Atmospheric and Space Weather. Ph.D. Thesis, Georgia State University, Atlanta, GA, USA, 2013. [Google Scholar]
  13. De Mendonça, R.R.S.; Raulin, J.-P.; Echer, E.; Makhmutov, V.; Fernandez, G. Analysis of atmospheric pressure and temperature effects on cosmic ray measurements. J. Geophys. Res. Space Phys. 2013, 118, 1403–1409. [Google Scholar] [CrossRef]
  14. Savić, M.; Maletic, D.; Joković, D.; Veselinović, N.; Banjanac, R.; Udovičić, V.; Dragic, A. Pressure and temperature effect corrections of atmospheric muon data in the Belgrade cosmic-ray station. J. Phys. Conf. Ser. 2015, 632. [Google Scholar] [CrossRef]
  15. Ross, S.M. Introduction to Probability Models, 10th ed.; 2010; ISBN 978-0-12-375686-2. Available online: http://fac.ksu.edu.sa/sites/default/files/book_solution.pdf (accessed on 24 August 2021).
  16. Homola, P.; Beznosko, D.; Bhatta, G.; Bibrzycki, Ł.; Borczyńska, M.; Bratek, Ł.; Budnev, N.; Burakowski, D.; Alvarez-Castillo, D.E.; Almeida Cheminant, K.; et al. Cosmic-Ray Extremely Distributed Observatory. Symmetry 2020, 12, 1835. [Google Scholar] [CrossRef]
  17. International Q-Days and D-Days. Available online: http://wdc.kugi.kyoto-u.ac.jp/qddays/ (accessed on 14 February 2021).
  18. Kudela, K.; Langer, R. On quasi-periodic variations of low-energy cosmic rays observed near earth. Radiat. Prot. Dosim. 2015, 164, 471–476. [Google Scholar] [CrossRef] [PubMed]
  19. Arunbabu, K.P.; Ahmad, S.; Chandra, A.; Gupta, S.K.; Dugad, S.R.; Hariharan, B.; Hayashi, Y.; Jagadeesan, P.; Jain, A.; Jhansi, V.B.; et al. Atmospheric temperature dependence of muon intensity measured by the GRAPES-3 experiment. In Proceedings of the 35th International Cosmic Ray Conference—ICRC2017, Busan, Korea, 12–20 July 2017. [Google Scholar]
  20. Modzelewska, R.; Alania, M. Dependence of the 27-day variation of cosmic rays on the global magnetic field of the Sun. Adv. Space Res. 2012, 50, 716–724. [Google Scholar] [CrossRef] [Green Version]
  21. Takai, H.; Feldman, C.; Minelli, M.; Sundermier, J.; Winters, G.; Russ, M.K.; Dodaro, J.; Varshney, A.; McIlwaine, C.J.; Tomaszewski, T.; et al. Tidal Frequencies in the Time Series Measurements of Atmospheric Muon Flux from Cosmic Rays. arXiv 2016, arXiv:1610.05983. [Google Scholar]
  22. Kovalyov, M.; Kovalyov, S. On the relationship between cosmic rays, solar activity and powerful earthquakes. arXiv 2014, arXiv:1403.5728. [Google Scholar]
Figure 1. The relative positioning of the low-background, digital gamma-ray spectrometer’s detectors. In blue—horizontally (TOP and BOTTOM); in yellow—vertically placed scintillators (FRONT, SIDE and REAR). Each of the scintillators is 5 cm thick. The device is in operation at the Institute of Nuclear Physics Polish Academy of Sciences. Some parts of the passive shield (e.g., the lead walls) are hidden.
Applsci 11 07916 g001
Figure 2. Scintillator energy spectra discrimination procedure to eliminate fluctuations in the threshold level and signal gain. The black curve is the scintillation detector spectrum with a fixed threshold level set to the 300th ADC channel; the red dashed line represents 30% of the maximum number of counts registered in one channel in the given spectrum. The blue vertical line indicates the ADC channel defining the normalized discrimination level. The part of the spectrum below this channel is not used in further analyses.
Applsci 11 07916 g002
Figure 3. Expected count rate distributions for scintillation detectors: TOP (71.93 counts/s), BOTTOM (18.88 counts/s) and FRONT (14.43 counts/s).
Applsci 11 07916 g003
Figure 4. (a) Autocorrelation function of time intervals between events registered at the TOP scintillator. As shown, there is no correlation in the examined series. (b) Discrete Fourier transform analysis of the sequence of counts registered by detector TOP in 1 s. No significant periodicities were found. Similar results were obtained for other detectors: BOTTOM, FRONT, REAR and SIDE.
Applsci 11 07916 g004
Figure 5. Distribution of 471 coincidence events registered by TOP, BOTTOM, FRONT and REAR detectors. To obtain the data, a Gaussian distribution has been fitted (µ = 32 ns; σ = 12 ns).
Applsci 11 07916 g005
Figure 6. Determination of the barometric coefficient for the data recorded by the TOP detector. (a) Relative deviation of muon count rate as a function of pressure deviation for all data (blue markers) and for International Quiet Days (IQD) data—red markers. The correlation coefficient between the IQD data and the pressure variations was r 1 = 0.75 . Obtained barometric coefficient βP = −0.168 %/hPa. (b) Pressure corrected data; correlation coefficient reduced to r 2 = 0.08 .
Applsci 11 07916 g006
Figure 7. (a) Normalized changes in the muon flux intensity recorded by the TOP detector before correcting for atmospheric pressure, (b) changes in atmospheric pressure, (c) corrected muon flux intensity Icorr registered by scintillator TOP and (d) corrected muon flux intensity Icorr registered by scintillator FRONT.
Applsci 11 07916 g007
Figure 8. Discrete Fourier analysis of long-term muon intensity registered by scintillation detector TOP (a) and FRONT (b). Periodicities in time series 24 h (along with harmonics 12 h and 8 h), 27 d and 68 d have been found.
Applsci 11 07916 g008
Publisher’s Note: MDPI stays neutral with regard to jurisdictional claims in published maps and institutional affiliations.

