Next Article in Journal
Cone Beam Computer Tomography and Histological Evaluation of Dental Follicle of Impacted Lower Third Molar Germs in Teens: A Histo-Radiographic Correlation Study in a Case Series
Next Article in Special Issue
Investigations of Muon Flux Variations Detected Using Veto Detectors of the Digital Gamma-rays Spectrometer
Previous Article in Journal
Iron and Potassium Fertilization Improve Rocket Growth without Affecting Tilapia Growth and Histomorphology Characteristics in Aquaponics
Previous Article in Special Issue
Low-Pass Filtering Method for Poisson Data Time Series
 
 
applsci-logo
Article Menu

Article Menu

Article

The August 2018 Geomagnetic Storm Observed by the High-Energy Particle Detector on Board the CSES-01 Satellite

by
Francesco Palma
1,*,†,
Alessandro Sotgiu
1,2,
Alexandra Parmentier
1,
Matteo Martucci
1,2,
Mirko Piersanti
3,
Simona Bartocci
1,
Roberto Battiston
4,5,
William Jerome Burger
5,6,
Donatella Campana
7,
Luca Carfora
1,2,
Guido Castellini
8,
Livio Conti
1,9,
Andrea Contin
10,11,
Giulia D’Angelo
3,
Cinzia De Donato
1,
Cristian De Santis
1,
Francesco Maria Follega
4,5,
Roberto Iuppa
4,5,
Ignazio Lazzizzera
4,5,
Nadir Marcelli
1,2,
Giuseppe Masciantonio
1,
Matteo Mergé
1,†,
Alberto Oliva
11,
Giuseppe Osteria
7,
Federico Palmonari
10,11,
Beatrice Panico
7,
Francesco Perfetto
7,
Piergiorgio Picozza
1,2,
Michele Pozzato
11,
Ester Ricci
4,5,
Marco Ricci
12,
Sergio Bruno Ricciarini
8,
Zouleikha Sahnoun
11,
Valentina Scotti
7,13,
Roberta Sparvoli
1,2,
Vincenzo Vitale
1,
Simona Zoffoli
14 and
Paolo Zuccon
4,5
add Show full author list remove Hide full author list
1
INFN-Sezione di Roma Tor Vergata, V. della Ricerca Scientifica 1, I-00133 Rome, Italy
2
Department of Physics, University of Rome “Tor Vergata”, V. della Ricerca Scientifica 1, I-00133 Rome, Italy
3
INAF-IAPS, V. del Fosso del Cavaliere 100, I-00133 Rome, Italy
4
Department of Physics, University of Trento, V. Sommarive 14, I-38123 Povo, Italy
5
INFN-TIFPA, V. Sommarive 14, I-38123 Povo, Italy
6
Centro Fermi, V. Panisperna 89a, I-00184 Rome, Italy
7
INFN-Sezione di Napoli, V. Cintia, I-80126 Naples, Italy
8
IFAC-CNR, V. Madonna del Piano 10, I-50019 Sesto Fiorentino, Italy
9
Department of Engineering, Uninettuno University, C.so V. Emanuele II 39, I-00186 Rome, Italy
10
Department of Physics, University of Bologna, V.le C. Berti Pichat 6/2, I-40127 Bologna, Italy
11
INFN-Sezione di Bologna, V.le C. Berti Pichat 6/2, I-40127 Bologna, Italy
12
INFN-LNF, V. E. Fermi 40, I-00044 Frascati, Italy
13
Department of Physics, University of Naples “Federico II”, V. Cintia 21, I-80126 Naples, Italy
14
Italian Space Agency, V. del Politecnico, I-00133 Rome, Italy
*
Author to whom correspondence should be addressed.
At ASI Space Science Data Center (SSDC) also, V. del Politecnico, I-00133 Rome, Italy.
Appl. Sci. 2021, 11(12), 5680; https://doi.org/10.3390/app11125680
Submission received: 20 May 2021 / Revised: 7 June 2021 / Accepted: 16 June 2021 / Published: 19 June 2021
(This article belongs to the Special Issue Research on Cosmic Rays and Their Impact on Human Activities)

Abstract

:
On 25 August 2018, a G3-class geomagnetic storm reached the Earth’s magnetosphere, causing a transient rearrangement of the charged particle environment around the planet, which was detected by the High-Energy Particle Detector (HEPD) on board the China Seismo-Electromagnetic Satellite (CSES-01). We found that the count rates of electrons in the MeV range were characterized by a depletion during the storm’s main phase and a clear enhancement during the recovery caused by large substorm activity, with the key role played by auroral processes mapped into the outer belt. A post-storm rate increase was localized at L-shells immediately above ∼3 and mostly driven by non-adiabatic local acceleration caused by possible resonant interaction with low-frequency magnetospheric waves.

1. Introduction

Magnetic storms represent major signatures of variability in the Sun-Earth interaction. Such events appear as magnetic disturbances caused by bursts of radiation and charged particles emitted from the Sun in the form of coronal mass ejections (CMEs), solar flares, co-rotating interaction regions (CIRs), etc. [1,2]. These nonlinear and multiscale processes involve a vast set of plasma regions in the mutually interacting magnetosphere and ionosphere.
The terrestrial magnetosphere is under the permanent action of the solar wind. An increase in the solar wind dynamic pressure and a southward direction of the interplanetary magnetic field (IMF) are considered among the fundamental factors in magnetic storm development [3,4]. Under the solar wind driver, global changes occur in the magnetosphere following two principal dynamic triggers: magnetic reconnection at the dayside magnetopause [5] and viscous-like interactions causing magnetospheric convection [6]. One major consequence is the change in the fluxes of charged particles that constitute the magnetospheric ring current [7]. In cascade, the magnetosphere, which is mapped to the upper ionosphere through a system of field-aligned currents, can exchange momentum, energy, and particles with the latter by means of a variety of interactions [8,9]. For example, the transport of plasma between the plasmasphere and ionosphere is severely impacted by altered geomagnetic activity, leading to convection-driven erosion and refilling of the plasmasphere [10] or depletion due to reduced upward flux from the perturbed ionosphere [11].
Discerning physical phenomena that mark the solar-terrestrial environment is not the sole goal of the investigation of storm phenomena, since currently, geomagnetic storms and substorms can severely impact infrastructures at the ground level and in space, also posing a hazard to human health [12,13,14,15,16,17].
On 25 August 2018, the China Seismo-Electromagnetic Satellite (CSES-01) encountered the first strong magnetic storm since its launch on 2 February 2018. In this paper, after a sketch of the CSES-01 mission and the High-Energy Particle Detector (HEPD) in Section 2, a description of the major solar and geomagnetic characteristics of the storm is reported (Section 3). The magnetospheric disturbance was strong enough to trigger a response in the HEPD instrument; this is presented on the basis of HEPD trigger rate variations observed in the MeV energy range as a function of time and the McIlwain L-shell parameter (Section 4). Observations of this storm in a lower energy interval—from other particle detectors on board CSES-01—were previously presented in [18]. We discuss our results and draw our conclusions in Section 5 and Section 6, respectively.

2. Data and Methods

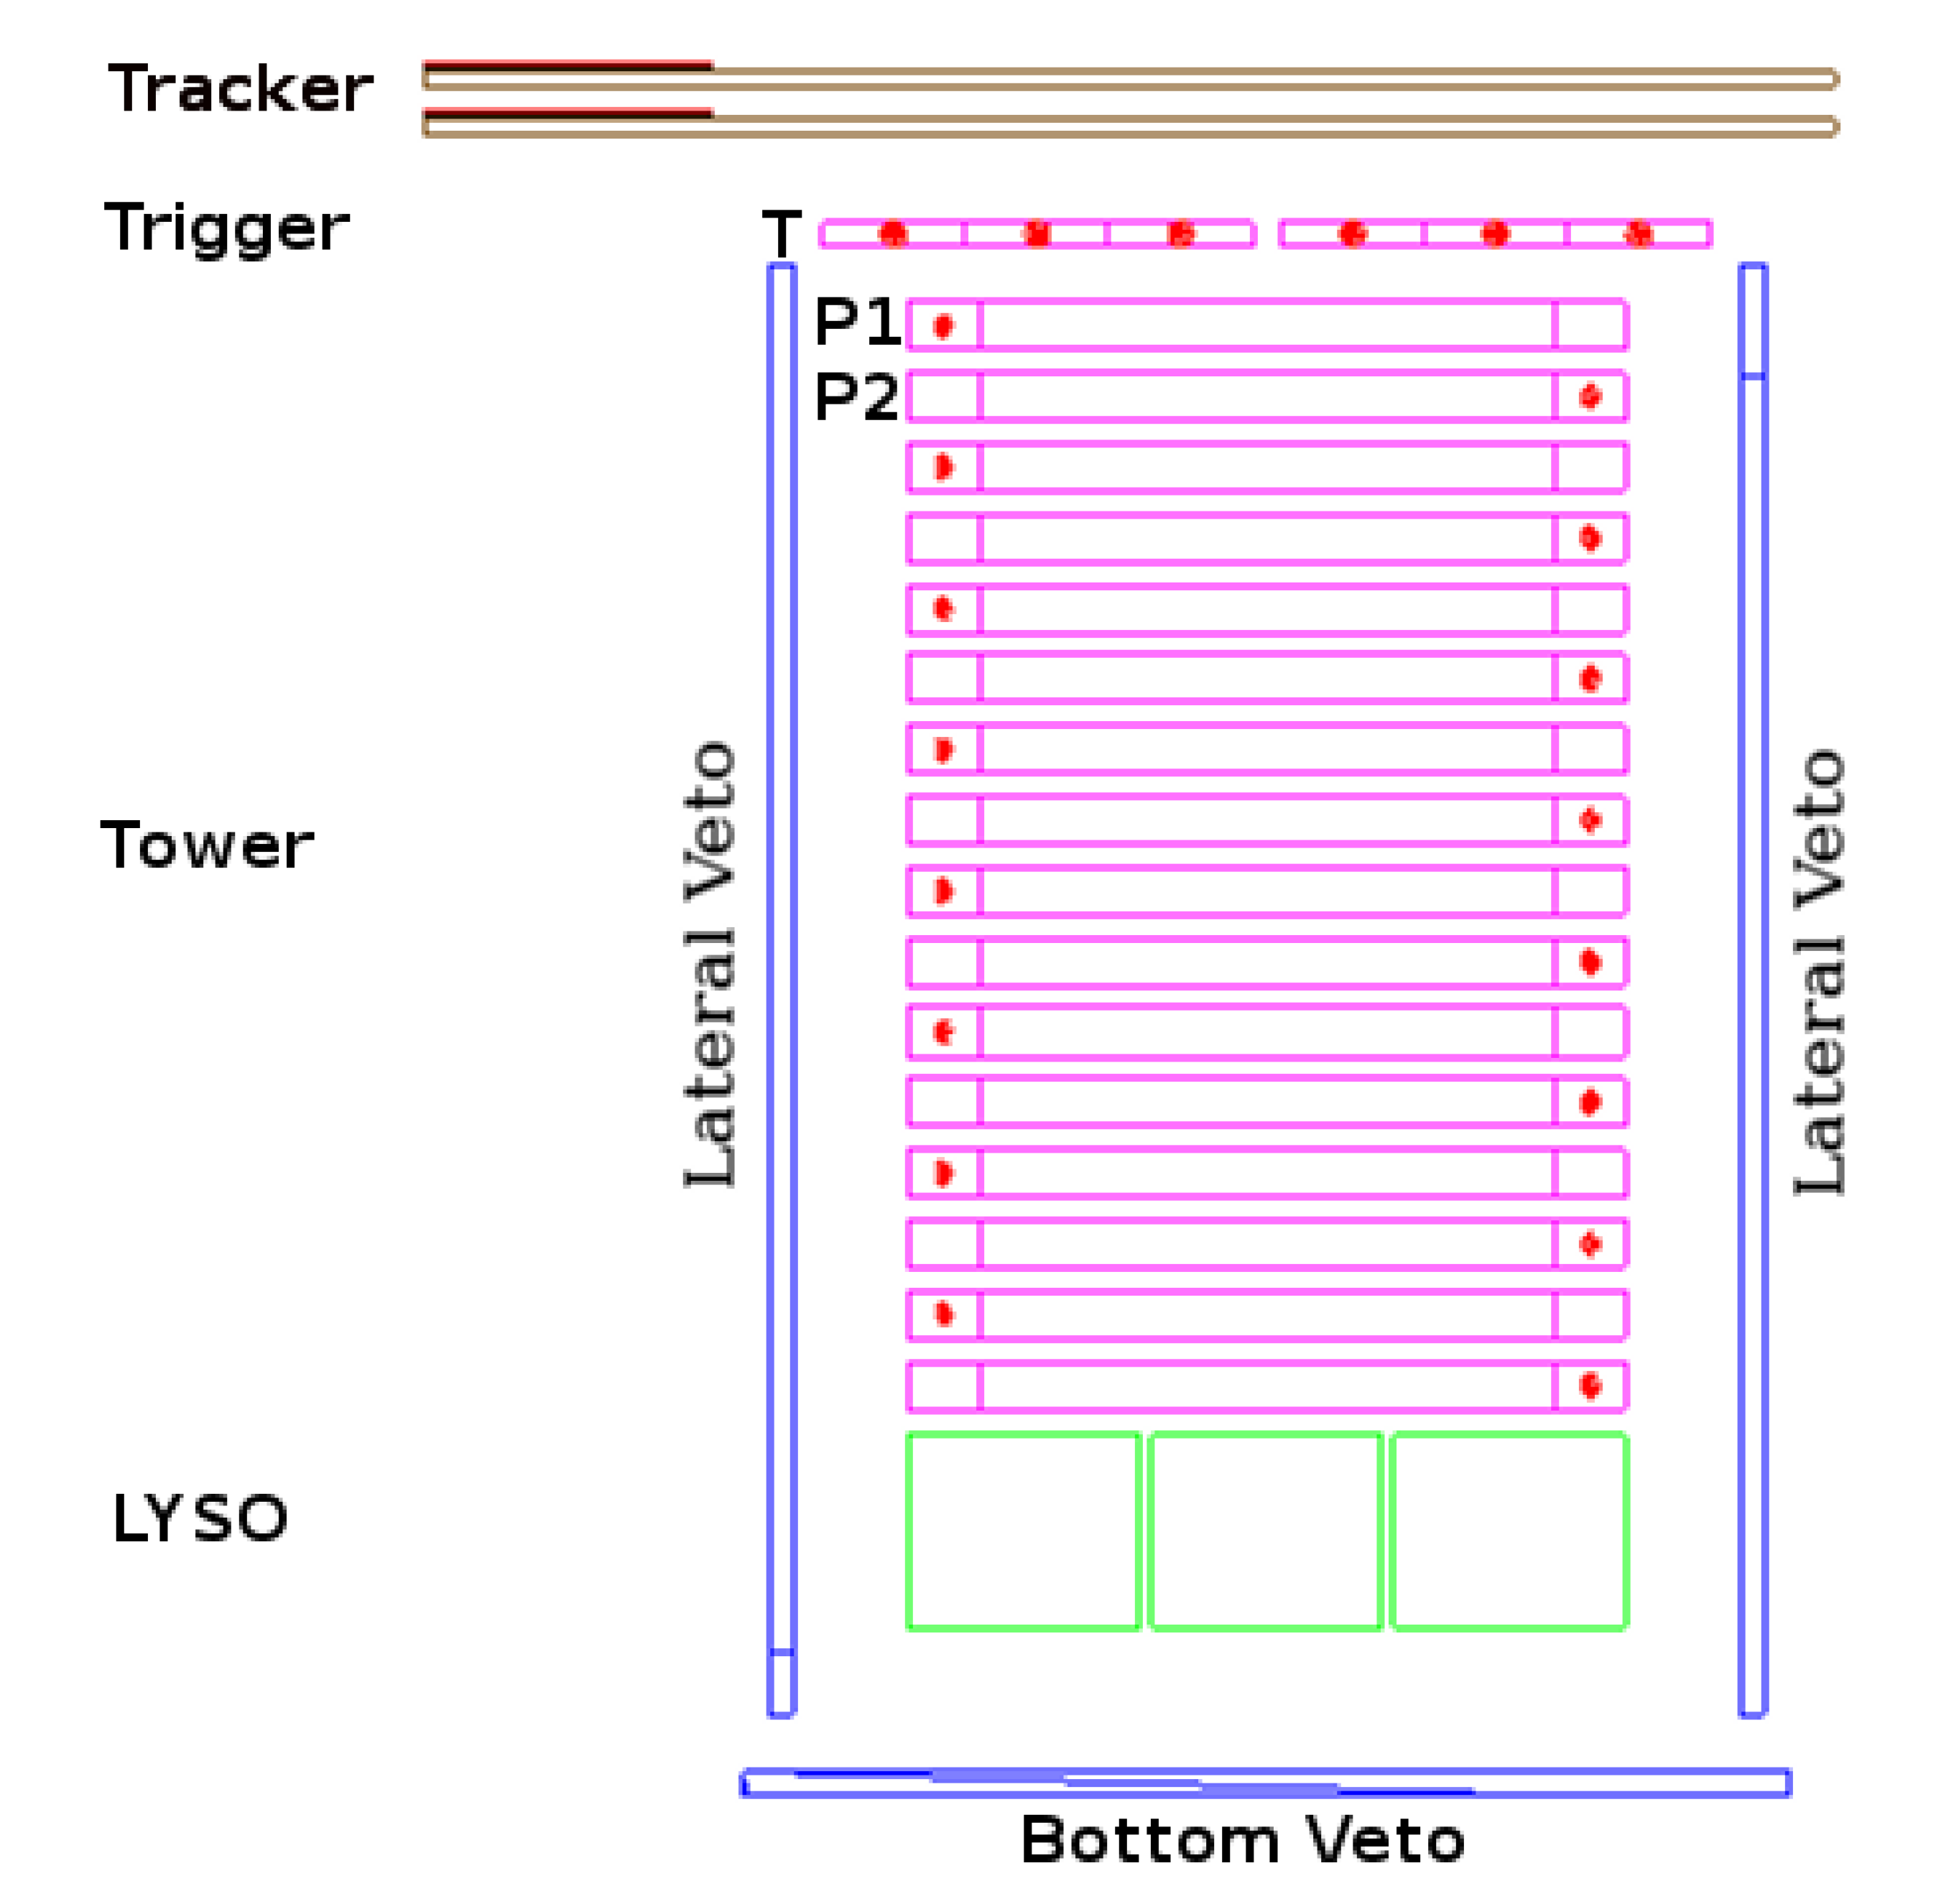
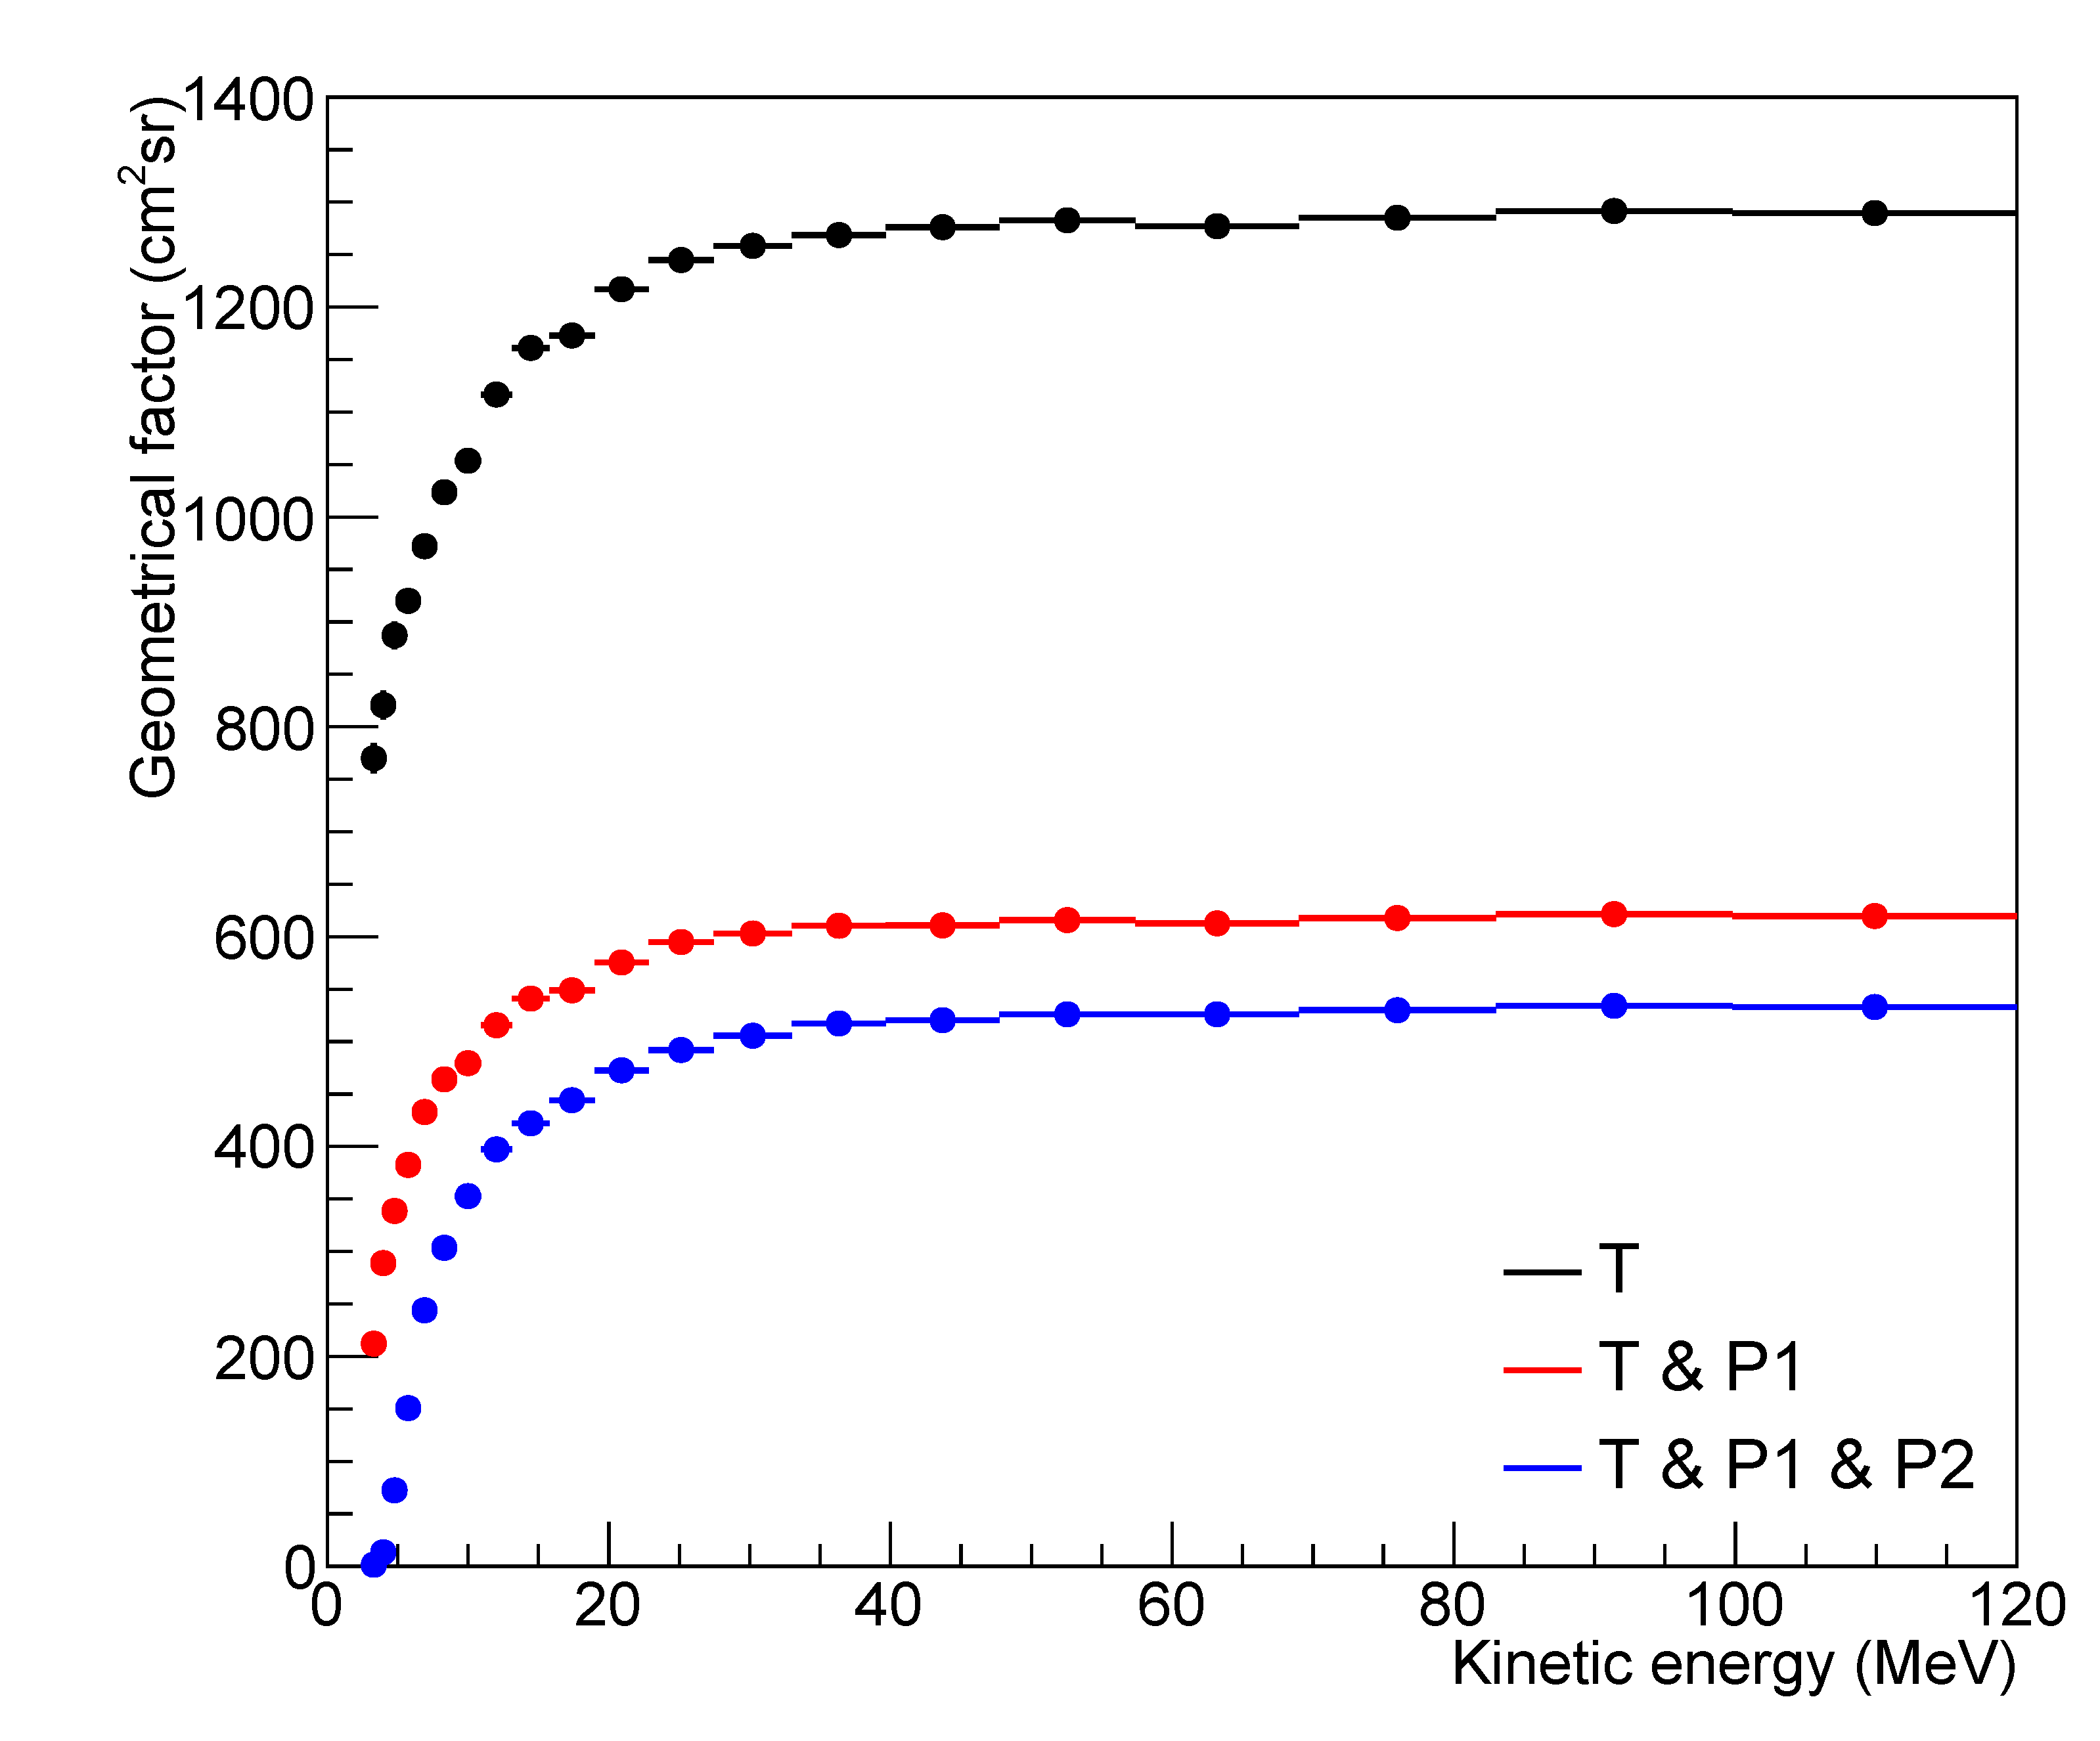
2.1. CSES-01 Mission and HEPD Detector

The CSES-01 [19] is the first item of a multi-satellite constellation under construction by several missions scheduled for the next few years. The satellite was designed for the observation of variations in particle fluxes, plasma parameters, and the electromagnetic field and waves, induced by both natural and anthropogenic sources in the near-Earth space. One major goal of this Chinese-Italian space mission is to investigate possible correlations between the above-mentioned perturbations and the occurrence of high-magnitude earthquakes. Other fundamental targets are the study of space weather phenomena [18,20] and cosmic ray propagation [21].
The CSES-01 relies on the Chinese three-axis stabilized CAST2000 platform, and it is flying in a Sun-synchronous polar orbit at a ∼507 km altitude with a 97° inclination and a five-day revisit time. Nine scientific payloads are present on board the satellite [22,23,24,25,26,27,28,29,30], among which is the HEPD particle detector, which was designed and built by the Italian Limadou Collaboration. A schematic representation of the apparatus is reported in Figure 1. The HEPD is made up of a silicon tracking system; a trigger system that includes one plastic scintillator layer segmented into six paddles; a range calorimeter comprising a tower of 16 plastic scintillator planes, a matrix of 3 × 3 LYSO (lutetium–yttrium oxyorthosilicate) scintillator crystals, and an anti-coincidence (VETO) system equipped with 5 plastic scintillator planes, out of which 4 are placed at the lateral sides of the apparatus and 1 at the bottom (see [30,31]).
Thanks to this set of subdetectors, the HEPD is optimized to detect electrons in the energy range between 3 and 100 MeV and protons between 30 and 250 MeV, as well as light nuclei. In addition, the apparatus can detect different particle populations (solar, trapped, galactic, etc.) according to the satellite position (defined by the McIlwain L-shell parameter) and detected energy.
The transmission of a dedicated command allows setting one of the eight predefined trigger mask configurations [32], which are the result of different logic combinations of counters from the various subdetectors. Hence, the different trigger masks define the aperture and the energy acceptance of the instrument. The trigger condition, labeled as T, corresponds to an above-threshold signal only in the trigger plane, and it is associated with the lowest energy threshold. By requiring a deeper penetration of the particle inside the detector (i.e., using the trigger plane counters and a set of tower planes in “AND” configuration, such as T & P1, T & P1 & P2, and so on), the geometric factor of the HEPD decreases, and consequently, the energy threshold for triggering increases. In July 2018 (late commissioning phase), the HEPD was configured with a trigger condition, labeled as T & P1 & P2, which corresponds to event acquisition and processing only when the released signals in the trigger plane and the first two calorimeter planes (P1, P2) are above predefined thresholds. However, for each of the predefined masks, even when not selected for the online acquisition, a rate meter independently provides the corresponding trigger counting rate (1 s resolution). In this paper, we used the rate meters of three trigger masks (T, T & P1, and T & P1 & P2), corresponding to the integral number of particles per second above different energy thresholds.
Due to adjustments in attitude and additional scheduled maneuvers, the CSES-01 payloads are usually switched off at latitudes below −65° and above +65°. However, the HEPD can benefit from its large field of view (±60°) and geometrical acceptance to collect particles at large L-shells, though for a short time per day. Figure 2 shows the Monte Carlo-based geometrical factor of the HEPD for electrons in three different trigger configurations. In the current one (T & P1 & P2), the geometrical factor reaches a plateau value of ∼500 cm2sr at energies larger than ∼30 MeV.

2.2. NOAA19/POES Satellite

NOAA19 is the youngest element in the constellation of the National Oceanic and Atmospheric Administration (NOAA) Polar Orbiting Environmental Satellites (POES), moving along a Sun-synchronous low-Earth orbit (revisit time: 102 min; inclination: 98.7°) at an altitude of ∼850 km, and currently serving as the Prime Service Mission.
The onboard SEM-2 package mounts the Medium Energy Proton and Electron Detector (MEPED) [33], also including two couples of 30°-wide telescopes, of which two are approximately zenith-pointing (MEPED-0°) and two have an azimuthal orientation (MEPED-90°). The electron telescope pair operates in the range from 40 to 2500 keV, over four integral energy channels (E1: > 40 keV; E2: > 130 keV; E3: > 287 keV; E4: > 612 keV).
The Sub-MeV fluxes used in this study were from the MEPED-90° electron telescope in the E2 channel, which represents the best compromise in terms of detection efficiency over the available energy range [34] vs. proton contamination [35].

2.3. DMSP Satellite

The auroral observations used in this study were from the Defense Meteorological Satellite Program (DMSP), consisting of a group of polar, Sun-synchronous satellites flying at ∼850 km with a period of ∼100 minutes [36]. The DMSP mission focuses on the observation of the near-Earth space plasma environment. In particular, we used the Special Sensor Ultraviolet Spectrographic Imager (SSUSI) instrument on board the DMSP, which is designed to measure far-ultraviolet emissions via imaging spectrograph (SIS) mapping through 5 spectral bins: 121.6 nm ( H I Lyman α ), 130.4 nm ( O I ), 135.6 nm ( O I ), 140–160 nm ( N 2 LBHS) and 160–180 nm ( N 2 LBHL) [37]. The image resolution is 16 × 156 pixel, while the time resolution (i.e., time to fly above the polar region and acquire an image) is between 20 and 30 min [37].

2.4. RBSP Satellites

The dual-spacecraft Radiation Belt Storm Probes (RBSPs) move along highly elliptical orbits (extending from 1.2 to 5.8 R E ) at an inclination of 10°, thus offering a non-ionospheric point of view due to direct penetration of the radiation belts.
The Relativistic Electron-Proton Telescope (REPT) on board the satellites of the RBSP class measures electrons in differential bins in the energy range ∼1–20 MeV with high detection efficiency above 5 MeV. A background partly due to galactic cosmic rays primarily afflicts the REPT measurements in the highest electron channels [38].

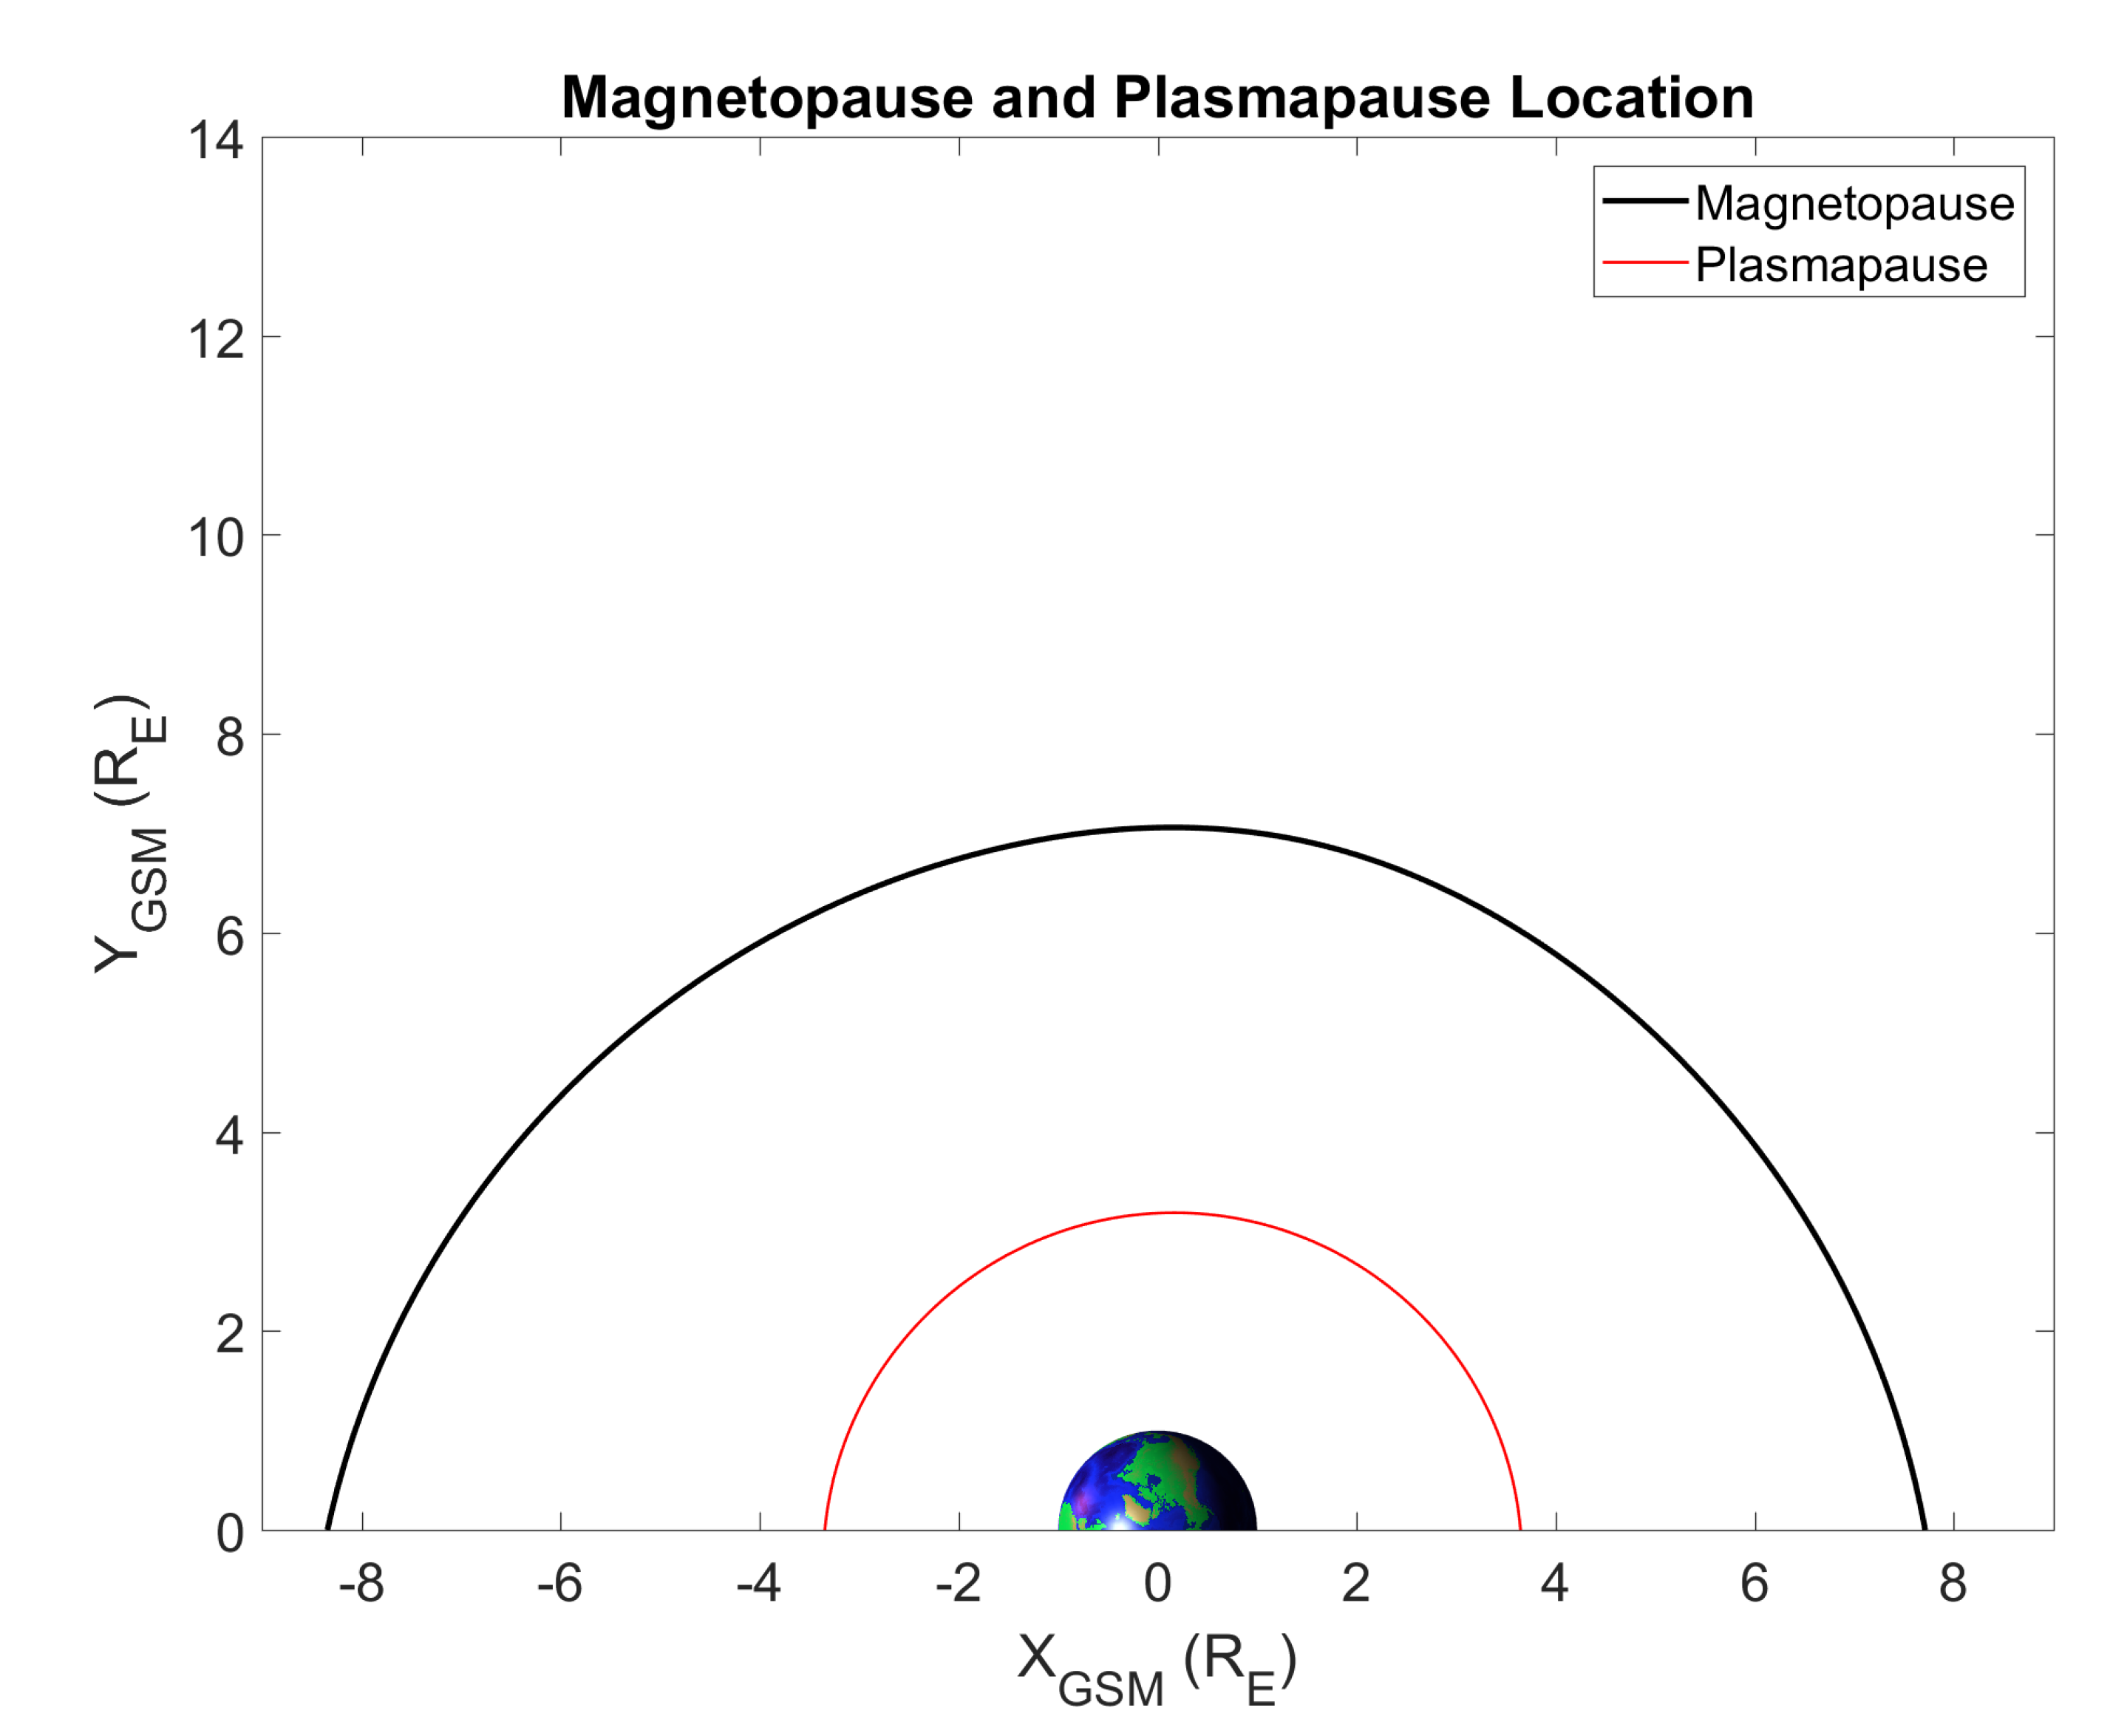
2.5. Magnetopause and Plasmapause Position Models

The magnetopause position was obtained by means of the Tsyganenko [39,40] T01 magnetospheric field model. T01 is a semi-empirical model in which the total magnetospheric field of external origin comes from the sum of the Chapman-Ferraro current and contributions from cross-tail, ring, and field-aligned currents. All these contributions are calculated taking into account the solar wind (SW) dynamic pressure, the interplanetary magnetic field (IMF) configuration, and the Dst index. For the present analysis, we used the SW and IMF observations stored in the OMNI CDAWeb repository.
The plasmapause location was assessed using the Liu and Liu [41] model, which is based on the experimental THEMIS-D satellite plasmapause crossing database. The model is based on the following equation:
ϕ = 2 π ( M L T / 24 ) ,
Ł p p = a 1 · [ 1 + a M L T c o s ( ϕ 2 π a p h i / 24 ) ] · l o g 10 | D s t i n d e x | + + b 1 · [ 1 + b M L T c o s ( ϕ 2 π b p h i / 24 ) ] ,
where MLT is the magnetic local time. The parameters used in the calculation of Ł p p are reported in Table 1.

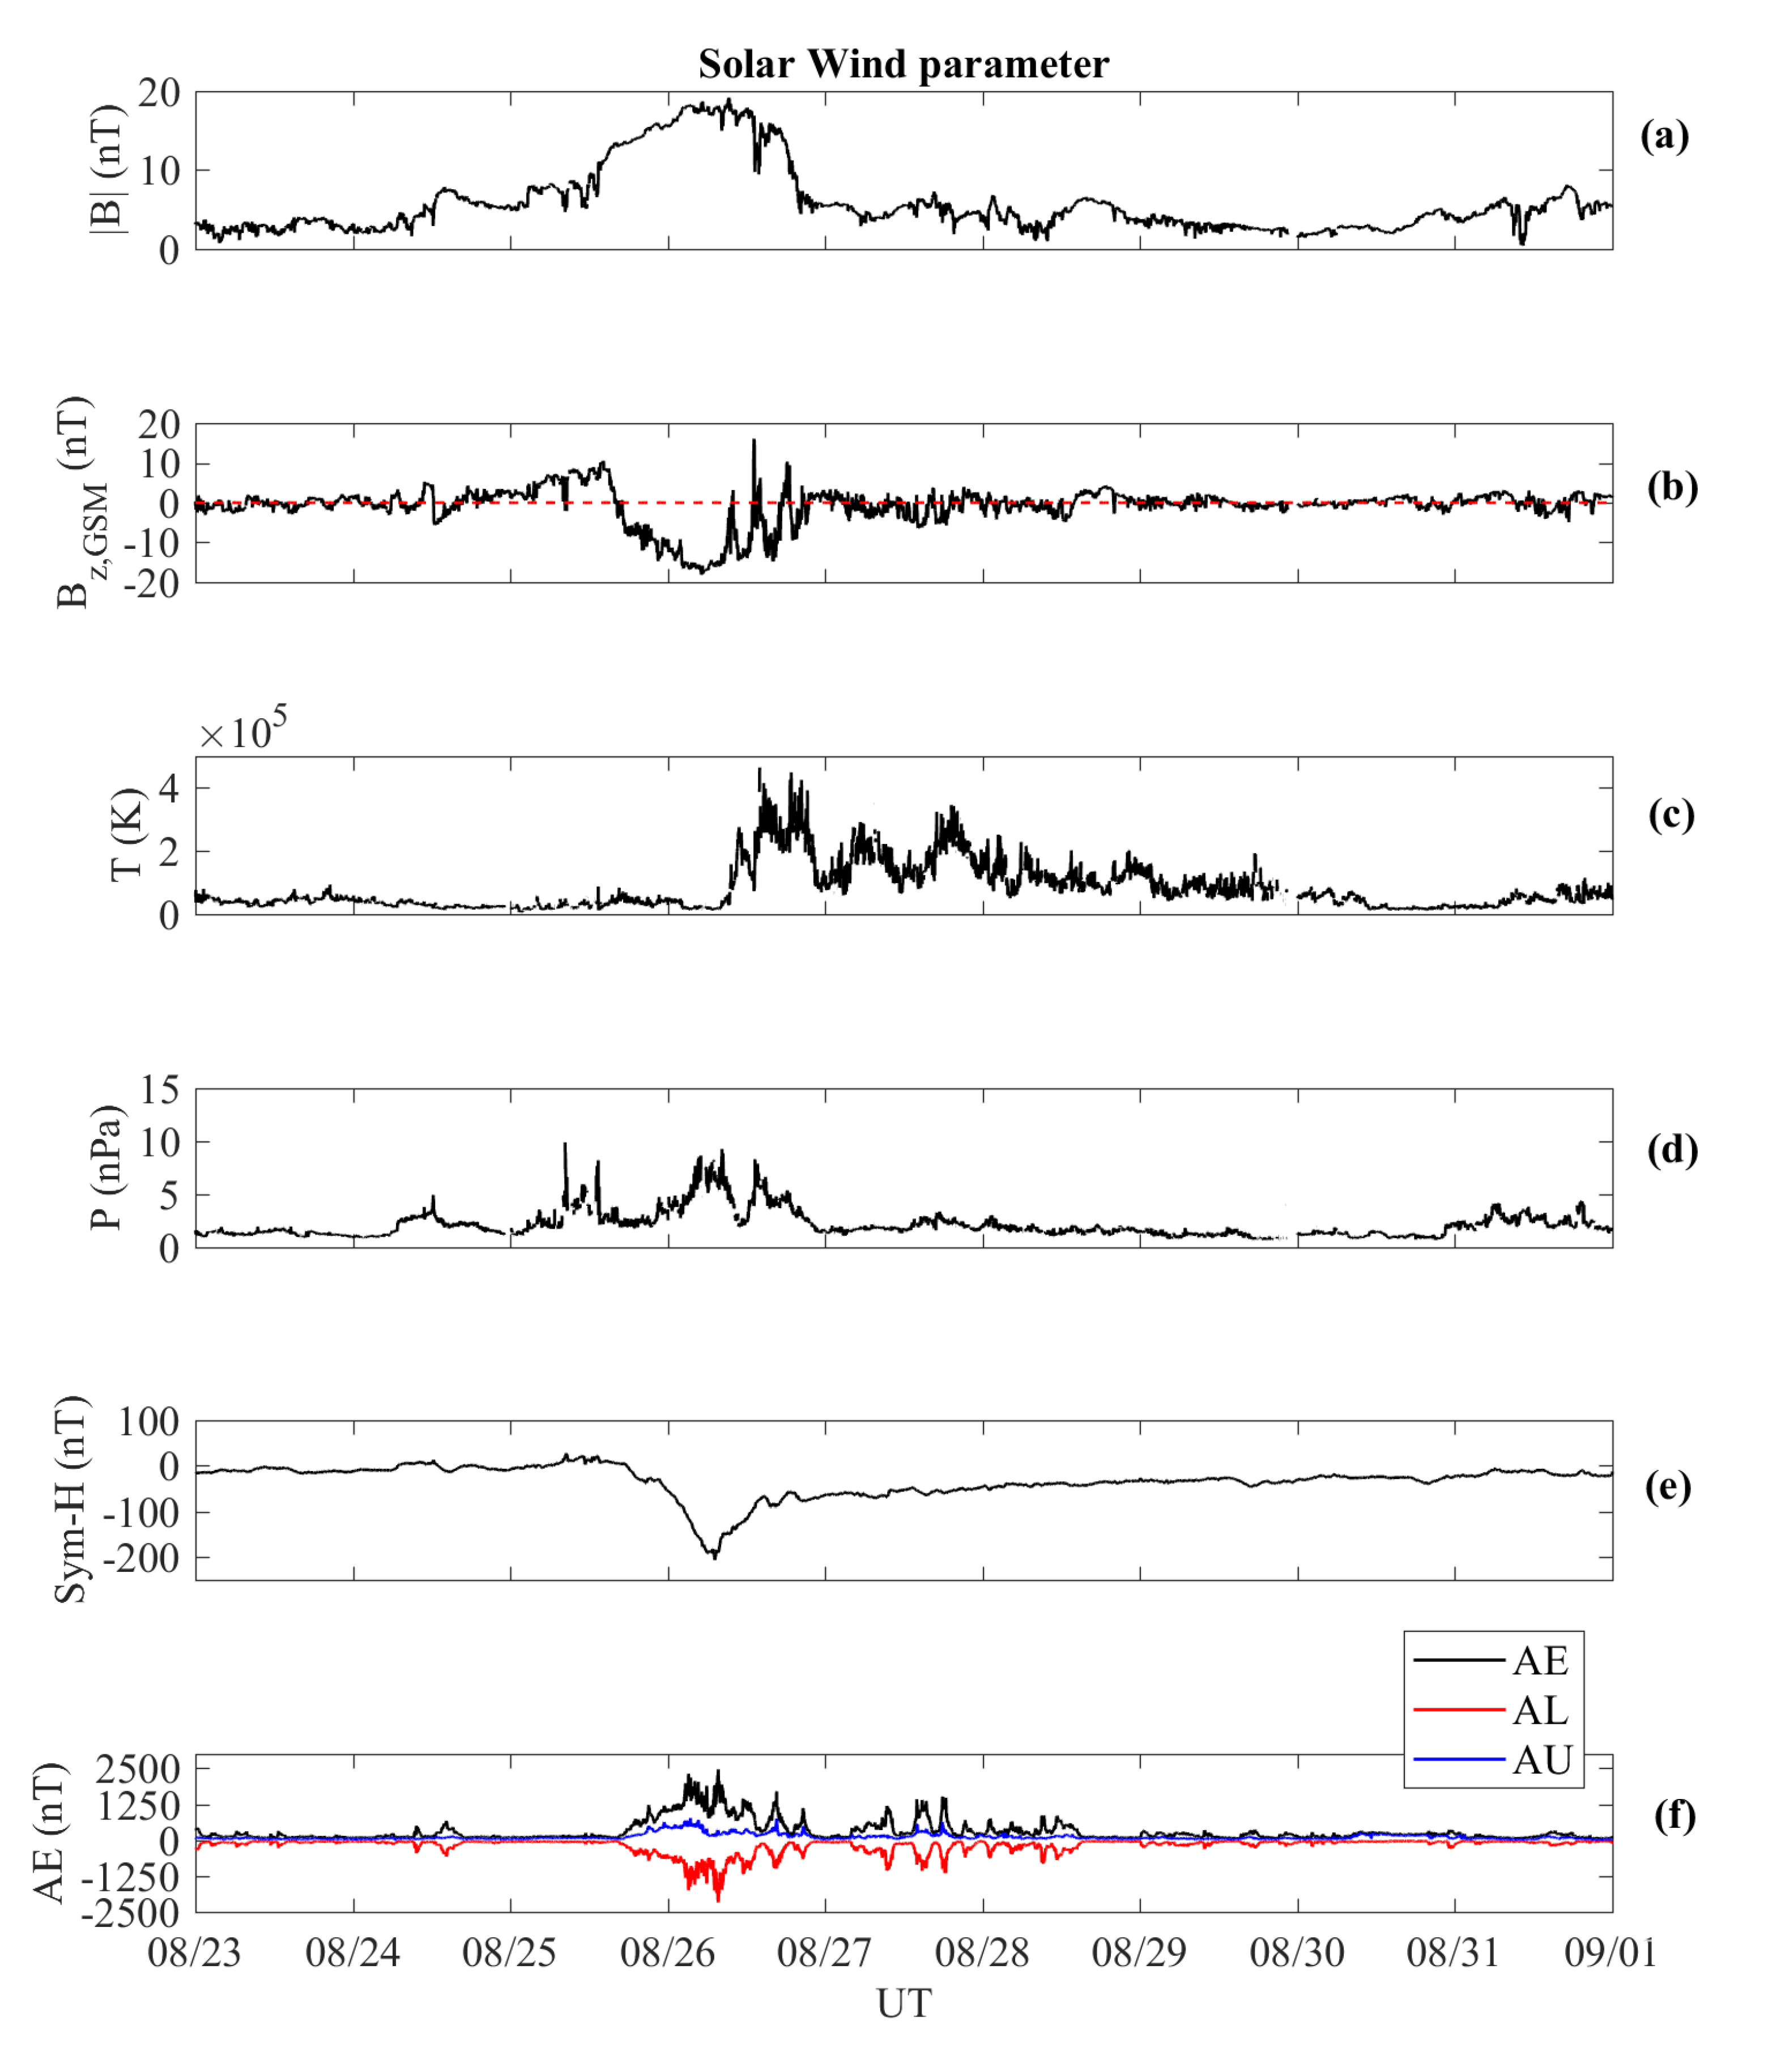
3. The August 2018 Geomagnetic Storm

On 20 August 2018, a large-scale filament gradually erupted from a quiet region of the Sun into an interplanetary CME (ICME) that affected the Earth’s environment a few days later, starting on late 25 August 2018 [42] and giving rise to the third largest storm of Solar Cycle 24.
Figure 3 shows the SW parameters as retrieved by the ACE satellite (at the Lagrangian L1 point) from 23–31 August 2018. The magnetic cloud impinged the Earth’s magnetosphere between 25 August at ∼12:15 UT and 26 August at ∼10:00 UT. Looking at Figure 3, we were able to determine the ICME boundaries [43] using the IMF behavior (Panel a) in conjunction with the SW temperature (Panel c) and the SW dynamic pressure (Panel d). Indeed, upon the ICME’s arrival, the SW temperature decreased from ∼ 9 × 10 4 K to ∼ 1.5 × 10 4 K, while the IMF increased to 18 nT, lasting for approximately 12 h. At the same time, the IMF underwent a smooth rotation, leading to a prolonged (∼22 h) southward orientation (Panel b) at ≈14:30 UT on 25 August. Finally, the solar wind dynamic pressure fluctuated between ∼4 nPa and ∼10 nPa. A CIR followed on 26 August: the SW temperature increased from × 10 4 K to nearly 30 × 10 4 K around 12:20 UT, with the pressure increasing from ∼2 nPa to ∼8 nPa, as the solar wind stream was crossing a negative polarity high-speed stream (HSS) [42].
To evaluate the consequences of the ICME impact on the Earth’s environment, we used the Sym-H index (which mirrors the dynamics of the symmetric part of the ring current [44]) and the AE index (which indirectly measures the energy deposition rate in the polar ionosphere [45]). On 26 August, Sym-H (Figure 3e) showed a rapid decrease, reaching its minimum value ( 190 nT) at 07:57 UT. This structure mimics the behavior of the B z component of the IMF, which shows a long-lasting (∼10 h) negative value starting at 16:52 UT of 25 August. This trend is clearly related to the southward IMF carried by the magnetic cloud [43]. As a consequence of this long interval of negative B z , the SW plasma could flow inside the Earth’s magnetosphere, possibly due to the occurrence of magnetic reconnection at the magnetopause between the geomagnetic field and the IMF [42].
The large bursts in the AE index (black line in Figure 3f) can be related to a sequence of fast relaxation events, possibly stemming from an activity in the near-Earth magnetotail regions in the form of a sequence of loading-unloading releases of energy [46,47]. Such processes give rise to a great amount of particle precipitation in the high-latitude region as confirmed by the behavior of the AL index (red line), which is excellently correlated with the negative turn of B z . AL (and hence AE) peaks are directly related to the north-south flip of B z between 11:00 UT and 21:00 UT on 26 August, induced by the arrival of the CIR.

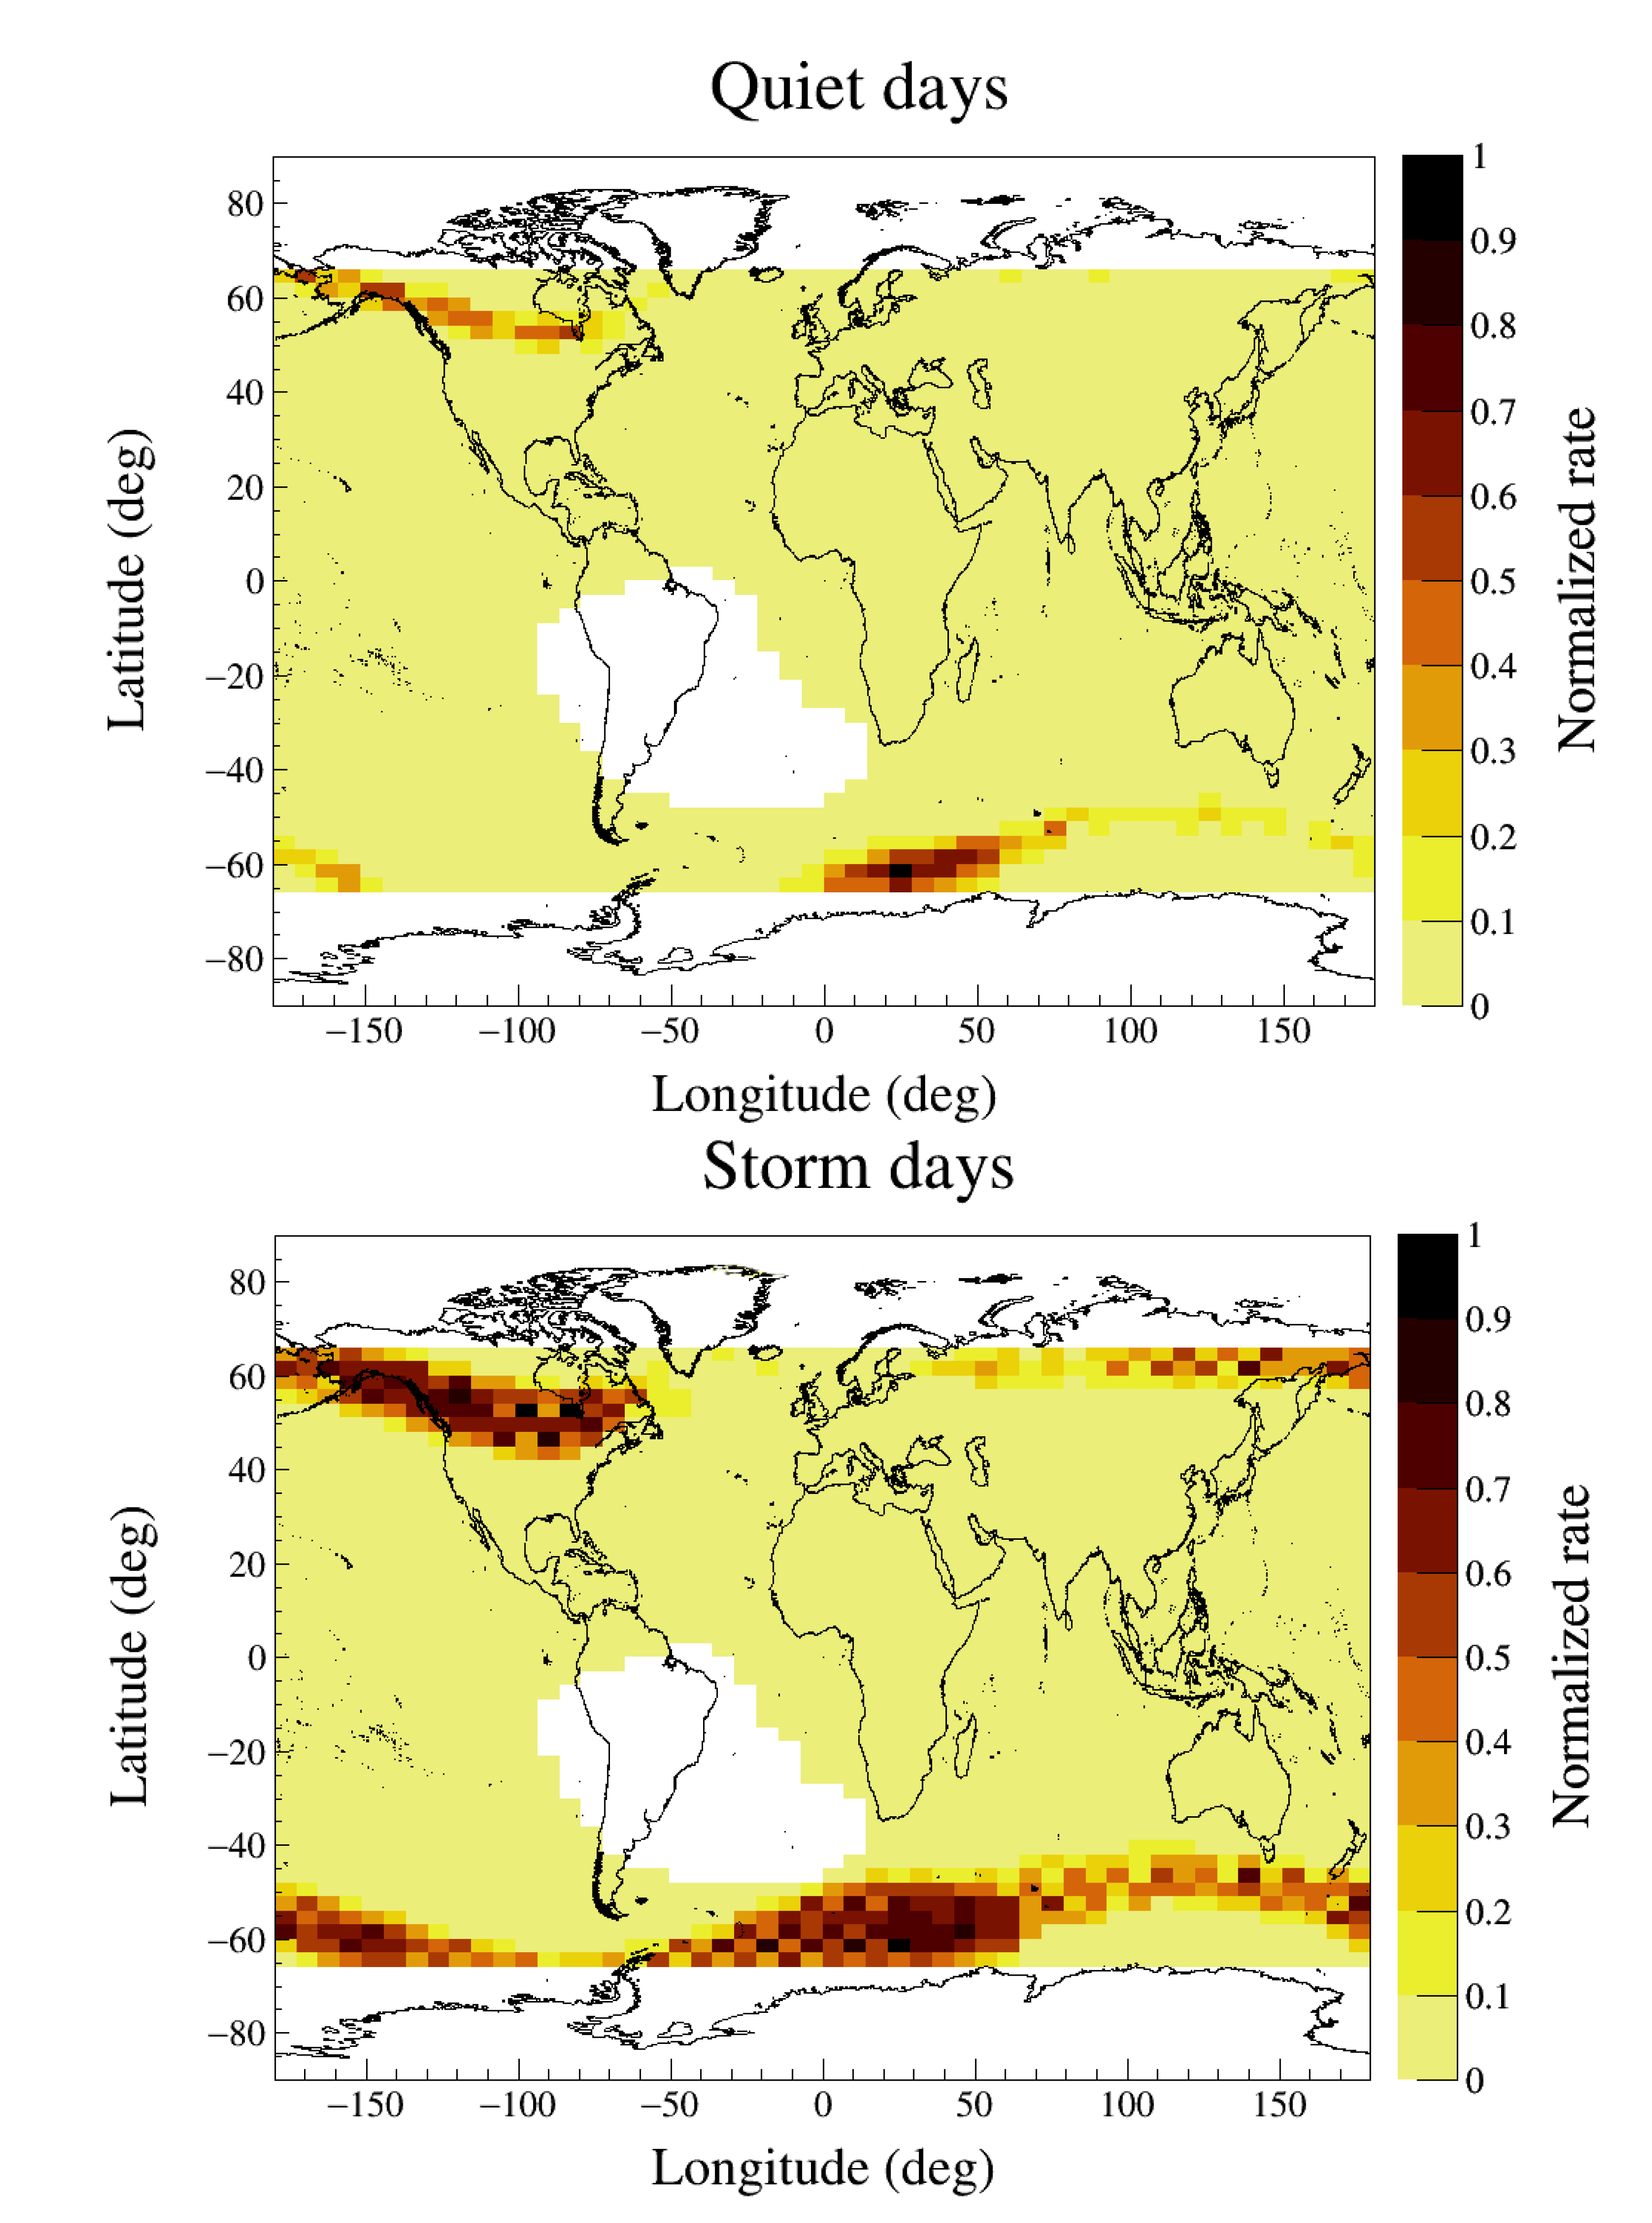
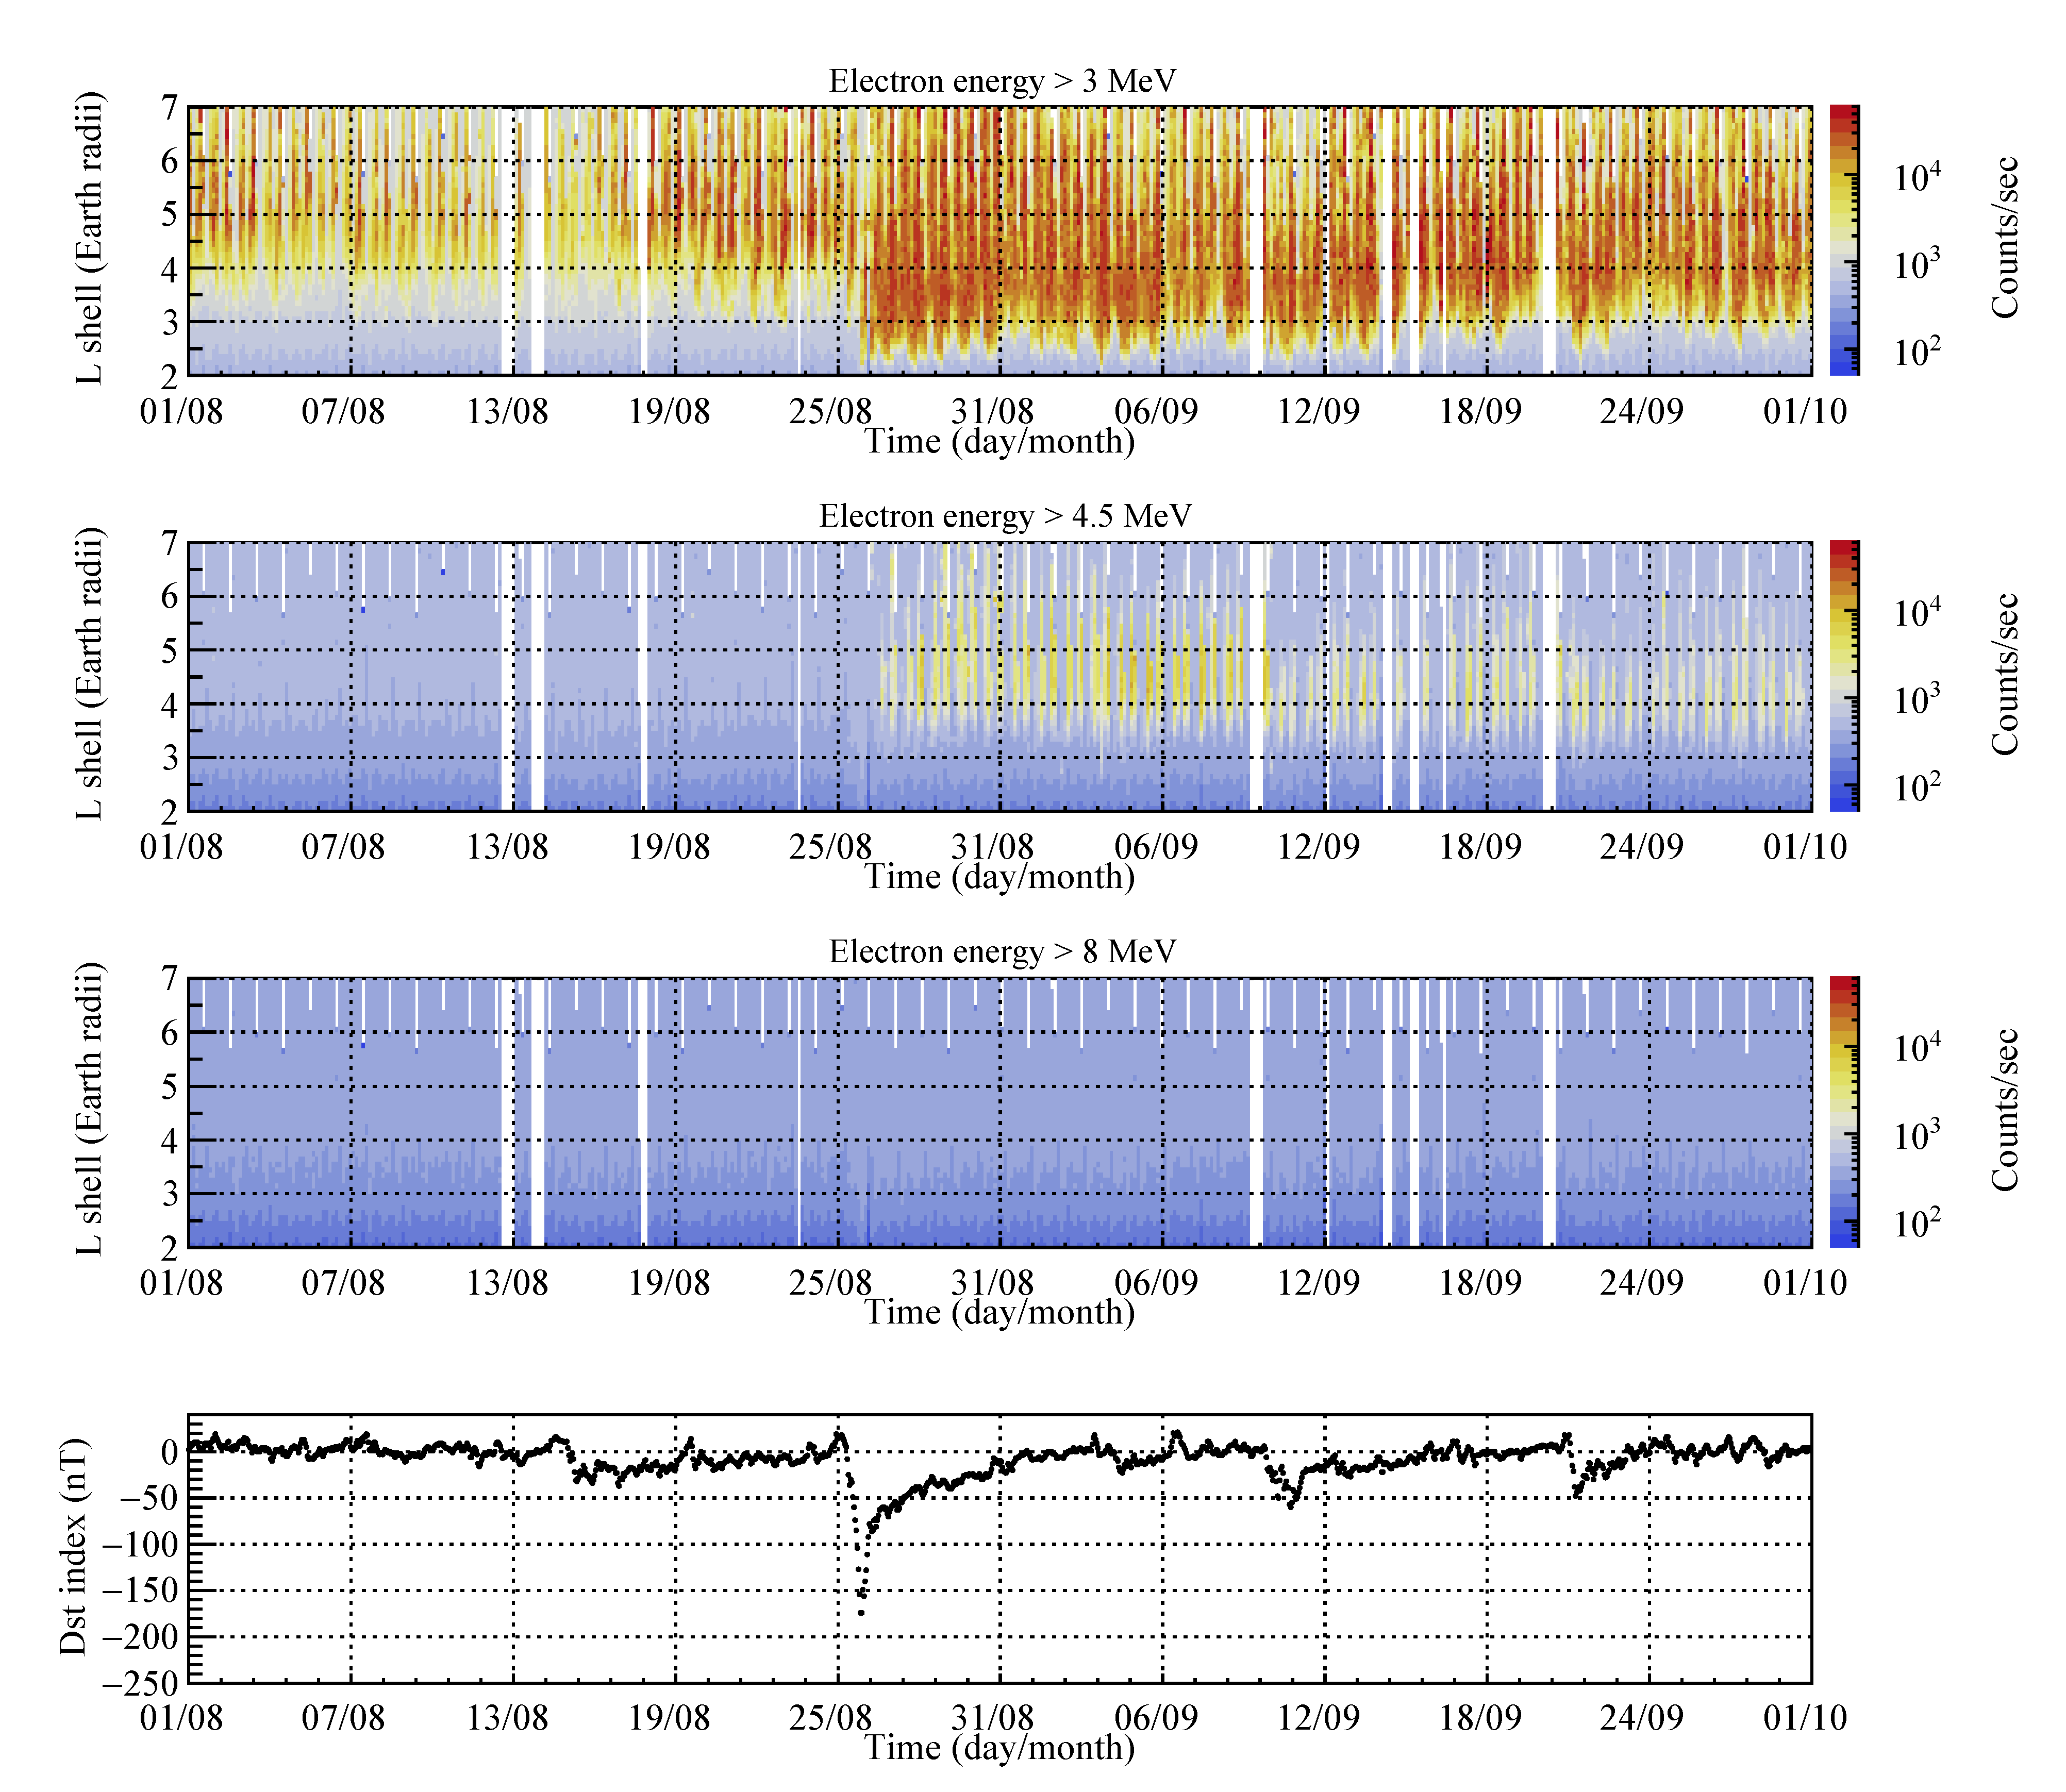
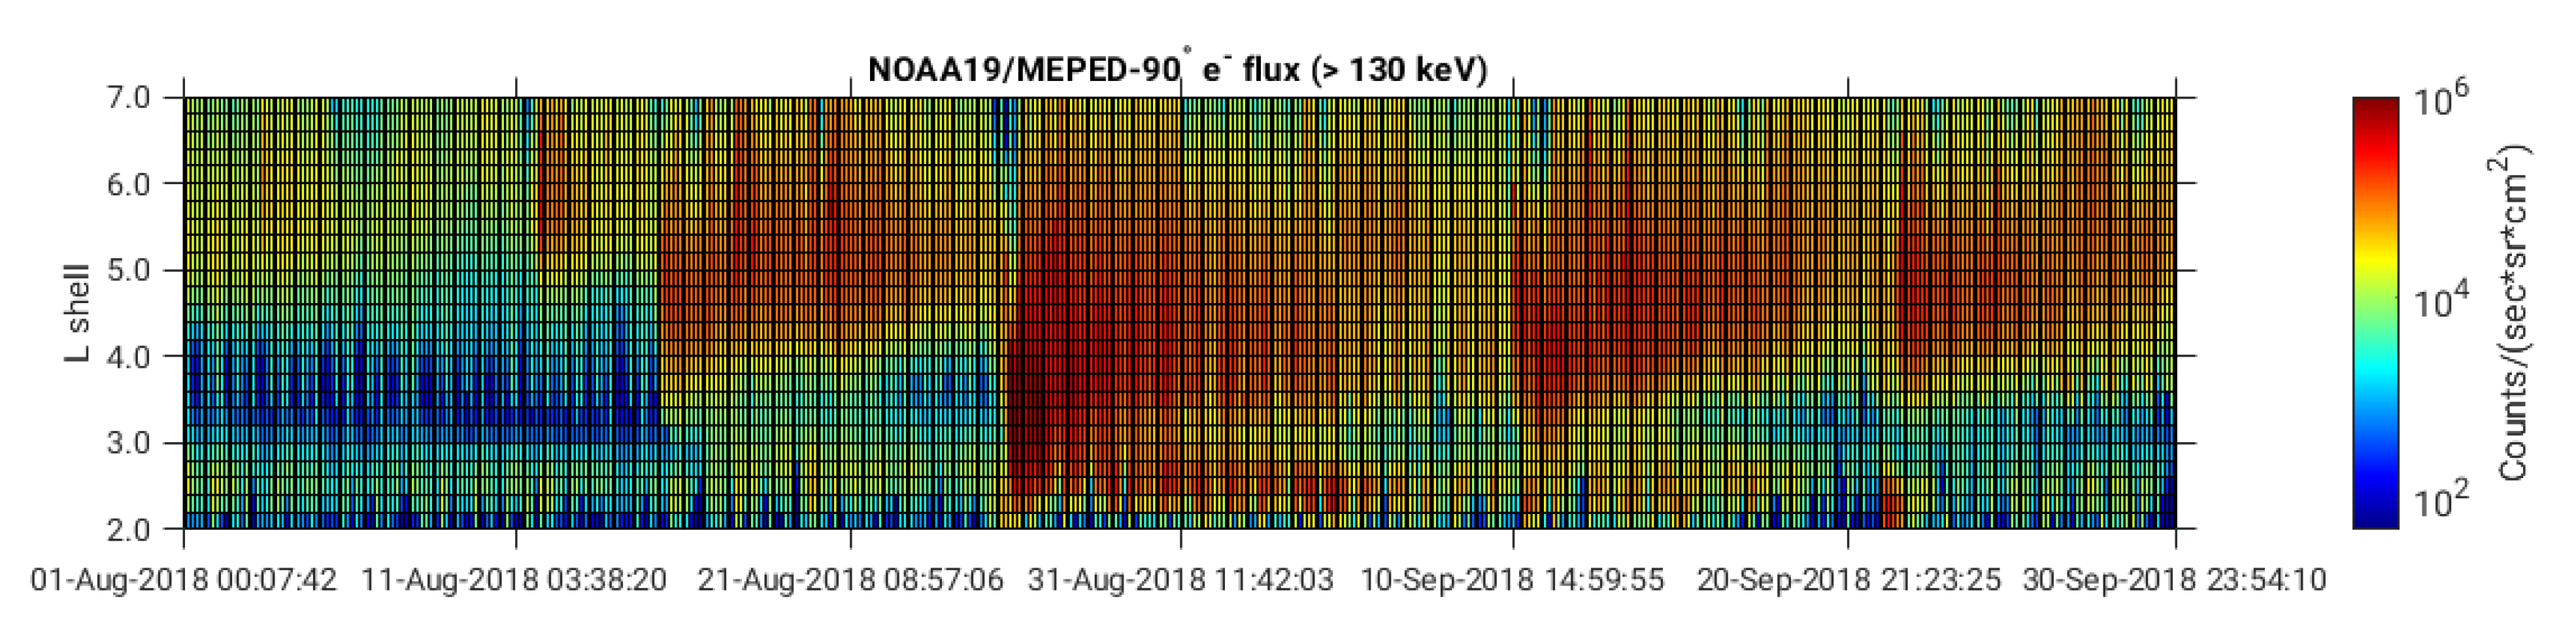
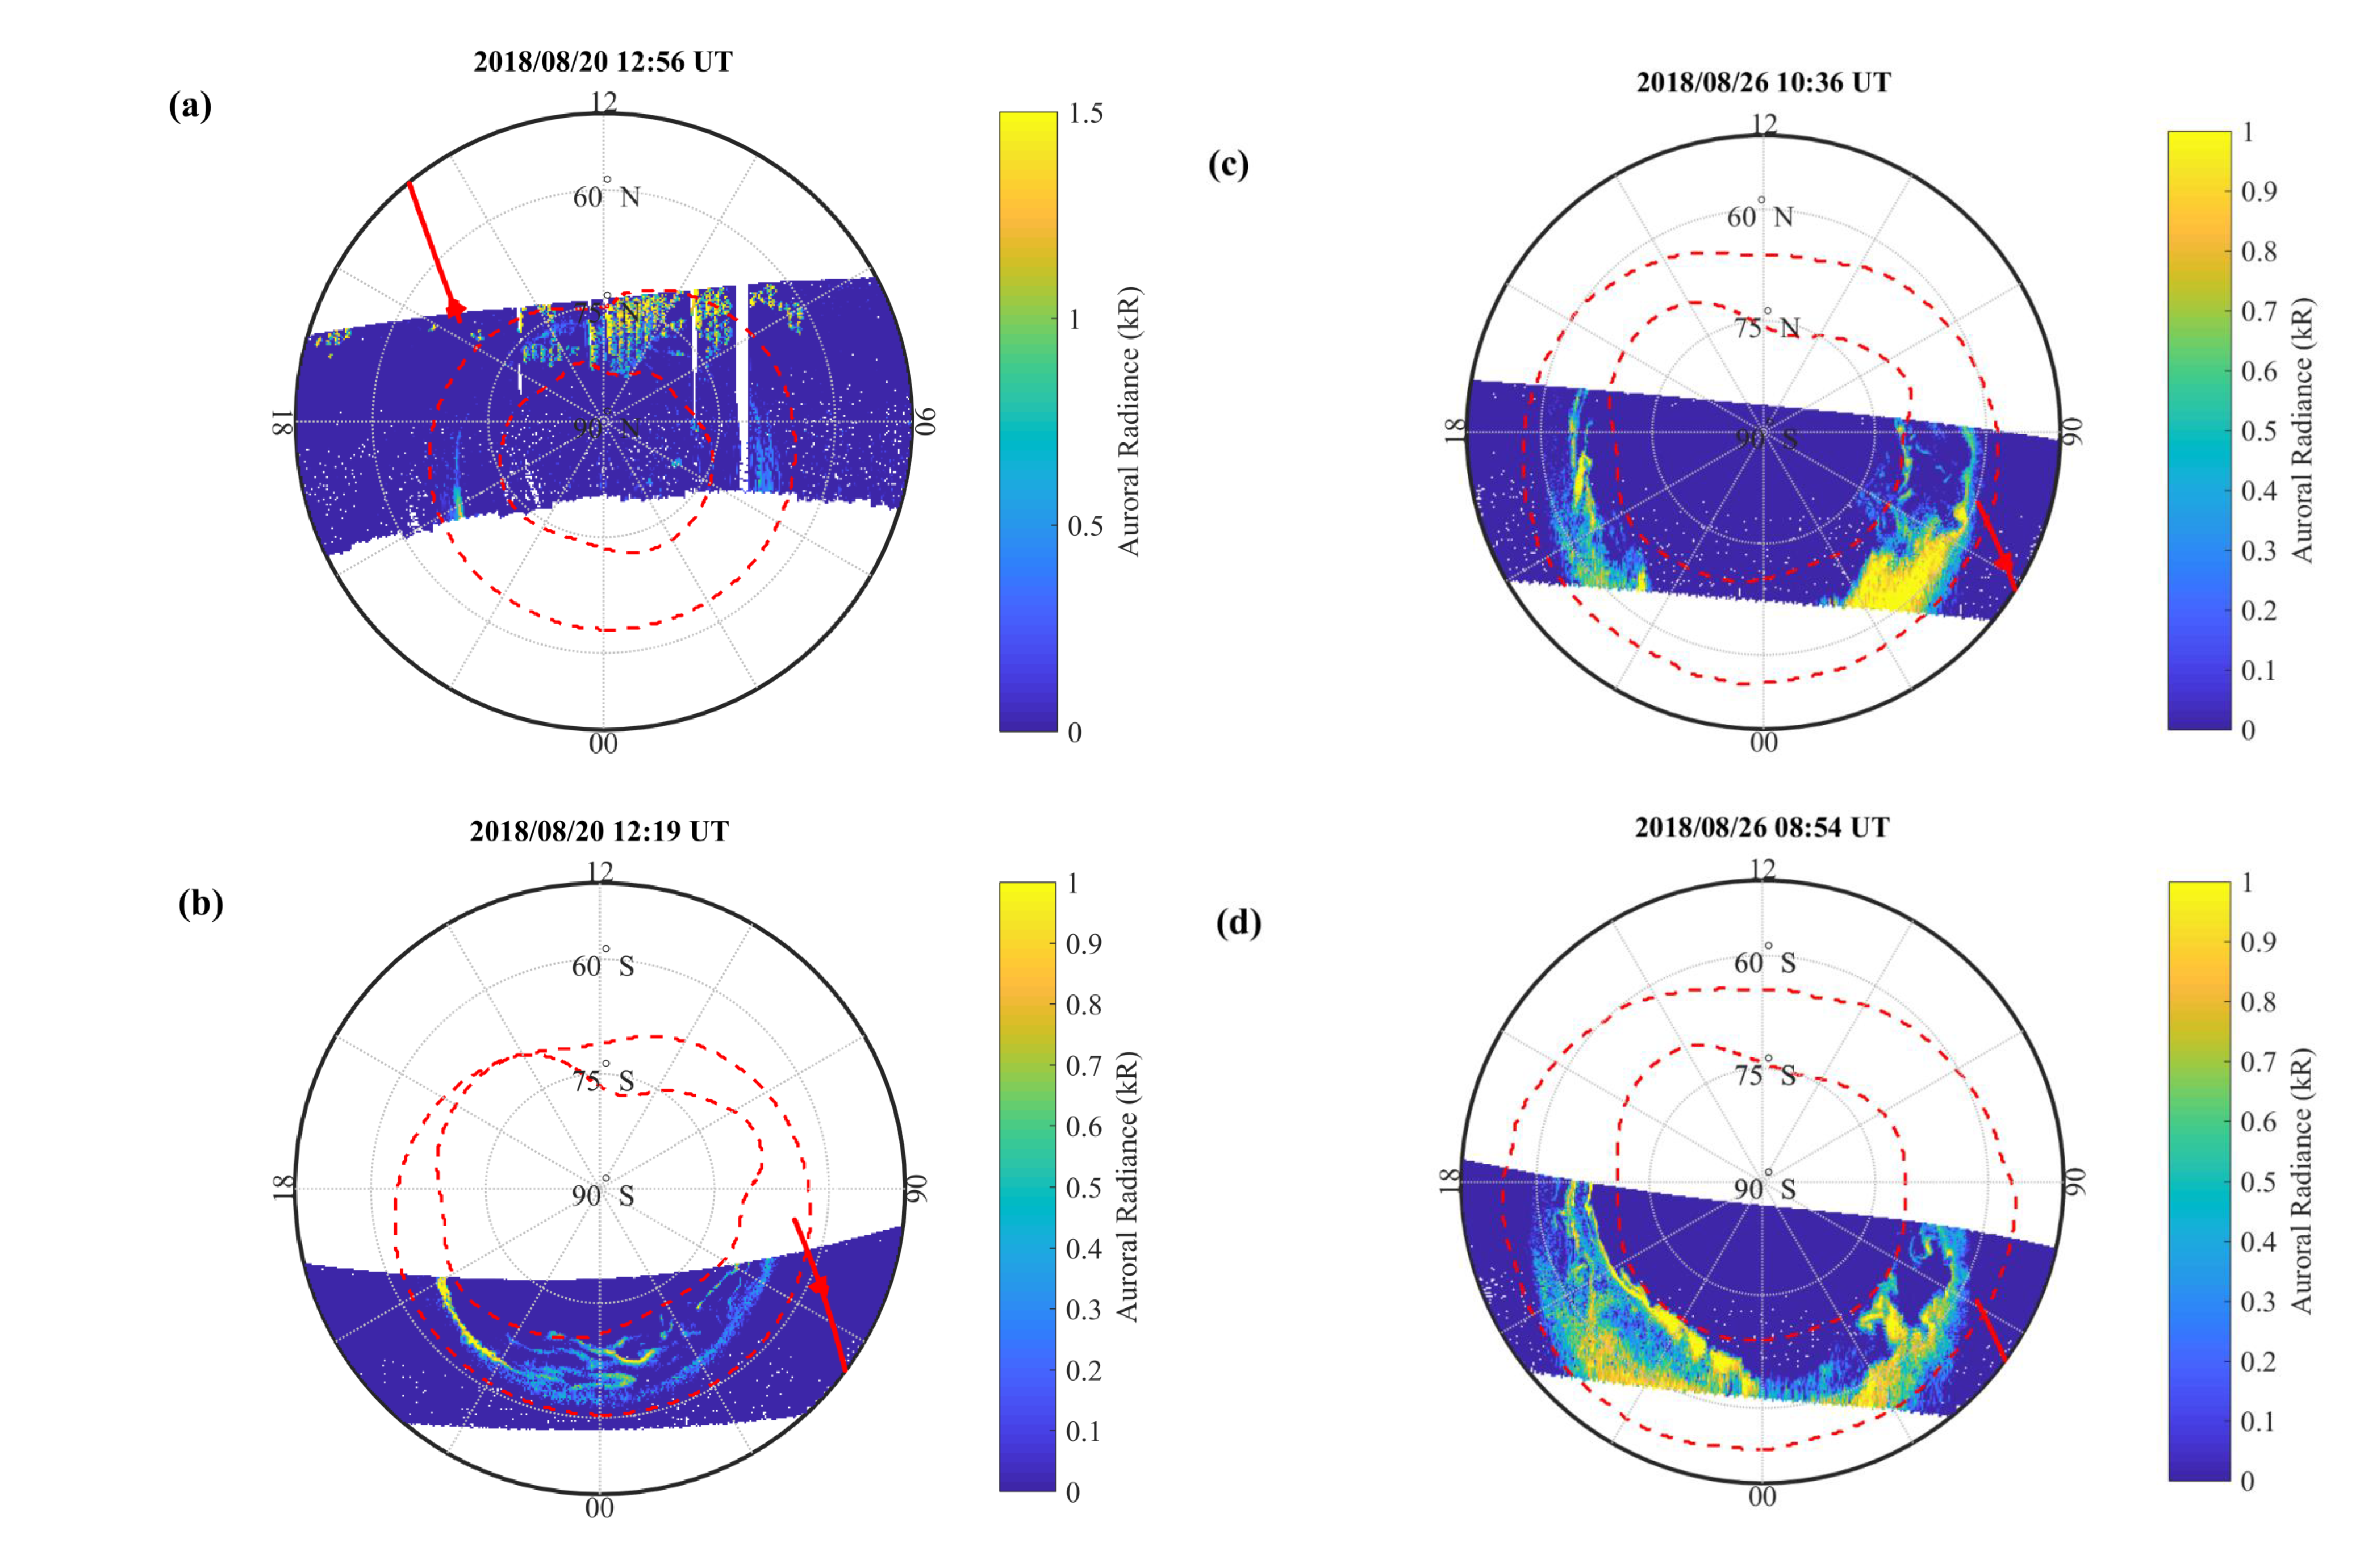
4. HEPD Response to the August 2018 Storm

Figure 4 illustrates a comparison between the HEPD count rate maps before (20–23 August; upper panel) and after the impact of the storm (25–27 August; lower panel). In the top panel, the southern polar region presents a larger trigger rate than the northern one. This is due to the dipole tilt angle, which, in August, allowed the CSES-01 to explore higher geomagnetic latitudes in the Southern Hemisphere than in the Northern Hemisphere. In the bottom panel, an increase in the count rate is evident at both northern and southern latitudes—especially in the southern region—as a consequence of the storm’s arrival. Both maps are related to trigger configuration T in Section 2, which requires an above-threshold signal only in the trigger plane and allows detecting the lowest energetic electrons (>3 MeV). As concerns protons, their contribution to the trigger rate increase is negligible due to the absence of direct injection from solar energetic particles (SEPs) during this specific storm event [48]. For visualization purposes, we excluded the South Atlantic Anomaly (SAA) region, which is characterized by extremely high particle rates. For this purpose, we selected magnetic field values larger than 23,000 nT. For this analysis, we calculated magnetic field values by using the International Geomagnetic Reference Field (IGRF) series of mathematical models, in particular the IGRF-12 candidate [49].
The increased particle rate, during the storm time, is also visible as a function of the L-shell and time in Figure 5. The first three panels show the HEPD count rates for three different trigger configurations: from top to bottom, T, T & P1, and T & P1 & P2. The increase in the number of calorimeter planes used for trigger generation resulted in a higher energy threshold for electron detection (>3 MeV, >4.5 MeV, and >8 MeV, respectively), thus reducing the particle rate. For comparison, the time evolution of the Dst index is shown in the bottom panel of Figure 5. As can be inferred by a strong decrease of the Dst down to ∼−190 nT, the start of the storm’s main phase was on late 25 August, exactly in coincidence with the increase of the HEPD particle rates.

5. Discussion

The hit of the ICME gives rise to a compression of the magnetosphere and a backward motion of the plasmasphere, as shown in Figure 6. Indeed, the magnetopause (black line), modeled using the T01 model [39,40] at the moment of the minimum value of the main phase of the geomagnetic storm (i.e., Dst minimum), steps back from ∼ 10 R E before the storm down to ∼ 7.7 R E ( R E being the Earth’s radius); while the plasmapause, evaluated by the model of Liu and Liu [41], moves from ∼ 5 R E down to ∼ 3.8 R E . On the other hand, the position of the inner boundary of the outer radiation belt (ORB) should reach L O R B = 3.5 , in accordance with the relation of Tverskaya [50] ( | S y m H | m a x = c · L O R B 4 , where c = 3 × 10 4 nT).
A depletion of the particle count rate (Figure 5) during the main phase of the storm is followed by a clear enhancement during recovery, which coincides with large substorm activity (>1000 nT) as measured by the AL index (red line in Figure 3f). The increase can be spotted at L-shells ≳3 for energies above 3 MeV (Figure 5, top panel) and, to a lesser extent, at L-shells ≳4 for energies above 4.5 MeV (Figure 5, second panel).
As a comparison, the >130 keV electron fluxes measured over the same period by the 90° Medium Energy Proton and Electron Detector (MEPED) on board the NOAA19 satellite are reported in Figure 7. The azimuthal telescopes of the MEPED class are affected by small >280 keV proton contamination even at large L-shells in disturbed periods (< 0.6 % at 4 < L < 7 ) [35].
The sub-MeV MEPED-90° observations appear fairly consistent with their MeV counterpart detected by the HEPD, yet reaching flux peaks two orders of magnitude larger than the count rates captured at higher energies. The arrival of the ICME triggered a clear slot-filling event that lasts several days after the impact, with flux enhancements reaching L-shells lower than those occupied by MeV electrons, in accordance with the apparent “barrier” revealed by the Van Allen Probes to significant inward transfer of ultrarelativistic electrons below L ∼ 2.5 [51].
Prolonged and intense substorm activity during recovery (Figure 3f) shows that auroral processes play a non-negligible role in the analysis of particle acceleration in the ORB and that electrons can undergo a quick acceleration on typical timescales of auroral substorms. Taking into account that the auroral oval (AO) is mapped into the outer portion of the ring current (see [52] and the references therein) can help us better understand the connection between auroral processes and ORB dynamics. Indeed, Figure 4 shows a clear lowering of the AO region in concurrence with the storm (lower panel) with respect to the quiet reference conditions (upper panel). Such results are in agreement with ultraviolet (UV) observations by DMSP/SSUSI [37,53] for both hemispheres (Figure 8c,d). Indeed, UV images in the right column of Figure 8 display clear auroral precipitation at lower latitudes than during pre-storm conditions (left column) as a consequence of the high level of geomagnetic activity induced by south-oriented B z , I M F (see Figure 3) and the expansion of the AO boundaries towards lower latitudes (red dashed lines in Figure 8).
Peaks in the particle count rate during the recovery phase pinpoint a phenomenon of electron acceleration in the radiation belts, which could be ascribed to either adiabatic radial transport or nonadiabatic local heating by resonant interaction with very-low-frequency (VLF) waves [54]. Indeed, in order to make a discrimination between the two drivers, one can observe the radial phase space density (PSD) profiles of REPT electrons—directly monitored in the core of the belts—in the invariant ( μ ,K, L * ) space at fixed μ and K.
Radial diffusion moves (mostly 90° pitch angle, i.e., equatorially mirroring) electrons across different L * values while the μ and K invariants remain conserved, thus producing PSDs with a monotonic decrease from the outer source. Conversely, local acceleration makes PSDs increase over a limited L * range, with local peaks and negative radial gradients at higher L * values. Here, we set K at 0.1 R E G 1 2 under T04 field modeling, which addressed electrons with pitch angles generally greater than 45° and measured nearly continuously by the REPT instrument over a still broad range of L * [55]. On the other hand, electron energy corresponding to a particular μ changes with L * , such that, fixing μ at 4500 M e V G , the range between ∼3 MeV and ∼7 MeV can be monitored.
Following the evolution of REPT PSDs from late 26 August to early 30 August (Figure 9), at higher L * values, peak structures with negative gradients were recovered, which, along the previous revelation of persistent chorus waves during the August 2018 event [56], calls for a dominance of local heating.

6. Conclusions

The study of geomagnetic storms and other space weather phenomena is crucial to better understand the mechanisms taking place during solar events and to prevent their effects on technological and anthropic systems, such as reduced satellite operations, failures in spacecraft electronics, radio communication problems, etc.
On 25 August 2018, the CSES-01/HEPD particle rate meters were able to detect the effects of a G3-class, ICME-driven geomagnetic disturbance characterized by marked magnetosphere compression and plasmasphere erosion.
In our analysis, a depletion of HEPD count rate at the storm’s main phase was observed, followed by a clear rate enhancement during its recovery phase. This increase was detected at L-shells ≳3 for electron energies above 3 MeV, and, to a lesser extent, at L-shells ≳4 for electron energies above 4.5 MeV. These results were consistent with the behavior of integral sub-MeV fluxes measured by the MEPED-90° electron telescope on board the NOAA19/POES satellite, over the same period. The enhancement of HEPD trigger rates suggested a phenomenon of acceleration of energetic electrons, which lasted several days. The discrimination between adiabatic radial transport and non-adiabatic local heating was made by inspection of the PSD profiles of the REPT magnetospheric electrons from late 26 August to early 30 August, whose negative gradients were in favour of the latter, with corroboration by persistent chorus wave interactions previously revealed by other payloads on board the CSES-01 for the same storm.
During the recovery phase, the HEPD trigger rate enhancement was in coincidence with prolonged and intense substorm activity ( > 1000 nT), as measured by the AL index. This followed the HEPD orbits crossing the auroral oval region, which expanded during the storm and was marked by UV enhancement especially in the Southern Hemisphere, as detected by the SSUSI instrument on board the DMSP satellite. This occurrence showed that auroral processes cannot be neglected when studying the dynamics of particle acceleration in the ORB, since energetic electrons undergo quick acceleration on typical timescales of auroral substorms.
Considering the sky-rocketing focus on space weather studies in this last decade, HEPD’s results prove promising, especially in view of the already-planned constellation of CSES satellites in the next few years (CSES-02 is currently under construction). It is worth noticing that this set of satellites will take shape in a period when several other missions, which contributed to the monitoring of the near-Earth environment, will be either deactivated or well beyond the end of their scheduled lifetimes.
Francesco Palma, Alessandro Sotgiu, Alexandra Parmentier, Matteo Martucci, Mirko Piersanti, Simona Bartocci, Roberto Battiston, William Jerome Burger, Donatella Campana, Luca Carfora, Guido Castellini, Livio Conti, Andrea Contin, Giulia D’Angelo, Cinzia De Donato, Cristian De Santis, Francesco Maria Follega, Roberto Iuppa, Ignazio Lazzizzera, Nadir Marcelli, Giuseppe Masciantonio, Matteo Mergé, Alberto Oliva, Giuseppe Osteria, Federico Palmonari, Beatrice Panico, Francesco Perfetto, Piergiorgio Picozza, Michele Pozzato, Ester Ricci, Marco Ricci, Sergio Bruno Ricciarini, Zouleikha Sahnoun, Valentina Scotti, Roberta Sparvoli, Vincenzo Vitale, Simona Zoffoli, and Paolo Zuccon
The following abbreviations are used in this manuscript:

Author Contributions

Writing—original draft, F.P. (Francesco Palma); conceptualization, M.M. (Matteo Martucci), M.P. (Mirko Piersanti), and R.S.; writing—review and editing, A.S., A.P., M.M. (Matteo Martucci), M.P. (Mirko Piersanti), F.M.F., R.I., A.O., E.R., and R.S.; designing the experiment or calibration or data production and processing, A.S., A.P., S.B., R.B., W.J.B., D.C., L.C. (Luca Carfora), G.C., L.C. (Livio Conti), A.C., G.D., C.D.D., C.D.S., F.M.F., R.I., I.L., N.M., G.M., M.M. (Matteo Mergé), A.O., G.O., F.P. (Federico Palmonari), B.P., F.P. (Francesco Perfetto), P.P., M.P. (Michele Pozzato), E.R., M.R., S.B.R., Z.S., V.S., V.V., S.Z., and P.Z. All authors read and agreed to the published version of the manuscript.

Funding

This research received no external funding.

Institutional Review Board Statement

Not applicable.

Informed Consent Statement

Not applicable.

Data Availability Statement

CSES/HEPD data can be found at www.leos.ac.cn/ (accessed on 3 April 2021).

Acknowledgments

This work made use of data from the CSES-01 mission, a project funded by the China National Space Administration (CNSA), the China Earthquake Administration (CEA) in collaboration with the Italian Space Agency (ASI), the National Institute for Nuclear Physics (INFN), the Institute for Applied Physics (IFAC-CNR), and the Institute for Space Astrophysics and Planetology (INAF-IAPS). We kindly acknowledge the OMNIWeb website (https://omniweb.gsfc.nasa.gov/, accessed on 3 April 2021) for providing part of the data used in this paper. This work was supported by the Italian Space Agency in the framework of the “Accordo Attuativo 2020-32.HH.0 Limadou Scienza+” (CUP F19C20000110005) and the ASI-INFN Agreement No.2014-037-R.0, Addendum 2014-037-R-1-2017. M. Piersanti thanks the ISSI-BJ project “the electromagnetic data validation and scientific application research based on CSES satellite” and Dragon 5 cooperation 2020-2024 (ID. 59236).

Conflicts of Interest

The authors declare no conflict of interest.

References

  1. Gosling, J.T. The solar flare myth. J. Geophys. Res. 1993, 98, 18937–18950. [Google Scholar] [CrossRef]
  2. Piersanti, M.; Cesaroni, C.; Spogli, L.; Alberti, T. Does TEC react to a sudden impulse as a whole? The 2015 Saint Patrick’s day storm event. Adv. Space Res. 2017, 60, 1807–1816. [Google Scholar] [CrossRef]
  3. Gonzalez, W.D.; Joselyn, J.A.; Kamide, Y.; Kroehl, H.W.; Rostoker, G.; Tsurutani, B.T.; Vasyliunas, V.M. What is a geomagnetic storm? J. Geophys. Res. 1994, 99, 5771–5792. [Google Scholar] [CrossRef]
  4. Villante, U.; Piersanti, M. Analysis of geomagnetic sudden impulses at low latitudes. J. Geophys. Res. 2009, 114, A06209. [Google Scholar] [CrossRef] [Green Version]
  5. Dungey, J.W. Interplanetary magnetic field and the auroral zones. Phys. Rev. Lett. 1961, 6, 47. [Google Scholar] [CrossRef]
  6. Axford, W.I.; Hines, C.O. A Unifying Theory of High-Latitude Geophysical Phenomena and Geomagnetic Storms. Can. J. Phys 1961, 39, 1433–1464. [Google Scholar] [CrossRef]
  7. Daglis, I.A. The storm-time ring current. Space Sci. Rev. 2001, 98, 343–363. [Google Scholar] [CrossRef]
  8. Blanc, M. Magnetosphere-ionosphere coupling. Comput. Phys. Commun. 1988, 49, 103–118. [Google Scholar] [CrossRef]
  9. Piersanti, M.; Alberti, T.; Bemporad, A.; Berrilli, F.; Bruno, R.; Capparelli, V.; Carbone, V.; Cesaroni, C.; Consolini, G.; Cristaldi, A.; et al. Comprehensive analysis of the geoeffective solar event of 21 June 2015: Effects on the magnetosphere, plasmasphere, and ionosphere systems. Sol. Phys. 2017, 292, 169. [Google Scholar] [CrossRef]
  10. Pezzopane, M.; Del Corpo, A.; Piersanti, M.; Cesaroni, C.; Pignalberi, A.; Di Matteo, S.; Spogli, L.; Vellante, M.; Heilig, B. On some features characterizing the plasmasphere–magnetosphere–ionosphere system during the geomagnetic storm of 27 May 2017. Earth Planets Space 2019, 71, 77. [Google Scholar] [CrossRef] [PubMed] [Green Version]
  11. Wang, C.; Zhang, Q.; Chi, P.J.; Li, C. Simultaneous observations of plasmaspheric and ionospheric variations during magnetic storms in 2011: First result from Chinese Meridian Project. J. Geophys. Res. Space Phys. 2013, 118, 99–104. [Google Scholar] [CrossRef] [Green Version]
  12. Baker, D.N. Satellite Anomalies due to Space Storms. In Space Storms and Space Weather Hazards, NATO Science Series, Series II: Mathematics, Physics and Chemistry; Daglis, I.A., Ed.; Springer: Dordrecht, The Netherlands, 2001; Volume 48. [Google Scholar]
  13. Ginet, G.P. Space Weather: An Air Force Research Laboratory Perspective. In Space Storms and Space Weather Hazards, NATO Science Series, Series II: Mathematics, Physics and Chemistry; Daglis, I.A., Ed.; Springer: Dordrecht, The Netherlands, 2001; pp. 437–457. [Google Scholar]
  14. Kappenman, J.G. An Introduction to Power Grid Impacts and Vulnerabilities from Space Weather. In Space Storms and Space Weather Hazards, NATO Science Series, Series II: Mathematics, Physics and Chemistry; Daglis, I.A., Ed.; Springer: Dordrecht, The Netherlands, 2001; Volume 38. [Google Scholar]
  15. Lanzerotti, L.J. Space Weather Effects on Communications. In Space Storms and Space Weather Hazards, NATO Science Series, Series II: Mathematics, Physics and Chemistry; Daglis, I.A., Ed.; Springer: Dordrecht, The Netherlands, 2001; Volume 38. [Google Scholar]
  16. Pulkkinen, A.; Bernabeu, E.; Thomson, A.; Viljanen, A.; Pirjola, R.; Boteler, D.; Eichner, J.; Cilliers, P.J.; Welling, D.; Savani, N.P.; et al. Geomagnetically induced currents: Science, engineering, and applications readiness. Space Weather 2017, 15, 828–856. [Google Scholar] [CrossRef]
  17. Hapgood, M. The Great Storm of May 1921: An Exemplar of a Dangerous Space Weather Event. Space Weather 2019, 17, 950–975. [Google Scholar] [CrossRef] [Green Version]
  18. Yang, Y.Y.; Zhima, Z.R.; Shen, X.H.; Chu, W.; Huang, J.P.; Wang, Q.; Yan, R.; Xu, S.; Lu, H.-X.; Liu, D.-P. The First Intense Storm Event Recorded by the China Seismo-Electromagnetic Satellite. Space Weather 2019, 18, e2019SW002243. [Google Scholar] [CrossRef] [Green Version]
  19. Shen, X.; Zhang, X.; Yuan, S.; Wang, L.; Cao, J.; Huang, J.; Zhu, X.; Piergiorgio, P.; Dai, J. The state-of-the-art of the China Seismo-Electromagnetic Satellite mission. Sci. China Technol. Sci. 2018, 61, 634–642. [Google Scholar] [CrossRef]
  20. Zhima, Z.; Hu, Y.; Shen, X.; Chu, W.; Piersanti, M.; Parmentier, A.; Zhang, Z.; Wang, Q.; Huang, J.; Zhao, S.; et al. Storm-Time Features of the Ionospheric ELF/VLF Waves and Energetic Electron Fluxes Revealed by the China Seismo-Electromagnetic Satellite. Appl. Sci. 2021, 11, 2617. [Google Scholar] [CrossRef]
  21. Bartocci, S.; Battiston, R.; Burger, W.J.; Campana, D.; Carfora, L.; Castellini, G.; Conti, L.; Contin, A.; De Donato, C.; De Persio, F.; et al. Galactic Cosmic-Ray Hydrogen Spectra in the 40–250 MeV Range Measured by the High-energy Particle Detector (HEPD) on board the CSES-01 Satellite between 2018 and 2020. Astrophys. J. 2020, 901, 8. [Google Scholar] [CrossRef]
  22. Cheng, B.; Zhou, B.; Magnes, W.; Lammegger, R.; Pollinger, A. High precision magnetometer for geomagnetic exploration onboard of the China Seismo-Electromagnetic Satellite. Sci. China Technol. Sci. 2018, 61, 659. [Google Scholar] [CrossRef]
  23. Cao, J.; Zeng, L.; Zhan, F.; Wang, Z.; Wang, Y.; Chen, Y.; Meng, Q.; Ji, Z.; Wang, P.; Liu, Z.; et al. The electromagnetic wave experiment for CSES mission: Search coil magnetometer. Sci. China Technol. Sci. 2018, 61, 653. [Google Scholar] [CrossRef]
  24. Diego, P.; Huang, J.; Piersanti, M.; Badoni, D.; Zeren, Z.; Yan, R.; Rebustini, G.; Ammendola, R.; Candidi, M.; Guan, Y.-B.; et al. The Electric Field Detector on Board the China Seismo Electromagnetic Satellite—In-Orbit Results and Validation. Instruments 2021, 5, 1. [Google Scholar] [CrossRef]
  25. Yan, R.; Guan, Y.; Shen, X.; Huang, J.; Zhang, X.; Liu, C.; Liu, D. The Langmuir Probe onboard CSES: Data inversion analysis method and first results. Earth Planet. Phys. 2018, 2, 479–488. [Google Scholar] [CrossRef]
  26. Chen, L.; Ou, M.; Yuan, Y.; Sun, F.; Yu, X.; Zhen, W. Preliminary observation results of the Coherent Beacon System onboard the China Seismo-Electromagnetic Satellite-1. Earth Planet. Phys. 2018, 2, 505–514. [Google Scholar] [CrossRef]
  27. Liu, C.; Guan, Y.; Zheng, X.; Zhang, A.; Piero, D.; Sun, Y. The technology of space plasma in-situ measurement on the China Seismo-Electromagnetic Satellite. Sci. China Ser. E Technol. Sci. 2019, 62, 829–838. [Google Scholar] [CrossRef]
  28. Lin, J.; Shen, X.; Hu, L.; Wang, L.; Zhu, F. CSES GNSS ionospheric inversion technique, validation and error analysis. Sci. China Technol. Sci. 2018, 61, 669. [Google Scholar] [CrossRef]
  29. Li, X.Q.; Xu, Y.B.; An, Z.H.; Liang, X.H.; Wang, P.; Zhao, X.Y.; Wang, H.Y.; Lu, H.; Ma, Y.Q.; Shen, X.H.; et al. The high-energy particle package onboard CSES. Radiat. Detect. Technol. Methods 2019, 3, 22. [Google Scholar] [CrossRef]
  30. Picozza, P.; Battiston, R.; Ambrosi, G.; Bartocci, S.; Basara, L.; Burger, W.J.; Campana, D.; Carfora, L.; Casolino, M.; Castellini, G.; et al. Scientific Goals and In-orbit Performance of the High-energy Particle Detector on Board the CSES. Astrophys. J. Suppl. Ser. 2019, 243, 16. [Google Scholar] [CrossRef]
  31. Ambrosi, G.; Bartocci, S.; Basara, L.; Battiston, R.; Burger, W.; Campana, D.; Carfora, L.; Castellini, G.; Cipollone, P.; Conti, L.; et al. Beam test calibrations of the HEPD detector on board the China Seismo-Electromagnetic Satellite. Nucl. Instruments Methods Phys. Res. Sect. A Accel. Spectrometers Detect. Assoc. Equip. 2020, 974, 164170. [Google Scholar] [CrossRef]
  32. Sotgiu, A.; De Donato, C.; Fornaro, C.; Tassa, S.; Scannavini, M.; Iannaccio, D.; Ambrosi, G.; Bartocci, S.; Basara, L.; Battiston, R.; et al. Control and data acquisition software of the high-energy particle detector on board the China Seismo-Electromagnetic Satellite space mission. Softw. Pr. Exp. 2021, 51, 1459–1480. [Google Scholar] [CrossRef]
  33. Evans, D.S.; Greer, M.S. Polar Orbiting Environmental Satellite Space Environment Monitor-2 Instrument Descriptions and Archive Data Documentation. 2004. Available online: https://ngdc.noaa.gov/stp/satellite/poes/docs/SEM2Archive.pdf (accessed on 1 June 2021).
  34. Asikainen, T.; Mursula, K. Correcting the NOAA/MEPED energetic electron fluxes for detector efficiency and proton contamination. J. Geophys. Res. Space Phys. 2013, 118, 6500–6510. [Google Scholar] [CrossRef]
  35. Rodger, C.J.; Clilverd, M.A.; Green, J.C.; Lam, M.M. Use of POES SEM-2 Observations to Examine Radiation Belt Dynamics and Energetic Electron Precipitation into the Atmosphere. J. Geophys. Res. 2010, 115, A04102. [Google Scholar] [CrossRef] [Green Version]
  36. Hardy, D.A.; Schmitt, L.K.; Gussenhoven, M.S.; Marshall, F.J.; Yeh, H.C.; Shumaker, T.L.; Hube, A.; Pantazis, J. Precipitating Electron and ion Detectors (SSJ/4) for the Block 5D/Flights 6–10 DMSP Satellites: Calibration and Data Presentation; AFGL-TR-84-0317, ADA 157080; Air Force Geophysics Laboratory—Space Physics Division: Hanscom AFB, MA, USA, 1984. [Google Scholar]
  37. Paxton, L.J.; Schaefer, R.K.; Zhang, Y.; Kil, H. Far ultraviolet instrument technology. J. Geophys. Res. Space Phys. 2017, 122, 2706–2733. [Google Scholar] [CrossRef] [Green Version]
  38. Baker, D.N.; Kanekal, S.G.; Hoxie, V.C.; Batiste, S.; Bolton, M.; Li, X.; Elkington, S.R.; Monk, S.; Reukauf, R.; Steg, S.; et al. The Relativistic Electron-Proton Telescope (REPT) Instrument on Board the Radiation Belt Storm Probes (RBSP) Spacecraft: Characterization of Earth’s Radiation Belt High-Energy Particle Populations. Space Sci. Rev. 2013, 179, 337–381. [Google Scholar] [CrossRef]
  39. Tsyganenko, N.A. A model of the magnetosphere with a dawn-dusk asymmetry, 1, Mathematical structure. J. Geophys. Res. 2002, 107, SMP 12. [Google Scholar] [CrossRef] [Green Version]
  40. Tsyganenko, N.A. A model of the near magnetosphere with a dawn-dusk asymmetry, 2, Parameterization and fitting to observations. J. Geophys. Res. 2002, 107, SMP-12. [Google Scholar] [CrossRef]
  41. Liu, X.; Liu, W. A new plasmapause location model based on THEMIS observations. Sci. China Earth Sci. 2014, 57, 2552–2557. [Google Scholar] [CrossRef]
  42. Piersanti, M.; De Michelis, P.; Del Moro, D.; Tozzi, R.; Pezzopane, M.; Consolini, G.; Marcucci, M.F.; Laurenza, M.; Di Matteo, S.; Pignalberi, A.; et al. From the Sun to Earth: Effects of the 25 August 2018 geomagnetic storm. Ann. Geophys. 2020, 38, 703–724. [Google Scholar] [CrossRef]
  43. Burlaga, L.; Sittler, E.; Mariani, F.; Schwenn, R. Magnetic loop behind an interplanetary shock: Voyager, helios, and imp 8 observations. J. Geophys. Res. Space Phys. 1981, 86, 6673. [Google Scholar] [CrossRef]
  44. Wanliss, J.A.; Showalter, K.M. High-resolution global storm index: Dst versus sym-h. J. Geophys. Res. Space Phys. 2006, 111, A02202. [Google Scholar] [CrossRef]
  45. Ahn, B.-H.; Akasofu, S.-I.; Kamide, Y. The joule heat production rate and the particle energy injection rate as a function of the geomagnetic indices AE and AL. J. Geophys. Res. Space Phys. 1983, 88, 6275. [Google Scholar] [CrossRef]
  46. Kamide, Y.; Kokubun, S. Two-component auroral electrojet: Importance for substorm studies. J. Geophys. Res. 1996, 101, 13027–13046. [Google Scholar] [CrossRef]
  47. Consolini, G.; De Michelis, P. Local intermittency measure analysis of AE index: The directly driven and unloading component. Geophys. Res. Lett. 2005, 32, L05101. [Google Scholar] [CrossRef]
  48. Abunin, A.A.; Abunina, M.A.; Belov, A.V.; Chertok, I.M. Peculiar Solar Sources and Geospace Disturbances on 20–26 August 2018. Sol. Phys. 2020, 295, 7. [Google Scholar] [CrossRef] [Green Version]
  49. Thébault, E.; Finlay, C.C.; Beggan, C.D.; Alken, P.; Aubert, J.; Barrois, O.; Bertrand, F.; Bondar, T.; Boness, A.; Brocco, L.; et al. International Geomagnetic Reference Field: The 12th generation. Earth Planets Space 2015, 67, 79. [Google Scholar] [CrossRef]
  50. Tverskaya, L.V. The boundary of electron injection into the earth magnetosphere. Geomagn. Aeron. 1986, 26, 864–865. [Google Scholar]
  51. Baker, D.N.; Jaynes, A.; Hoxie, V.C.; Thorne, R.M.; Foster, J.; Li, X.; Fennell, J.F.; Wygant, J.R.; Kanekal, S.G.; Erickson, P.; et al. An impenetrable barrier to ultrarelativistic electrons in the Van Allen radiation belts. Nature 2010, 515, 531–534. [Google Scholar] [CrossRef] [PubMed]
  52. Antonova, E.E.; Stepanova, M.V.; Moya, P.S.; Pinto, V.A.; Vovchenko, V.V.; Ovchinnikov, I.L.; Sotnikov, N.V. Processes in auroral oval and outer electron radiation belt. Earth Planets Space 2018, 70, 127. [Google Scholar] [CrossRef]
  53. Paxton, L.J.; Meng, C.I.; Fountain, G.H.; Ogorzalek, B.S.; Darlington, E.H.; Gary, S.A.; Goldsten, J.O.; Kusnierkiewicz, D.Y.; Lee, S.C.; Linstrom, L.A.; et al. SSUSI: Horizon-to-horizon and limb viewing spectrographic imager for remote sensing of environmental parameters. Ultrav. Technol. IV 1993, 1764, 161–176. [Google Scholar] [CrossRef]
  54. Reeves, G.D.; Baker, D.N.; Belian, R.D.; Blake, J.B.; Cayton, T.E.; Fennell, J.F.; Friedel, R.H.W.; Meier, M.M.; Selesnick, R.S.; Spence, H. The global response of relativistic radiation belt electrons to the January 1997 magnetic cloud. Geophys. Res. Lett. 1998, 25, 3265–3268. [Google Scholar] [CrossRef] [Green Version]
  55. Reeves, G.D.; Spence, H.; Henderson, M.; Morley, S.; Friedel, R.H.W.; Funsten, H.; Baker, D.N.; Kanekal, S.G.; Blake, J.B.; Fennell, J.F.; et al. Electron Acceleration in the Heart of the Van Allen Radiation Belts. Science 2013, 341, 991. [Google Scholar] [CrossRef]
  56. Zhang, Z.; Chen, L.; Liu, S.; Xiong, Y.; Li, X.; Wang, Y.; Chu, W.; Zeren, Z.; Shen, X. Chorus acceleration of relativistic electrons in extremely low L shell during geomagnetic storm of August 2018. Geophys. Res. Lett. 2020, 47, e2019GL086226. [Google Scholar] [CrossRef]
Figure 1. Schematic of the HEPD detector. All mechanical structures (as well as the lateral VETO plane located in the front) have been removed from the figure for visualization purposes.
Applsci 11 05680 g001
Figure 2. The HEPD geometrical factor for electrons, as estimated from Monte Carlo simulations, as a function of kinetic energy and trigger configuration.
Applsci 11 05680 g002
Figure 3. Solar wind parameters observed by the ACE spacecraft at L1: (a) IMF intensity; (b) IMF B z component; (c) proton temperature; (d) dynamic pressure of the solar wind; (e) Sym-H index; (f) AE (black), AL (red), and AU (blue) indices. The SW parameters are expressed in the Geocentric Solar Magnetospheric (GSM) coordinate system.
Applsci 11 05680 g003
Figure 4. Comparison between an HEPD trigger rate map before the occurrence of the geomagnetic storm, from 20–23 August (upper panel), and after the impact of the storm, from 25 August to 27 (lower panel). The maps are related to trigger configuration T, requiring an above-threshold signal just in the trigger plane and providing the lowest energy threshold for electron detection (>3 MeV). For visualization purposes, we excluded the South Atlantic Anomaly region, characterized by extremely high particle rates.
Applsci 11 05680 g004
Figure 5. Top three panels: Trigger rates for three different HEPD configurations over the period August-September 2018; from top to bottom, T, T & P1, and T & P1 & P2. Adding more calorimeter planes to the trigger configuration results in increasing the energy threshold for electron detection (>3 MeV for T, >4.5 MeV for T & P1, and >8 MeV for T & P1 & P2). The proton contribution to the trigger rate increase is negligible due to the absence of direct injection from SEPs. The vertical white lines are due to a lack of data. Bottom panel: Time evolution of the Dst index.
Applsci 11 05680 g005
Figure 6. Magnetopause (black line) and plasmapause (red line) profiles as evaluated using the Tsyganenko T01 and the Liu (2014) models, respectively. The reference frame is the GSM. The SW parameters used in the T01 model are: P = 8.7 nPa; B y , I M F = 4.5 nT; B z , I M F = 16.8 nT; Dst = 174 nT. The Dst index value used in the plasmapause model is the same as in T01.
Applsci 11 05680 g006
Figure 7. Integral electron fluxes (>130 keV) measured by the MEPED-90° directional telescope on board the NOAA19 satellite over the period Aug-Sept 2018. As reported in [35], proton contamination remains modest in this class of azimuthal detectors even at large L-shells in disturbed periods (< 0.6 % at 4 < L < 7 ).
Applsci 11 05680 g007
Figure 8. The auroral ultraviolet images by the SSUSI instrument on board the DMSP satellite. Panel (a) refers to the quiet Northern Hemisphere observations; Panel (b) refers to the quiet Southern Hemisphere observations; Panel (c) refers to the stormy Northern Hemisphere observations; Panel (d) refers to the stormy Southern Hemisphere observations; the red dashed curves refer to the upper and lower boundaries of the auroral oval. The red curve refers to CSES-01’s orbit. The selected reference is the Altitude Adjusted Corrected Geomagnetic (AACGM) coordinate system.
Applsci 11 05680 g008
Figure 9. Radial PSD profiles at constant μ (4500 M e V G ) and K (0.1 R E G 1 2 ) for RBSP-A/REPT electrons of energies between approximately 3 MeV and 7 MeV along both inbound and outbound crossings of the radiation belts. Complementary RBSP-B/REPT profiles (not shown) are consistent with their A counterpart.
Applsci 11 05680 g009
Table 1. Parameters used to estimate the plasmapause location.
a 1 a MLT a phi b 1 b MLT b phi
D s t i n d e x 1.111 0.2416 21.5026.013 0.0565 23.3214
Publisher’s Note: MDPI stays neutral with regard to jurisdictional claims in published maps and institutional affiliations.

