Article

Compositional Modeling of Impure CO2 Injection for Enhanced Oil Recovery and CO2 Storage

1
Department of Earth Resources and Environmental Engineering, Hanyang University, 222 Wangsimni-ro, Seongdong-gu, Seoul 04763, Korea
2
Center for Climate, Environment Change Prediction Research, Ewha Womans University, 52 Ewhayeodae-gil, Seodaemun-gu, Seoul 03760, Korea
*
Author to whom correspondence should be addressed.
Appl. Sci. 2021, 11(17), 7907; https://doi.org/10.3390/app11177907
Submission received: 3 August 2021 / Revised: 23 August 2021 / Accepted: 25 August 2021 / Published: 27 August 2021

Abstract

:
Injecting CO2, a greenhouse gas, into the reservoir could be beneficial economically, by extracting remaining oil, and environmentally, by storing CO2 in the reservoir. CO2 captured from various sources always contains various impurities that affect the gas–oil system in the reservoir, changing oil productivity and CO2 geological storage performance. Therefore, it is necessary to examine the effect of impurities on both enhanced oil recovery (EOR) and carbon capture and storage (CCS) performance. For Canada Weyburn W3 fluid, a 2D compositional simulation of water-alternating-gas (WAG) injection was conducted to analyze the effect of impure CO2 on EOR and CCS performance. Most components in the CO2 stream such as CH4, H2, N2, O2, and Ar can unfavorably increase the MMP between the oil and gas mixture, while H2S decreased the MMP. MMP changed according to the type and concentration of impurity in the CO2 stream. Impurities in the CO2 stream also decreased both sweep efficiency and displacement efficiency, increased the IFT between gas and reservoir fluid, and hindered oil density reduction. The viscous gravity number increased by 59.6%, resulting in a decrease in vertical sweep efficiency. In the case of carbon storage, impurities decreased the performance of residual trapping by 4.1% and solubility trapping by 5.6% compared with pure CO2 WAG. As a result, impurities in CO2 reduced oil recovery by 9.2% and total CCS performance by 4.3%.

1. Introduction

The CO2-enhanced oil recovery (EOR) method has been widely applied to numerous field projects around the world [1,2]. CO2-EOR was mostly aimed at recovering residual oil initially, but it is converted to not only increase recovery but also achieve reduction greenhouse gases by injecting CO2 or flue gas. Recently, the application has been extended to unconventional hydrocarbons such as gas hydrates [3]. Existing CO2-EOR aimed to produce maximum oil and inject minimum CO2, but carbon capture, utilization, and storage (CCUS) consider the increase in oil recovery and greenhouse gas storage [4,5,6]. With atmospheric CO2 concentrations continuing to rise worldwide, CCUS has the potential to reach net-zero [7]. As a key technology used to reduce carbon dioxide emissions from fossil-fueled power plants and other industrial activities, CCUS helps provide energy security by lowering emissions while achieving economics. CCUS is considered as an important technology for moving toward a global low-carbon economy. There are many sources of CO2 such as natural gas reservoirs containing CO2, industrial or anthropogenic sources, and natural CO2 reservoirs. Depending on the capture approaches (post-combustion, oxy-fuel, or pre-combustion), various impurities such as N2, O2, H2S, CH4, Ar, and water are contained in the CO2 stream [8,9,10,11,12]. The CO2 concentration used for EOR commonly requires extremely high purity (around 90–98%), especially for miscible displacement [13]. A purification process is generally required to obtain the appropriate CO2 concentration from the source gas [14]. The purity of captured CO2 largely depends on the type of capture technology. The type and amount of impurities in the CO2 stream affect the fluid properties and thermodynamics of CO2 differently, exhibiting beneficial or negative effects on CO2-EOR: fluid solubility, phase behavior of the oil and gas system, and miscibility [15,16]. A small number of impurities significantly changes the physical properties and phase behavior of the CO2 mixtures. The solubility in water depends on the type and amount of impurities in the CO2 stream [17,18,19]. The solubility of CO2 in water increases with increasing pressure and decreasing temperature. Most impurities have low solubility in water compared with CO2. Impurities reduce the partial pressure of CO2 and therefore reduce solubility in water. CO2 impurities can affect all stages of CO2-EOR, from CO2 capture to flooding. Since the level of contaminant removal is determined by process technology and cost, the actual level of CO2 purity required depends not only on the requirements of transportation and storage but also on the economics of the process. Separating impurities greatly increases the capture cost. Higher CO2 purity is associated with higher costs of capture. The cost of a low purity CO2 stream (82.9 wt.% CO2) is 42% lower than high purity CO2 (99.98 wt.% CO2) in a capture plant [14]. It can be economical to inject the impurities contained in the CO2 together. Several studies have investigated the effects of contaminants in the CO2 stream on minimum miscibility pressure (MMP) to determine how impurities affect MMP compared with pure CO2. In general, impurities including CH4, SO2, O2, and N2 have been found to increase MMP, while H2S, C2H6, or intermediate hydrocarbons such as C3 or C4 reduce MMP, positively affecting miscible displacement [8,16,20,21,22]. Based on the effect of individual impurities on the phase behavior and MMP of the CO2–hydrocarbon system, the effect of impurity mixtures on MMP and EOR performance has also been examined [16]. In addition, several studies have investigated the change of EOR performance and storage capacity when impurities and CO2 are co-injected in the aquifer [10,11]. The presence of contaminants will affect the trapping mechanism since it changes the wettability, interfacial tension, and buoyancy of CO2 [23,24]. However, studies on CO2-EOR performance coupled with CO2 storage considering the composition of the actual impure CO2 stream from carbon sources are insufficient. Previous studies have focused on laboratory investigation, and discussions on reservoir-scale studies considering the composition of actual CO2 are insufficient. Therefore, it is important to investigate the impact of impurities on CO2 properties combined with the performance of EOR and carbon storage. In this study, compositional simulation was used to investigate the impact of impurities on the phase behavior of CO2, CO2 displacement mechanism, and carbon storage when injected without removing impurities from the oxy-fuel combustion stream.

2. Materials and Methods

2.1. Fluid Modeling

The Weyburn reservoir, located in southeast Saskatchewan, became a target for CO2- EOR and carbon sequestration after water flooding production [25]. Since the reservoir has been conducting CO2 monitoring and operated as a storage project, Weyburn W3 fluid data [25] is used to examine the interactions of reservoir fluid and CO2 for the purpose of CCS-EOR. The composition of the reservoir oil and fluid properties used for the EOS calculations are summarized in Table 1 [26,27].
Regression was used to match the W3 fluid experimental measurements and fluid model data by tuning the EOS parameters. Table 2 shows PVT properties according to the dissolved gas mole fraction [25]. The properties are saturation pressure, gas oil ratio (GOR), gas solubility, formation volume factor (FVF), and swelling factor (SF). Fluid characterization, lumping of components, and matching with laboratory data are performed through regression using a modification of the adaptive least-squares algorithm of Dennis et al. [28]. The Peng–Robinson equation of state (PR-EOS) was used to construct the fluid model. Table 3 presents a comparison of experimental and simulation PVT properties of the fluid. Through the regression method, results from the fluid model were properly matched to the experimental measurements and verified reliability.

2.2. Minimum Miscibility Pressure (MMP)

CO2 is widely used in EOR through injection into an oil reservoir to increase oil recovery. CO2 is used as a solvent, reducing oil viscosity and expanding the volume of oil in the reservoir. These phenomena can be expected to be more prominent if the oil and gas are more miscible. If the injected gas and fluid are not completely miscible, some of the gas does not dissolve into the oil and moves faster than the fluid, forming a separate phase. This causes an early breakthrough at the production well and lowers the productivity of the oil reservoir. To avoid this circumstance, determining whether the gas and fluid are under miscible conditions at the reservoir pressure is of significant interest. The lowest pressure to achieve miscibility by a multiple contact process under the given pressure and temperature is called the minimum miscibility pressure (MMP). Below the MMP, immiscible displacement occurs and consequently the oil recovery is reduced.
Methods for measuring MMP include the slim-tube test, the rising-bubble method, and the vanishing interfacial tension (VIT) test [29,30,31,32,33]. The slim-tube test has been widely used to measure MMP and is the most used method [34]. Since these methods are time-consuming, expensive, and sometimes less accurate, it is better to use the simulation method to determine the MMP. A slim-tube simulation model is conducted to measure the MMP. The slim tube is saturated with oil, and gas is subsequently injected to displace the oil in the slim tube. The amount of gas and oil is determined, and the recovery is defined. When the recovery is at least 90%, it is said that oil and gas are miscible. This process is repeated at different pressures, and the oil recovery is recorded at certain pressure. MMP from the slim-tube simulation is estimated as the lowest pressure with a recovery of 90% of the oil–gas system [35].

2.3. Evaluation of CO2 Streams

CO2 can be captured from various sources through various technologies, and impurities such as N2, O2, CH4, H2S, Ar, and water may exist in the CO2 stream. The amounts of impurities contained in CO2 depends on the degree of fuel oxidation and characteristics of the fuel. Among the three general CO2 capture methods, pre-combustion, post-combustion, and oxy-fuel combustion, the oxy-fuel combustion process generates the highest impurities content in the CO2 stream. Due to the use of lower purity oxygen, which is relatively cost-effective, significant amounts of air-derived impurities such as N2, O2, and Ar are produced. Table 4 presents the main impurities from different CO2 capture technologies [13]. In this study, the composition of the gas obtained from the oxy-fuel scenario with the lowest CO2 purity level was used to predict how many contaminants will affect performance and to compare the CO2-EOR and CO2 storage efficiency of impure and pure CO2.

2.4. Solubility

A Solubility of gas in connate water is considered by including Henry’s law as follows [36].
f i w = y i w H i
where f i w is the fugacity of the component i , y i w is the composition of the component i in the aqueous phase and H i is the Henry’s law constant. The Henry’s law constant can be expressed by [37]:
l n H i = l n H i * + V i ¯ p p * R T
where H i * is the Henry’s law constant for component i at reference pressure, p * is the reference pressure, V i ¯ is the partial molar volume of component i at infinite dilution, R is the universal gas constant, and T is the temperature. The values are obtained from Li and Nghiem’s method [36].

2.5. Reservoir Modeling

A compositional reservoir simulator, CMG-GEM, was used to simulate a two-dimensional (2D) vertical reservoir discretized into 52 × 1 × 20 grid blocks of volume 3.048 × 3.048 × 1.524 m3. The water-alternation-gas (WAG) injection scenario was used to investigate the miscibility and sweep efficiency with gravity override. In order to compare differences in the performance of EOR and CCS depending on the impurity content, the gas composition in Table 5 was used. The solubility of each component in water is considered by including Henry’s law to represent gas solubility. Although impure gas was composed of 8 impurities, minor impurities at ppm levels such as H2O, NOx, SOx, etc. were neglected. The injection process was conducted for 12 years, with water flooding in the first 2 years and WAG cycles of 10 years (Figure 1). During the 5 WAG cycles, water and gas were injected sequentially. Two injection cases were analyzed: 100% CO2 + 0% impurities (Case 1) and 85% CO2 + 15% impurities (Case 2) (Table 6). Each gas injection rate was constant at 566 ft3/day at surface condition. The initial reservoir condition is presented in Table 7. The producing bottom hole pressure was set to 2000 psi close to the MMP of 100% CO2, leading to miscible flooding in the case of pure CO2 otherwise immiscible flooding in the case of impure CO2.

3. Results

3.1. Physical Properties of Impure Gas

MMP, Density, and Viscosity

A change in the physical properties of the gas will impact the displacement and sweep efficiencies. The slim-tube simulation method was conducted to determine CO2 MMP for the reservoir fluid, which was matched against the experimental data. It has been recognized that MMP between the oil and injected solvents depends on the purity of CO2. In general, the component of H2S or intermediate hydrocarbons such as C3, C4 reduce the MMP, whereas the presence of N2 and CH4 in the CO2 stream increase the MMP [38]. The MMP between CO2 mixtures containing 10% of each representative impurity in the CO2 such as CH4, H2, N2, and O2, and W3 fluid was calculated. The results from simulated MMPs using the slim-tube method with different mole fractions of CO2 and impurities are shown in Table 8. Impurities of CH4, H2, N2, and O2 effected an increase in the MMP, while H2S decreased the MMP. Therefore, CO2 containing either components that increase (CH4, H2, N2, O2) or decrease (H2S) MMP changes the miscibility.
Table 9 presents the impact of impure gas in the CO2 on the gas properties. The MMP of pure CO2 for this reservoir fluid was determined to be 13,900 kPa. Presence of the impure gas content increased the MMP to 19,927 kPa, while decreasing the density and viscosity, and had a negative impact on the miscibility of the gas and oil. The density of the injection gas impacted both injection rate and pressure. Density changes due to the addition of impurities reduced the gas compressibility and caused differences in bottomhole pressure at given injection wellhead pressure.

3.2. Effects of Impurities in CO2 Streams on EOR Efficiency

3.2.1. Vertical Sweep Efficiency

The decrease in vertical sweep efficiency due to impurities in CO2 is explained by the viscosity of the oil. Figure 2 shows the distribution of oil viscosity when 0.22 PV of gas is injected, indicating the decrease in vertical sweep efficiency due to impurities. In Case 2, impurities in the CO2 stream cause the injected gas to move forward faster since it hinders the role of CO2 in lowering the viscosity of oil. The blue swept area on the front represents the area where the injected fluid is in maximum contact with the oil, indicating the gas front. The minimum viscosity in Case 1 is 0.48 mPa·s and in Case 2 is 0.59 mPa·s. Therefore, the addition of 15% impurities generated a 22.9% decrease in the oil viscosity, indicating less gas acts as a solvent to decrease the oil viscosity after multiple contacts due to the impurities in CO2.
In horizontal gas flow through the cross-sectional 2D model, the vertical sweep efficiency was significantly reduced due to gravity segregation. The steeper the slope of the gas front of the sweep area, the more the injected gas contacts with the reservoir fluid. Since the difference in density and gravity between the injected fluid and reservoir fluid causes an override, the injected gas moves to the upper layer, reducing the vertical sweep efficiency. The change in vertical sweep efficiency due to the addition of impurities can be quantified by the viscous gravitational number ( N g v ) , which includes the terms of flooding velocity, density, and viscosity of fluid. The viscous gravitational can be expressed by [39]:
N g v = time   for   horizontal   flow time   for   vertical   flow = k v k r s ρ g c o s α A L q s μ s h
where k v is the vertical permeability, k r s is the relative permeability, ρ is the density difference between injected and reservoir fluids, g is the gravitational acceleration, A is the cross-sectional area, L is the length of the reservoir, q s is the flow rate of the solvent, μ s is the solvent viscosity, and h is the height of the reservoir. The range that determines whether gravity or viscous forces dominate is as follows [39]:
N g v <   0.1 :   Viscous   forces   dominate ; 0.1   <   N g v <   10 :   Intermediate ; N g v >   10 :   Gravity   dominates .
The decrease in vertical sweep efficiency was quantified from the viscous gravity number, as shown in Table 10. In Case 2, the viscous gravity number increased by as much as 59.6% by adding impurities into the CO2. Since a larger viscous gravity number prevents the lower layer of the reservoir from being sufficiently swept, impurities in the injecting CO2 stream lower the vertical sweep efficiency.

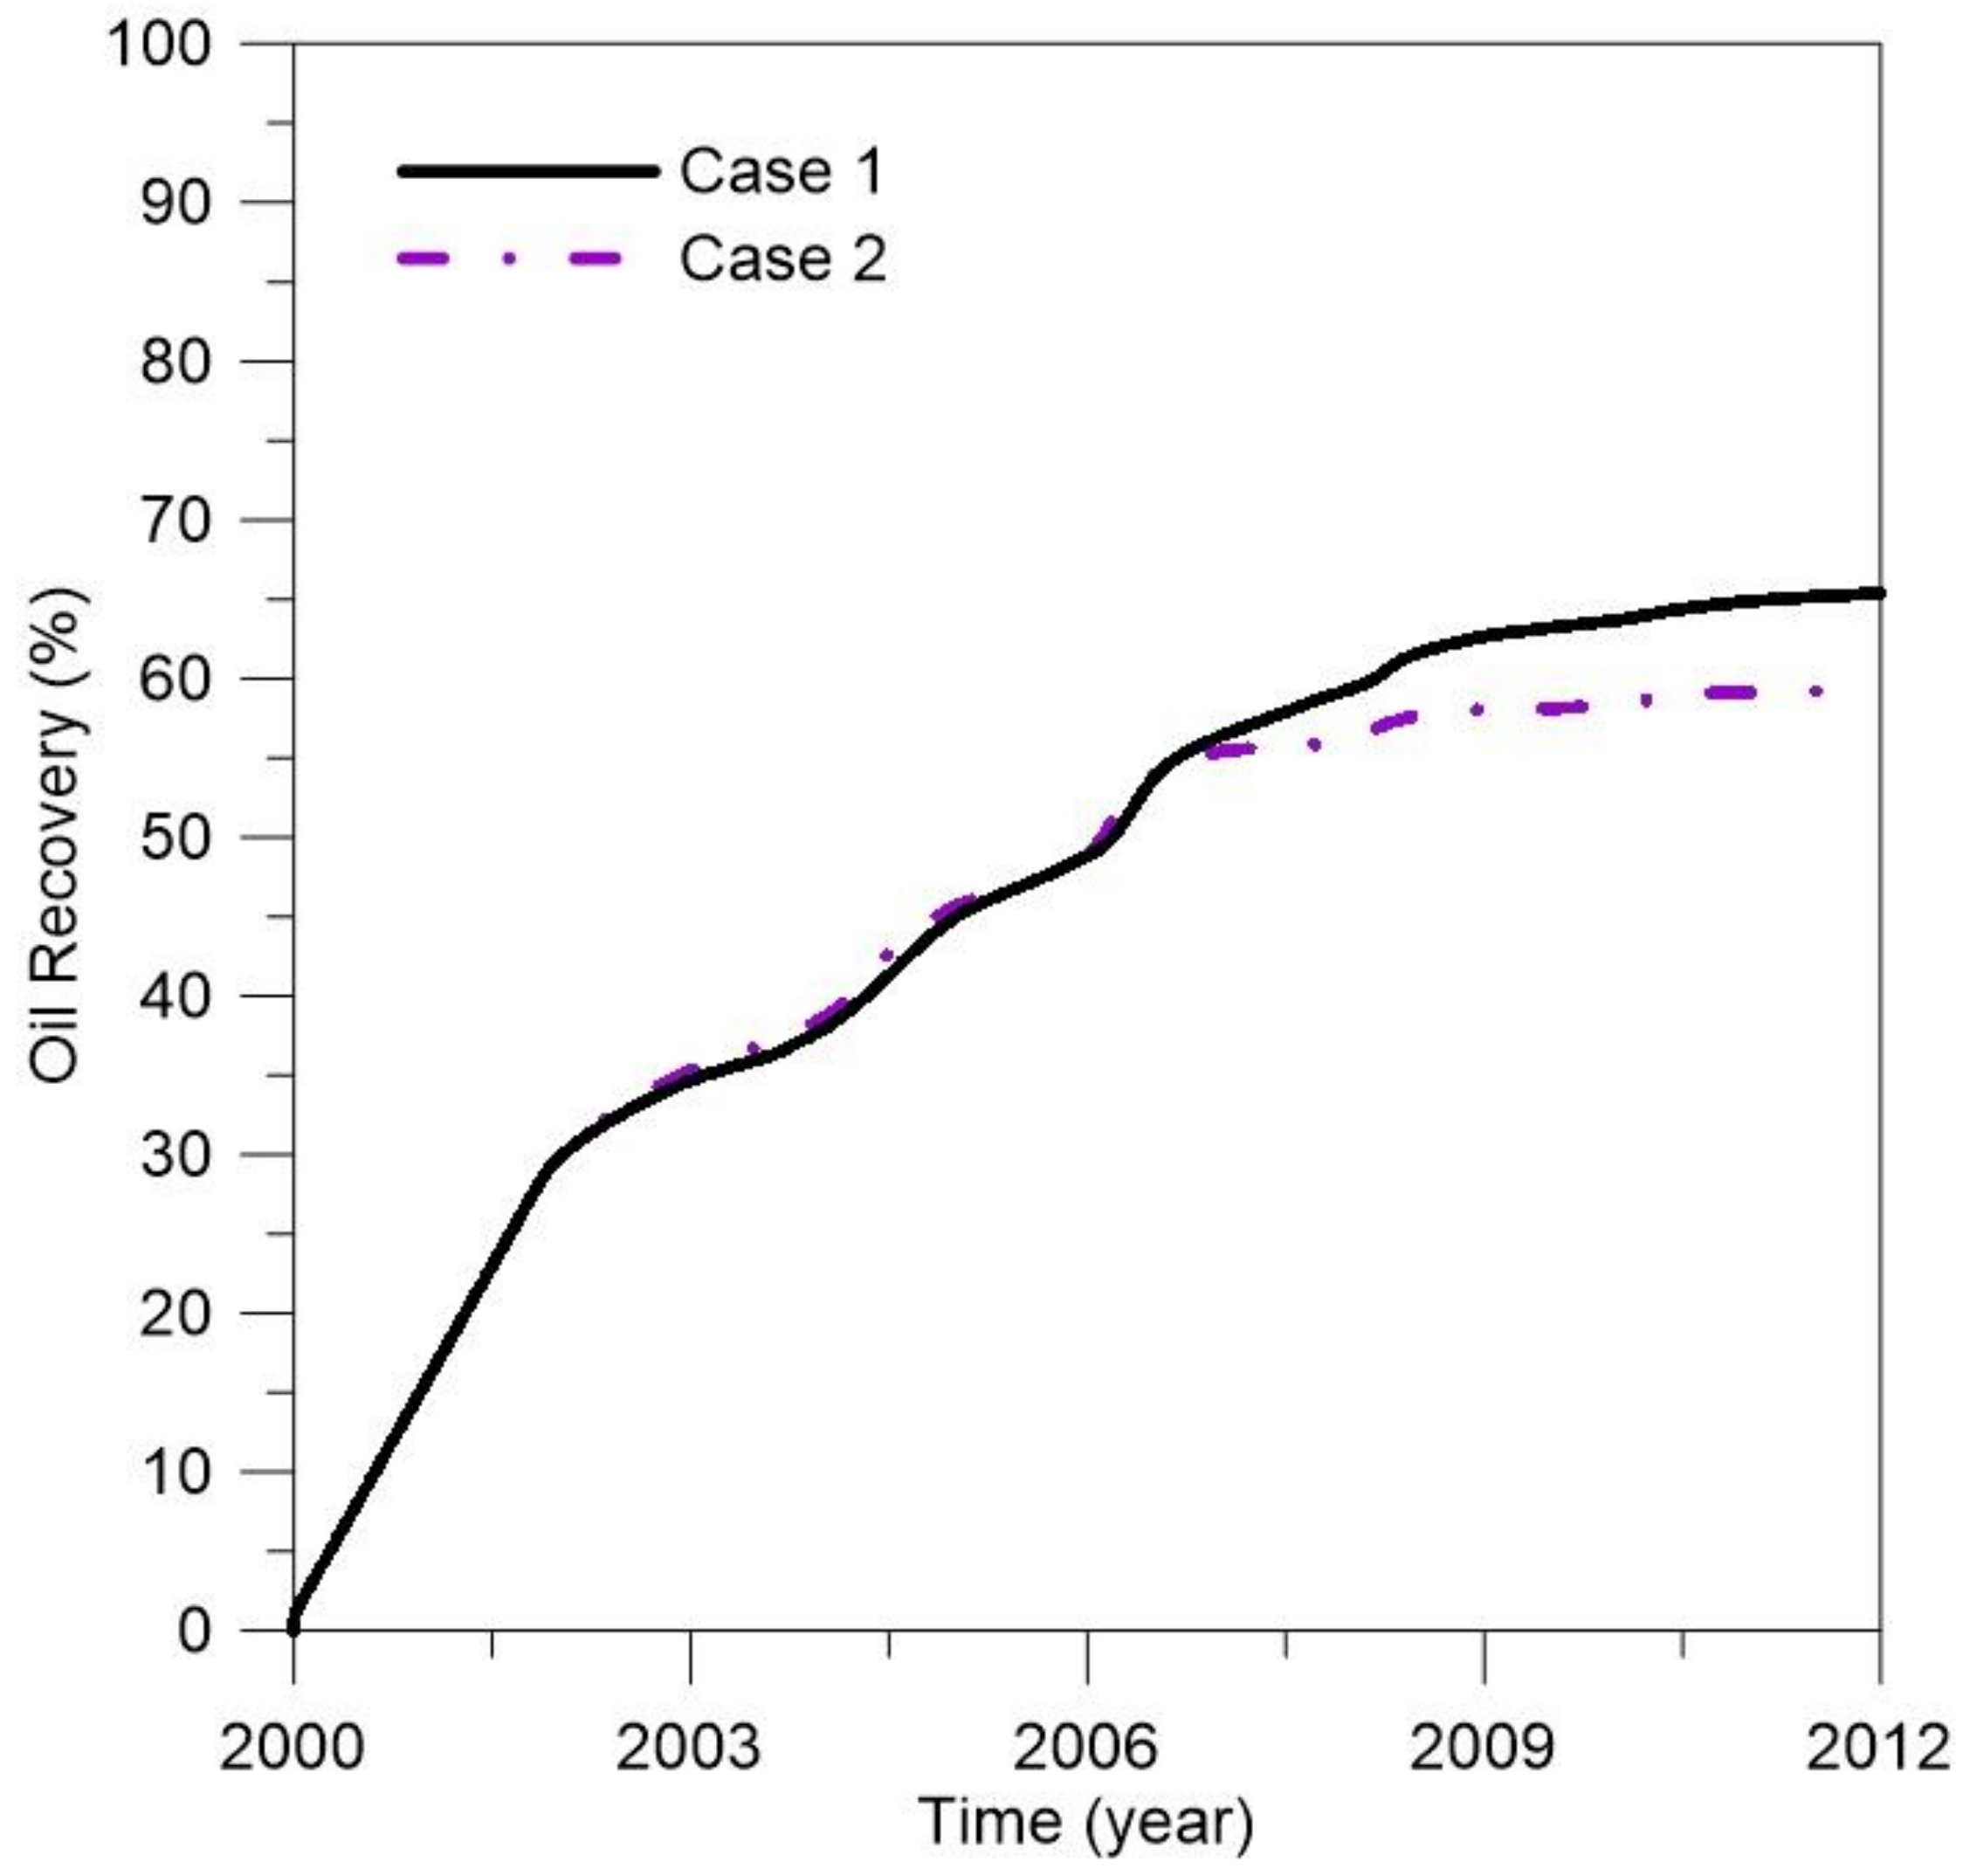
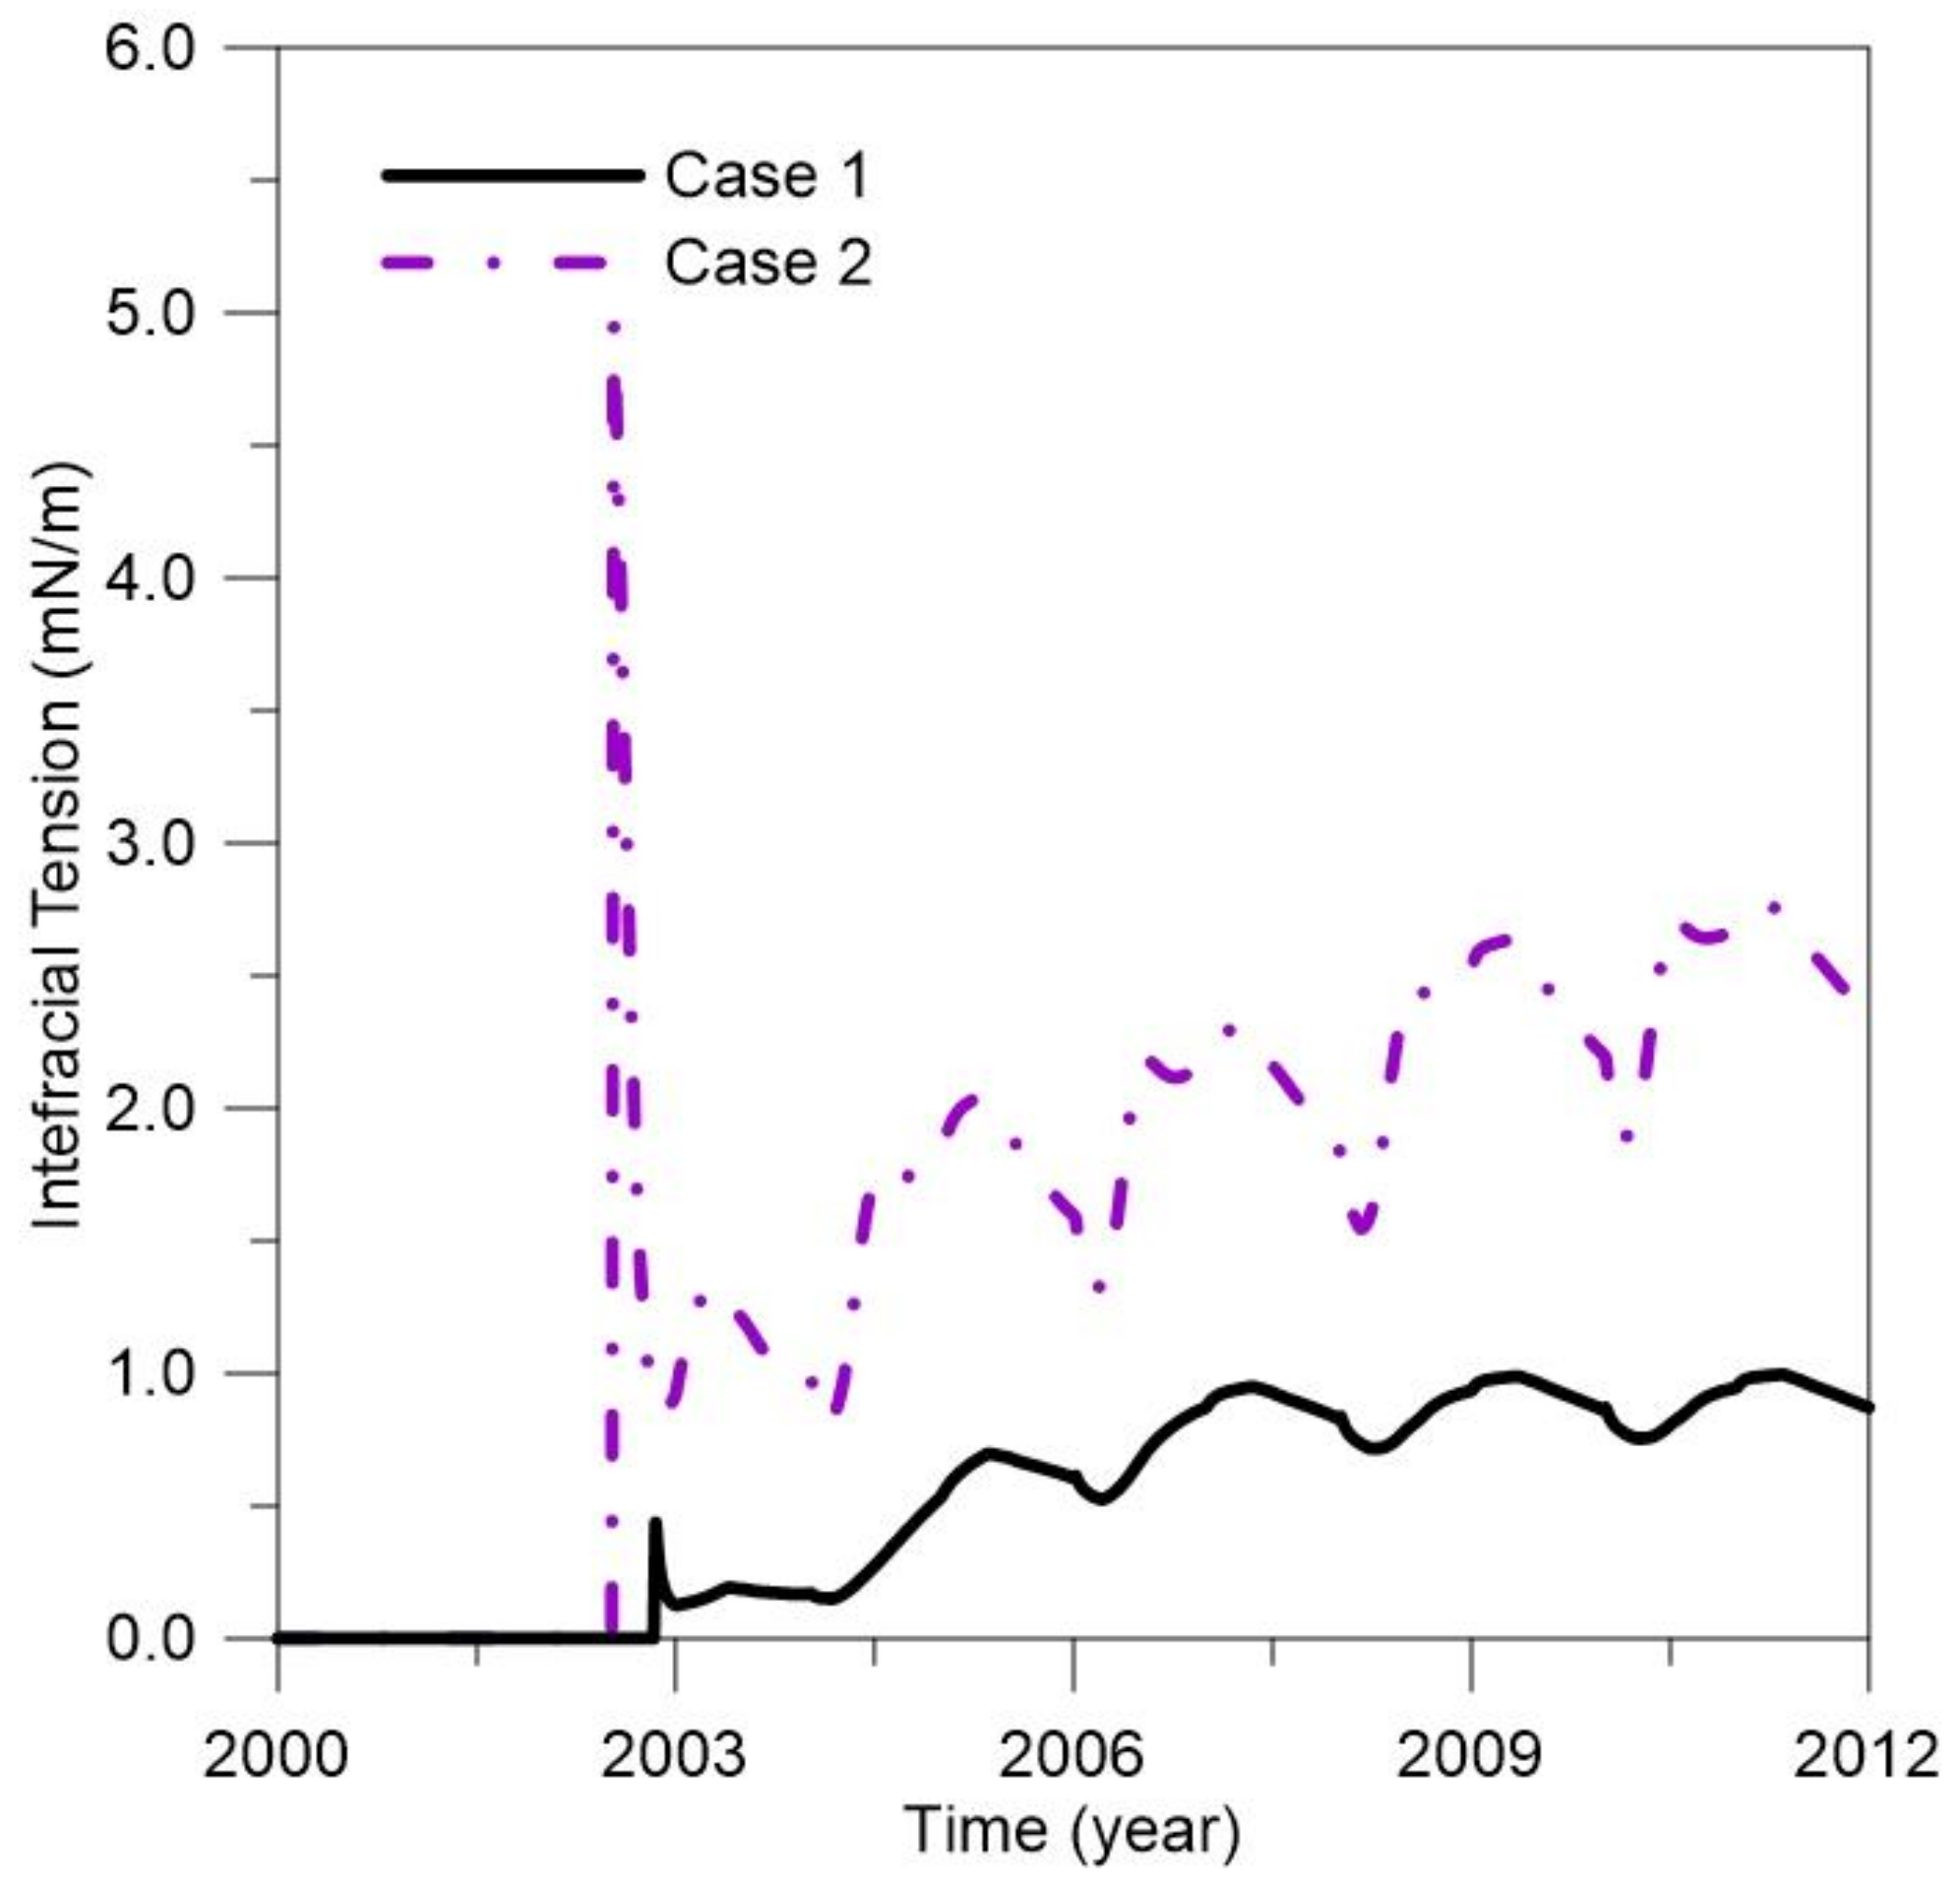
3.2.2. Displacement Efficiency

Above the MMP, the injected gas is completely mixed with the oil and the interfacial tension (IFT) between the injected gas and fluid would be negligible, affecting the relative permeability curves. The density and viscosity also decrease, leading to miscible displacement. The effect of adding impurities on the IFT between gas and oil in the grid block coordinates (12, 1 10) was investigated. The lowest IFT of Case 1 was 0.10 mN/m between the CO2 and reservoir fluid, whereas for Case 2 it was 0.65 mN/m, a 547% higher value. The addition of impurities increased the IFT of Case 2 as shown in Figure 3, indicating that higher pressure would be required to achieve the miscible condition. In the same grid block of (12, 1, 10), the effect of reducing the density of oil was hindered as impurities were added to the CO2 stream at the beginning of the injection period. After multiple contacts, Case 1 gave the lowest oil density value of 785 kg/m3 (2.5% reduction in initial oil density), while Case 2 gave a value of 799 kg/m3 (0.83% reduction in initial oil density). However, at some point, the oil density of Case 1 was greater than that of Case 2 since the intermediate and heavy components of the oil were displaced (Figure 4).
The cumulative gas injection under reservoir conditions obtained from CO2 and impure CO2 WAG is indicated in Figure 5. Impurities in the CO2 stream have low critical temperatures and have relatively lower compressibility under the reservoir conditions [13]. CO2 containing impurities would cause an increase in molar volume, i.e., impure CO2 would occupy more volume than pure CO2 under the same conditions. Although the injection rate was the same at the surface condition, the total amount of injected gas of Case 2 was greater than Case 1 under reservoir conditions. The gas moves faster in the upper layer in Case 2 than in Case 1, which causes an early gas breakthrough, as shown in Figure 5. This phenomenon occurs because the gas does not lower the viscosity of the oil compared with pure CO2, and some of the injected gas forms a gas channel, causing early gas breakthrough in the production well, as shown in Figure 6.
The average reservoir pressure is presented in Figure 7. As the impurities are less compressible than CO2, they occupy a larger volume in the pore, increasing the average reservoir pressure. However, due to significant reduction in the density of the injected stream caused by impurities, a higher flow pressure is required to achieve the same bottom hole pressure in the pure CO2 case. Therefore, co-injection of impurities and CO2 causes a relatively higher oil production compared with CO2 injection at the early stage of WAG cycles. This trend is reversed due to the decrease in vertical sweep and displacing efficiency from the impurities, and the oil recovery is higher for Case 1 as shown in Figure 8. As a result, impurities in CO2 reduce the oil recovery by 9.2%.

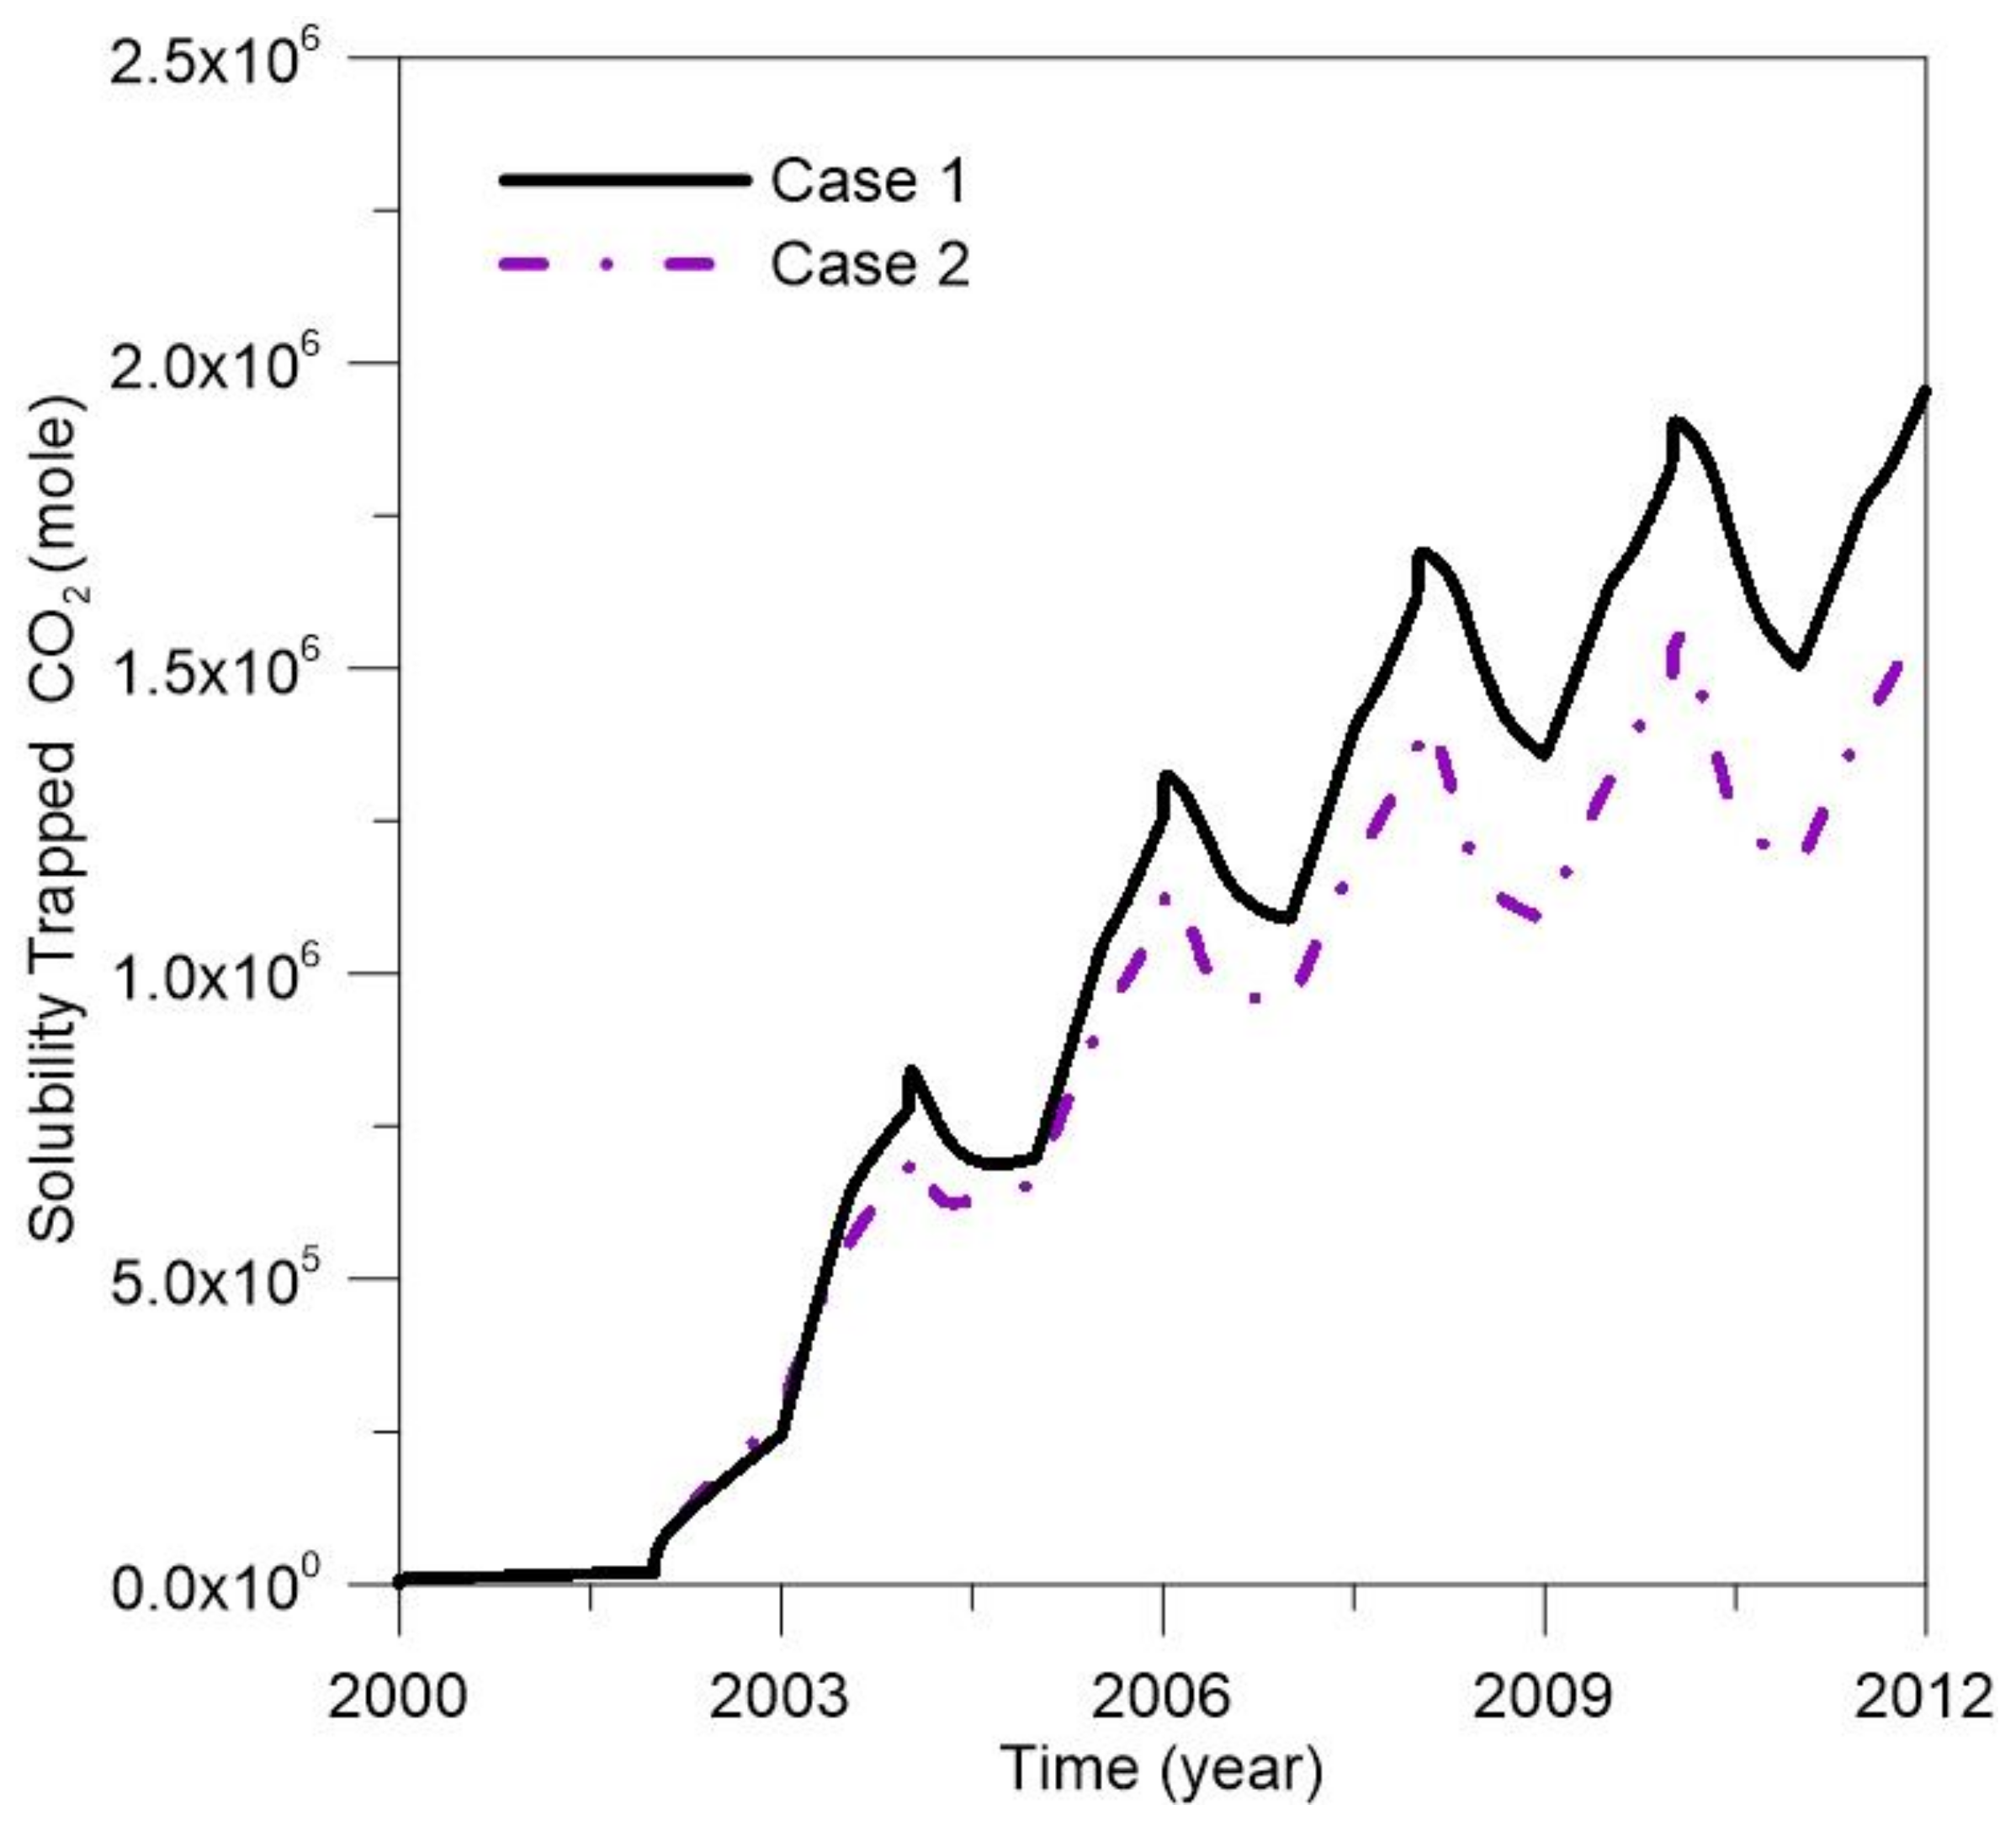
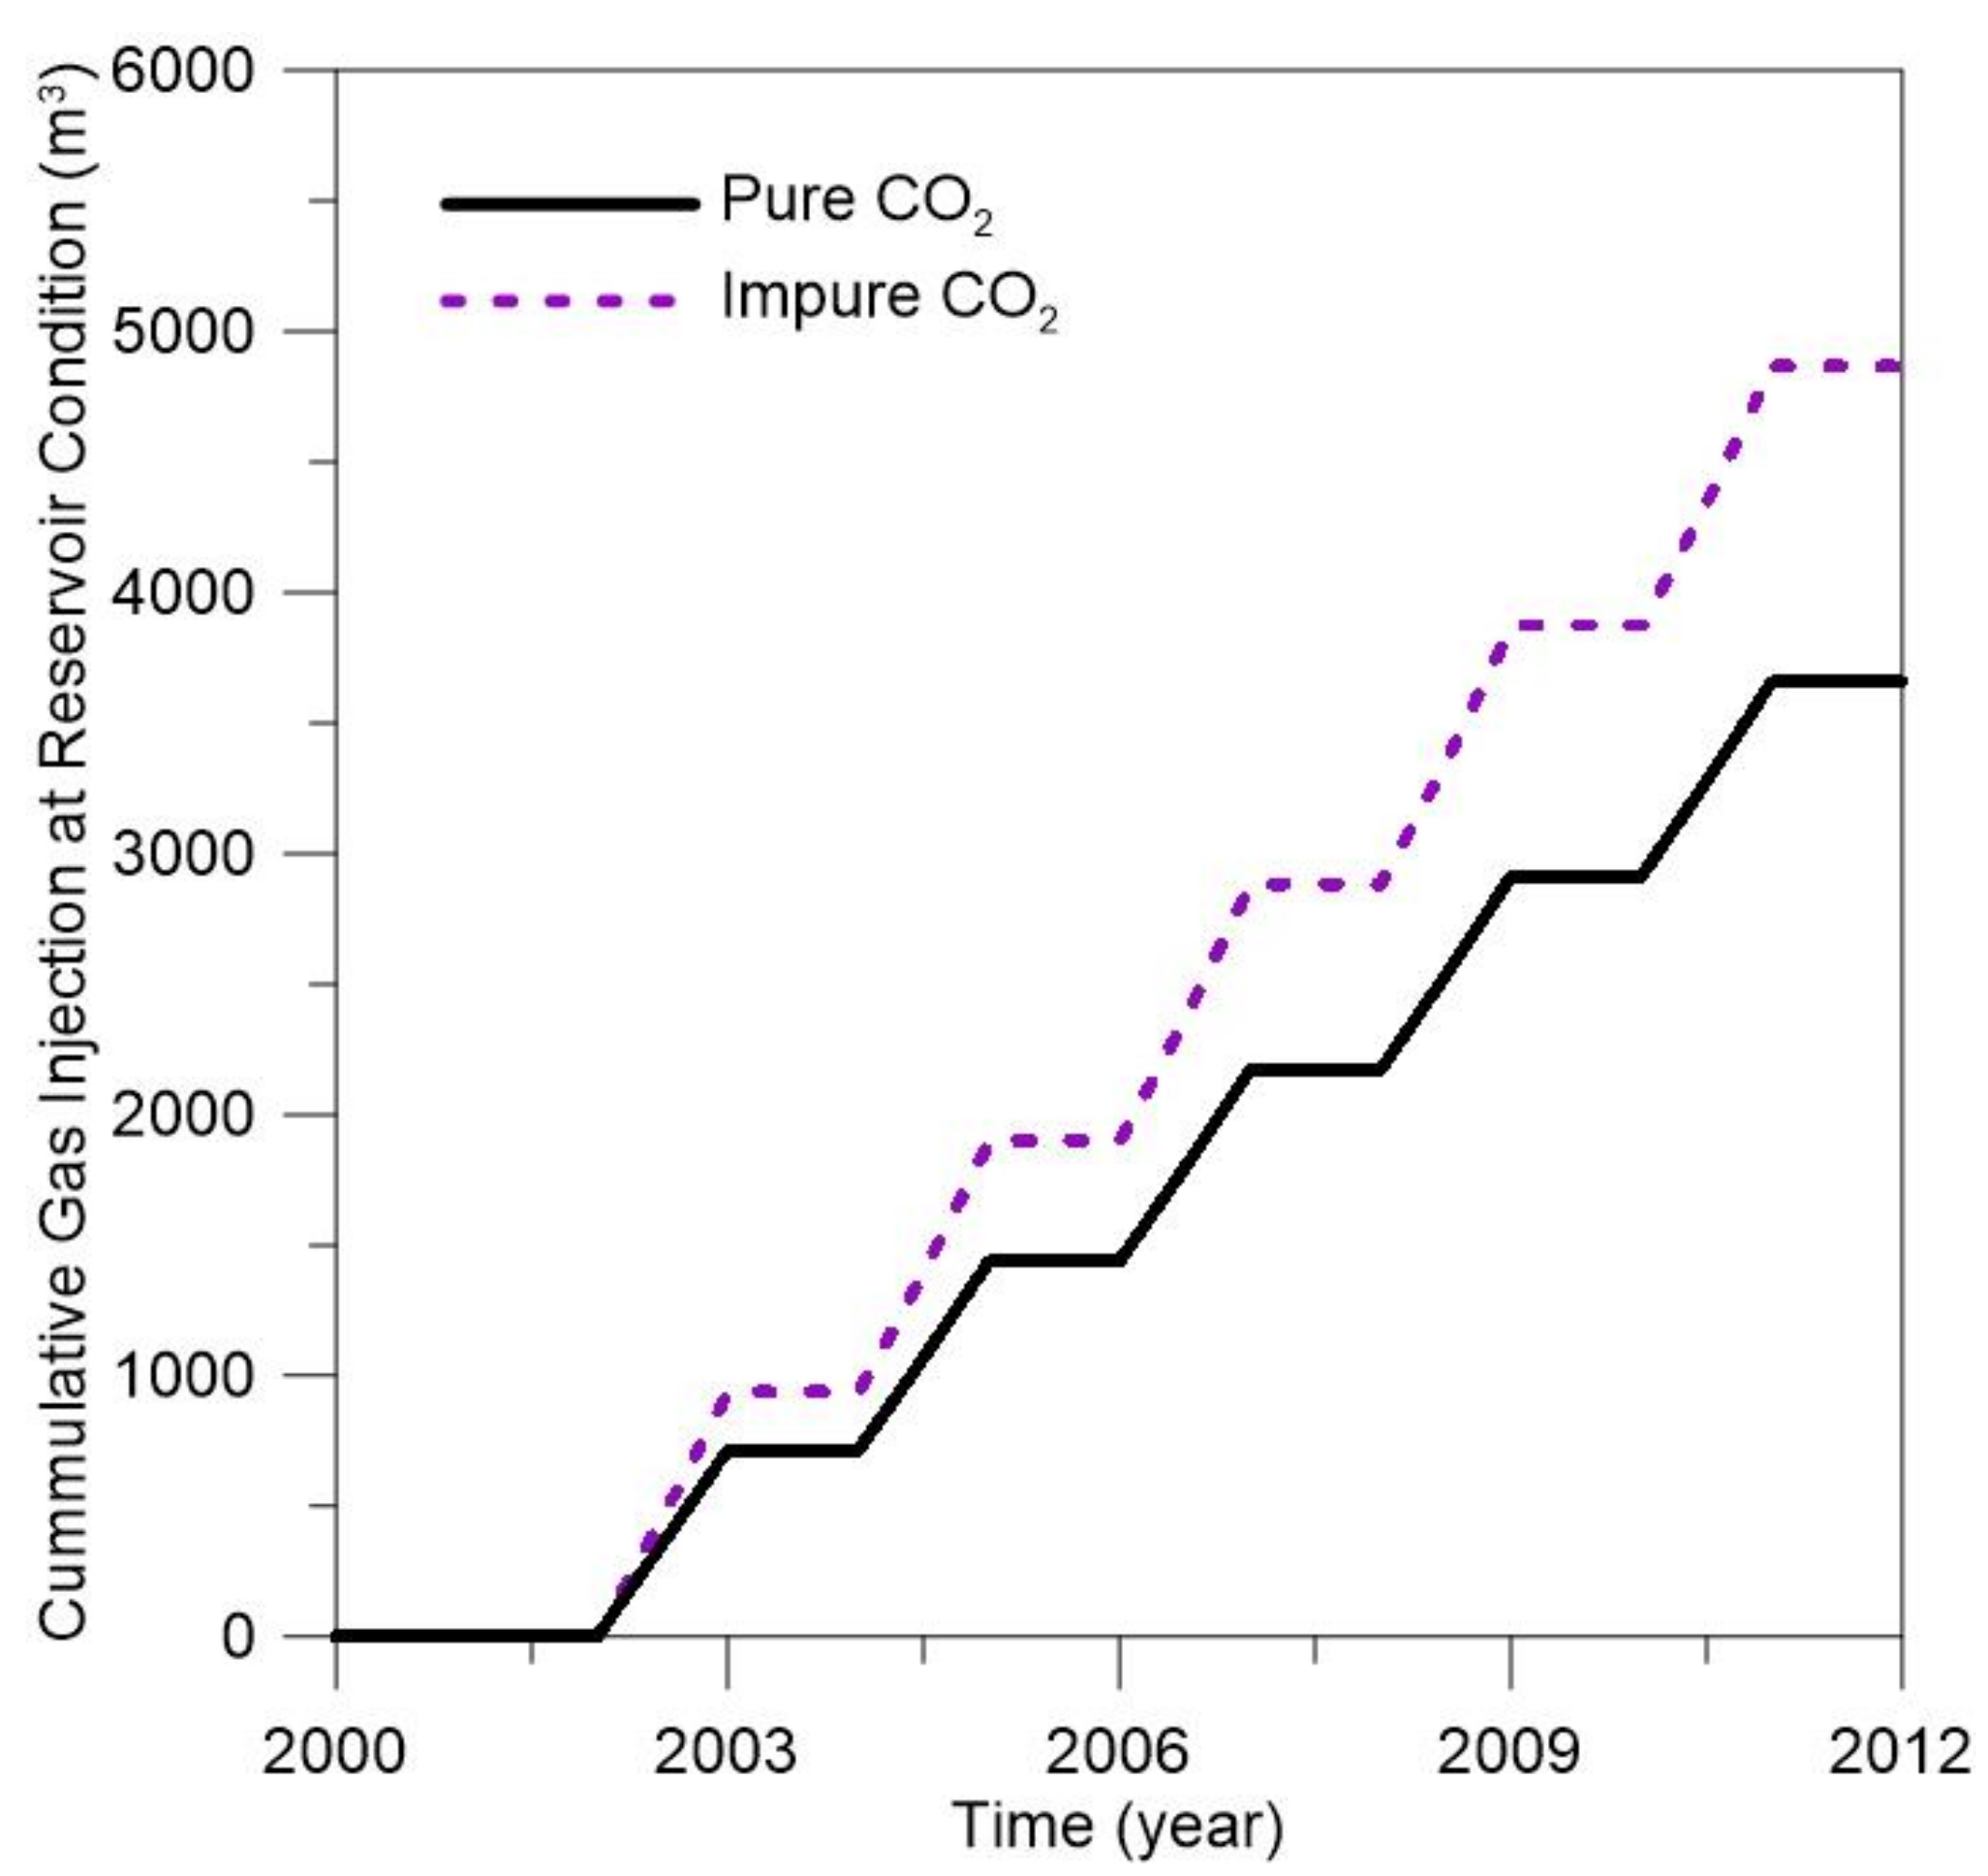
3.3. Effects of Impurities in CO2 Streams on Carbon Storage Efficiency

Figure 9 and Figure 10 indicate the carbon sequestration by residual trapping and solubility trapping. Considering that impurities have less viscosity than CO2, the presence of impurities increases the mobility and thus increases the horizontal movement of the injected gas. Since the density of impurities is lower than that of CO2, the injected gas with impurities migrates upward easily. A significant volume of the injected gas moves and accumulates upward, which negatively affects residual trapping. Residually trapped CO2 was reduced by 18.6% in Case 2 compared with Case 1. The solubility trapped CO2 also decreased by 19.8% with the addition of impurities into CO2. Since the absolute amount of injected CO2 into the reservoir was less in Case 2 than in Case 1 due to the addition of impurities, the ratio of sequestered CO2 to injected CO2 was quantified. Figure 11 compares the ratio of CO2 stored by residual trapping and solubility trapping. In Case 2, the performance of residual trapping was reduced by 4.1% and solubility trapping by 5.6% compared with Case 1. As a result, impurities in CO2 reduced the total CCS performance by 4.3%.

4. Discussion

Impurities captured together with CO2 are subjected to a purification process to generate high purity CO2, which significantly increases the capture cost. Therefore, it is cost-effective to inject the CO2 and impurities together. However, impure CO2 adversely affects CO2-EOR performance, resulting in reduced oil recovery. The change in oil recovery depending on the purity level would be controlled and considered. Though not considered in this study, it is important to develop the economic model to estimate the appropriate purity level of the CO2 stream by using economic factors such as capital expenditures (CAPEX), operating expenditure (OPEX), tax credits, oil price, and CO2 price depending on the purity level, sources and technology. For field applications, since the optimal operating conditions to increase the performance of CCS-EOR depend on the characteristics of the reservoir, it is necessary to develop a design for each site, such as different injection scenarios, based on economic analysis for field application.

5. Conclusions

This study aimed to investigate the effects of impurities in the CO2 on CO2-EOR and CCS performances. The degree of MMP change depended on the type of impurity since most non-condensable impurities increased the MMP, negatively affecting the miscible state except for H2S. A compositional simulation was used to analyze the effect of impurities on both CO2-EOR efficiency and carbon storage. A 2D vertical model was used to investigate vertical sweep efficiency considering gravity override during the WAG injection period. Two cases were analyzed: pure CO2 (Case 1) and impure CO2, with a composition of 15% impurities captured from oxy-fuel combustion (Case 2). The vertical sweep efficiency and displacement efficiency were affected by the impurities and eventually affected the oil recovery and CO2-EOR performance. Impurities in the CO2 stream increased the IFT and hindered the reduction in oil density. The viscous gravity number increased by 59.6%, confirming the decrease in vertical sweep efficiency due to the addition of impurities. The IFT on a specific grid block increased by 547% in Case 2. The effect of reducing oil density as a solvent was also inhibited from 2.5% to 0.83%. As a result, impurities in CO2 reduced oil recovery by 9.2%. Due to CO2 impurities, residual trapping performance was reduced by 4.1%, solubility trapping decreased by 5.6%, and the total CCS performance was reduced by 4.3%.

Author Contributions

Conceptualization, H.-S.L. and K.-S.L.; methodology, H.-S.L., J.C., Y.-W.L. and K.-S.L.; software, H.-S.L. and J.C.; validation, H.-S.L. and K.-S.L.; formal analysis, H.-S.L.; investigation, H.-S.L., J.C. and Y.-W.L.; resources, H.-S.L. and K.-S.L.; data curation, H.-S.L.; writing—original draft preparation, H.-S.L.; writing—review and editing, H.-S.L. and K.-S.L.; visualization, H.-S.L., J.C. and Y.-W.L.; supervision, K.-S.L.; project administration, K.-S.L.; funding acquisition, K.-S.L. All authors have read and agreed to the published version of the manuscript.

Funding

This work was supported by the National Research Foundation of Korea (NRF) grant funded by the Korea government (MSIT) (No. 2020R1F1A1070406). Jinhyung Cho was supported by a National Research Foundation of Korea (NRF) grant (No. 2020R1I1A1A01067015).

Institutional Review Board Statement

Not applicable.

Informed Consent Statement

Not applicable.

Data Availability Statement

The data presented in this study are available on request from the corresponding author.

Acknowledgments

The authors are grateful to the Computer Modelling Group Ltd. (CMG), Calgary, Canada for technical support.

Conflicts of Interest

The authors declare no conflict of interest.

References

  1. Gozalpour, F.; Ren, S.R.; Tohidi, B. CO2 EOR and storage in oil reservoir. Oil Gas Sci. Technol. 2005, 60, 537–546. [Google Scholar] [CrossRef] [Green Version]
  2. Holm, L. Carbon dioxide solvent flooding for increased oil recovery. Trans. AIME 1959, 216, 225–231. [Google Scholar] [CrossRef]
  3. Terzariol, M.; Goldsztein, G.; Santamarina, J.C. Maximum recoverable gas from hydrate bearing sediments by depressurization. Energy 2017, 141, 1622–1628. [Google Scholar] [CrossRef] [Green Version]
  4. Kuuskraa, V.A.; Godec, M.L.; Dipietro, P. CO2 utilization from “next generation” CO2 enhanced oil recovery technology. Energy Procedia 2013, 37, 6854–6866. [Google Scholar] [CrossRef]
  5. IEAGHG. CO2 Storage in Depleted Oilfields: Global Application Criteria for Carbon Dioxide Enhanced Oil Recovery; IEAGHG Publications: Cheltenham, UK, 2009. [Google Scholar]
  6. Khelifa, T.; Maini, B.B. Evaluation of CO2 based vapex process for the recovery of bitumen from tar sand reservoirs. In Proceedings of the SPE International Improved Oil Recovery Conference in Asia Pacific, Kuala Lumpur, Malaysia, 20–21 October 2003. [Google Scholar]
  7. Hassanpouryouzband, A.; Joonaki, E.; Edlmann, K.; Haszeldine, R.S. Offshore geological storage of hydrogen: Is this our best option to achieve net-zero? ACS Energy Lett. 2021, 6, 2181–2186. [Google Scholar] [CrossRef]
  8. Choubineh, A.; Helalizadeh, A.; Wood, D.A. The impacts of gas impurities on the minimum miscibility pressure of injected CO2-rich gas–crude oil systems and enhanced oil recovery potential. Pet. Sci. 2019, 16, 117–126. [Google Scholar] [CrossRef] [Green Version]
  9. Chapoy, A.; Burgass, R.; Tohidi, B.; Austell, J.M.; Eickhoff, C. Effect of common impurities on the phase behavior of carbon-dioxide-rich systems: Minimizing the risk of hydrate formation and two-phase flow. SPE J. 2011, 16, 921–930. [Google Scholar] [CrossRef]
  10. Chapoy, A.; Nazeri, M.; Kapateh, M.; Burgass, R.; Coquelet, C.; Tohidi, B. Effect of impurities on thermophysical properties and phase behaviour of a CO2-rich system in CCS. Int. J. Greenh. Gas Control 2013, 19, 92–100. [Google Scholar] [CrossRef] [Green Version]
  11. Jin, L.; Pekot, L.J.; Hawthorne, S.B.; Salako, O.; Peterson, K.J.; Bosshart, N.W.; Jiang, T.; Hamling, J.A.; Gorecki, C.D. Evaluation of recycle gas injection on CO2 enhanced oil recovery and associated storage performance. Int. J. Greenh. Gas Control 2018, 75, 151–161. [Google Scholar] [CrossRef]
  12. Ziabakhsh-Ganji, Z.; Kooi, H. An equation of state for thermodynamic equilibrium of gas mixtures and brines to allow simulation of the effects of impurities in subsurface CO2 storage. Int. J. Greenh. Gas Control 2012, 11, S21–S34. [Google Scholar] [CrossRef]
  13. IEAGHG. Effects of Impurities on Geological Storage of CO2; IEAGHG Publications: Cheltenham, UK, 2011. [Google Scholar]
  14. Kolster, C.; Mechleri, E.; Krevor, S.; Mac Dowell, N. The role of CO2 purification and transport networks in carbon capture and storage cost reduction. Int. J. Greenh. Gas Control 2017, 58, 127–141. [Google Scholar] [CrossRef]
  15. Bachu, S.; Bennion, D.B. Chromatographic partitioning of impurities contained in a CO2 stream injected into a deep saline aquifer: Part 1. Effects of gas composition and in situ conditions. Int. J. Greenh. Gas Control 2009, 3, 458–467. [Google Scholar] [CrossRef]
  16. Wilkinson, J.R.; Leahy-Dios, A.; Teletzke, G.F.; Dickson, J.L. Use of CO2 containing impurities for miscible enhanced oil recovery. In Proceedings of the International Oil and Gas Conference and Exhibition in China, Beijing, China, 8–10 June 2010. [Google Scholar]
  17. Savary, V.; Berger, G.; Dubois, M.; Lacharpagne, J.; Pages, A.; Thibeau, S.; Lescanne, M. The solubility of CO2 + H2S mixtures in water and 2 M NaCl at 120 °C and pressures up to 35 MPa. Int. J. Greenh. Gas Control 2012, 10, 123–133. [Google Scholar] [CrossRef]
  18. Shabani, B.; Vilcáez, J. Prediction of CO2-CH4-H2S-N2 gas mixtures solubility in brine using a non-iterative fugacity-activity model relevant to CO2-MEOR. J. Pet. Sci. Eng. 2017, 150, 162–179. [Google Scholar] [CrossRef]
  19. Dhima, A.; de Hemptinne, J.; Jose, J. Solubility of hydrocarbons and CO2 mixtures in water under high pressure. Ind. Eng. Chem. Res. 1999, 38, 3144–3161. [Google Scholar] [CrossRef]
  20. Zhang, P.Y.; Huang, S.; Sayegh, S.; Zhou, X.L. Effect of CO2 impurities on gas-injection EOR processes. In Proceedings of the SPE/DOE Symposium on Improved Oil Recovery, Tulsa, OK, USA, 17–21 April 2004. [Google Scholar]
  21. Luo, E.; Hu, Y.; Wang, J.; Fan, Z.; Hou, Q.; Ma, L.; Dai, S. The effect of impurity on miscible CO2 displacement mechanism. Oil Gas Sci. Technol.–Revue d’IFP Energ. Nouv. 2019, 74, 1–20. [Google Scholar] [CrossRef]
  22. Sayegh, S.; Huang, S.; Zhang, Y.; Lavoie, R. Effect of H2S and pressure depletion on the CO2 MMP of Zama Oils. J. Can. Pet. Technol. 2007, 46, 34–41. [Google Scholar] [CrossRef]
  23. Blanco, S.T.; Rivas, C.; Fernández, J.; Artal, M.; Velasco, I. Influence of methane in CO2 transport and storage for CCS technology. Environ. Sci. Technol. 2012, 46, 13016–13023. [Google Scholar] [CrossRef]
  24. Ren, Q.; Chen, G.; Yan, W.; Guo, T. Interfacial tension of (CO2+ CH4)+ water from 298 K to 373 K and pressures up to 30 MPa. J. Chem. Eng. Data 2000, 45, 610–612. [Google Scholar] [CrossRef]
  25. Srivastava, R.K.; Huang, S.S.; Dong, M. Laboratory investigation of Weyburn CO2 miscible flooding. J. Can. Pet. Technol. 2000, 39, 41–51. [Google Scholar] [CrossRef]
  26. Peng, D.Y.; Robinson, D.B. A new two-constant equation of state. Ind. Eng. Chem. Fundam. 1976, 15, 59–64. [Google Scholar] [CrossRef]
  27. Robinson, D.B.; Peng, D.-Y. The Characterization of the Heptanes and Heavier Fractions for the GPA Peng-Robinson Programs; Research Report 28; Gas Processors Association: Tulsa, OK, USA, 1978. [Google Scholar]
  28. Dennis Jr, J.E.; Gay, D.M.; Walsh, R.E. An adaptive nonlinear least-squares algorithm. ACM Trans. Math. Softw. (TOMS) 1981, 7, 348–368. [Google Scholar] [CrossRef]
  29. Yellig, W.F.; Metcalfe, R.S. Determination and prediction of CO2 minimum miscibility pressures (includes associated paper 8876). J. Pet. Technol. 1980, 32, 160–168. [Google Scholar] [CrossRef]
  30. Elsharkawy, A.M.; Poettmann, F.H.; Christiansen, R.L. Measuring CO2 minimum miscibility pressures: Slim-tube or rising-bubble method? Energy Fuels 1996, 10, 443–449. [Google Scholar] [CrossRef]
  31. Dong, M.; Huang, S.; Dyer, S.B.; Mourits, F.M. A comparison of CO2 minimum miscibility pressure determinations for Weyburn crude oil. J. Pet. Sci. Eng. 2001, 31, 13–22. [Google Scholar] [CrossRef]
  32. Ayirala, S.C.; Rao, D.N. Comparative evaluation of a new gas/oil miscibility-determination technique. J. Can. Pet. Technol. 2011, 50, 71–81. [Google Scholar] [CrossRef]
  33. Zhang, K.; Gu, Y. Two different technical criteria for determining the minimum miscibility pressures (MMPs) from the slim-tube and coreflood tests. Fuel 2015, 161, 146–156. [Google Scholar] [CrossRef]
  34. Ahmad, W.; Vakili-Nezhaad, G.; Al-Bemani, A.S.; Al-Wahaibi, Y. Uniqueness, repeatability analysis and comparative evaluation of experimentally determined MMPs. J. Pet. Sci. Eng. 2016, 147, 218–227. [Google Scholar] [CrossRef]
  35. Vulin, D.; Gaćina, M.; Biličić, V. Slim-tube simulation model for CO2 injection EOR. Rudarsko-Geološko-Naftni Zbornik 2018, 33, 37–49. [Google Scholar] [CrossRef] [Green Version]
  36. Li, Y.K.; Nghiem, L.X. Phase equilibria of oil, gas and water/brine mixtures from a cubic equation of state and Henry’s law. Can. J. Chem. Eng. 1986, 64, 486–496. [Google Scholar] [CrossRef]
  37. Stumm, W.; Morgan, J.J. Aquatic Chemistry: Chemical Equilibria and Rates in Natural Waters; John Wiley & Sons: Hoboken, NJ, USA, 2012; Volume 126. [Google Scholar]
  38. Lake, L.W. Enhanced Oil Recovery; Prentice-Hall: Hoboken, NJ, USA, 1989. [Google Scholar]
  39. Chugh, S.; Baker, R.; Cooper, L.; Spence, S. Simulation of horizontal wells to mitigate miscible solvent gravity override in the Virginia Hills Margin. J. Can. Pet. Technol. 2000, 39, 28–34. [Google Scholar] [CrossRef]
Figure 1. Water alternating gas (WAG) injection period.
Applsci 11 07907 g001
Figure 2. Oil viscosity distribution when 0.22 PV of gas is injected: (a) Case 1, (b) Case 2.
Applsci 11 07907 g002
Figure 3. Interfacial tension between CO2-impure gas and the oil during CO2 and impure CO2 WAG injection.
Applsci 11 07907 g003
Figure 4. Oil density during CO2 and impure CO2 WAG injection.
Applsci 11 07907 g004
Figure 5. Cumulative gas injection during the CO2 and impure CO2 WAG injection under reservoir conditions.
Applsci 11 07907 g005
Figure 6. Cumulative gas production during the CO2 and impure CO2 WAG injection under standard conditions.
Applsci 11 07907 g006
Figure 7. Average reservoir pressure during the CO2 and impure CO2 WAG injection.
Applsci 11 07907 g007
Figure 8. Oil recovery factor during the CO2 and impure CO2 WAG injection.
Applsci 11 07907 g008
Figure 9. Residual CO2 trapped by hysteresis during CO2 and impure CO2 WAG injection.
Applsci 11 07907 g009
Figure 10. Solubility trapped CO2 during CO2 and impure CO2 WAG injection.
Applsci 11 07907 g010
Figure 11. The comparison of trapping index: (a) Case 1, (b) Case 2.
Applsci 11 07907 g011
Table 1. Oil composition and properties for equation of state (EOS) calculations.
ComponentCompositionCritical Pressure (kPa)Critical Temperature (K)Molecular Weight (g/gmol)Acentric FactorParachor
N20.02073394.4126.228.00.0441
CO20.00747376.5304.244.00.2378
H2S0.00128936.9373.234.10.180
Methane, C10.07494600.2190.616.00.0177
Ethane, C20.04224883.9305.430.10.1108
Propane, C30.07854245.5369.844.10.15150
Butane, C40.06553722.7416.558.10.19186
Pentane, C50.04593379.4464.972.10.24228
C6–90.21563019.6556.3102.50.33297
C10–170.22022017.5692.2184.00.58508
C18–270.10271327.0808.4306.20.89771
C28+0.12521155.1915.55661.11112
Table 2. PVT properties of the reservoir fluid and CO2 mixtures at 140 °F.
Dissolved Gas Mole FractionSaturation Pressure (MPa)GOR
(sm3/m3)
Gas Solubility
(sm3/m3)
FVF (m3/m3)SF (m3/m3)
0.00582.91901.0871.074
0.1584.542231.1431.13
0.4128113941.3081.292
0.4398.41251061.3361.32
0.5219.91581391.4091.392
0.59511.42212021.5461.527
0.64112.62632441.6341.614
0.82619.78758562.6942.668
Table 3. Comparison of the data for Weyburn fluid and the fluid model.
ParametersW3Fluid ModelDifference (%)
Oil density at saturation pressure (kg/m3)806.4805.70.09
Saturation pressure (kPa)492049160.08
Viscosity at saturation pressure (mPa·s)1.761.760.0
Formation volume factor (m3/m3)1.121.1081.07
API (°)3134.48−11.23
MMP with CO2 (kPa)14,19613,9002.09
Table 4. Summary of CO2 impurities from different CO2 capture technologies.
Oxy-Fuel CombustionPre-
Combustion
Post-
Combustion
Raw/
Dehumidified
Double
Flashing
Distillation
CO2 (% v/v)74.8–85.095.84–96.799.3–99.495–9999.6–99.8
O2 (% v/v)3.21–6.01.05–1.20.01–0.400.015–0.0035
N2 (% v/v)5.80–16.61.6–2.030.01–0.20.0195–10.045–0.29
Ar (% v/v)2.3–4.470.4–0.610.01–0.10.0001–0.150.0011–0.021
NOx (ppmv)100–7090–15033–10040020–38.8
SO2 (ppmv)50–8000–450037–50250–67.1
SO3 (ppmv)20 20
H2O (ppmv)100–100000–1000.1–600100–640
CO (ppmv)50 500–20001.2–10
H2S/COS (ppmv) 0.2–34,000
H2 (ppmv) 20–30,000
CH4 (ppmv) 0–112
Table 5. Composition of CO2 impurities from the low purity Oxy-fuel stream.
ComponentsLow Purity Level Oxy-Fuel Stream
CO2 (vol%)85.0
O2 (vol%)4.70
N2 (vol%)5.80
Ar (vol%)4.47
H2O (ppmv)100
NOx (ppmv)100
SO2 (ppmv)50
SO3 (ppmv)20
CO (ppmv)50
Table 6. Classification of cases according to impurities content.
CaseInjection Gas Contents
1100% CO2 + 0% Impurities
275% CO2 + 15% Impurities
Table 7. Reservoir initial and operating conditions.
ParametersValues
Depth (ft)4050
Initial reservoir pressure (psi)4000
Reservoir temperature (°F)145
Permeability in I, J, K-direction (md)50, 50, 5
Porosity (%)0.3
Initial oil saturation (%)0.7
Initial water saturation (%)0.3
Producing bottom hole pressure (psi)2000
Table 8. Minimum miscibility pressures (MMPs) calculation using the slim-tube method with various CO2 mixtures.
ComponentsMMP (kPa)
CO2 100%13,900
CO2 90% + CH4 10%18,616
CO2 90% + H2 10%16,079
CO2 90% + N2 10%18,933
CO2 90% + O2 10%14,555
CO2 90% + Ar 10%18,650
CO2 90% + H2S 10%12,714
Table 9. Minimum miscibility pressures (MMPs) calculated using the slim-tube method with pure and impure CO2 mixtures.
Case 1Case 2
Minimum Miscibility Pressure (kPa)13,90019,927
Density (kg/m3)689552
Viscosity (mPa·s)0.07020.0493
Table 10. Viscous gravity numbers of Cases 1 and 2.
Model Viscous   Gravity   Number ,   N g v
Case 12.1
Case 25.2
Publisher’s Note: MDPI stays neutral with regard to jurisdictional claims in published maps and institutional affiliations.

