Article

Effects of UV and Heating on the Stability of Fucoxanthin, Total Phlorotannin and Total Antioxidant Capacities in Saccharina japonica Ethanol Extract and Solvent Fractions

1
Test & Analytical Laboratory, Busan Regional Food & Drug Administration, Yeonje-gu, Busan 48750, Korea
2
Institute of Marine Life Sciences, Pukyong National University, 45 Yongso-ro, Nam-gu, Busan 48513, Korea
3
Department of Smart Green Technology Engineering, Pukyong National University, 45 Yongso-ro, Nam-gu, Busan 48513, Korea
4
Food Safety and Processing Research Division, National Institute Fisheries Science, Busan 46083, Korea
*
Author to whom correspondence should be addressed.
Current address: Department of Food Science and Nutrition, Pukyong National University, 45 Yongso-ro, Nam-gu, Busan 48513, Korea.
Appl. Sci. 2021, 11(17), 7831; https://doi.org/10.3390/app11177831
Submission received: 27 July 2021 / Revised: 15 August 2021 / Accepted: 17 August 2021 / Published: 25 August 2021
(This article belongs to the Special Issue Bioactive Compounds in Algae)

Abstract

:
The brown alga Saccharina japonica is widely consumed in Asian countries, and post-harvest drying methods such as sun drying and oven drying are commonly used to extend the shelf life of S. japonica. Thus, the present study analyzed the ethanol extract and organic solvent fractions of S. japonica to examine the effects of UVA and heating on certain bioactive compounds (fucoxanthin, phlorotannin compounds, and total antioxidants) during the drying process. The fucoxanthin contents in the ethanol extract and different solvent fractions significantly decreased in response to UVA. However, fucoxanthin in the ethanol extract and other fractions showed resistance to thermal treatment. It is noteworthy that the total phlorotannin content (TPC) in the ethanol extract and all fractions showed an approximately 2.5-fold increase upon UVA radiation. The TPC also increased in all samples exposed to high temperatures, except for those in the chloroform fraction. The total antioxidant capacity (TAC) also exhibited significant increases in a pattern similar to the TPC. The findings demonstrate that UVA exposure and heating stimulated the degradation of fucoxanthin while it increased the TPC and TAC in the extract and fractions of S. japonica.

1. Introduction

Kelp is a type of large brown seaweed that grows in shallow, nutrient-rich saltwater near coastal fronts. Edible kelp, known as kumbo in Japanese, dasima in Korean, and haidai in Chinese, has a long consumption history in those East Asian countries. It is also gaining global popularity. There are about 30 different species of kelp, among which Saccharina japonica (previously known as Laminaria japonica) is one prominent species that is widely consumed and extensively cultivated in Korea. The production of cultivated S. japonica was over 500,000 tons, and its value was over USD 88 million in 2017 [1]. As dried kelp is generally consumed in South Korea, the drying process is carried out through air drying under natural sunlight after harvesting, followed by heat drying at a high temperature in a drying machine.
Unsaturated fatty acids (e.g., ω-3 and ω-6), bioactive polysaccharides (e.g., alginic acids and fucoidan), polyphenols (e.g., phlorotannins), and carotenoids (e.g., astaxanthin and fucoxanthin) contribute to the nutritional value of kelp [2]. In particular, fucoxanthin is abundant in kelp and exerts various health benefits, including antioxidant, anti-inflammatory, and anti-obesity effects [3,4]. Phenolic compounds derived from kelp also have exhibited potential antioxidant, anti-inflammatory, anti-diabetic, and anti-tumor activities [5,6]. Kelp-derived polyphenols have been explored as a component of functional foods. Kelp accumulates an array of phenolic compounds, among which phlorotannins have been widely investigated [7]. Phlorotannins are oligomers of phloroglucinol and are restricted to brown seaweeds, where they exert functions as primary and secondary metabolites. Aside from fucoxanthin and phenolic compounds, kelp is rich in vitamins, minerals, and trace elements by absorbing the nutrients from its surrounding marine environment [8]. Kelp also contains other antioxidants, such as β-carotene and α-tocopherol [9,10]. Since kelp is exposed to UVA and heat during the drying process, various bioactive components would be affected by those stimuli. Namely, the change in fucoxanthin contents was little known, although the unique allenic bond structure, which is a conjugated carbonyl, 5,6-monoepoxide, and acetyl groups in fucoxanthin make it prone to degradation by heating, exposure to air, and illumination [11,12]. In addition, the total phenolic contents and antioxidants derived from kelp by UVA exposure and thermal treatment need to be examined. This study aims to analyze their changes in S. japonica in response to heat and UVA radiation conditions. In particular, the present study determines the impact of UVA and heat on the different components of kelp during the drying process. Since different solvents for extracting and fractionating are commonly used to crudely separate different bioactive compounds such as fucoxanthin and phenolic compounds from algae, liquid-liquid extraction technology through the immiscibility of different solvents was employed to produce five organic solvent fractions of kelp [13,14,15].

2. Material and Methods

2.1. Chemicals and Reagents

Hexane, chloroform, ethyl acetate, and butanol for the fractions were purchased from Duksan Co. (AnSan, Kyungki, Korea). The standard of fucoxanthin was purchased from Sigma-Aldrich (St. Louis, MO, USA). Acetonitrile, formic acid, Folin–Ciocalteu’s phenol reagent, 2,2′-Azino-bis (3-ethylbenzthiazoline-6-sulfonic acid) diammonum (ABTS), 2,2′-azobis-(2-amidinopropane) HCl (AAPH), ascorbic acid, potassium phosphate monobasic, potassium phosphate dibasic, fluorescein, trolox, sodium acetate, glacial acetic acid, HCl, TPTZ (2,4,6-tri[2-pyridyl]-s-triazine) iron(III) chloride, and FeSO47H2O were purchased from Roche (Roche, Basel, Switzerland).

2.2. Kelp Sample Preparation

Kelp (S. japonica) was cultured in a marine farm in Gijang, Republic of Korea. After harvesting in spring 2019, the kelp was immediately stored in a Styrofoam box without sunlight and frozen at −20 °C until further use. Elena Medina et al. reported that ethanol exhibited higher efficiency at extracting fucoxanthin than chloroform, hexane, and ethyl acetate from Isochrysis galbana, a fucoxanthin-rich marine microalga [16]. Thus, the frozen kelp (2.5 kg) was cut into small pieces (around 5 cm × 10 cm) and then soaked in 50 L of ethanol for 2 days. Sonication was performed for 60 min to facilitate the extraction. After sonication, the ethanol extract was filtered through Whatman #1 filter paper. After repeating the sonication and filtration procedure, ethanol was removed entirely using vacuum evaporation under a 45 °C water bath. For liquid-liquid extraction, 50 g of ethanol extract was dissolved in 1.5 L of distilled water and further fractionated using an equal volume of organic solvents, including hexane, chloroform, ethyl acetate, and butanol. The fractionation was carried out twice, and each fraction layer was evaporated to dryness in a vacuum to yield the hexane, chloroform, ethyl acetate, n-butanol fractions, and aqueous residue. The working concentration (2 mg/mL) was prepared by dissolving all of the fractions in absolute ethanol for preparation and used for further analysis. The 2 mg/mL of dissolved fractions were exposed to UVA radiation (Philips TL 6W) in a UV tank for 1, 3, 6, 12, 18, or 24 h (h) or exposed to high temperatures in a drying oven at 55 °C or 75 °C for 1, 6, 12, 18, 24, or 48 h.

2.3. Analysis of Fucoxanthin

The total fucoxanthin contents were analyzed using UPLC with an Acquity PDA detector and UPLC C18 1.7 µM × 2.1 × 50 mm column (Waters, Milford, MA, USA). The column temperature was set to 35 °C, and the mobile phases used were distilled water with 0.1% formic acid (Solvent A) and HPLC grade acetonitrile with 0.1% formic acid (Solvent B). The gradient of the mobile phase used was as follows (Solvent A: Solvent B): 0 min (90:10), 1 min (90:10), 2 min (70:30), 4 min (50:50). 6 min (30:70), 7 min (10:90), 9 min (0:100), and 10 min (90:10). The flow rate was 0.4 mL/min, and the injection volume was 4 µL. Fucoxanthin was detected at 450 nm. The total fucoxanthin contents in the kelp were measured by a standard curve and expressed as mg/g dry weight (dw). The limit of detection (LOD) and limit of quantification (LOQ) were calculated as 3 × standard deviation (SD)/slope of the standard curve and 10 × SD/slope of the standard curve, respectively.

2.4. Total Phlorotannin Contents

The total phlorotannin contents (TPC) of the kelp extracts were measured by a colorimetric assay using Folin–Ciocalteu’s phenol reagents. Ten microliters of the samples were mixed with 130 µL of distilled water in a 96-well microplate. Subsequently, 10 μL of Folin–Ciocalteu’s phenol reagents were added to react for 6 min at room temperature. After that, 100 μL of a 7% Na2CO3 solution was added, and the absorbance at 750 nm after 90 min at room temperature was measured. The total phlorotannin content was expressed in milligrams of the phloroglucinol equivalent (PGE)/g dw.

2.5. ABTS Assay

An ABTS radical scavenging assay was performed to analyze the total antioxidant capacity (TAC) of the kelp extracts. For the ABTS reagent, 1.0 mM of AAPH and 2.5 mM ABTS were dissolved in phosphate-buffered saline (PBS). The ABTS reagent was heated to generate ABTS radicals in a water bath (80 °C) for 40 min, and the reagent was agitated every 10 min. After the ABTS radical was made, the radical solution was filtered using a 0.45-µM PVDF syringe filter. Ten microliters of properly diluted kelp samples were added to 245 µL of the prepared stable oxidized free radical solution. After reacting, the mixture was incubated at 37 °C for 10 min. The antioxidant capacities was determined as the difference between the absorbance of samples and reference at 734 nm and the TAC was expressed in milligrams of vitamin C equivalent/g dw.

2.6. FRAP Assay

A FRAP assay was measured according to the little modified method described by Benze and Strain [17]. A FRAP reagent was prepared with acetate (300 mM, pH 3.6), 10 mM TPTZ, a 20-mM FeCl3 solution, and distilled water in a 10:1:1:1.2 ratio. After mixing the solution, it was kept at 37 °C before use. Ten microliters of a properly diluted kelp solution using PBS were combined with 250 µL of FRAP reagent and reacted at 37 °C for 4 min. After reacting, the absorbance was measured at 593 nm. The standard curve was prepared using ferrous sulfate as a standard material, and the reducing power of the kelp samples were expressed as mM FeSO4 equivalent/g dw.

2.7. Statistical Analysis

All experiments were carried out in triplicate and expressed as the mean ± SD. Statistical analysis was performed using a one-way ANOVA and Tukey’s post hoc test (p < 0.05) using Graphpad Prism 5.0 (Graphpad Software, San Diego, CA, USA). The correlation between the fucoxanthin contents, TPC, and TAC was tested through Pearson correlation analysis.

3. Results and Discussion

3.1. Extraction and Fraction Yield

The ethanol extract of S. japonica (2.5 kg wet weight) yielded 88.37 g of crude extract (3.58% yield), among which 50 g was used for fractionation. The aqueous fraction showed the highest yield (73.78%), followed by the hexane fraction (14.39%), butanol fraction (8.62%), chloroform fraction (1.23%), and ethyl acetate fraction (0.32%) (Table 1). The high solid yield from the aqueous fraction can be explained by the large quantity of sugar, protein, glycosides, organic acid, tannins, salts, and mucus contained in kelp [18]. Phenolic compounds and carotenoids have a high solubility in non-polar solvents due to their low polarity. Although the butanol and aqueous fractions showed overall high yields, the total phenolic contents and fucoxanthin contents were not detectable in these two fractions. Therefore, these two fractions were excluded from further analysis.

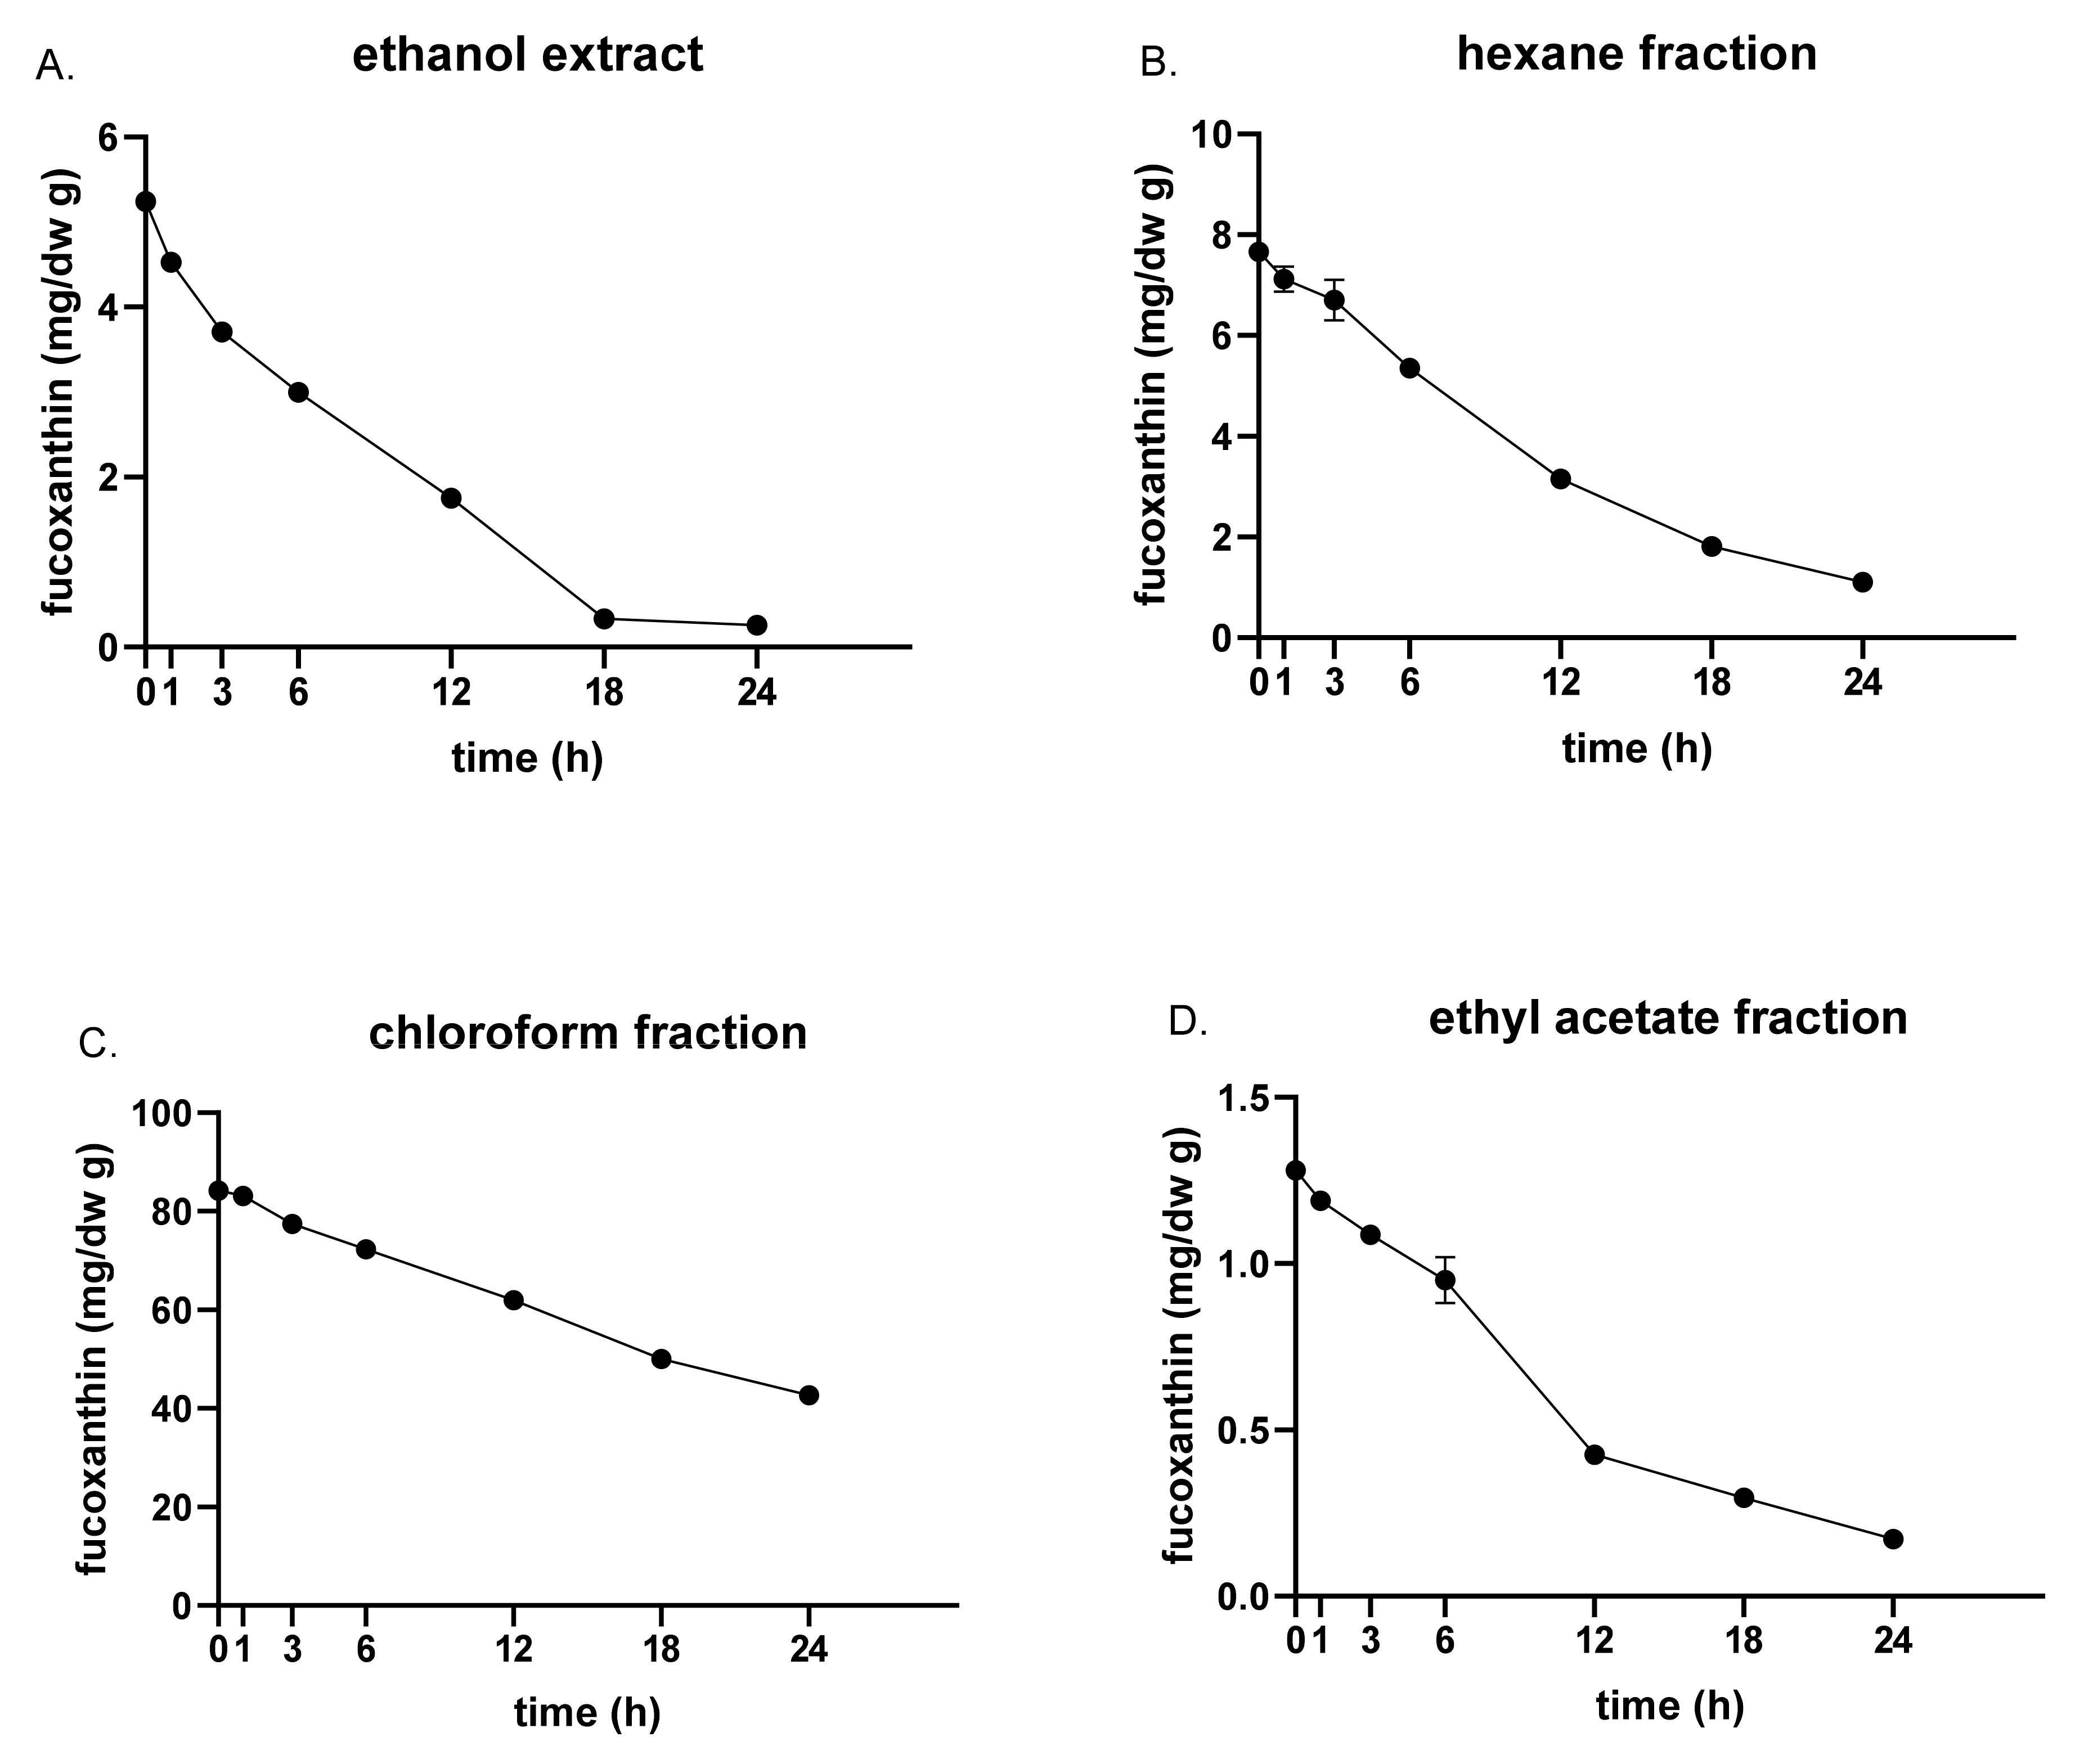
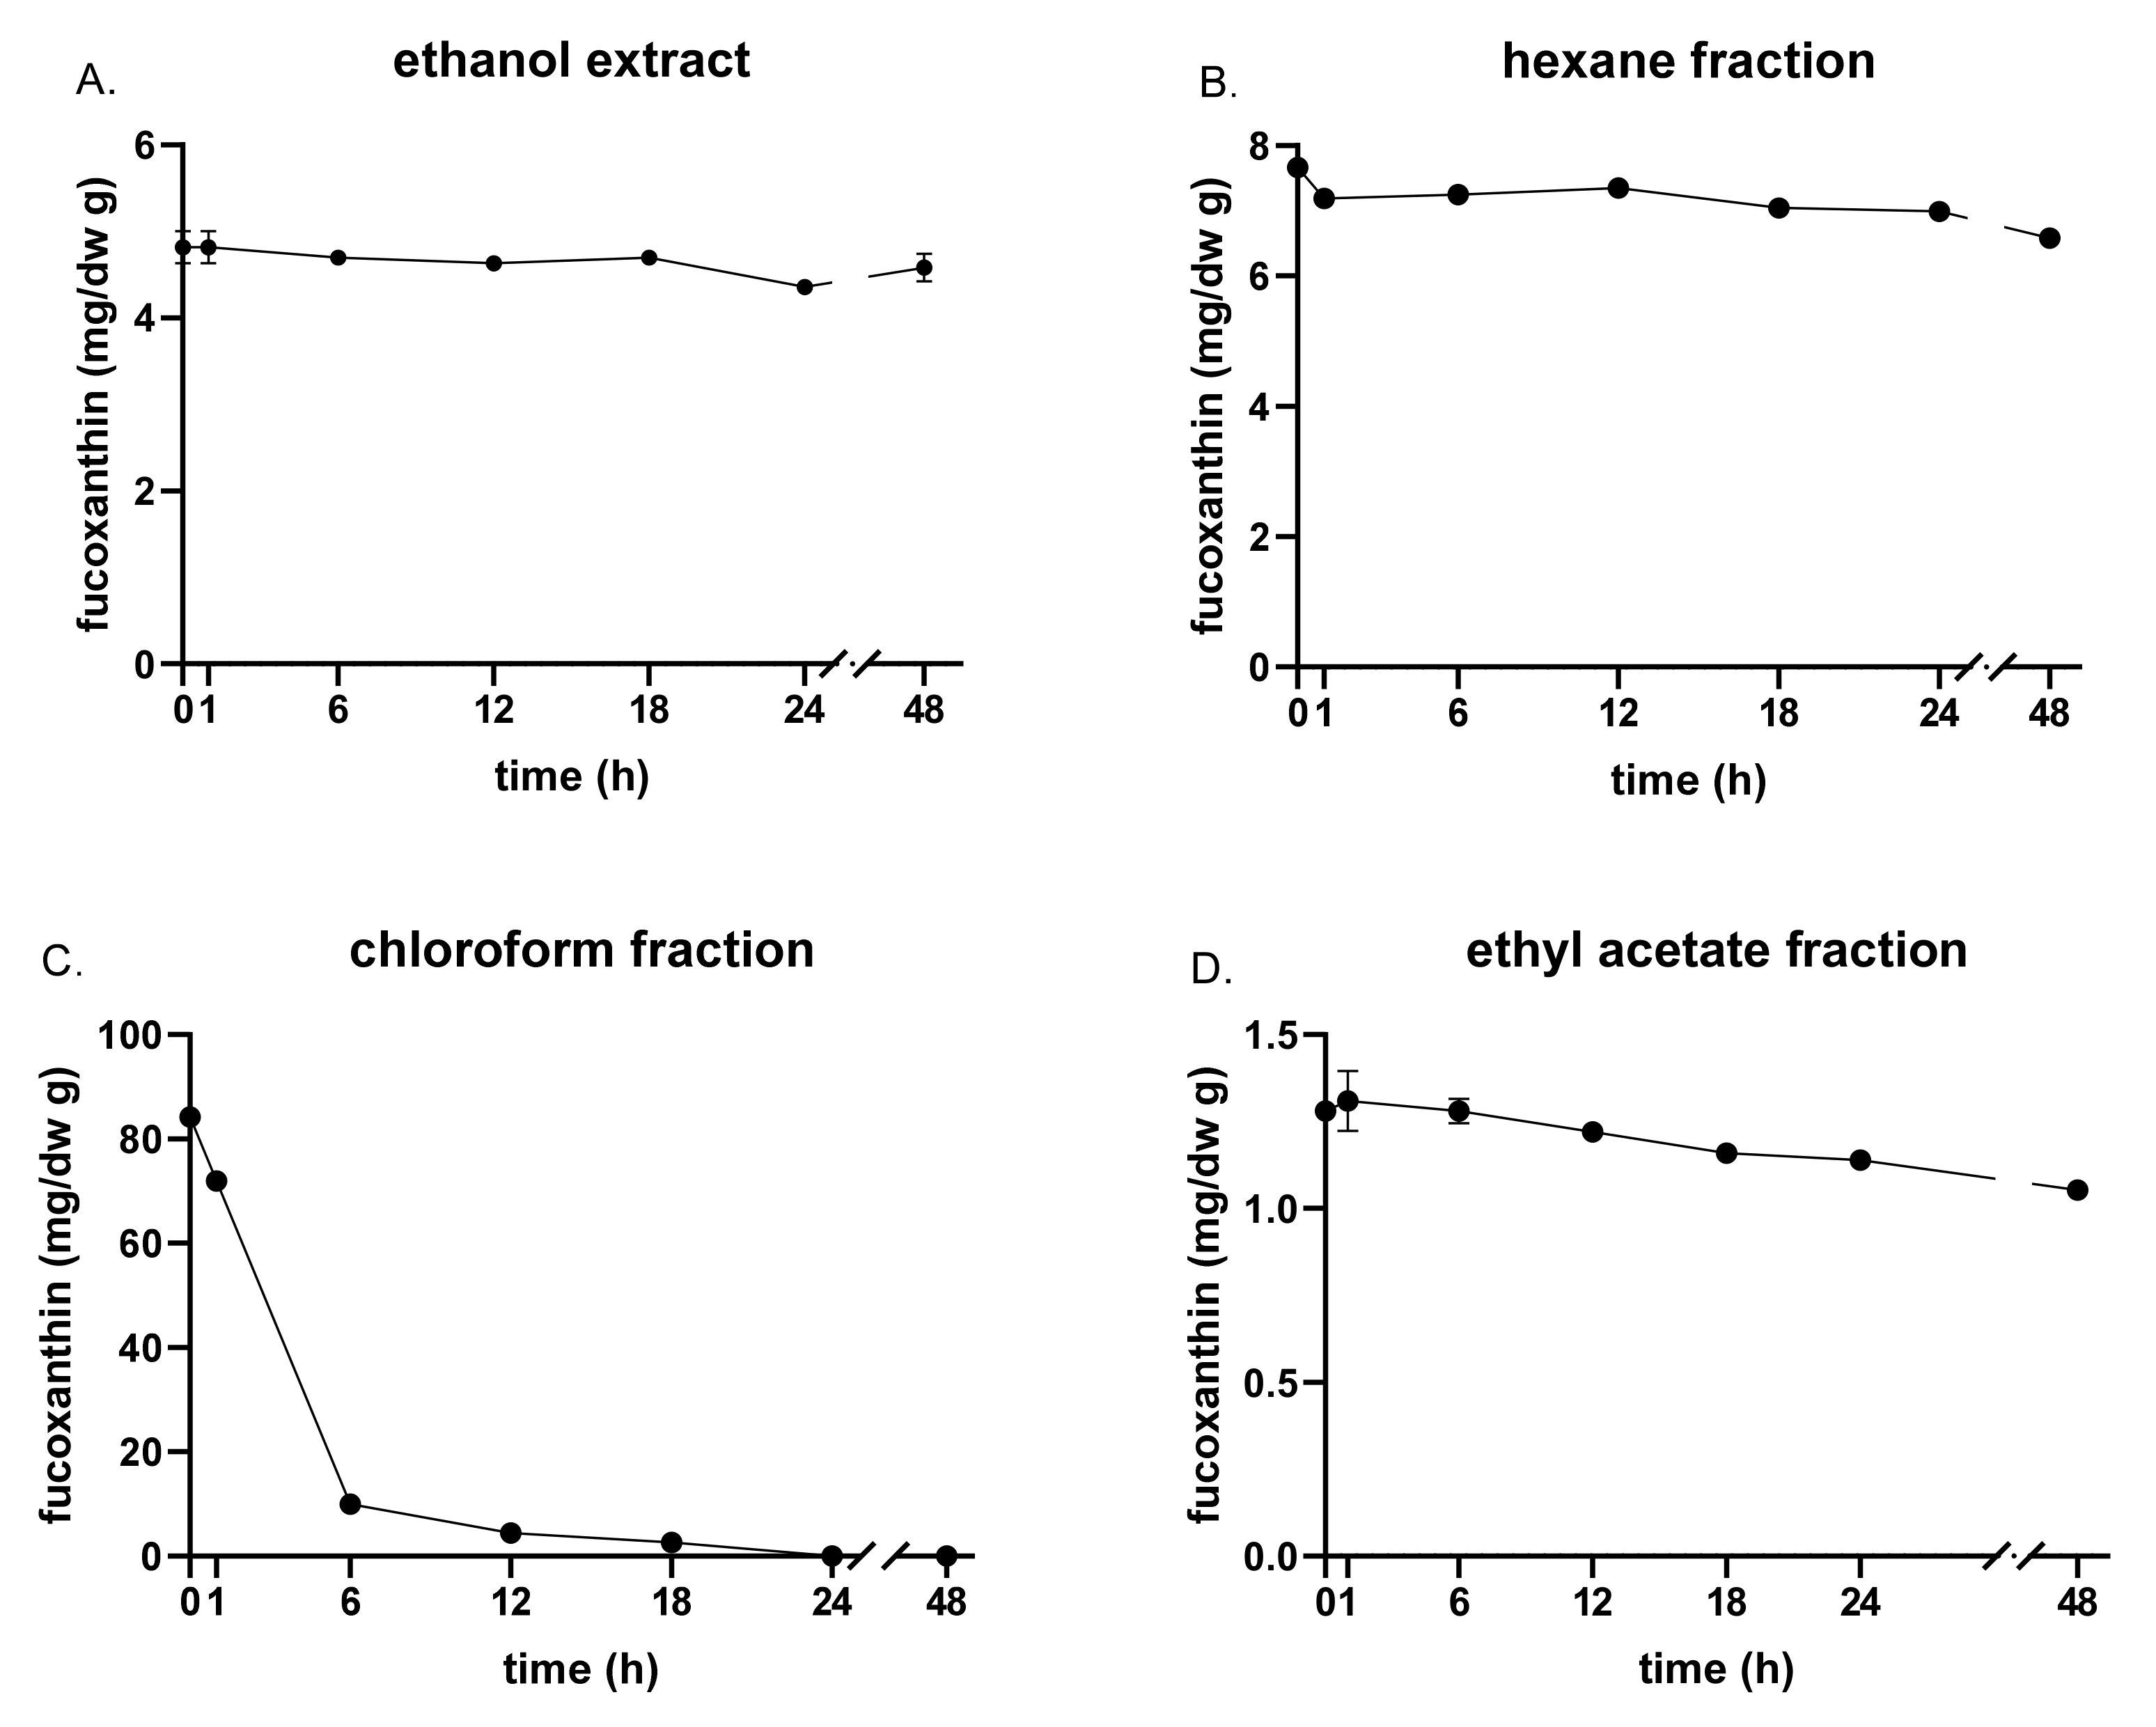
3.2. Fucoxanthin Content and Stability by UVA and Heat Exposure

The fucoxanthin contents in the ethanol extract and solvent-partitioned fractions were determined using UPLC with a PDA detector at 450 nm (Figure 1). The limit of detection and the limit of quantification of fucoxanthin were 0.004 and 0.013 ug/L, respectively. One prominent peak with a retention time of 7.17 min was temporarily identified as all-trans-fucoxanthin by comparison with the fucoxanthin standard. The relative abundances of all-trans-fucoxanthin in the ethanol extract, hexane, chloroform, and ethyl acetate fractions were 5.52 ± 0.02, 7.66 ± 0.02, 84.24 ± 0.11, and 1.28 ± 0.02 mg/g, respectively (Table 1). Noteworthy in our study is that the liquid-liquid extraction methodology intensely concentrated fucoxanthin in the chloroform fraction. Fucoxanthin has a highly unsaturated structure, including an allenic bond, 5,6-monoepoxide, and nine conjugated doubled bonds, which can be easily degraded via oxidation and isomerization in the presence of heat, air, light, strong acids and bases, and other pro-oxidant molecules [19,20]. During the kelp drying process, drying at a high temperature after air drying is usually conducted to reduce processing costs [21].
Consistent with previous studies [20,22], our findings also showed that the fucoxanthin in S. japonica was unstable to UV and heat. However, the different degradation patterns of fucoxanthin in response to UVA radiation and heat suggested that the degradation mechanisms induced by UVA and heat may be distinct. As shown in Figure 2, during the 24-h UVA treatment course, fucoxanthin gradually degraded in the ethanol extract and all solvent fractions. The degradation pace of fucoxanthin in the chloroform fraction was slower than other fractions, depending on different coexisting compounds in different fractions. Several groups studied the protective effect of fucoxanthin against UVA-induced cellular photoaging. It was reported that specific components, such as maltodextrin, gum arabic, and whey protein isolates, could improve the thermal stability of encapsulated fucoxanthin [23]. Anna et al. also reported that fucoxanthin from Undaria pinnatifida, another kelp species, extracted by different extraction methods showed a different photosensitivity [22].
Thermal treatment showed a different degradation pattern. When heated at 55 °C and 75 °C (Figure 3 and Figure 4), the fucoxanthin content in the ethanol extract and hexane fraction decreased slightly and reached a plateau after 1 h, while the fucoxanthin in the chloroform fraction showed rapid degradation. In addition, the degradation pattern of the fucoxanthin in the ethanol extract and solvent fractions did not show a significant difference when heated at 55 °C and 75 °C, except for the chloroform fraction. The degradation of fucoxanthin was much more acute at 75 °C than at 55 °C. The thermal dynamics of fucoxanthin showed different patterns from different studies. Some showed rapid degradation after a few hours of thermal treatment, and some showed slight degradation even after more prolonged exposure [19,21,24]. Given the different sources of fucoxanthin and other solvents used in the preparations, different coexisting compounds present in the samples may play a critical role in the different degradation dynamics. In our study, the degradation of fucoxanthin in the ethanol extract and hexane fraction at 55 °C and 75 °C was gradual and reached plateau levels, whereas a much more rapid degradation of fucoxanthin was observed in the chloroform fraction. These findings suggested that certain compounds in the ethanol extract or fractions might discourage or promote the degradation of fucoxanthin.
To the best of our knowledge, the effect of UVA, the major UV light in our daily life, on the stability of fucoxanthin had not been studied. Our study found that all-trans-fucoxanthin was unstable upon UVA exposure, and its stability was affected by the compounds being presented together. The absorbance of UVA by fucoxanthin suggests the potential in fucoxanthin for depigmentation.

3.3. Change of Total Phlorotannin Contents through UVA and Heat Exposure

In Table 2, among the extract and three solvent fractions, the chloroform fraction showed the highest TPC (59.42 ± 2.25 PGE/g dw), followed by the ethyl acetate fraction (20.188 ± 1.07), hexane fraction (11.30 ± 1.20), and ethanol extract (5.05 ± 0.24). Despite a tenfold difference in TPC levels at the beginning of the treatment, one-hour exposure to UVA increased the TPC levels in the ethanol extract and three fractions in a similar proportion (235–255%). In addition, more prolonged UVA exposure did not further alter the TPC levels. A notable increase in the TPC in response to high temperatures was also observed in the ethanol extract, hexane fraction, and ethyl acetate fraction, but not the chloroform fraction (Table 2). In addition, thermal treatment at 75 °C increased the TPC in the ethanol extract and hexane fraction at temperatures higher than at 55 °C.
Contrary to UVA-induced TPC elevation, the increase in the TPC upon thermal treatment occurred in a solvent-dependent and time-dependent manner. Polyphenols are synthesized in nature as a response to harmful environmental stimuli such as UV irradiation. Short-term UV-induced biosynthesis of kelp phenolic compounds in various cultured seaweed has been reported [24,25,26]. However, the changes in the TPCs in the extracts upon UV radiation have not been reported. In the current study, we discovered a 2.5-fold increase in the TPCs in the ethanol extract and solvent fractions upon UVA irradiation, indicating that such a change is likely to be an ex vitro chemical reaction independent from the coexisting compounds. To the best of our knowledge, this is the first time such an increase has been reported. The unique structure of phlorotannins, the polyphenol discovered only in brown seaweed, may be critical for such a UVA-induced increase. Phlorotannins, oligomers of phloroglucinol (1,3,5-trihydroxybenzene), have been identified as the predominant phenolic compound in various brown seaweed species [27,28]. The isomerization and monomerization of phlorotannins could cause the increased TPC which was observed. Oxidative reactions could produce a phlorotannin isomer by the structural recombination of molecules, most likely through intra- or intermolecular bonding [29]. Although the different TPCs between different phlorotannin isomers are unclear, polymerized phlorotannins showed lower TPC values than the monomeric unit phloroglucinols under the Folin–Ciocalteu method [30]. The Folin–Ciocalteu method, widely used in phenolic compound studies, including the current study, was designed to measure the total concentration of phenolic hydroxyl groups in the extract and fractions based on an oxidation–reduction reaction [31]. Different phenolic compounds show different reducing powers under such text. Therefore, the changes in the TPC suggested a structure change of the phenolic compounds in our extract and fractions induced by UVA.
When the ethanol extract and solvent fractions were heated at 55 and 75 °C, the TPCs significantly increased, except for in the chloroform fraction. The increased temperature during the extraction process enhanced the recovery of phenolic compounds from kelp [32,33]. However, the aforementioned increase in the TPC may have been caused by the increased solubility of phenolic compounds, since a high temperature promotes the release of bound phenolic compounds from cellular components [34,35]. On the contrary, the increased TPCs in the extraction and fractions in our study suggest that certain chemical reactions catalyzed by high temperatures could increase the phenolic compound activity. Indeed, an unknown peak was found at 330 nm by using UPLC with a PDA detector, and the area of the peak increased with more prolonged thermal treatment (data not shown). However, since the specific composition of the phenolic compounds in S. japonica is unclear, more information is necessary to explain the increase in the TPC after UVA and thermal treatments.

3.4. Change in the Total Antioxidant Capacity through UVA and Heat Exposure

ABTS and FRAP assays were adopted to measure the antioxidant capacities, and the values of the non-treated ethanol extract and solvent fractions are listed in Table 1. The chloroform fraction showed the highest TAC for the ABTS assay (20.43 ± 0.81 mg VCE/g dw), followed by the ethyl acetate fraction (10.75 ± 0.47), hexane fraction (4.19 ± 0.37), and the extract (2.96 ± 0.56). The TAC of the ethanol extract and solvent fractions showed an increase of 1.5–3.2 times after 24 hr of UVA exposure. In addition, the 55 °C treated samples saw significant increases (119.35 ± 0.47–244.95 ± 12.78). When treated at 75 °C, the ethanol extract, hexane, and ethyl acetate fractions showed significantly greater TACs than when treated at 55 °C (Table 3).
Similar to the ABTS assay, the chloroform fraction showed the highest TAC (0.217 ± 0.004 mM FeSO4 equivalent/g), while the extract showed the lowest TAC via the FRAP assay (0.043 ± 0.003). In addition, as shown in Table 4, the increasing trend was shown when under UV and high-temperature conditions. As shown in Table 4, after the UV treatment, the extract, chloroform, and ethyl acetate fractions showed significant increases (115.53–182.94%). In addition, when the high temperature (55 and 75 °C) treatment was applied to each sample, the TACs decreased initially, but trended toward significant increases with time. In our results, the chloroform fraction that was not treated with UV and high temperatures showed the highest antioxidant capacities in the ABTS and FRAP assays. Generally, phenolic compounds and lipophilic compounds, such as vitamin E, and carotenoids can be extracted using non-polar solvents like hexane and chloroform [36]. ABTS and FRAP assays have been widely used to measure the antioxidant capacities in various food. Although the TPC assay is not a method to measure the antioxidant capacities in foods, it is widely used in antioxidant research, as the TAC can be predicted by measuring the amounts of polyphenol compounds in the food. Additionally, various studies showed that the TPC has a strong correlation with ABTS and FRAP assays. Patricia Matanjun et al. reported that eight species of seaweeds showed a positive and significantly high correlation with ABTS and FRAP assays (r = 0.89) as well as the FRAP assay and the TPC (r = 0.96) [37]. In addition, 30 seaweeds, including kelp, showed a strong connection between the phenolic contents and TAC under ABTS (r = 0.94) and FRAP assays. (r = 0.96) [38]. The TPC showed a great correlation with the TAC. As shown in Table 5, the correlation between the TPC and TAC was a high correlation (0.894 < r < 0.899, p < 0.001). Therefore, these results support that the increase in the TAC by UV and high-temperature treatment was due to the increase in phenolic compounds in the extract and each fraction of kelp. Aside from that, correlation with the fucoxanthin contents and TPC showed a strong connection as well (0.834, p < 0.001). As a result of this, we can suggest that the increase of the phenolic contents was due to fucoxanthin degradation.

4. Conclusions

This study demonstrated that the chloroform fraction, derived from the ethanol extract of kelp, had the highest fucoxanthin content, TPC, and TAC, implying that low polarity substances of kelp are the primary phenolic substance and contribute its antioxidant capacity. In addition, we have shown that fucoxanthin is highly sensitive to UV and high temperatures and that the non-polar substance of kelp could protect fucoxanthin from high temperatures. Although the degradation of fucoxanthin was observed, the TPC and TAC significantly increased, and a strong correlation between the TPC and TAC was shown. Therefore, further studies are needed on the phenolic substances that kelp produces under UV radiation and high temperature conditions.

Author Contributions

Conceptualization, S.L. and Y.L.; methodology, S.L. and L.C.; investigation, S.B. and H.L.; resources, S.L. and Y.L.; writing—original draft preparation, S.B. and L.C.; writing—review and editing, S.B. and L.C.; funding acquisition, S.L. and Y.L. All authors have read and agreed to the published version of the manuscript.

Funding

This work was supported by the Future Fisheries Food Research Center of the Ministry of Oceans and Fisheries of the Republic of Korea under grant number 201803932 and the National Institute of Fisheries Science (NIFS) of the Republic of Korea under grant number R2021060.

Institutional Review Board Statement

Not applicable.

Informed Consent Statement

Not applicable.

Data Availability Statement

Not applicable.

Conflicts of Interest

The authors declare no conflict of interest.

References

  1. Hwang, E.K.; Park, C.S. Seaweed cultivation and utilization of Korea. ALGAE 2020, 35, 107–121. [Google Scholar] [CrossRef]
  2. An, S.-R.; Koo, J.-G. Properties of Porphyran and Hemicellulose extracted with Different extract Solutions and Enzymatic Pretreatments from Porphyra. J. FISHRIES Mar. Sci. Educ. 2017, 29, 108–117. [Google Scholar] [CrossRef]
  3. Heo, S.J.; Yoon, W.J.; Kim, K.N.; Ahn, G.N.; Kang, S.M.; Kang, D.H.; Oh, C.; Jung, W.-K.; Jeon, Y.-J. Evaluation of anti-inflammatory effect of fucoxanthin isolated from brown algae in lipopolysaccharide-stimulated RAW 264.7 macrophages. Food Chem. Toxicol. 2010, 48, 2045–2051. [Google Scholar] [CrossRef] [PubMed]
  4. Gammone, M.A.; D’Orazio, N. Anti-Obesity Activity of the Marine Carotenoid Fucoxanthin. Mar. Drugs 2015, 13, 2196–2214. [Google Scholar] [CrossRef]
  5. Thomas, N.V.; Kim, S.-K. Potential pharmacological applications of polyphenolic derivatives from marine brown algae. Environ. Toxicol. Pharmacol. 2011, 32, 325–335. [Google Scholar] [CrossRef]
  6. Murray, M.; Dordevic, A.L.; Ryan, L.; Bonham, M.P. An emerging trend in functional foods for the prevention of cardiovascular disease and diabetes: Marine algal polyphenols. Crit. Rev. Food Sci. Nutr. 2017, 58, 1342–1358. [Google Scholar] [CrossRef]
  7. Cotas, J.; Leandro, A.; Monteiro, P.; Pacheco, D.; Figueirinha, A.; Gonçalves, A.M.M.; Da Silva, G.J.; Pereira, L. Seaweed Phenolics: From Extraction to Applications. Mar. Drugs 2020, 18, 384. [Google Scholar] [CrossRef]
  8. MacArtain, P.; Gill, C.I.; Brooks, M.; Campbell, R.; Rowland, I.R. Nutritional value of edible seaweeds. Nutr. Rev. 2007, 65, 535–543. [Google Scholar] [CrossRef]
  9. Boulom, S.; Robertson, J.; Hamid, N.; Ma, Q.; Lu, J. Seasonal changes in lipid, fatty acid, alpha-tocopherol and phytosterol contents of seaweed, Undaria pinnatifida, in the Marlborough Sounds, New Zealand. Food Chem. 2014, 161, 261–269. [Google Scholar] [CrossRef]
  10. Saini, R.K.; Mahomoodally, M.F.; Sadeer, N.B.; Keum, Y.-S.; Rengasamy, K.R. Characterization of nutritionally important lipophilic constituents from brown kelp Ecklonia radiata (C. Ag.) J. Agardh. Food Chem. 2020, 340, 127897. [Google Scholar] [CrossRef]
  11. Zhang, H.; Tang, Y.; Zhang, Y.; Zhang, S.; Qu, J.; Wang, X.; Kong, R.; Han, C.; Liu, Z. Fucoxanthin: A Promising Medicinal and Nutritional Ingredient. Evid.-Based Complement. Altern. Med. 2015, 2015, 1–10. [Google Scholar] [CrossRef]
  12. Kawee-ai, A.; Kuntiya, A.; Kim, S.M. Anticholinesterase and antioxidant activities of fucoxanthin purified from the mi-croalga Phaeodactylum tricornutum. Nat. Prod. Commun. 2013, 8, 1934578X1300801010. [Google Scholar]
  13. Kim, S.M.; Kang, S.-W.; Kwon, O.-N.; Chung, D.; Pan, C.-H. Fucoxanthin as a major carotenoid in Isochrysis aff. galbana: Characterization of extraction for commercial application. J. Korean Soc. Appl. Biol. Chem. 2012, 55, 477–483. [Google Scholar] [CrossRef]
  14. Airanthi, M.W.-A.; Hosokawa, M.; Miyashita, K. Comparative Antioxidant Activity of Edible Japanese Brown Seaweeds. J. Food Sci. 2010, 76, C104–C111. [Google Scholar] [CrossRef]
  15. Mazzola, P.; Lopes, A.; A Hasmann, F.; Jozala, A.F.; Penna, T.C.; Magalhães, P.D.O.; Rangel-Yagui, C.; Jr, A.P. Liquid–liquid extraction of biomolecules: An overview and update of the main techniques. J. Chem. Technol. Biotechnol. 2008, 83, 143–157. [Google Scholar] [CrossRef]
  16. Medina Perez, E.B. Fucoxanthin from marine microalga Isochrysis galbana: Optimization of extraction methods with organic solvents. Dyna 2019, 86, 174–178. [Google Scholar] [CrossRef] [Green Version]
  17. Benzie, I.; Strain, J. The Ferric Reducing Ability of Plasma (FRAP) as a Measure of “Antioxidant Power”: The FRAP Assay. Anal. Biochem. 1996, 239, 70–76. [Google Scholar] [CrossRef] [Green Version]
  18. Cho, S.-H.; Kang, S.-E.; Cho, J.-Y.; Kim, A.-R.; Park, S.-M.; Hong, Y.-K.; Ahn, D.-H. The Antioxidant Properties of Brown Seaweed (Sargassum siliquastrum) Extracts. J. Med. Food 2007, 10, 479–485. [Google Scholar] [CrossRef]
  19. Nomura, T.; Kikuchi, M.; Kubodera, A.; Kawakami, Y. Proton-donative antioxidant activity of fucoxanthin with 1, 1-diphenyl-2-picrylhydrazyl (DPPH). IUBMB Life 1997, 42, 361–370. [Google Scholar] [CrossRef]
  20. Zhao, D.; Kim, S.-M.; Pan, C.-H.; Chung, D. Effects of heating, aerial exposure and illumination on stability of fucoxanthin in canola oil. Food Chem. 2014, 145, 505–513. [Google Scholar] [CrossRef]
  21. Daood, H.G.; Kapitány, J.; Biacs, P.; Albrecht, K. Drying temperature, endogenous antioxidants and capsaicinoids affect carotenoid stability in paprika (red pepper spice). J. Sci. Food Agric. 2006, 86, 2450–2457. [Google Scholar] [CrossRef]
  22. Piovan, A.; Seraglia, R.; Bresin, B.; Caniato, R.; Filippini, R. Fucoxanthin from Undaria pinnatifida: Photostability and Coextractive Effects. Molecules 2013, 18, 6298–6310. [Google Scholar] [CrossRef] [Green Version]
  23. Sun, X.; Xu, Y.; Zhao, L.; Yan, H.; Wang, S.; Wang, D. The stability and bioaccessibility of fucoxanthin in spray-dried microcapsules based on various biopolymers. RSC Adv. 2018, 8, 35139–35149. [Google Scholar] [CrossRef] [Green Version]
  24. Swanson, A.K.; Druehl, L.D. Induction, exudation and the UV protective role of kelp phlorotannins. Aquat. Bot. 2002, 73, 241–253. [Google Scholar] [CrossRef]
  25. Gómez, I.; Huovinen, P. Induction of Phlorotannins During UV Exposure Mitigates Inhibition of Photosynthesis and DNA Damage in the Kelp Lessonia nigrescens. Photochem. Photobiol. 2010, 86, 1056–1063. [Google Scholar] [CrossRef]
  26. Duval, B.; Shetty, K.; Thomas, W.H. Phenolic compounds and antioxidant properties in the snow alga Chlamydomonas nivalis after exposure to UV light. Environ. Boil. Fishes 1999, 11, 559–566. [Google Scholar] [CrossRef]
  27. Agregán, R.; Munekata, P.E.S.; Franco, D.; Dominguez, R.; Carballo, J.; Lorenzo, J.M. Phenolic compounds from three brown seaweed species using LC-DAD–ESI-MS/MS. Food Res. Int. 2017, 99, 979–985. [Google Scholar] [CrossRef] [PubMed]
  28. Li, Y.-X.; Wijesekara, I.; Kim, S.-K. Phlorotannins as bioactive agents from brown algae. Process. Biochem. 2011, 46, 2219–2224. [Google Scholar] [CrossRef]
  29. Poncet-Legrand, C.; Cabane, B.; Bautista-Ortín, A.-B.; Carrillo, S.; Fulcrand, H.; Pérez, J.; Vernhet, A. Tannin Oxidation: Intra- versus Intermolecular Reactions. Biomacromolecules 2010, 11, 2376–2386. [Google Scholar] [CrossRef]
  30. Kim, H.-J.; Yong, H.I.; Lee, B.W.; Park, S.; Baek, K.H.; Kim, T.H.; Jo, C. Plasma-Polymerized Phlorotannins and Their Enhanced Biological Activities. J. Agric. Food Chem. 2020, 68, 2357–2365. [Google Scholar] [CrossRef]
  31. Ainsworth, E.A.; Gillespie, K.M. Estimation of total phenolic content and other oxidation substrates in plant tissues using Folin–Ciocalteu reagent. Nat. Protoc. 2007, 2, 875–877. [Google Scholar] [CrossRef]
  32. Norra, I.; Aminah, A.; Suri, R.; Arif Zaidi, J. Effect of drying temperature on the content of fucoxanthin, phenolic and antioxidant activity of Malaysian brown seaweed, Sargassum sp. J. Trop. Agric. food Sci. 2017, 45, 25–36. [Google Scholar]
  33. Rajauria, G.; Jaiswal, A.K.; Abu-Ghannam, N.; Gupta, S. Effect of hydrothermal processing on colour, antioxidant and free radical scavenging capacities of edible Irish brown seaweeds. Int. J. Food Sci. Technol. 2010, 45, 2485–2493. [Google Scholar] [CrossRef]
  34. Aguilera, Y.; Rebollo-Hernanz, M.; Cañas, S.; Taladrid, D.; Martín-Cabrejas, M.A. Response surface methodology to optimise the heat-assisted aqueous extraction of phenolic compounds from coffee parchment and their comprehensive analysis. Food Funct. 2019, 10, 4739–4750. [Google Scholar] [CrossRef] [PubMed]
  35. Roselló-Soto, E.; Martí-Quijal, F.J.; Cilla, A.; Munekata, P.E.S.; Lorenzo, J.M.; Remize, F.; Barba, F.J. Influence of Temperature, Solvent and pH on the Selective Extraction of Phenolic Compounds from Tiger Nuts by-Products: Triple-TOF-LC-MS-MS Characterization. Molecules 2019, 24, 797. [Google Scholar] [CrossRef] [PubMed] [Green Version]
  36. Generalic Mekinic, I. Phenolic Content of Brown Algae (Pheophyceae) Species: Extraction, Identification, and Quantification. Biomolecules 2019, 9, 244. [Google Scholar] [CrossRef] [PubMed] [Green Version]
  37. Matanjun, P.; Mohamed, S.; Mustapha, N.M.; Muhammad, K.; Ming, C.H. Antioxidant activities and phenolics content of eight species of seaweeds from north Borneo. Environ. Boil. Fishes 2008, 20, 367–373. [Google Scholar] [CrossRef]
  38. Vo Dinh, T.V.; Saravana, P.S.; Woo, H.C.; Chun, B.S. Ionic liquid-assisted subcritical water enhances the extraction of phenolics from brown seaweed and its antioxidant activity. Sep. Purif. Technol. 2018, 196, 287–299. [Google Scholar] [CrossRef]
Figure 1. Standard curve of fucoxanthin (A), spectrum of fucoxanthin (B), and fucoxanthin structure and chromatogram of the chloroform fraction at 450 nm (C).
Applsci 11 07831 g001
Figure 2. UVA degradation kinetics of fucoxanthin in the (A) ethanol extract, (B) hexane fraction, (C) chloroform fraction, and (D) ethyl acetate fraction.
Applsci 11 07831 g002
Figure 3. The concentration of fucoxanthin in the (A) ethanol extract. (B) hexane fraction, (C) chloroform fraction, and (D) ethyl acetate fraction at 55 °C.
Applsci 11 07831 g003
Figure 4. The concentration of fucoxanthin in the (A) ethanol extract, (B) hexane fraction, (C) chloroform fraction, and (D) ethyl acetate fraction at 75 °C.
Applsci 11 07831 g004
Table 1. Fucoxanthin content, total phlorotannin content, and total antioxidant capacity in crude ethanol extract and fractions 2, 4.
SolventYield (%) 1Fucoxanthin (mg/g)TPC
(mg PGE/g dw)
ABTS
(mg VCE/g dw)
FRAP
(mM FeSO4/g dw)
Ethanol extract 5.25 ± 0.02 c5.05 ± 0.00 d2.96 ± 0.56 c0.04 ± 0.00 d
Hexane fraction14.397.66 ± 0.02 b11.60 ± 0.26 c4.19 ± 0.37 b,c0.10 ± 0.00 b
Chloroform fraction1.2384.24 ± 0.11 a58.85 ± 1.29 a20.43 ± 0.81 a0.22 ± 0.00 a
Ethyl acetate fraction0.321.28 ± 0.02 d20.42 ± 0.92 b10.75 ± 0.47 b0.07 ± 0.00 c
Butanol fraction8.62ND 3NDNDND
Aqueous fraction73.78NDNDNDND
1 Yield of fractions was expressed as % of 50 g crude ethanolic extract. 2 TPC and TAC stand for total phlorotannin content and total antioxidant capacity, respectively. ABTS radical scavenging capacity and ferric-reducing antioxidant power were measured for the analysis of TAC. 3 ND stands for not detected. 4 Different letters a–d in the same column indicate significant differences (p < 0.05).
Table 2. Fold changes in the TPC of the extract and three fractions via UVA or thermal treatments (55 and 75 °C) 1, 2.
Time (h)Ethanol ExtractHexane FractionChloroform FractionEthyl Acetate Fraction
UVA0100.00 b100.00 b100.00 b100.00 b
1234.55 ± 14.41 a255.38 ± 6.17 a237.07 ± 10.82 a254.43 ± 10.32 a
3237.69 ± 10.89 a240.56 ± 12.12 a243.47 ± 13.21 a258.24 ± 10.57 a
6231.40 ± 16.34 a248.64 ± 12.12 a236.01 ± 7.25 a262.05 ± 14.29 a
12234.55 ± 23.74 a244.60 ± 7.00 a235.47 ± 2.88 a265.10 ± 5.28 a
18243.98 ± 14.41 a240.56 ± 14.57 a233.87 ± 12.31 a262.82 ± 10.81 a
24234.55 ± 14.41 a243.25 ± 20.74 a235.74 ± 12.65 a268.15 ± 7.35 s
55 °C0100.00 f100.00 d100.00 c100.00 c
1109.63 ± 7.15 e,f111.18 ± 2.74 c,d107.4 ± 0.20 a,b113.15 ± 3.28 b,c
6128.89 ± 6.30 c,d120.75 ± 3.74 b,c109.41 ± 0.41 a116.55 ± 9.14 b,c
12117.88 ± 4.13 d,e121.35 ± 7.18 b,c104.45 ± 1.75 a,b,c119.27 ± 1.56 a,b
18139.89 ± 6.30 b,c128.54 ± 3.11 b102.09 ± 1.67 b,c121.99 ± 3.06 a,b
24144.02 ± 4.76 b130.93 ± 6.31 b100.67 ± 3.19 c119.61 ± 5.89 a,b
48203.16 ± 4.76 a163.26 ± 3.74 a101.73 ± 3.48 c131.86 ± 5.80 a
75 °C0100.00 d100.00 g100.00 b100.00 d
196.56 ± 4.76 d110.94 ± 5.49 f110.46 ± 2.99 a114.37 ± 2.04 c
6118.11 ± 2.10 d124.71 ± 1.04 e97.31 ± 2.66 b,c118.12 ± 2.12 c
12142.41 ± 6.35 c136.08 ± 4.52 d95.19 ± 0.84 b,c119.82 ± 3.12 c
18156.63 ± 13.91 c147.46 ± 0.00 c96.17 ± 1.79 c120.16 ± 4.25 b,c
24184.59 ± 4.13 b158.83 ± 4.52 b94.05 ± 2.15 c129.00 ± 5.62 a,b
48228.15 ± 15.82 a175.59 ± 5.18 a94.12 ± 0.79 c133.42 ± 2.36 a
1 TPC stands for total phlorotannin content. 2 Data are presented as mean ± SD, and different letters a–g in the same column indicate a significant difference (p < 0.05).
Table 3. TAC by an ABTS assay for the extract and three different solvent fractions treated with UVA and thermal treatments 1, 2.
Time (h)Ethanol ExtractHexane FractionChloroform FractionEthyl Acetate Fraction
UVA0100.00 c100.00 d100.00 e100.00 b
1184.36 ± 16.59 a,b225.67 ± 10.07 c109.79 ± 2.26 d,e171.18 ± 7.97 a
3166.78 ± 3.30 b241.18 ± 6.72 b119.34 ± 7.95 c,d161.73 ± 8.18 a,b
6190.95 ± 16.59 a,b246.99 ± 14.64 b124.72 ± 3.88 c,d172.69 ± 8.51 a
12195.34 ± 6.86 a,b275.10 ± 14.54 b,c130.29 ± 5.98 b,c165.89 ± 3.65 a
18201.93 ± 13.72 a315.82 ± 17.69 a138.25 ± 5.10 a,b178.36 ± 5.71 a
24200.83 ± 3.81 a320.66 ± 14.35 a149.59 ± 2.60 a179.88 ± 4.94 a
55 °C0100.00 d100.00 f100.00 c100.00 e
193.57 ± 11.79 d107.18 ± 3.97 e,f113.1 ± 2.86 a,b108.45 ± 0.00 f
6124.45 ± 5.90 c,d128.37 ± 12.14 d,e108.47 ± 5.88 a,b106.9 ± 4.65 e,f
12130.89 ± 7.73 c148.24 ± 9.18 c,d108.74 ± 2.62 b117.23 ± 2.37 d
18157.91 ± 23.49 b,c157.52 ± 4.59 b,c108.74 ± 1.70 b119.30 ± 1.55 c,d
24173.36 ± 6.68 a,b178.71 ± 6.88 a,b113.64 ± 1.70 a,b127.05 ± 1.55 b
48233.20 ± 24.56 a244.95 ± 12.78 a119.35 ± 0.47 a142.55 ± 3.10 a
75 °C0100.00 f100.00 e100.00 a,b100.00 g
198.71 ± 5.58 f97.90 ± 6.88 f,g93.52 ± 0.00 b,c102.77 ± 4.74 f,g
6174.65 ± 7.80 e141.62 ± 7.95 e91.89 ± 0.82 c112.58 ± 3.10 e
12182.36 ± 11.15 d,e182.69 ± 6.07 d90.53 ± 3.77 c122.92 ± 0.89 d
18220.97 ± 11.14 c219.78 ± 8.27 c92.43 ± 2.05 c131.70 ± 2.37 c
24246.73 ± 0.00 b,c250.25 ± 10.00 b95.42 ± 1.25 b,c142.03 ± 1.55 b
48318.15 ± 18.39 a305.89 ± 12.14 a104.94 ± 1.63 a154.43 ± 1.55 a
1 TAC and ABTS stand for total antioxidant capacity and ABTS radical scavenging capacity, respectively. 2 Data are presented as mean ± SD, and different letters a–g in the same column indicate a significant difference (p < 0.05).
Table 4. TAC via FRAP assay for the extract and three different solvent fractions treated by UV and two temperatures (55 and 75 °C) over time 1, 2.
Time (h)Ethanol
Extract
Hexane
Fraction
Chloroform
Fraction
Ethyl Acetate
Fraction
UVA0100 c100 a100 b100 b
1124.39 ± 4.15 a91.79 ± 2.22 b,c128.17 ± 4.12 a176.64 ± 6.94 a
3127.26 ± 5.49 a88.97 ± 2.04 b,c129.16 ± 4.57 a174.54 ± 4.05 a
6114.57 ± 4.98 a,b86.92 ± 2.70 b,c126.46 ± 1.28 a185.04 ± 10.00 a
12104.75 ± 4.21 b,c85.13 ± 4.28 c123.32 ± 5.10 a185.88 ± 7.60 a
18113.85 ± 5.70 a,b88.46 ± 1.78 b,c119.33 ± 4.71 a182.52 ± 6.67 a
24115.53 ± 6.52 a,b93.59 ± 2.04 a,b122.32 ± 1.73 a182.94 ± 5.09 a
55 °C0100 b,c100 b100 a,b,c100 b,c
184.8 ± 4.69 d72.17 ± 1.70 e88.46 ± 4.91 c92.79 ± 1.67 c
685.71 ± 5.63 c,d80.71 ± 1.70 d,e97.89 ± 4.26 b,c104.33 ± 5.46 b
1297.43 ± 6.25 b,c,d87.01 ± 2.23 c,d105.85 ± 5.62 a,b,c102.88 ± 6.50 b
1892.02 ± 4.13 b,c,d92.95 ± 4.63 b,c97.56 ± 1.29 b,c102.88 ± 2.20 b
24102.85 ± 4.13 b101.11 ± 4.50 b96.59 ± 5.36 b,c107.69 ± 2.20 b
48167.8 ± 7.81 a162.34 ± 6.33 a110.24 ± 3.99 a130.29 ± 2.20 a
75 °C0100 d,e100 d100 a100 c,d
190.04 ± 1.44 e59.18 ± 2.95 g92.69 ± 3.41 a80.77 ± 1.44 e
692.53 ± 16.01 e71.06 ± 3.40 f74.32 ± 3.59 b99.04 ± 6.81 d
12121.58 ± 8.00 c,d86.64 ± 3.40 e75.46 ± 3.42 b105.29 ± 2.88 c,d
18133.2 ± 6.59 c,d116.33 ± 6.13 c68.31 ± 3.68 b112.02 ± 3.33 b,c
24163.07 ± 7.47 b130.8 ± 6.13 b74 ± 7.50 b118.75 ± 3.63 b
48250.21 ± 16.33 a148.98 ± 2.32 a94.31 ± 3.25 a131.25 ± 5.00 a
1 TAC and FRAP stand for total antioxidant capacity and ferric reducing antioxidant power, respectively. 2 Data are presented as the mean ± SD. Groups that do not share a common letter a–g indicate a significant difference (p < 0.05).
Table 5. Pearson correlation between fucoxanthin contents, TPC, and two TAC values 1, 2.
Fucoxanthin
Contents
TPCTAC
(ABTS Assay)
TAC
(FRAP Assay)
Fucoxanthin
contents
10.834
(p < 0.001)
0.691
(p < 0.001)
0.788
(p < 0.001)
TPC 10.894
(p < 0.001)
0.899
(p < 0.001)
TAC
(ABTS assay)
10.926
(p < 0.001)
TAC
(FRAP assay)
1
1 TPC and TAC stand for total phlorotannin content and total antioxidant capacity, respectively. 2 Correlation was analyzed by the Pearson correlation with p < 0.05 post hoc.
Publisher’s Note: MDPI stays neutral with regard to jurisdictional claims in published maps and institutional affiliations.

