Article

Application of an Electrical Low Pressure Impactor (ELPI) for Residual Particle Measurement in an Epitaxial Growth Reactor

1
School of Mechanical Engineering, Sungkyunkwan University, 2066 Seobu-ro, Jangan-gu, Suwon 16419, Korea
2
Particle Technology Laboratory, Mechanical Engineering, University of Minnesota, 111 Church St., S.E., Minneapolis, MN 55455, USA
3
Department of Land, Water and Environmental Research, Korea Institute of Civil Engineering and Building Technology (KICT), Goyang 10223, Korea
4
Convergence Research Center for Energy and Environmental Sciences, Sungkyunkwan University, 2066 Seobu-ro, Jangan-gu, Suwon 16419, Korea
5
SK Siltron Co. Ltd., 53 Imsu-ro, Gyeongsangbuk-do, Gumi 39386, Korea
6
SKKU Advanced Institute of Nanotechnology, Sungkyunkwan University, 2066 Seobu-ro, Jangan-gu, Suwon 16419, Korea
*
Author to whom correspondence should be addressed.
These authors contributed equally to this work.
Appl. Sci. 2021, 11(16), 7680; https://doi.org/10.3390/app11167680
Submission received: 18 June 2021 / Revised: 17 August 2021 / Accepted: 17 August 2021 / Published: 20 August 2021

Abstract

:

Featured Application

The application considered in this study is the real-time monitoring of chamber purge performance after semiconductor processing for preventive maintenance.

Abstract

The purpose of this study was to determine the feasibility of using an electrical low pressure impactor (ELPI) for analyzing residual particles in a Si epitaxial growth process chamber and establish an application technique. Prior to experimental measurements, some preliminary works were conducted, including an inlet improvement of a cascade impactor, vacuum fitting fastening and flow rate adjustment, and a vacuum leak test. After that, residual particles in the process chamber were measured during N2 gas purge using an ELPI due to its advantages including the real-time measurement of particles and the ability to separate and collect particles by their diameters. In addition, ELPI could be used to obtain particle size distribution and see the distribution trend for both number and mass concentration. The results of the real-time analysis of the total particle count revealed that the concentration at the endpoint compared to that at the beginning of the measurement by decreased 36.9%. Scanning electron microscopy/energy-dispersive X-ray spectroscopy (SEM–EDS) analysis of collected particles was performed using two types of substrates: Al foil and a Si wafer. The results showed that most particles were Si particles, while few particles had Si and Cl components. ELPI has the clear advantages of real-time particle concentration measurement and simultaneous collection. Thus, we believe that it can be more actively used for particle measurement and analysis in the semiconductor industry, which has many critical micro/nanoparticle issues.

Graphical Abstract

1. Introduction

Due to recent increase in demand for personal mobile devices, the scale of the semiconductor industry is expanding and competition among related companies is intensifying [1]. Accordingly, highly integrated chip production techniques on large-area wafers are rapidly being developed and applied as methods to increase the yield and profits of semiconductor companies. In the production of such high-performance semiconductor products, since the supply of high-quality silicon wafers is the most important requirement, an increasingly higher-performance wafer manufacturing process is required. For the fabrication of a high-quality wafer, the epitaxial growth process is used, which grows a desired single-crystal thin film on a wafer for application to a device [2]. This process requires a high level of chamber cleanliness because the influx of contaminated particles can interfere with single-crystal growth, leading to defects such as dislocation [3]. For this purpose, it is essential to identify and remove contaminant particles. Prior to that, various in-depth analyses are required through the measurement and collection of particles in the process facility [4].
Research and development of various equipment technologies have been conducted for the purpose of identifying particulate contaminants in semiconductor process facilities [5,6]. However, due to extreme process characteristics, such as a high temperature and high vacuum environment and the use of corrosive and explosive gases, the actual implementation and application of real-time measurement and collection of particulate contaminants is difficult [7]. Currently, the best method is to collect and analyze particles detected on the substrate after the process or through the detection of particles remaining on the inner wall of the chamber by costly and inefficient dismantling of equipment [8]. Therefore, we attempted to introduce new measurement equipment based on the aerosol engineering principle not yet used for particle measurement or collection in semiconductor facilities. Another purpose of this study was to establish a corresponding method of application.
A scanning mobility particle sizer (SMPS) classifies particles based on their electrical mobility and optically measures their numbers. It is a representative measurement device used for the measurement of particulate pollutants in the atmosphere [9,10,11,12,13,14]. According to its operational principles, it has the advantage of obtaining an accurate particle size distribution (PSD). However, it is not possible to obtain PSD in every second because it has time resolution of 1–2 min for each scan/each measurement. For a PSD measurement at every second, a fast mobility particle sizer (FMPS) has been developed that can simultaneously measure the number of all particles using multiple electrometers [15]. However, since SMPS has been used and studied for a longer period of time with high reliability of measurement results, it is used more frequently even now [16]. Although these electromobility-based particle measuring instruments can measure particles with a size of at least several nm, they cannot measure particles of micron size due to their upper detection limits of several hundred nm. Using a different principle, an aerodynamic particle sizer (APS) and an electrical low pressure impactor (ELPI) that can measure PSD based on aerodynamic diameters of particles [17,18] are also widely used. Of these two, ELPI has the advantage of categorizing particles by size based on the multistage impactor principle, thus enabling real-time PSD measurement. It also has a wide measurement range from several nm to several µm particles. In addition, it can facilitate additional analysis after collecting particles by size. Another excellent feature of ELPI is its robustness, which makes it easier to use when collecting samples in very dusty atmospheres, which is not possible with either FMPS or SMPS [19]. Due to this advantage, ELPI has typically been used to analyze atmospheric particulate contaminants in a living environment [20,21,22]. The application of ELPI has been expanded to the analysis of generated particles and the evaluation of cleanliness in various industrial environments [23,24], and various experiments in the laboratory [25,26]. Despite these advantages, no study has reported the use of ELPI in the semiconductor industry where measurement and control of particles are important because this industry has more micro/nanoparticle issues than any other industry.
Based on these aforementioned advantages, the objective of this study was to determine whether ELPI could be used for particle analysis in a Si epitaxial growth process equipment for concentration measurement. Additional analysis was performed after collection of particles to establish and present its utilization.

2. Materials and Methods

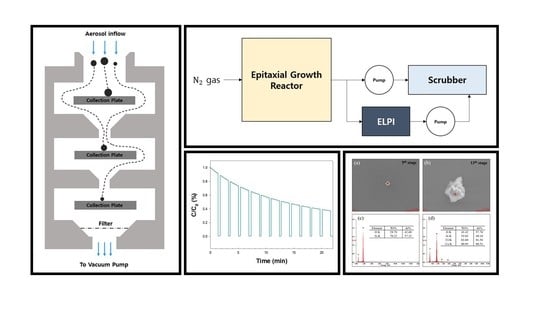
2.1. Test Process Equipment and Experimental Setup

This study used a 300 mm ATM Si Epi-reactor of Applied Materials, Inc., of SK Siltron’s silicon wafer manufacturing line located in Gumi, Gyeongsangbuk-do. Chemical reaction of the Si epitaxy process for production of single-crystal thin film on a wafer is shown as follows:
SiHCl 3 ( gas ) + H 2 ( gas ) Si ( solid ) + 3 HCl ( gas )
Figure 1 shows the setup schematic of residual particle measurement during N2 gas purge. The exhaust of the scrubber in the process chamber was used as the particle sampling port. Due to extreme conditions of the in-process environment using toxic, ignitable, and high-temperature gas, there were difficulties in real-time measurement during the process. Therefore, residual particles were measured and collected for further analysis during chamber inactivation and N2 gas purge before preventive maintenance. The purge flowrate of the N2 gas inside the chamber was 25 LPM. The purge was performed every 1 min and 30 s at 20 s intervals. When using the ELPI, the flowrate incoming to the inlet of the cascade impactor should be fixed to be around 10 LPM for correct measurement and collection after separating particles by their sizes. The flowrate adjustment was performed using an orifice gasket for a 10 LPM flow when fastening the VCR fitting connection between the chamber exhaust and the ELPI inlet. When using an orifice, particles may inertially collide with the front surface, resulting in particle loss. Although this could not be prevented, all measurements were carried out by checking that the sampling was conducted under constant velocity conditions.

2.2. Instrument for Concentration Measurement of Particles in the Process Chamber: Electrical Low Pressure Impactor (ELPI)

Measurements of number concentration and mass concentration by particle size were carried out using an ELPI+ (Dekati Ltd., Tampere, Finland). The instrument is capable of real-time measurement of aerosol-phase particles with particle sizes of about 5 nm to 10 µm [27]. Figure 2 shows a schematic and cut-off diameters (D50%) of the cascade impactor employed in ELPI. D50% was the collection efficiency of an impactor, meaning a particle diameter that resulted in 50% collection efficiency.
Detailed principles of measurement and collection are as follows. First, particles introduced to the inlet were charged with a large number of cations generated in the corona glow region when high voltage was applied to the needle in the middle. These charged particles were then categorized and collected in 15 stages depending on the aerodynamic diameter. The topmost stage, with a D50% value of 10 µm, simply acted as a pre-separator to prevent inflow of large particles. At this time, the generated current at the substrate was measured through electrodes connected to the impactor. The current value was then converted into a number concentration through formulas [28,29]. If the principal component of the incoming particle is known, the number concentration can be converted to a mass concentration by entering the density value into the own program for data processing.
Even within a clean room, the leakage of particles from the chamber and instrument to the outside might affect the human body during measurement. Thus, prior to particle measurement in the epitaxial growth chamber, the ELPI was improved to check and prevent gas leakage to the outside during measurement. First, the inlet of the impactor was improved to use international organization for standardization (ISO) quick flanges (aka QF, KF, or NW) for vacuum fitting fastening. It was then confirmed that there was no gas leakage factor between the equipment and the outside using Heliot 900 model (ULVAC, Kanagawa, Japan), a pressurization-type vacuum leak tester. After that, the measurement of particles in the epitaxial growth chamber was conducted for about 22 min and averaged.

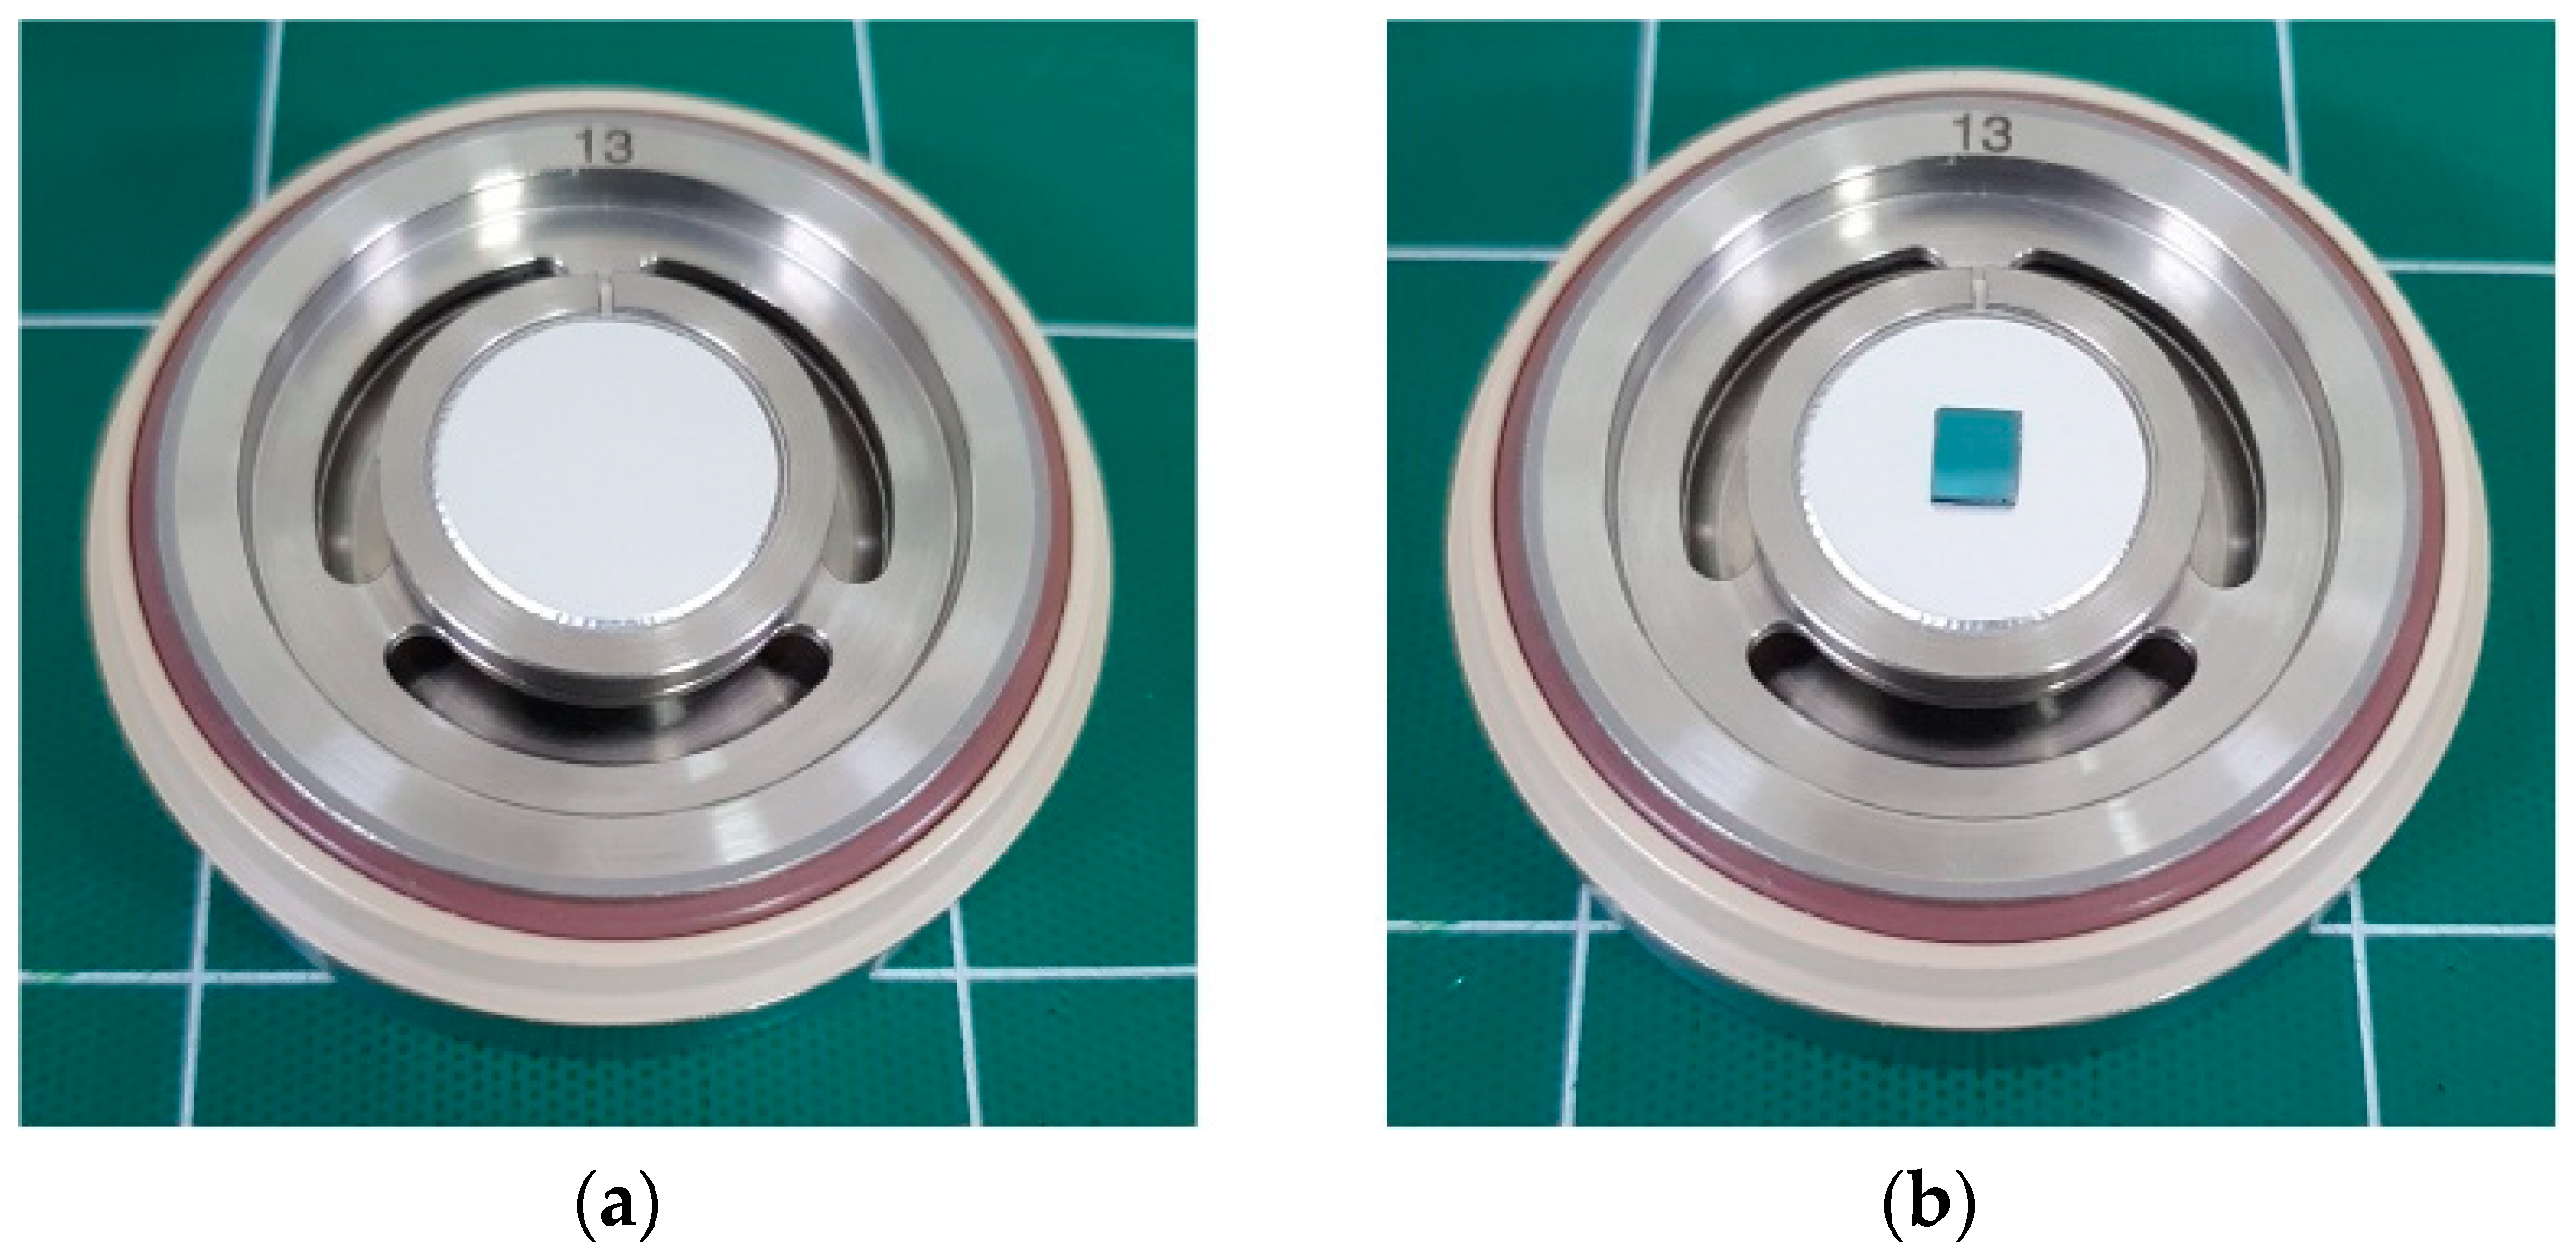
2.3. Additional Analysis after Collecting Particles from the Epitaxial Chamber

The collection of particles was carried out using the cascade impactor in the ELPI as described above at the same time as the measurement. Particles were separated by their sizes and collected on each plate of the cascade impactor. Aluminum foil is generally used as a particle collection substrate with an ELPI. However, varied types of substrates can be used to ease additional analysis, distinguishing them from surface shapes and components of the substrate for a more diverse and discriminative analysis of collected particles [30,31]. As shown in Figure 3, a 10 × 10 mm2 coupon Si wafer was used as the collection substrate in addition to aluminum foil, the typical substrate of ELPI. If sizes of incoming particles were too large for each stage, or if the incoming velocity was too high, particle bouncing could occur. When bouncing occurs, recoiled particles can flow into a lower stage and become deposited and unmeasured. By applying grease on the surface of the substrate, this bouncing phenomenon can be somewhat prevented [19,32,33]. Thus, grease was applied to the surface using a vacuum chamber cleaning wiper. It was then wiped off with another clean wiper to leave a thin layer. The collection of particles in the epitaxial growth chamber was carried out for about one hour during and after the measurement to improve the ease of detection of particles on the substrate during further analysis.
Energy dispersive spectroscopy (EDS) and mounted scanning electron microscopy (SEM) (JSM 7600F, JEOL, Akishima, Japan), (Quanta Inspect F; FEI Co., Hillsboro, OR, USA) analyses were performed to check compositions, particle sizes, and shape of particles collected from the chamber.

3. Results and Discussion

3.1. Number and Mass Concentration

Figure 4 is a graph showing the ratio of the total number of particles by averaging measurement results of residual particles in the epitaxial growth chamber after the epitaxial process. First, looking at the number concentration measurement results in (a), about 86% of particles were measured in the first stage and 11% of particles were measured in the second stage. The total amount of particles measured in these two stages was 97%, confirming that most particles had a size of less than 20 nm. Looking at the mass concentration measurement results in (b), the percentage of detected particles was found to be 79% at the 15th stage and 14% at the 14th stage. Thus, a total of 93% of particles were detected at these two stages. Contrary to the number concentration measurement results, the number of detected particles was mainly measured at top stages, where micrometer-sized particles were mainly collected. The reason is that the cascade impactor uses an aerodynamic diameter, which detects a virtual spherical particle having the same sedimentation rate and unit density when separating each particle size and the volume of the sphere has a cubic value of the radius. Thus, the difference according to particle size significantly changed. This is a natural phenomenon. It is a limitation of mass-based particle measurement techniques. Therefore, for the accurate analysis of nano-sized particles, techniques for measuring number concentration are required.
Figure 5 shows the particle number concentration graph by time. The y-axis is the total number concentration of all stages divided by the initial total concentration. The valleys that occur regularly in the graph correspond to the purge interval. It was confirmed that the number of measured particles gradually decreased with the passage of time for about 22 min, during which the measurement was possible. At the end of the measurement, the particle number concentration decreased to 36.9% of the initial measurement value. The measurement results confirmed that the number of residual particles was reduced well by the purging operation in the chamber. The removal from the chamber of particles that can directly adversely affect subsequent process results is essential. In order to confirm that the particle amount was reduced to an appropriate amount and to find an appropriate purge time for cost and time efficiency, such real-time monitoring technique was required. When using an ELPI to measure particle concentration during the purging of the chamber after the process and to confirm that the particle number falls to a certain level before proceeding to the next process, it is important to prevent the effect that residual particles may have on the process.

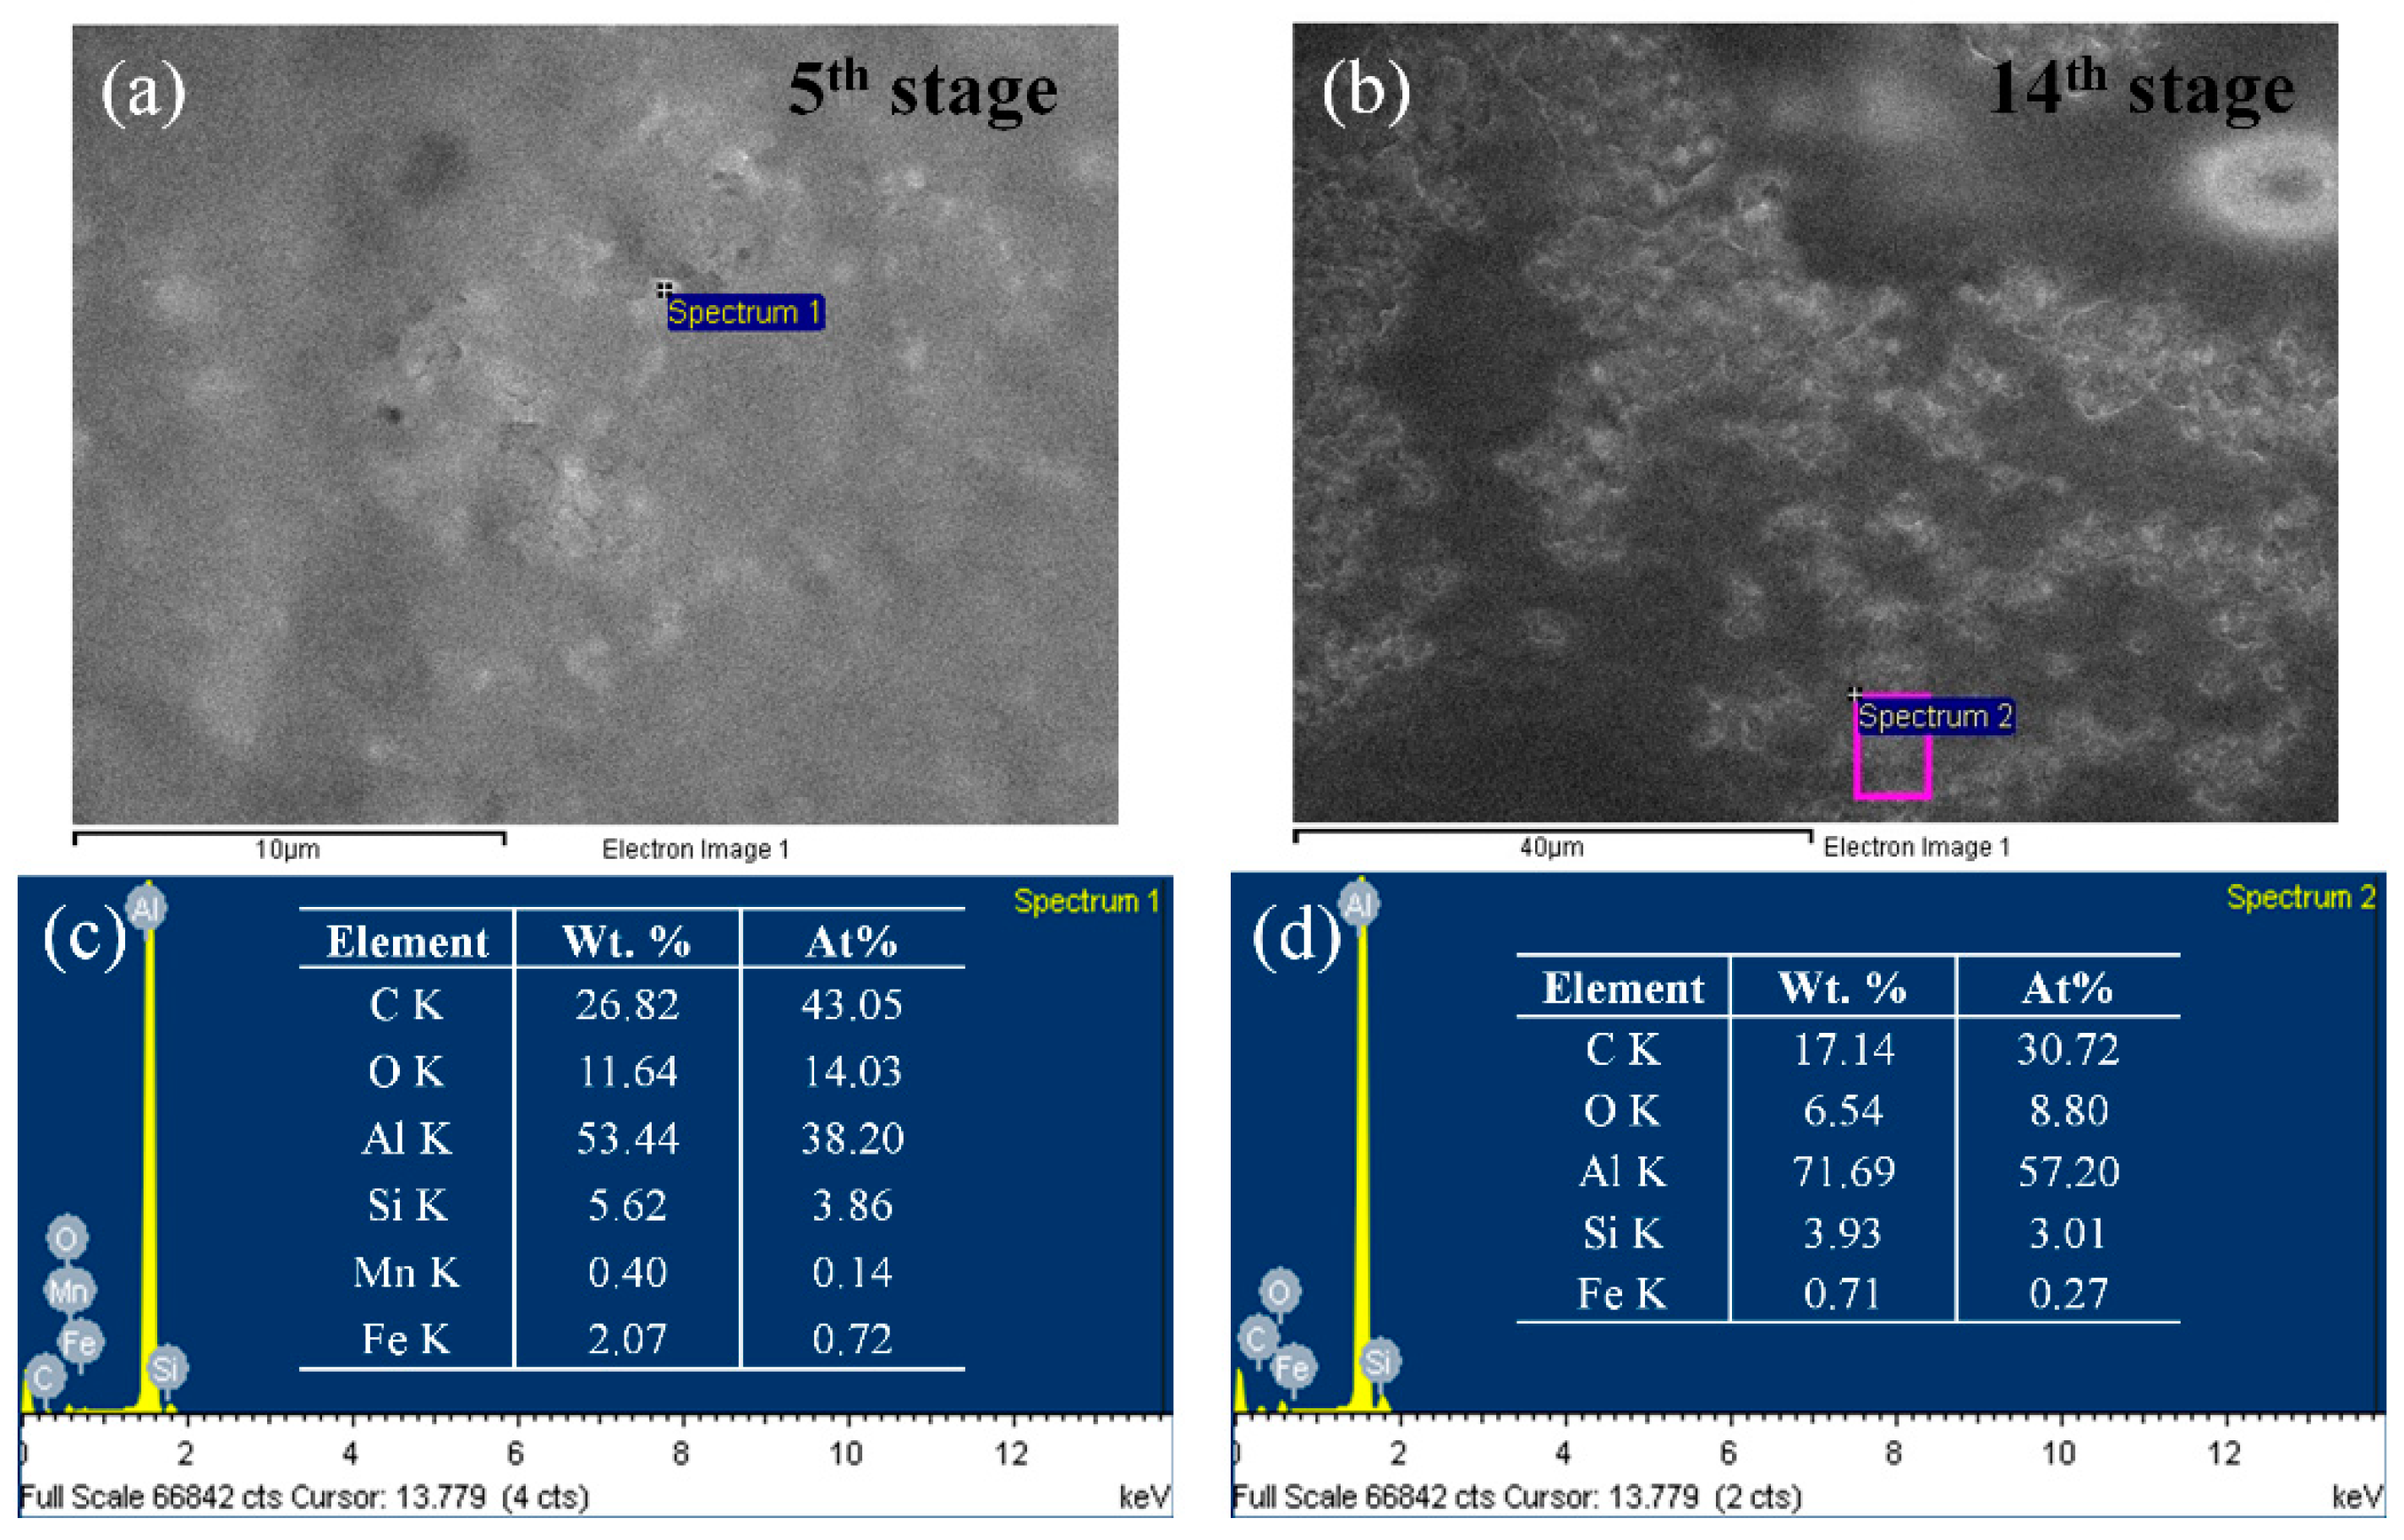
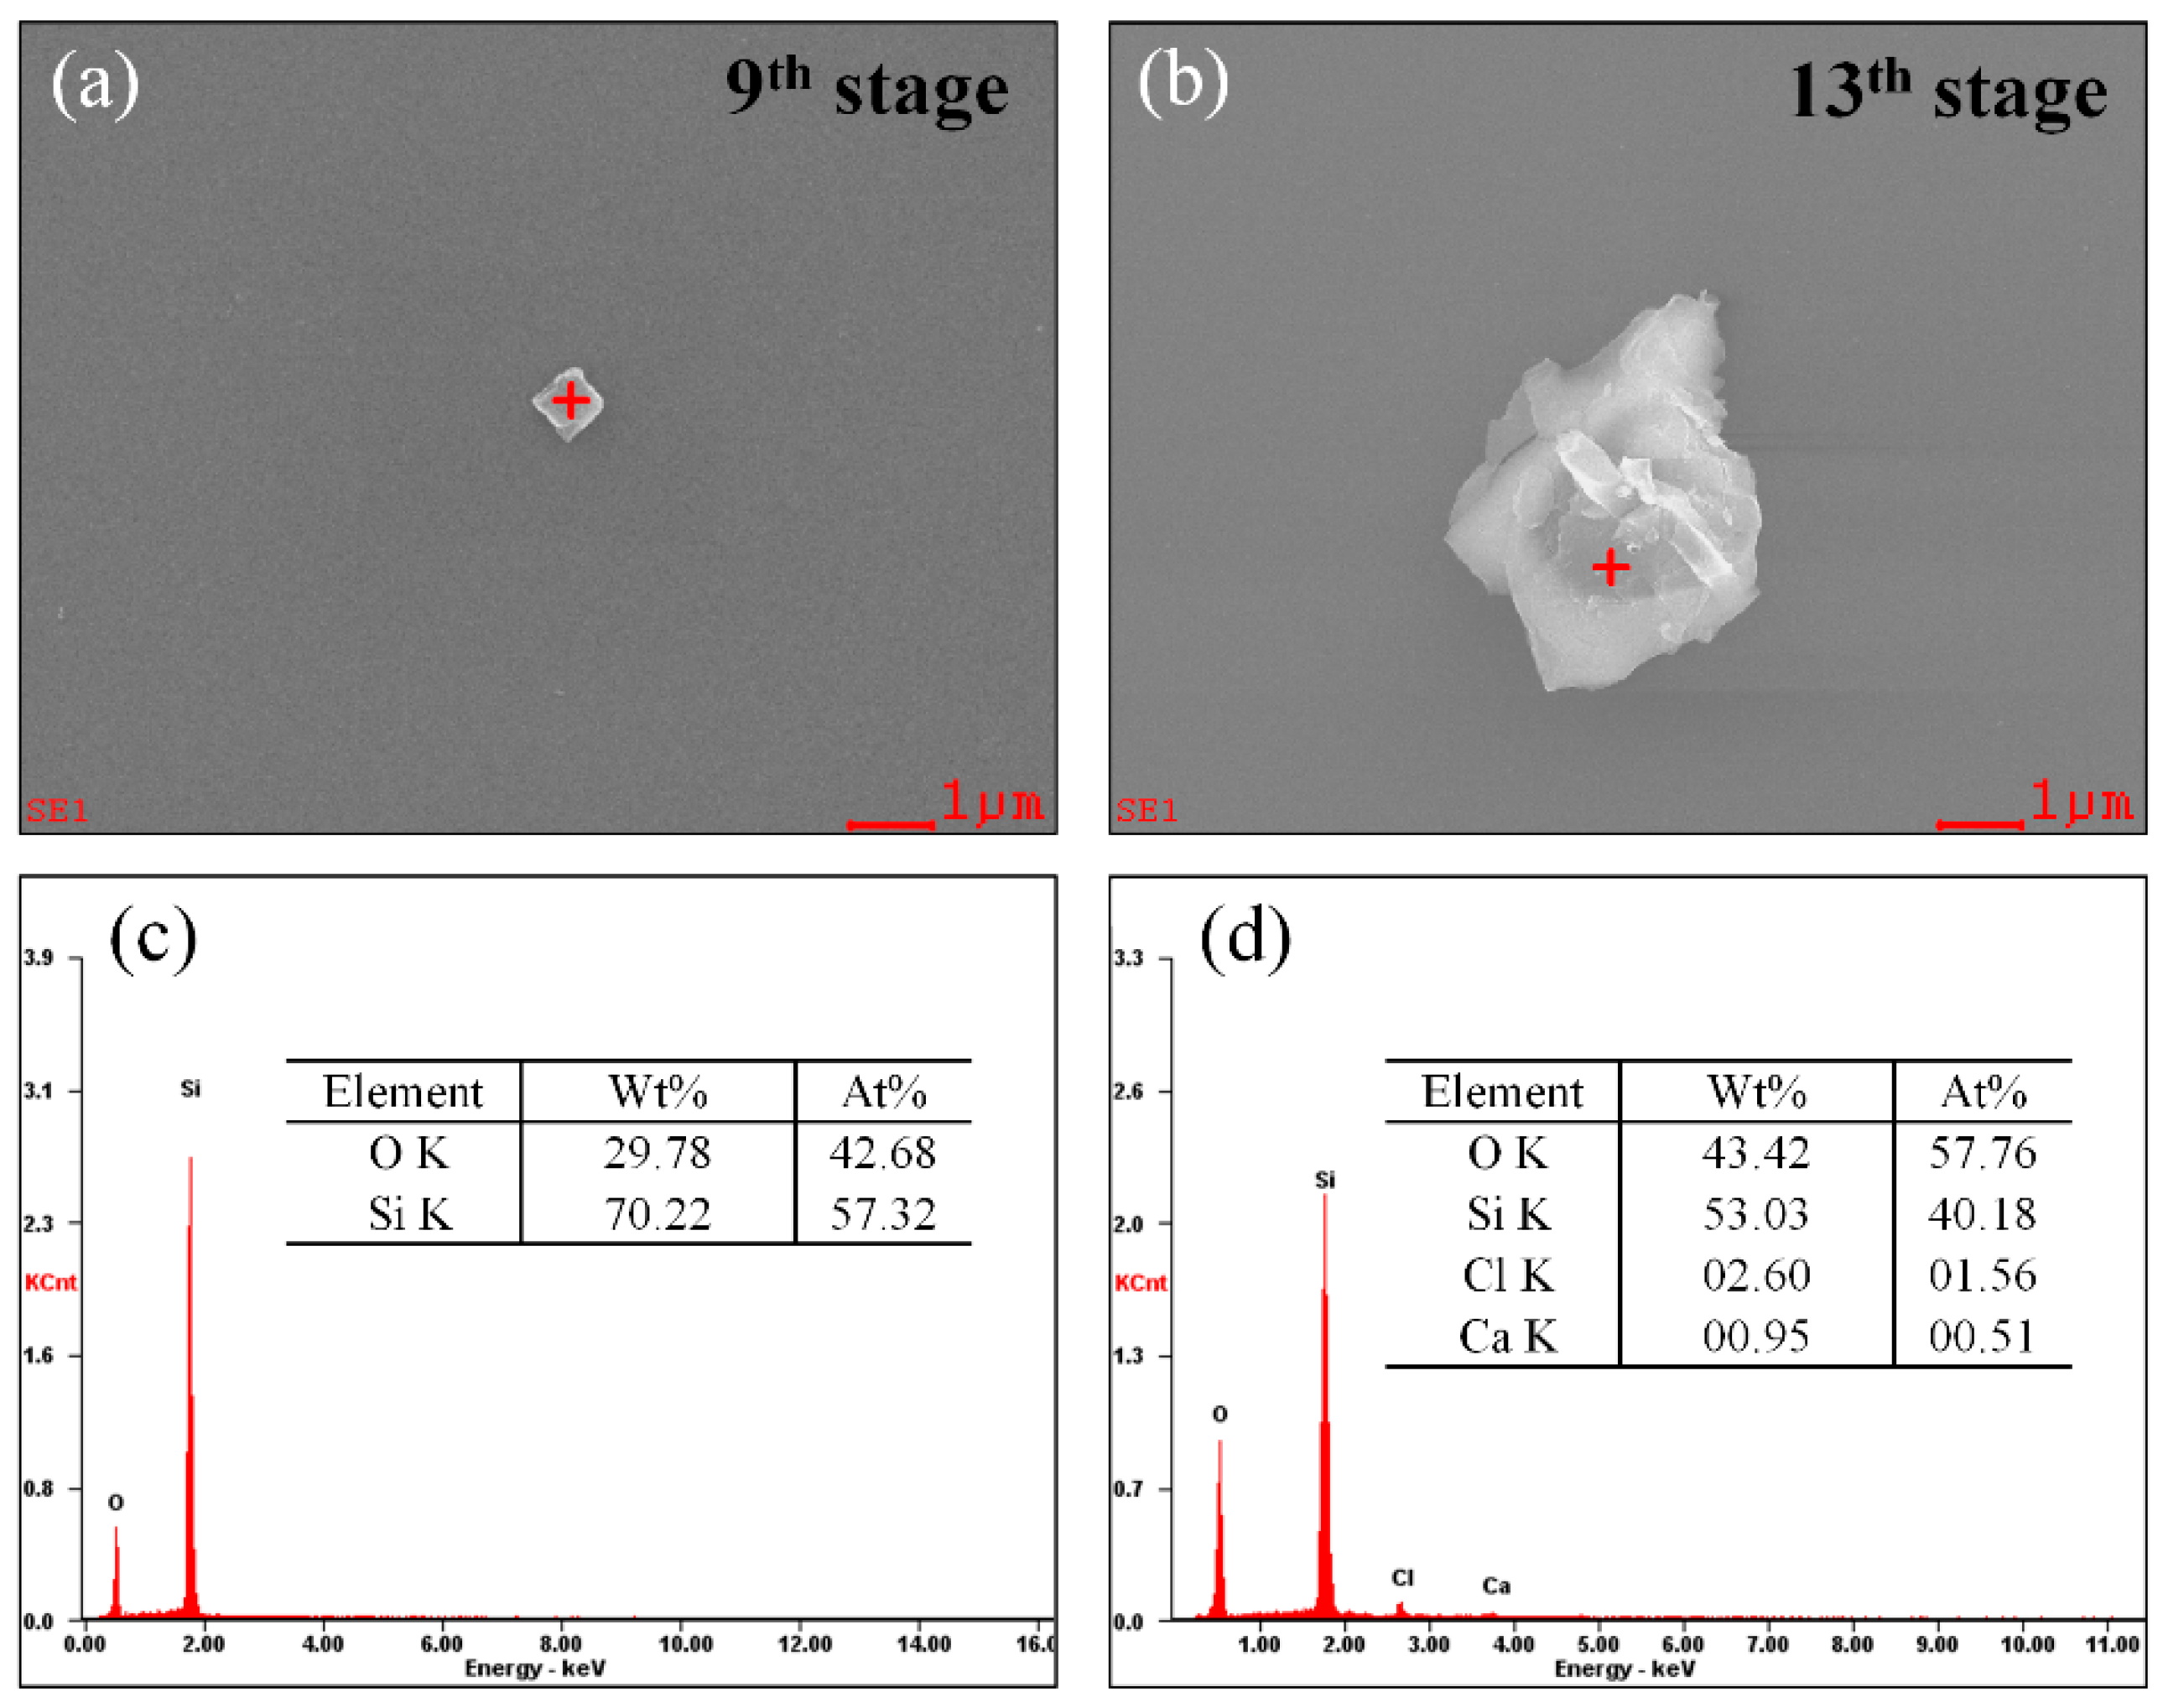
3.2. Image and Element Analysis of Particles Collected by ELPI

Figure 6 shows SEM–EDS analysis results of particles from the epitaxial growth chamber collected on aluminum foil, the basic substrate of ELPI. The cutoff diameter (D50%) was 0.101 µm for the 5th stage and 6.69 µm for the 14th stage. However, due to the high surface roughness of the aluminum foil used, it was difficult to identify the shapes of the collected particles through the detection and separation of the particles collected from the substrate during image analysis. In area-specific EDS analysis results, in addition to substrate components and components arising from atmospheric exposure during sample transfer, Si components were detected in all samples in significant amounts. This was expected because component Si particles would inevitably occur during the Si epitaxy process and remain in the chamber.
Figure 7 shows the SEM–EDS analysis results of particles on the Si wafer substrate collected from the epitaxial growth chamber. The cutoff diameter (D50%) was 0.637 µm for the 9th stage and 3.97 µm for the 13th stage. To solve the difficulty of detecting particles when using aluminum foil, a typical substrate, an alternative substrate with low surface roughness was used to collect particles and conduct SEM analysis. By changing the substrate, particle detection was facilitated and images were successfully obtained. In the EDS analysis results of particles detected on the substrate on the 9th stage, it was confirmed that particles had Si components, as in the analysis results of the particles on the aluminum foil substrate. Likewise, the analysis results of particles detected at other stages were mostly particles having only the Si element. In the EDS analysis results of particles detected at the 13th stage, significant amounts of Cl components were detected, in addition to Si. Particles containing these Si and Cl components at the same time were rarely found across several stages. These detections were due to the use of SiHCl3 gas in the epitaxial growth process. It is presumed that it was adsorbed into the inner wall of the chamber through chemisorption of the SiCl2 formed through gas phase decomposition [34]. If sufficient time is secured and various analyses are performed, such as quantifying components and crystal structures after particle measurement and collection, it is possible to estimate and control the generation/inflow path.

4. Conclusions

In order to analyze the particles remaining in the epitaxial growth chamber after the process, an ELPI was applied. As a result of measuring the concentrations of residual particles in the epitaxial growth chamber during the N2 purge using ELPI, it was possible to obtain particle size distribution and see the distribution trend for both the number concentration and mass concentration. Using the advantage of real-time measurement, it was confirmed that N2 purge operation was well performed after the process. The particle shape and composition were confirmed by SEM analysis of particles collected at each stage of the cascade impactor. Since various substrates could be mounted on each stage of the cascade impactor of the ELPI, a substrate with a low surface roughness is recommended when detecting particle shape images. To accurately identify the occurrence and inflow paths of each component, after collecting a large number of particles using a sufficient collection time, various in-depth additional analyses are required.
We performed a cornerstone study of the application of ELPI for particle analysis for process equipment in the semiconductor industry and other industries. The first application point found in this study is the real-time monitoring of chamber purge performance after the process for preventive maintenance using the advantage of real-time measurement. After confirming that the number of particles has fallen to a certain level before proceeding to the next process, it is possible to prevent the possible influence of residual particles on the process. This novel measurement mechanism provides critical information allowing us to reduce impurities and increase the rate of crystal growth. In addition, as this is a process that does not use explosive gas and which is conducted at normal pressure and room temperature, the concentration of the particles generated during the process can be monitored in real time. In addition, the ELPI method has a clear advantage of real-time particle concentration measurement and simultaneous collection. Thus, it can be more actively used for particle measurement and analysis in the semiconductor industry, which is plagued by many micro/nanoparticle issues.

Author Contributions

Conceptualization, S.L., D.K.; Methodology, S.L., D.K., S.K., H.L.; Formal analysis, S.L., E.K., P.L.; Investigation, S.L., D.K., E.K., D.-B.K.; Resources, S.K., H.L.; Data curation, S.L., Y.C.; Writing—original draft preparation, S.L.; Writing—review and editing, S.L., D.K., Y.C., T.K., D.-B.K.; Visualization, S.L., P.L., Y.C.; Supervision, T.K.; Project administration, S.L., T.K., S.K., H.L.; Funding acquisition, D.K., T.K., H.L. All authors have read and agreed to the published version of the manuscript.

Funding

This research was funded by Korean government (MSIT), grant number 2020M3H1A1077095, MOTIE (Ministry of Trade, Industry, and Energy), grant number P0008746, SK Siltron Co. Ltd. of funder, grant number 201807059.

Institutional Review Board Statement

Not applicable.

Informed Consent Statement

Not applicable.

Data Availability Statement

Not applicable.

Acknowledgments

This research was supported by Korea Initiative for fostering University of Research and Innovation Program of the National Research Foundation (NRF) funded by the Korean government (MSIT) (No.2020M3H1A1077095). This research was also supported by the MOTIE (Ministry of Trade, Industry, and Energy) of Korea under the Fostering Global Talents for Innovative Growth Program (P0008746) supervised by the Korea Institute for Advancement of Technology (KIAT). We also give our deepest appreciation to SK Siltron Co., Ltd. for their support and cooperation.

Conflicts of Interest

The authors have no conflict of interest relevant to this study to disclose.

References

  1. Varas, A.; Varadarajan, R.; Goodrich, J.; Yinug, F. Government incentives and US competitiveness in semiconductor manufacturing. BCG Glob. Sept. 2020, 9, 2. [Google Scholar]
  2. Müller, S.G.; Sanchez, E.; Hansen, D.; Drachev, R.; Chung, G.; Thomas, B.; Zhang, J.; Loboda, M.; Dudley, M.; Wang, H. Volume production of high quality SiC substrates and epitaxial layers: Defect trends and device applications. J. Cryst. Growth 2012, 352, 39–42. [Google Scholar] [CrossRef]
  3. Jacobson, H.; Birch, J.; Yakimova, R.; Syväjärvi, M.; Bergman, J.; Ellison, A.; Tuomi, T.; Janzén, E. Dislocation evolution in 4H-SiC epitaxial layers. J. Appl. Phys. 2002, 91, 6354–6360. [Google Scholar] [CrossRef]
  4. Jean-Luc, B.; Bruno, D. Contamination monitoring and analysis in semiconductor manufacturing. Semicond. Technol. 1999, 1999, 57–78. [Google Scholar]
  5. Ziemann, P.J.; Liu, P.; Rao, N.P.; Kittelson, D.B.; McMurry, P.H. Particle beam mass spectrometry of submicron particles charged to saturation in an electron beam. J. Aerosol Sci. 1995, 26, 745–756. [Google Scholar] [CrossRef]
  6. Miyashita, H.; Kikuchi, T.; Kawasaki, Y.; Katakura, Y.; Ohsako, N. Particle measurements in vacuum tools by in situ particle monitor. J. Vac. Sci. Technol. A Vac. Surf. Film. 1999, 17, 1066–1070. [Google Scholar] [CrossRef]
  7. Takahashi, K.M.; Daugherty, J.E. Current capabilities and limitations of in situ particle monitors in silicon processing equipment. J. Vac. Sci. Technol. A Vac. Surf. Film. 1996, 14, 2983–2993. [Google Scholar] [CrossRef]
  8. Brundle, C.; Uritsky, Y. Full wafer particle defect characterization. In Proceedings of the AIP Conference, Gaithersburg, MD, USA, 26–29 June 2000; pp. 285–291. [Google Scholar]
  9. Shen, S.; Jaques, P.A.; Zhu, Y.; Geller, M.D.; Sioutas, C. Evaluation of the SMPS–APS system as a continuous monitor for measuring PM2.5, PM10 and coarse (PM2.5–10) concentrations. Atmos. Environ. 2002, 36, 3939–3950. [Google Scholar] [CrossRef]
  10. Xiao, S.; Wang, M.; Yao, L.; Kulmala, M.; Zhou, B.; Yang, X.; Chen, J.; Wang, D.; Fu, Q.; Worsnop, D. Strong atmospheric new particle formation in winter in urban Shanghai, China. Atmos. Chem. Phys. 2015, 15, 1769–1781. [Google Scholar] [CrossRef] [Green Version]
  11. Harrison, R.M.; Jones, M.; Collins, G. Measurements of the physical properties of particles in the urban atmosphere. Atmos. Environ. 1999, 33, 309–321. [Google Scholar] [CrossRef]
  12. Wiedensohler, A.; Birmili, W.; Nowak, A.; Sonntag, A.; Weinhold, K.; Merkel, M.; Wehner, B.; Tuch, T.; Pfeifer, S.; Fiebig, M. Mobility particle size spectrometers: Harmonization of technical standards and data structure to facilitate high quality long-term observations of atmospheric particle number size distributions. Atmos. Meas. Tech. 2012, 5, 657–685. [Google Scholar] [CrossRef] [Green Version]
  13. Hogrefe, O.; Lala, G.G.; Frank, B.P.; Schwab, J.J.; Demerjian, K.L. Field evaluation of a TSI model 3034 scanning mobility particle sizer in New York City: Winter 2004 intensive campaign. Aerosol Sci. Technol. 2006, 40, 753–762. [Google Scholar] [CrossRef] [Green Version]
  14. Kheirkhah, P.; Baldelli, A.; Kirchen, P.; Rogak, S. Development and validation of a multi-angle light scattering method for fast engine soot mass and size measurements. Aerosol Sci. Technol. 2020, 54, 1083–1101. [Google Scholar] [CrossRef]
  15. Jeong, C.-H.; Evans, G.J. Inter-comparison of a fast mobility particle sizer and a scanning mobility particle sizer incorporating an ultrafine water-based condensation particle counter. Aerosol Sci. Technol. 2009, 43, 364–373. [Google Scholar] [CrossRef] [Green Version]
  16. Jørgensen, R.B. Comparison of four nanoparticle monitoring instruments relevant for occupational hygiene applications. J. Occup. Med. Toxicol. 2019, 14, 28. [Google Scholar] [CrossRef] [PubMed]
  17. Keskinen, J.; Pietarinen, K.; Lehtimäki, M. Electrical low pressure impactor. J. Aerosol Sci. 1992, 23, 353–360. [Google Scholar] [CrossRef]
  18. Baron, P.A. Calibration and use of the aerodynamic particle sizer (APS 3300). Aerosol Sci. Technol. 1986, 5, 55–67. [Google Scholar] [CrossRef]
  19. Jørgensen, R.B.; Kero, I.T. Real-time measurements and characterization of airborne particulate matter from a primary silicon carbide production plant. Int. J. Environ. Res. Public Health 2017, 14, 1611. [Google Scholar] [CrossRef] [Green Version]
  20. Held, A.; Zerrath, A.; McKeon, U.; Fehrenbach, T.; Niessner, R.; Plass-Dülmer, C.; Kaminski, U.; Berresheim, H.; Pöschl, U. Aerosol size distributions measured in urban, rural and high-alpine air with an electrical low pressure impactor (ELPI). Atmos. Environ. 2008, 42, 8502–8512. [Google Scholar] [CrossRef]
  21. Hsieh, Y.-K.; Chen, L.-K.; Hsieh, H.-F.; Huang, C.-H.; Wang, C.-F. Elemental analysis of airborne particulate matter using an electrical low-pressure impactor and laser ablation/inductively coupled plasma mass spectrometry. J. Anal. At. Spectrom. 2011, 26, 1502–1508. [Google Scholar] [CrossRef]
  22. Liu, Z.; Ge, Y.; Johnson, K.C.; Shah, A.N.; Tan, J.; Wang, C.; Yu, L. Real-world operation conditions and on-road emissions of Beijing diesel buses measured by using portable emission measurement system and electric low-pressure impactor. Sci. Total Environ. 2011, 409, 1476–1480. [Google Scholar] [CrossRef]
  23. Kero, I.; Naess, M.K.; Tranell, G. Particle size distributions of particulate emissions from the ferroalloy industry evaluated by electrical low pressure impactor (ELPI). J. Occup. Environ. Hyg. 2015, 12, 37–44. [Google Scholar] [CrossRef] [PubMed] [Green Version]
  24. Kero, I.T.; Jørgensen, R.B. Comparison of three real-time measurement methods for airborne ultrafine particles in the silicon alloy industry. Int. J. Environ. Res. Public Health 2016, 13, 871. [Google Scholar] [CrossRef] [PubMed] [Green Version]
  25. Lee, M.-H.; Yang, W.; Chae, N.; Choi, S. Aerodynamic diameter distribution of aerosols from plasma arc cutting for steels at different cutting power levels. J. Radioanal. Nucl. Chem. 2020, 323, 613–624. [Google Scholar] [CrossRef]
  26. Glover, W.; Chan, H.-K. Electrostatic charge characterization of pharmaceutical aerosols using electrical low-pressure impaction (ELPI). J. Aerosol Sci. 2004, 35, 755–764. [Google Scholar] [CrossRef]
  27. Järvinen, A.; Aitomaa, M.; Rostedt, A.; Keskinen, J.; Yli-Ojanperä, J. Calibration of the new electrical low pressure impactor (ELPI+). J. Aerosol Sci. 2014, 69, 150–159. [Google Scholar] [CrossRef] [Green Version]
  28. Pagels, J.; Gudmundsson, A.; Gustavsson, E.; Asking, L.; Bohgard, M. Evaluation of aerodynamic particle sizer and electrical low-pressure impactor for unimodal and bimodal mass-weighted size distributions. Aerosol Sci. Technol. 2005, 39, 871–887. [Google Scholar] [CrossRef] [Green Version]
  29. Marjamäki, M.; Keskinen, J.; Chen, D.-R.; Pui, D.Y. Performance evaluation of the electrical low-pressure impactor (ELPI). J. Sci. 2000, 31, 249–261. [Google Scholar] [CrossRef]
  30. Kim, B.; Lee, J.S.; Choi, B.-S.; Park, S.-Y.; Yoon, J.-H.; Kim, H. Ultrafine particle characteristics in a rubber manufacturing factory. Ann. Occup. Hyg. 2013, 57, 728–739. [Google Scholar]
  31. Baldelli, A.; Rogak, S.N. Morphology and Raman spectra of aerodynamically classified soot samples. Atmos. Meas. Tech. 2019, 12, 4339–4346. [Google Scholar] [CrossRef] [Green Version]
  32. Dzubay, T.; Hines, L.; Stevens, R. Particle bounce errors in cascade impactors. Atmos. Environ. 1976, 10, 229–234. [Google Scholar] [CrossRef]
  33. Lawson, D.R. Impaction surface coatings intercomparison and measurements with cascade impactors. Atmos. Environ. 1980, 14, 195–199. [Google Scholar] [CrossRef]
  34. Habuka, H.; Aoyama, Y.; Akiyama, S.; Otsuka, T.; Qu, W.-F.; Shimada, M.; Okuyama, K. Chemical process of silicon epitaxial growth in a SiHCl3–H2 system. J. Cryst. Growth 1999, 207, 77–86. [Google Scholar] [CrossRef]
Figure 1. Schematic of the residual particle measurement setup during N2 gas purge.
Applsci 11 07680 g001
Figure 2. A schematic of the cascade impactor and cut-off diameters of each stage in the ELPI cascade impactor.
Applsci 11 07680 g002
Figure 3. Images of an impactor with different collection substrates. (a) Aluminum foil, (b) Si wafer.
Applsci 11 07680 g003
Figure 4. Particle size distributions in the epitaxial growth chamber. (a) Number concentration, and (b) Mass concentration.
Applsci 11 07680 g004
Figure 5. Particle number concentration graph by time. X-axis: time (min); Y-axis: the number proportion compared to the initial total concentration (C/C0).
Applsci 11 07680 g005
Figure 6. SEM–EDS analysis results of particles collected on (a,c) the aluminum foil substrate by ELPI substrate of the 5th stage and the (b,d) substrate of 14th stage.
Applsci 11 07680 g006
Figure 7. SEM–EDS analysis results of particles collected on the Si wafer substrate with ELPI. (a,c) Particles from the 9th stage; (b,d) particles from the 13th stage.
Applsci 11 07680 g007
Publisher’s Note: MDPI stays neutral with regard to jurisdictional claims in published maps and institutional affiliations.

