
ViTool-BC: Visualization Tool Based on Cooja Simulator for WSN


Abstract
:1. Introduction
2. Related Works
3. Energy Estimations and Metrics
4. Discussion
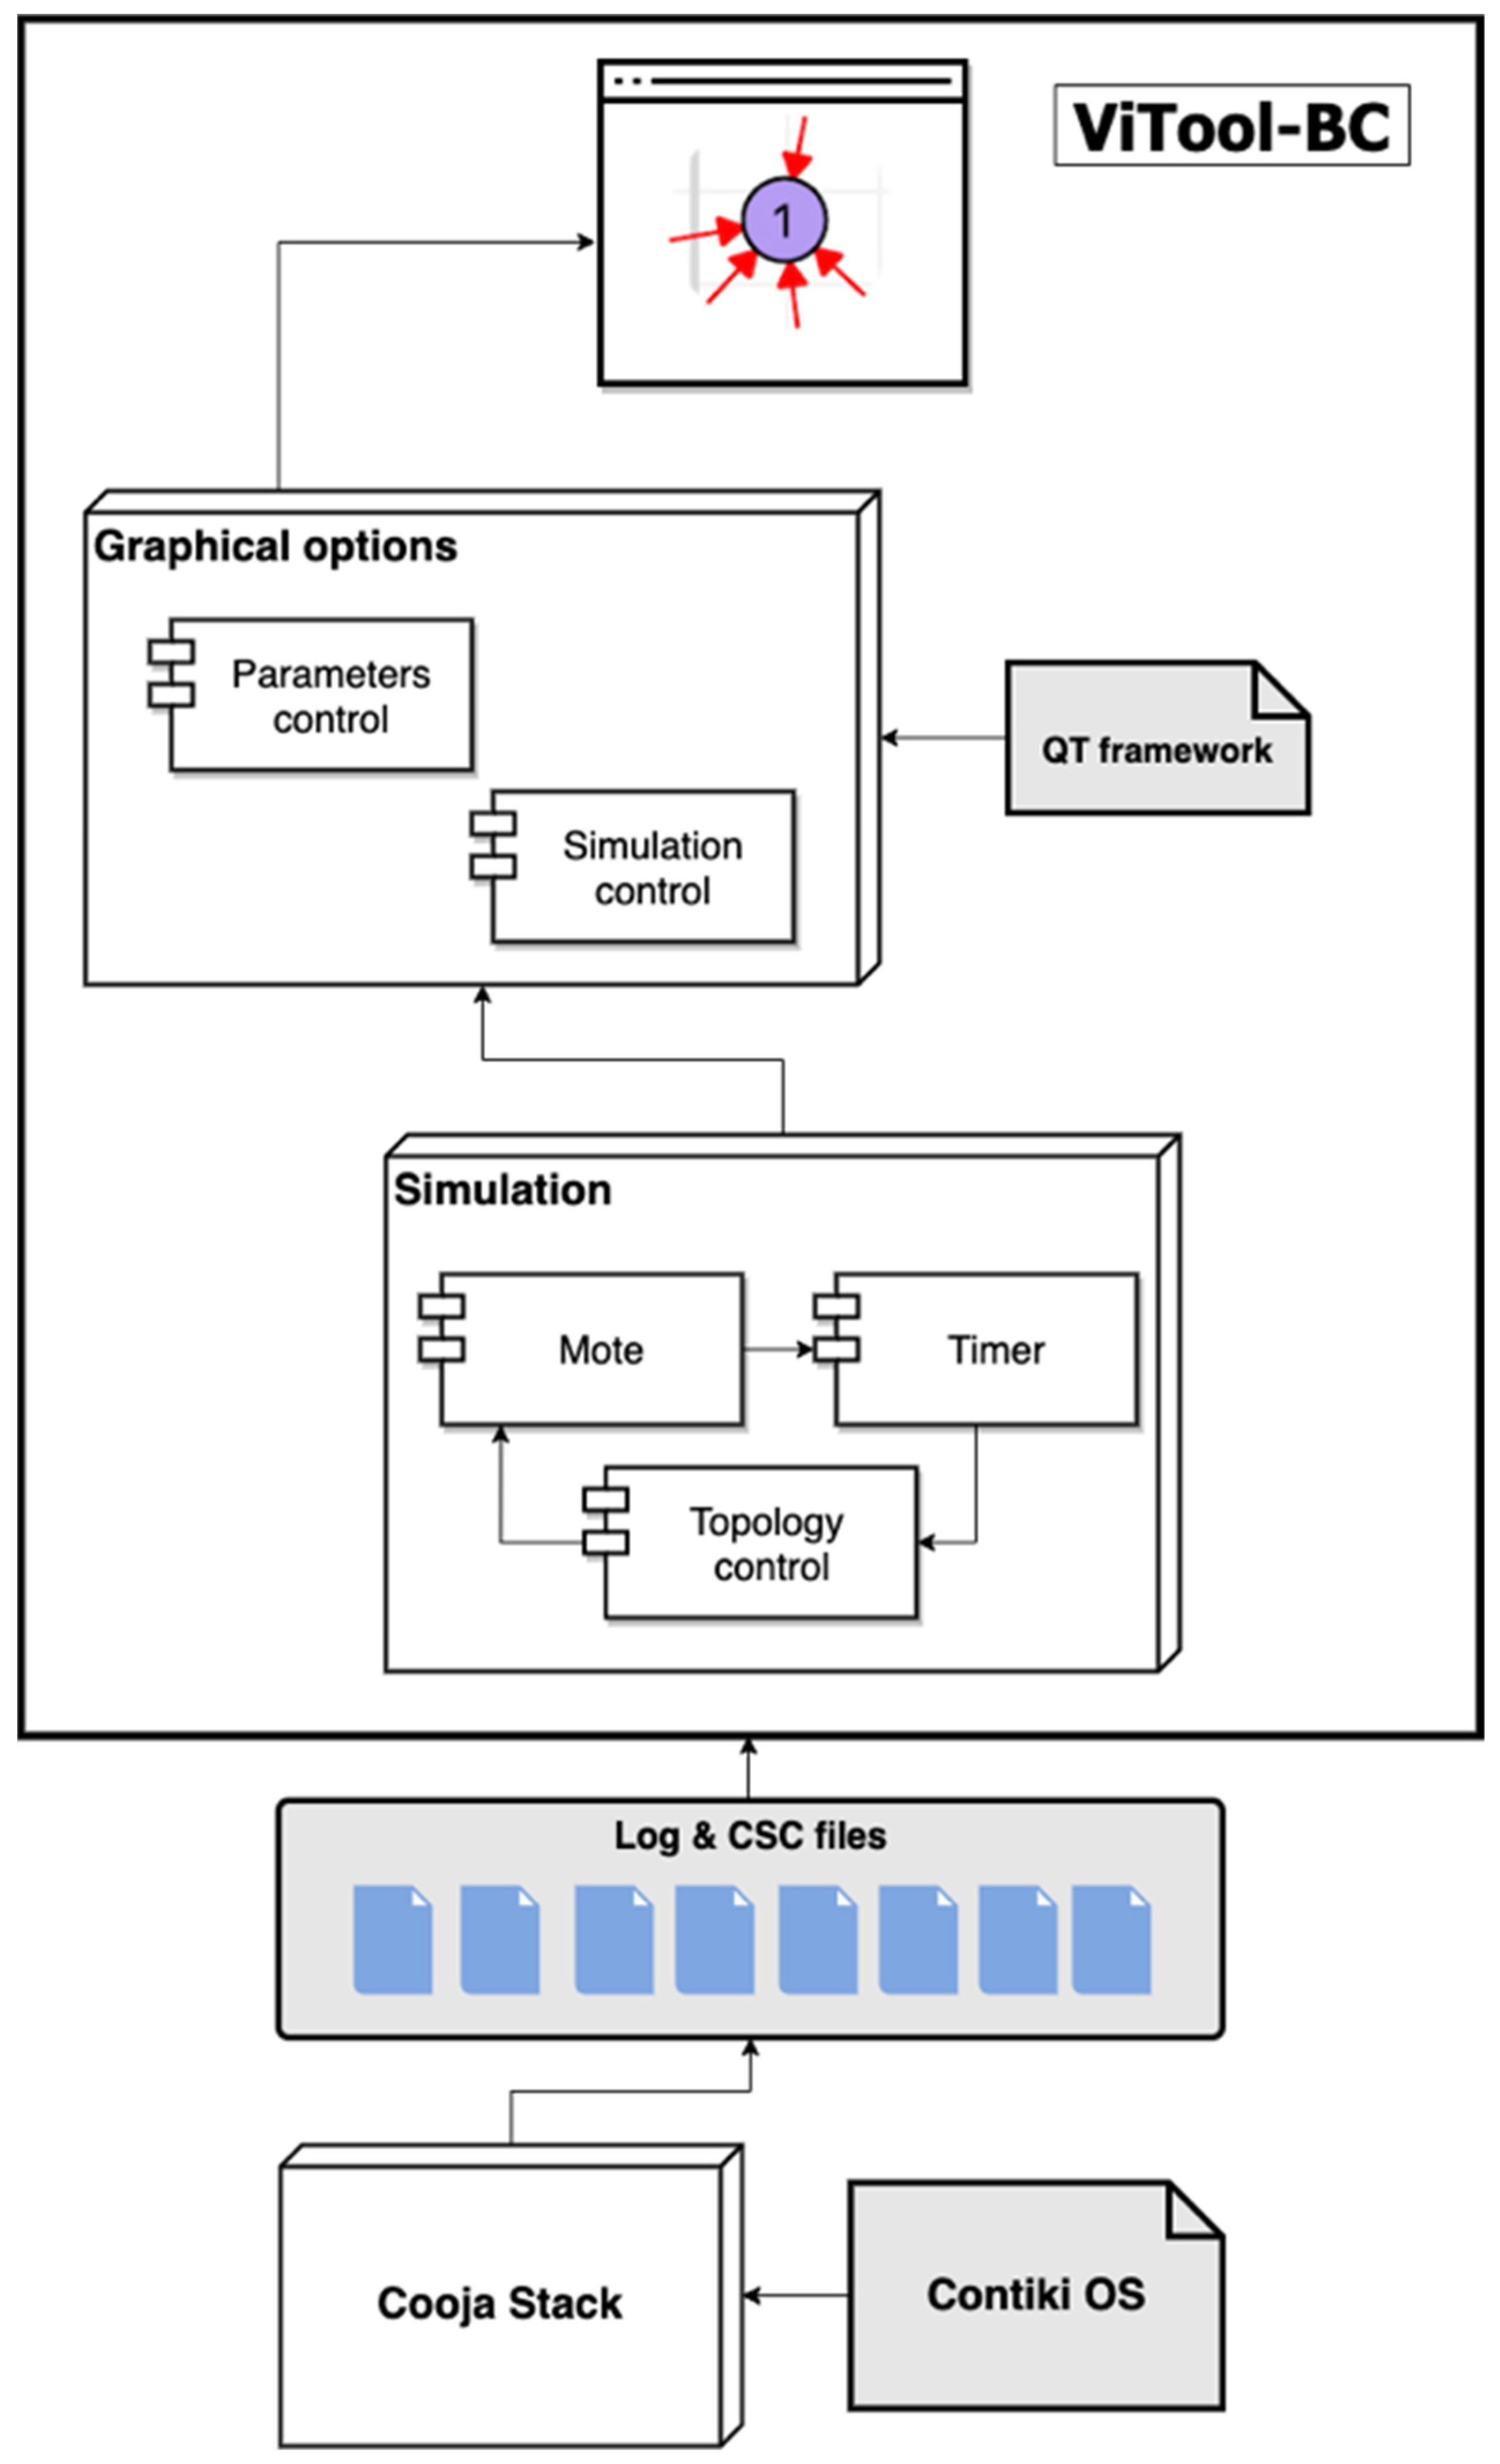
4.1. Architecture
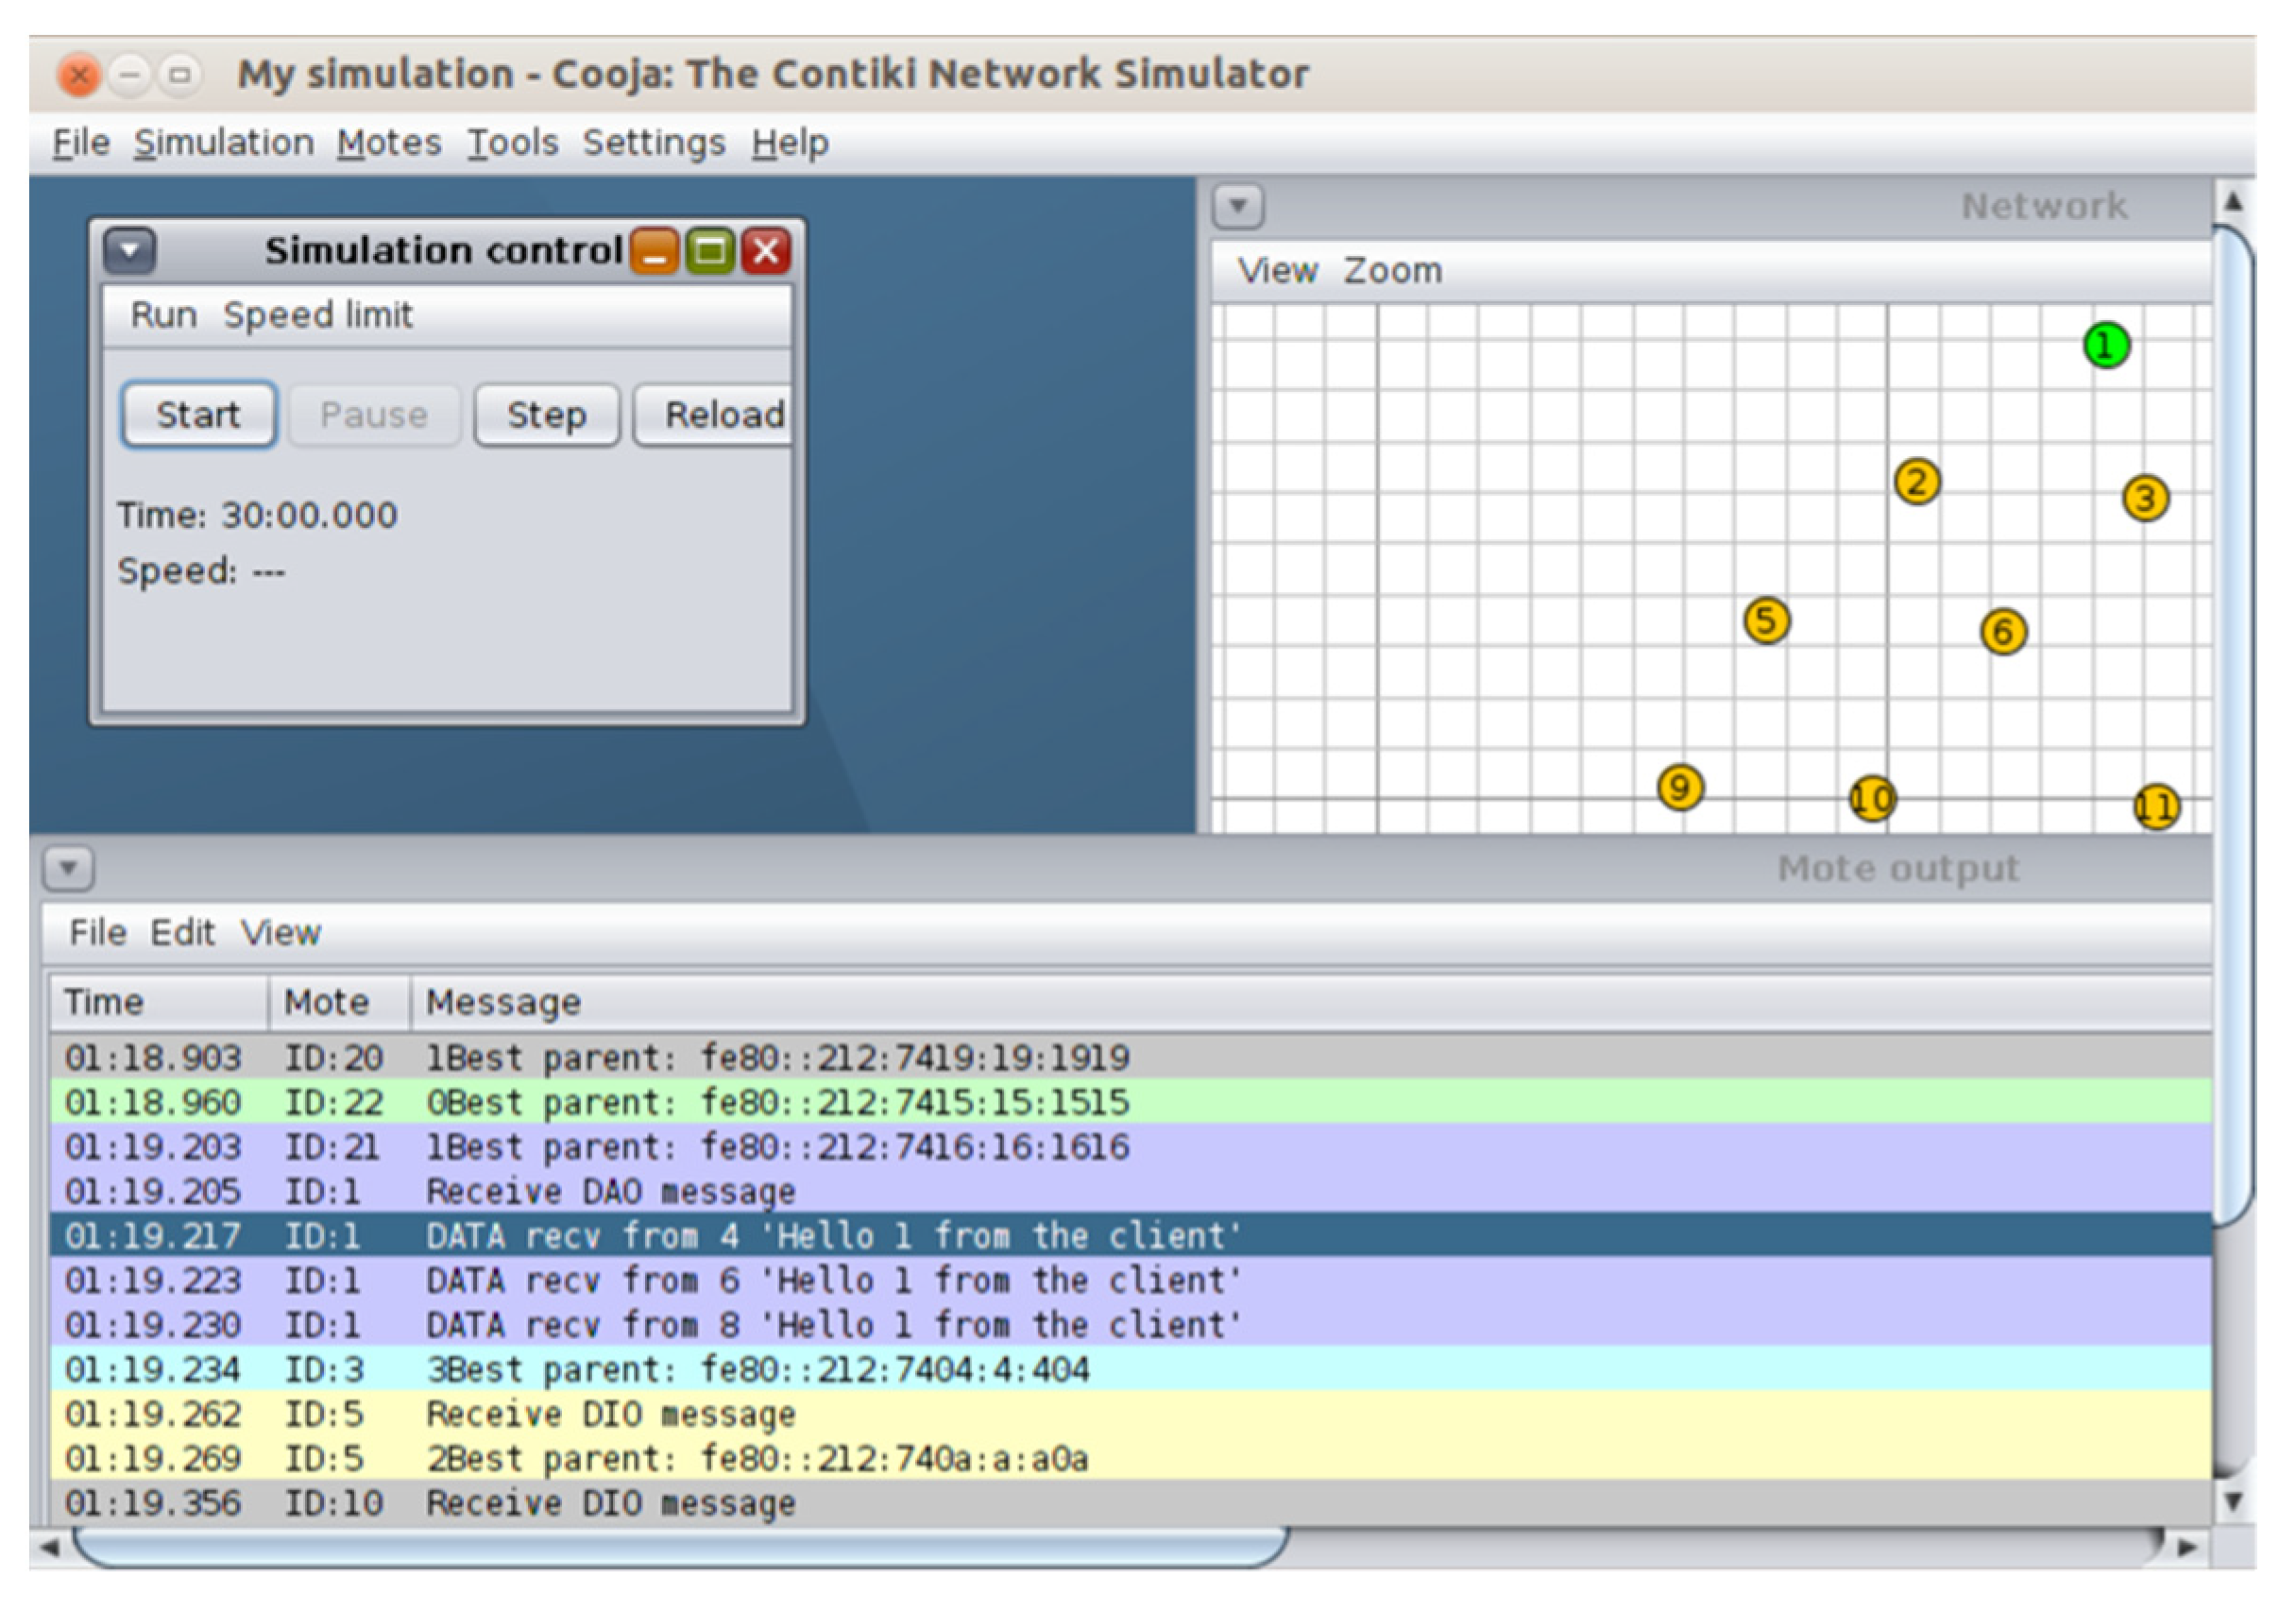
4.1.1. Simulation Component
- Mote: It defines the class in which the methods and variables related to a node or device are available within Cooja simulation. This component includes functions and methods such as obtaining the IP address or Rime address, ID of the node, listing and filter of Parent set, energy trace in real time, and remaining battery, among others. These types of procedures allow the tool to show the detailed trace of the current state of each node.
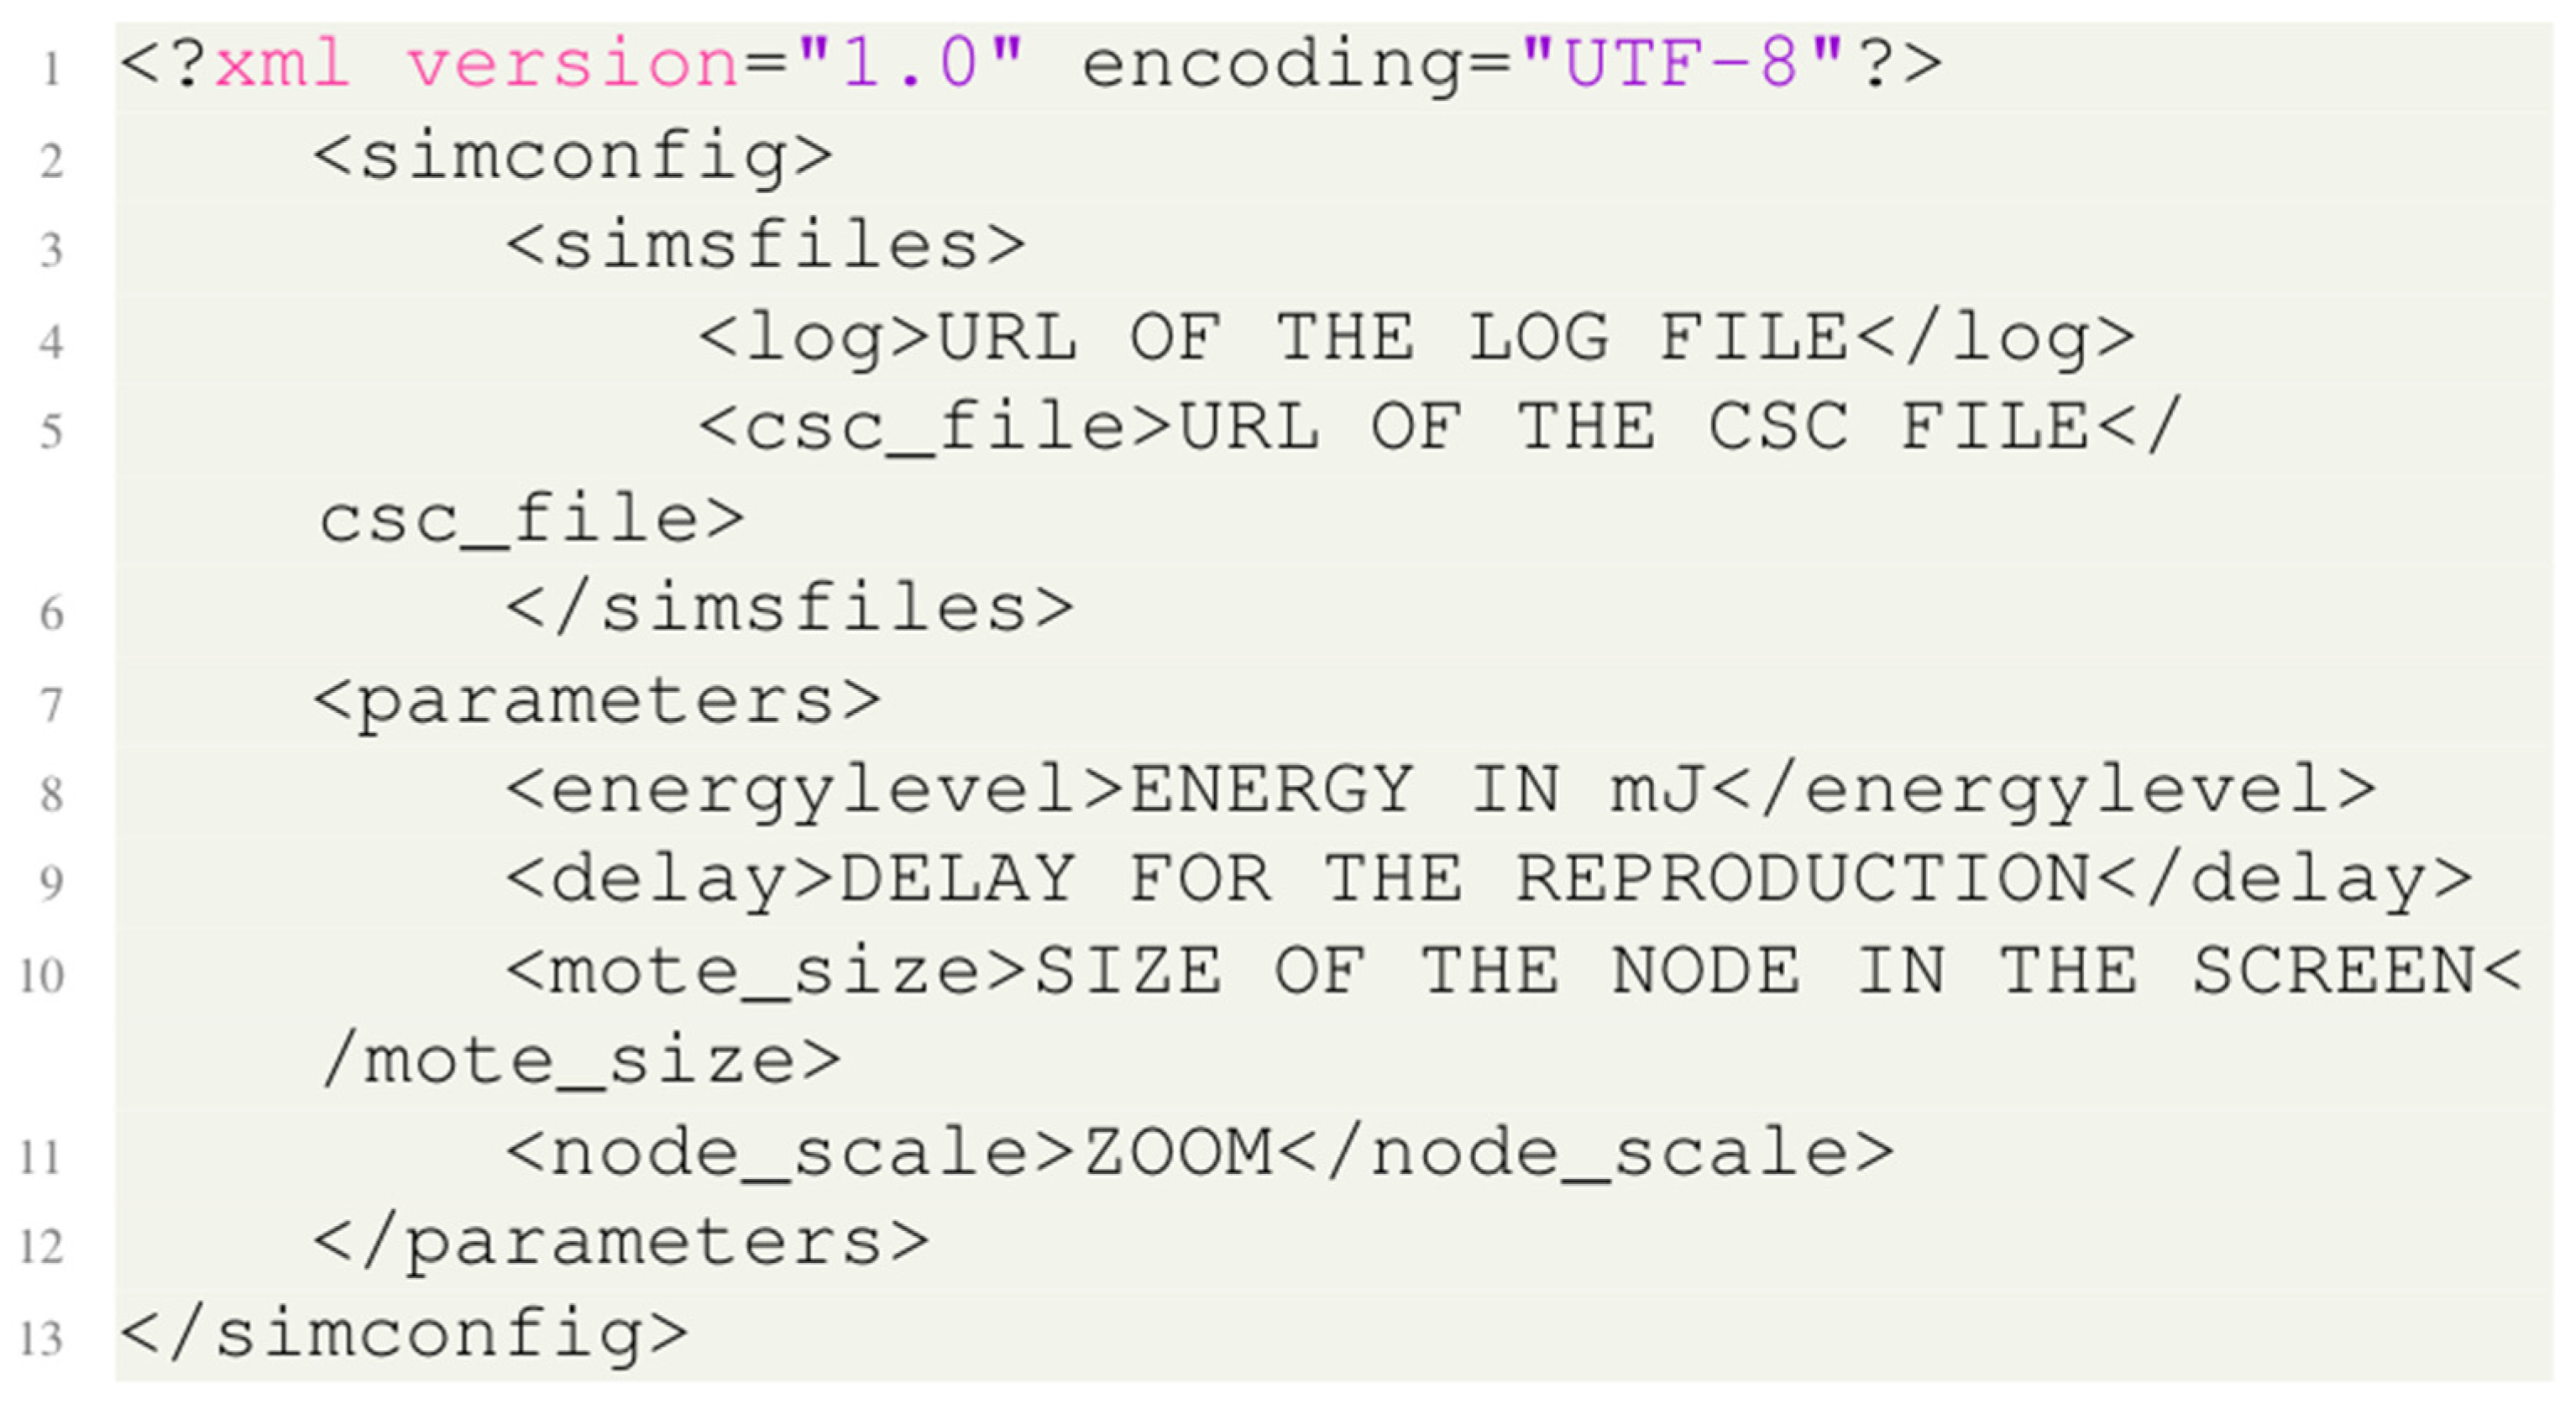
- Topology control: The focus of this subcomponent is the generation of random topologies. The resulting random topologies are downloaded into an XML file with a csc extension, which permits to be evaluated in the Cooja tool. Some of the simulation’s parameters included in the XML file are the values of node position, TX, and RX. The functionality of this component is restricted to the window commands.
- Timer: Subcomponent in which the logic and handling of the simulation time is defined, allowing control actions (play, pause, and reset) of the simulation/replay time value of the scenario. The threads and signals were used to manage and interact with the main window or GUI Thread, due to these types of complements which let the parallel executions of both tasks.
4.1.2. Graphical Options
- QT framework: It is defined as library-oriented towards the software development that will use graphic interfaces (GUI). This library was initially written in C++, but it is available in other programming languages. The library offers routines and methods to facilitate the access and management of the user inputs and visual aspects of the developed applications.
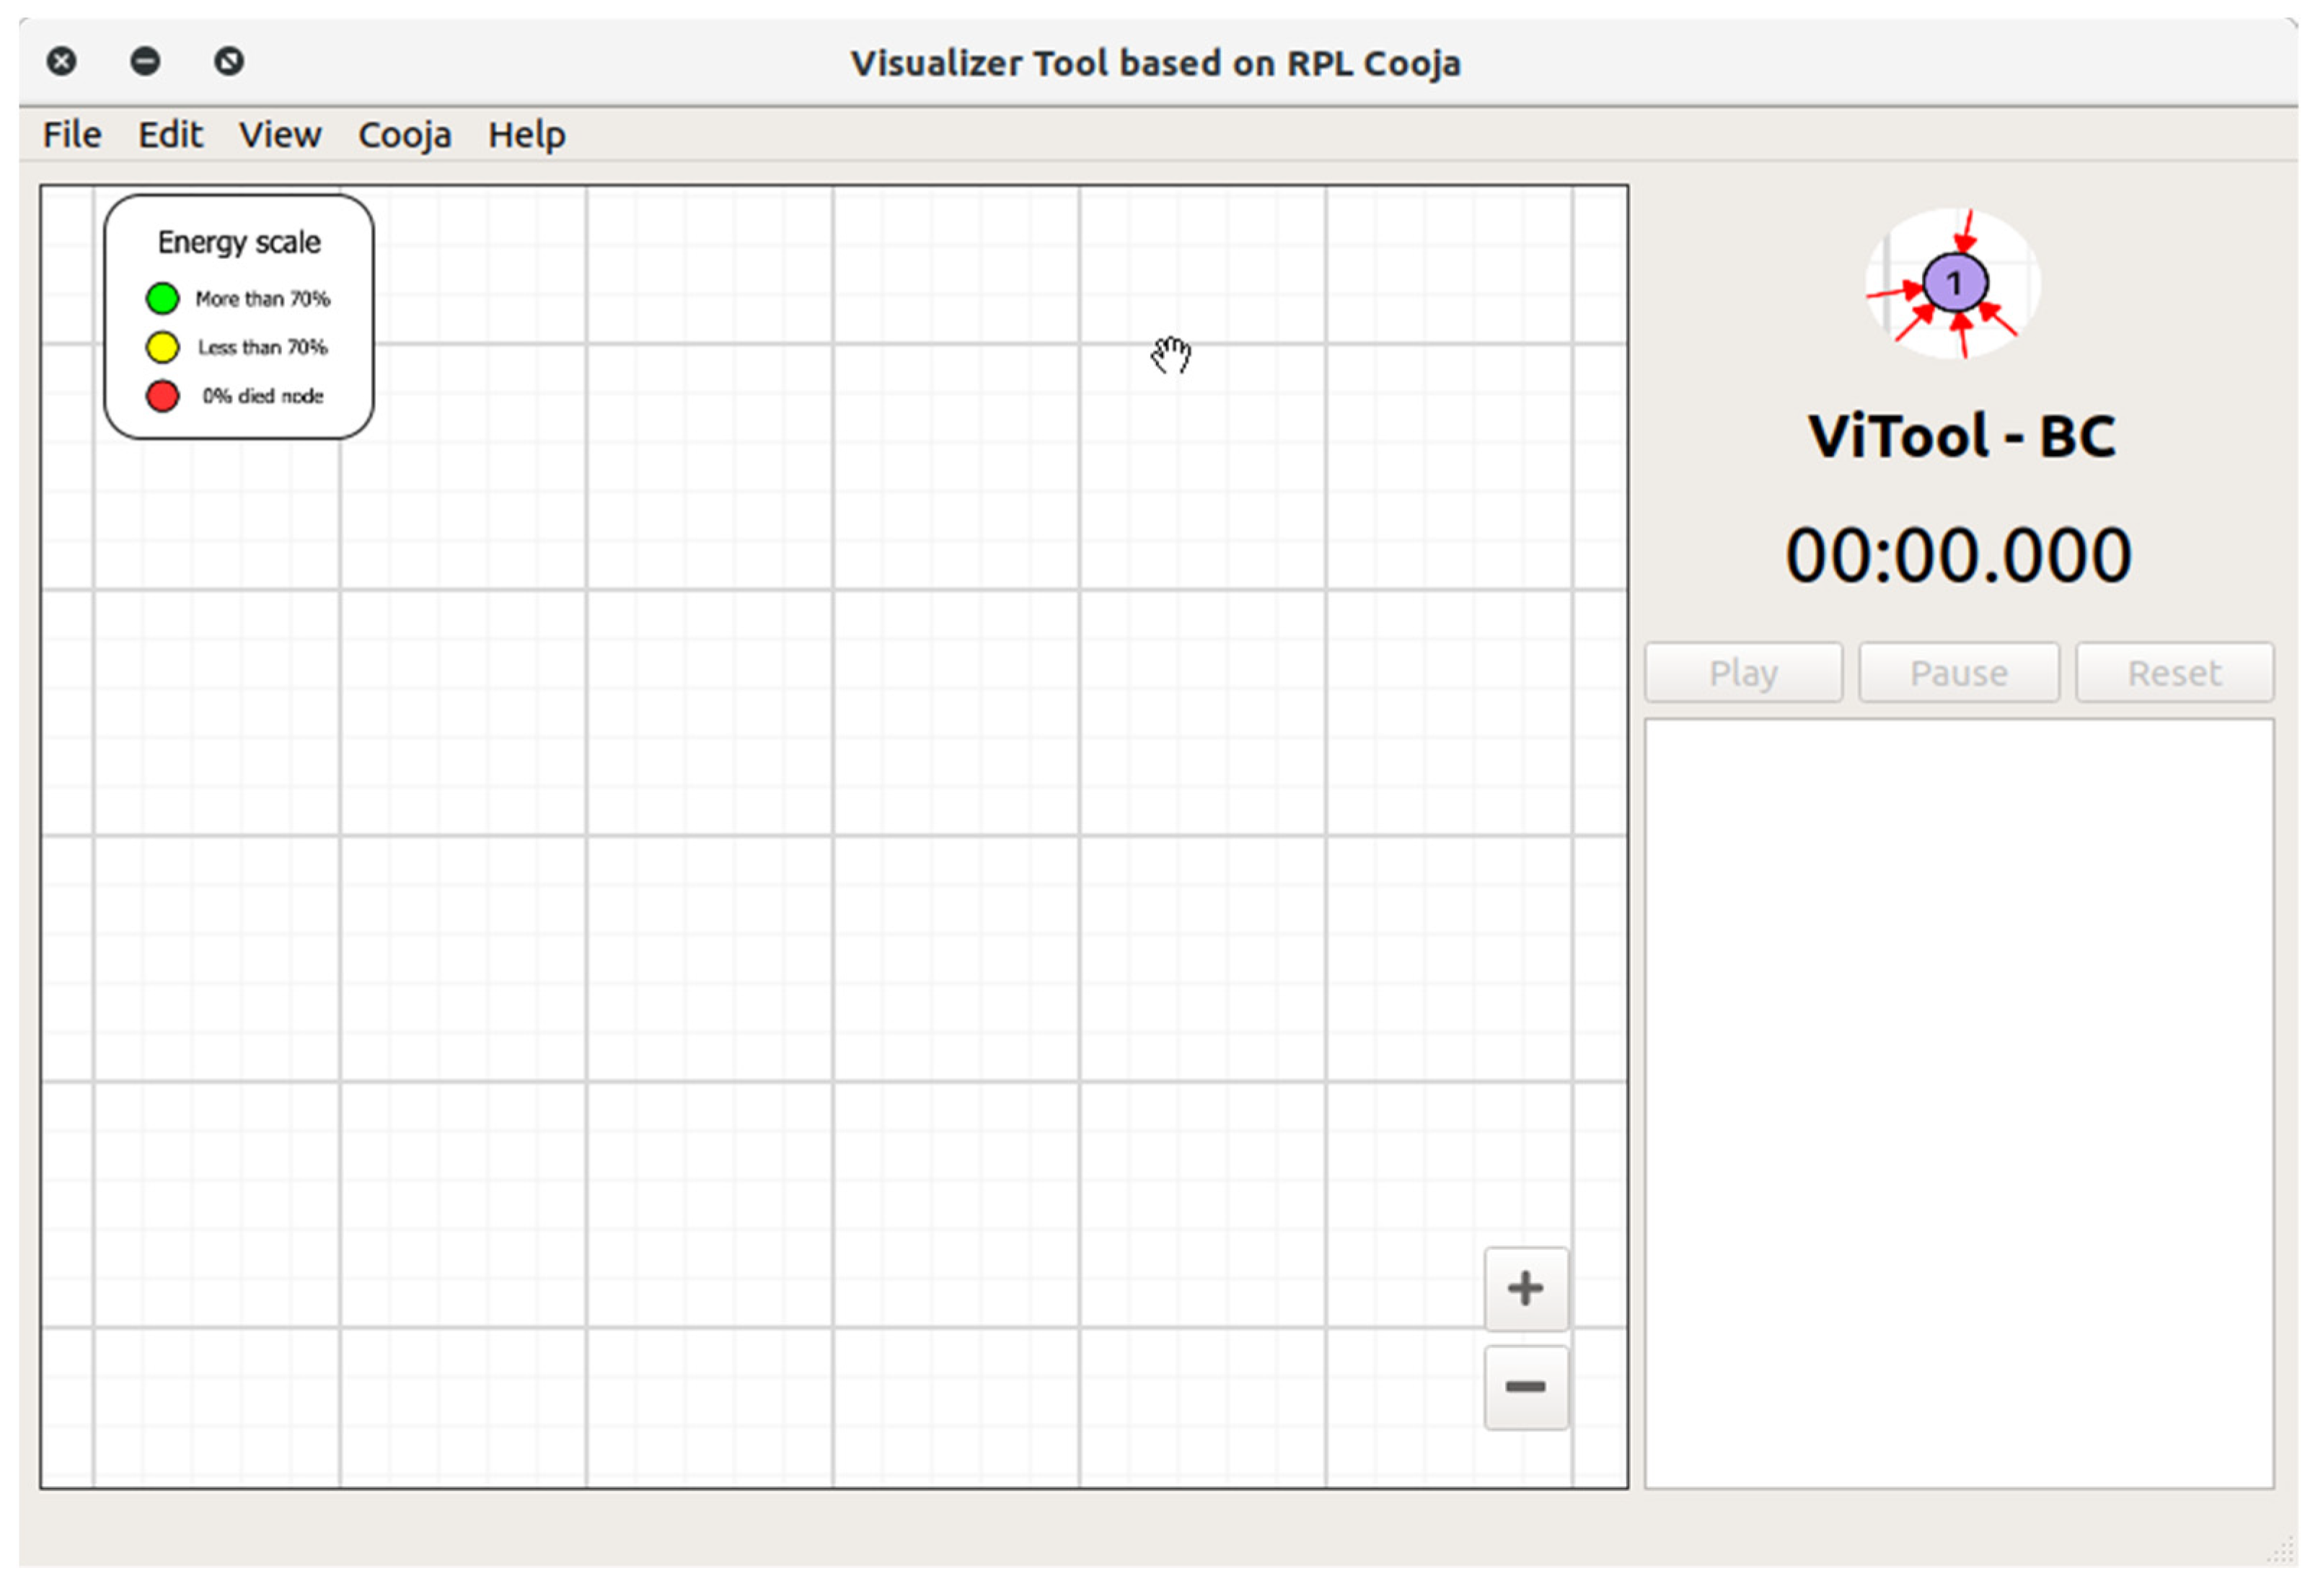
- Parameters controls: There are different options to interact with ViTool-BC, and its parameters are able to manage the visual parameters defined for the simulations. This interaction delimits options such as to modify the topology scale in the canvas, to expand the size of the nodes presented in the simulation, to focus the visualization of the energy consumption in a specific mote, and to activate or deactivate visualization functionalities in the simulation process.
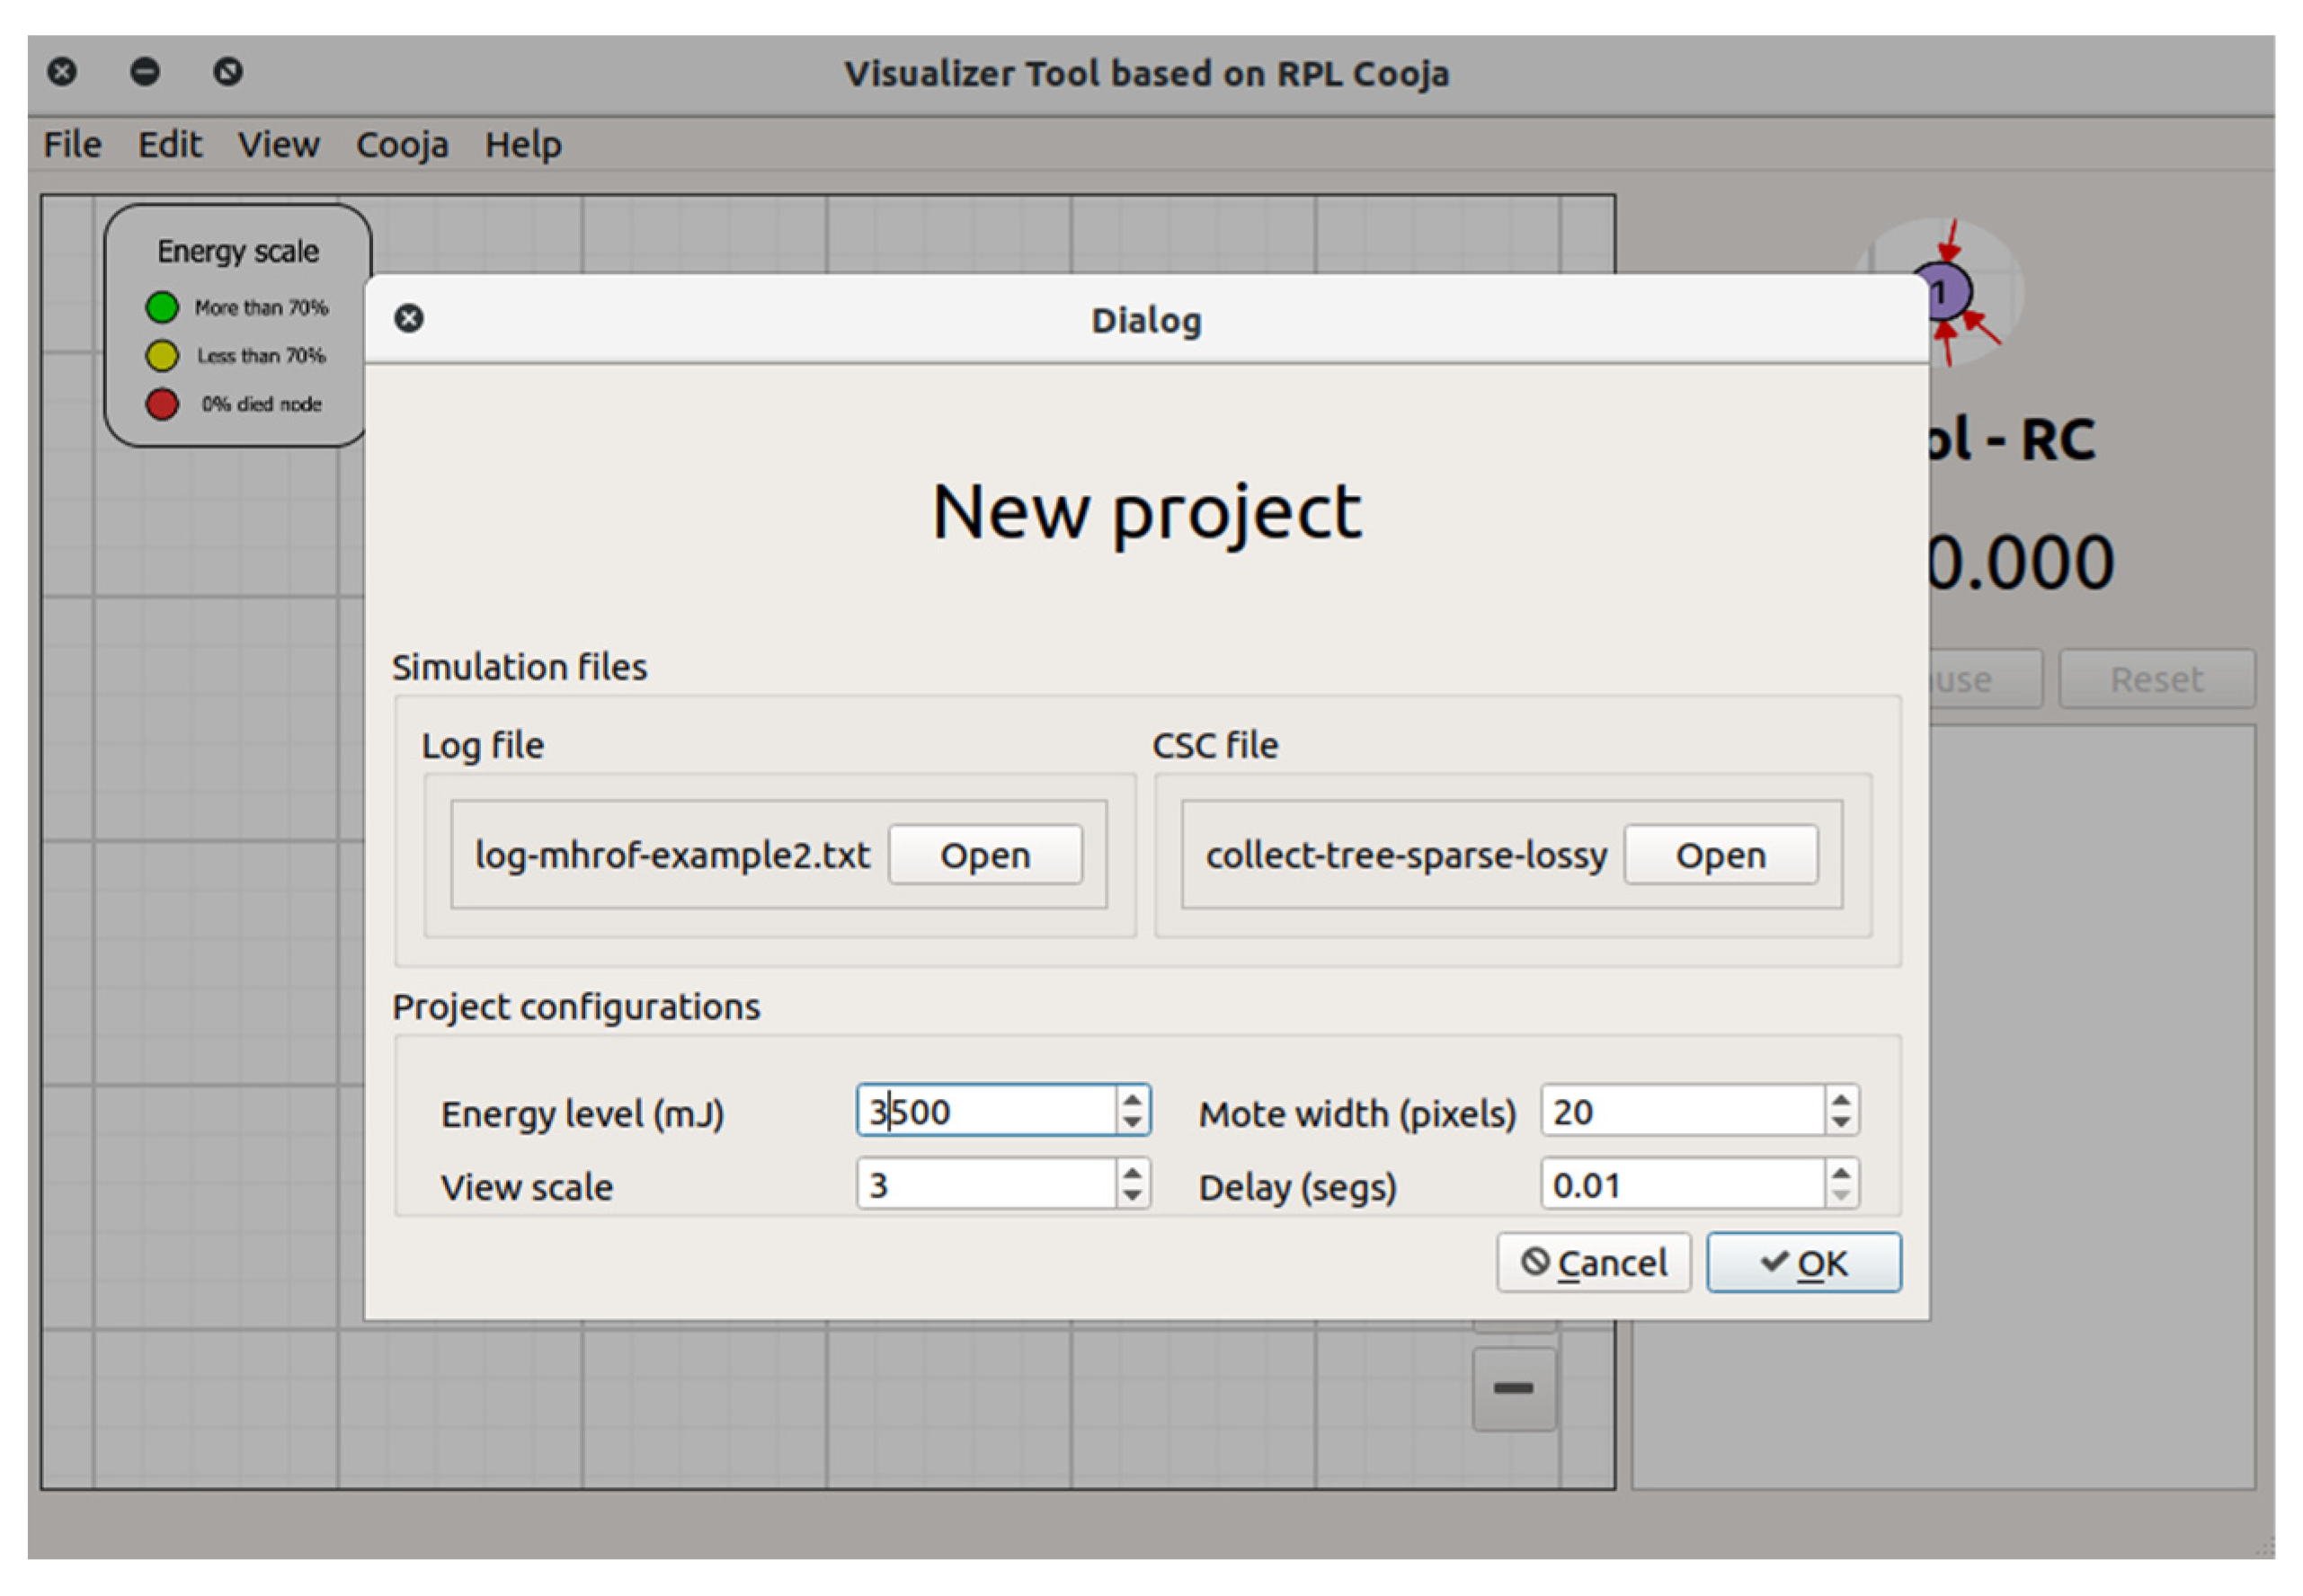
- Simulation Control: In the simulation control, components are defined functions to obtain results coming from the simulation to be reproduced. Some of these functions are: the process of managing of the Cooja files (log and csc files), options that will be applied in the simulation, a log in real time related with the executed actions in the reproduction of the simulation, and a graphical display of network topology changing in real time.
4.1.3. Cooja Stack
4.2. Features and Main Components
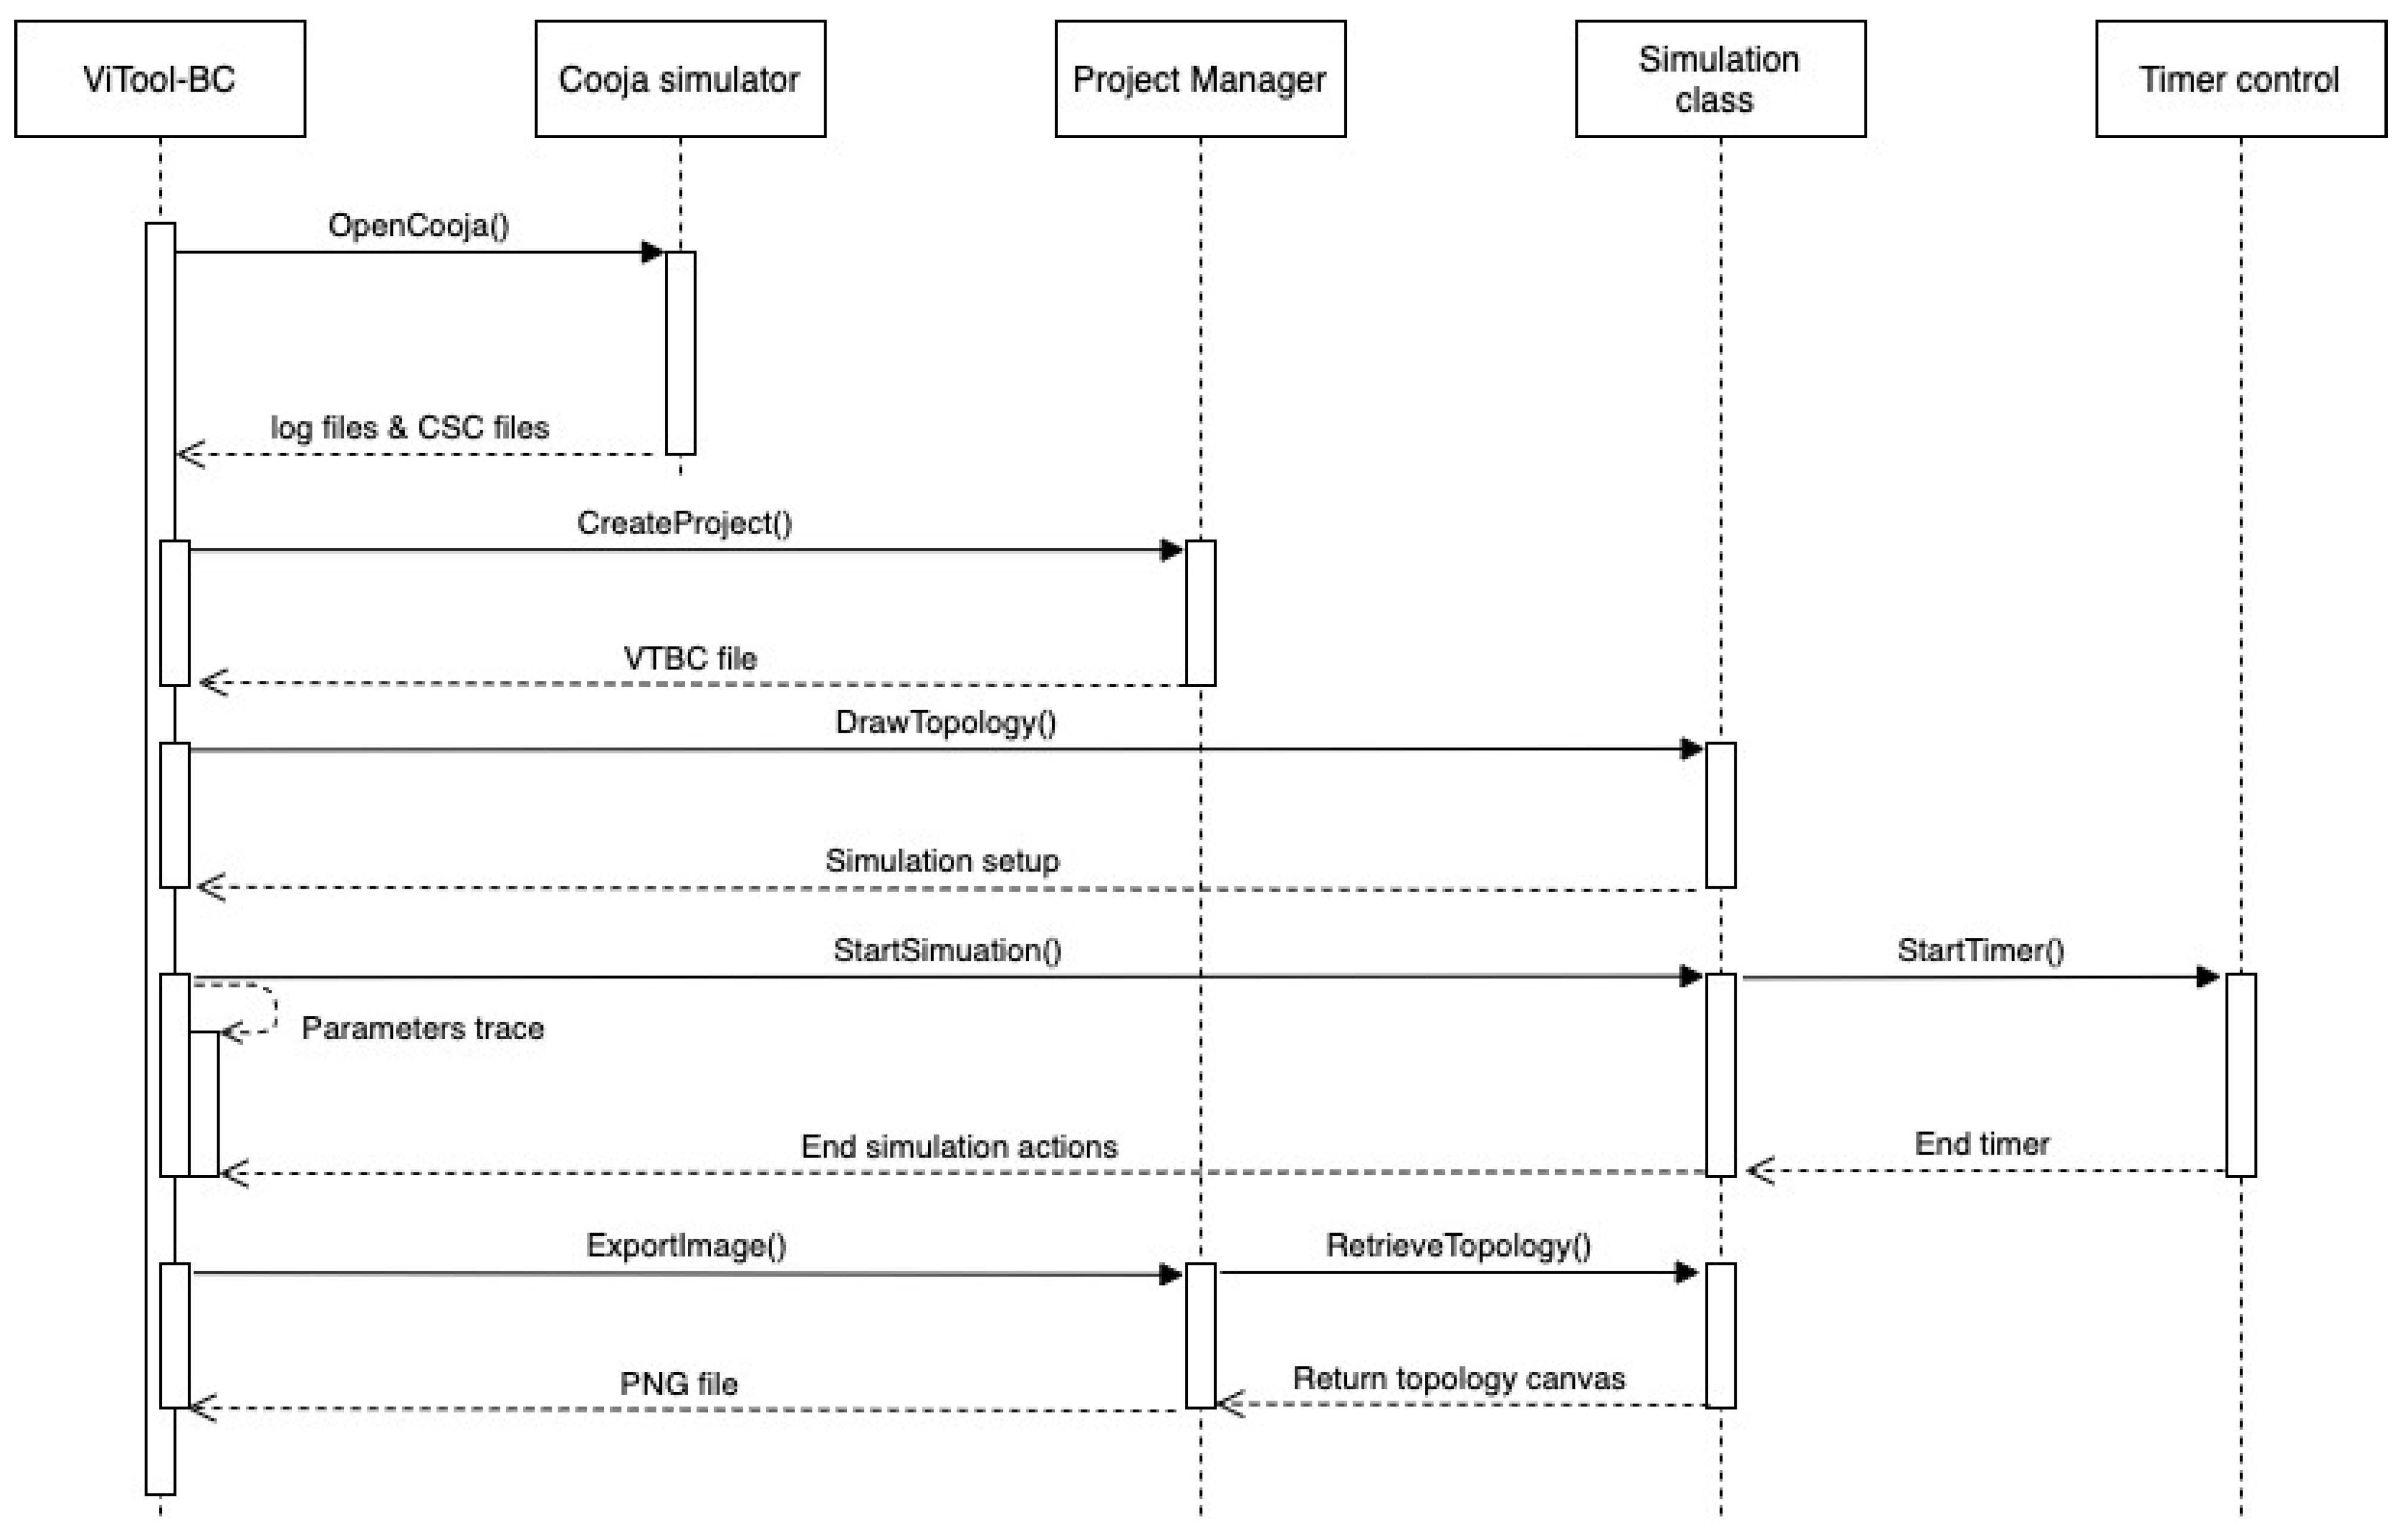
4.2.1. Project Manager
4.2.2. Timer Control
4.2.3. Project Manager
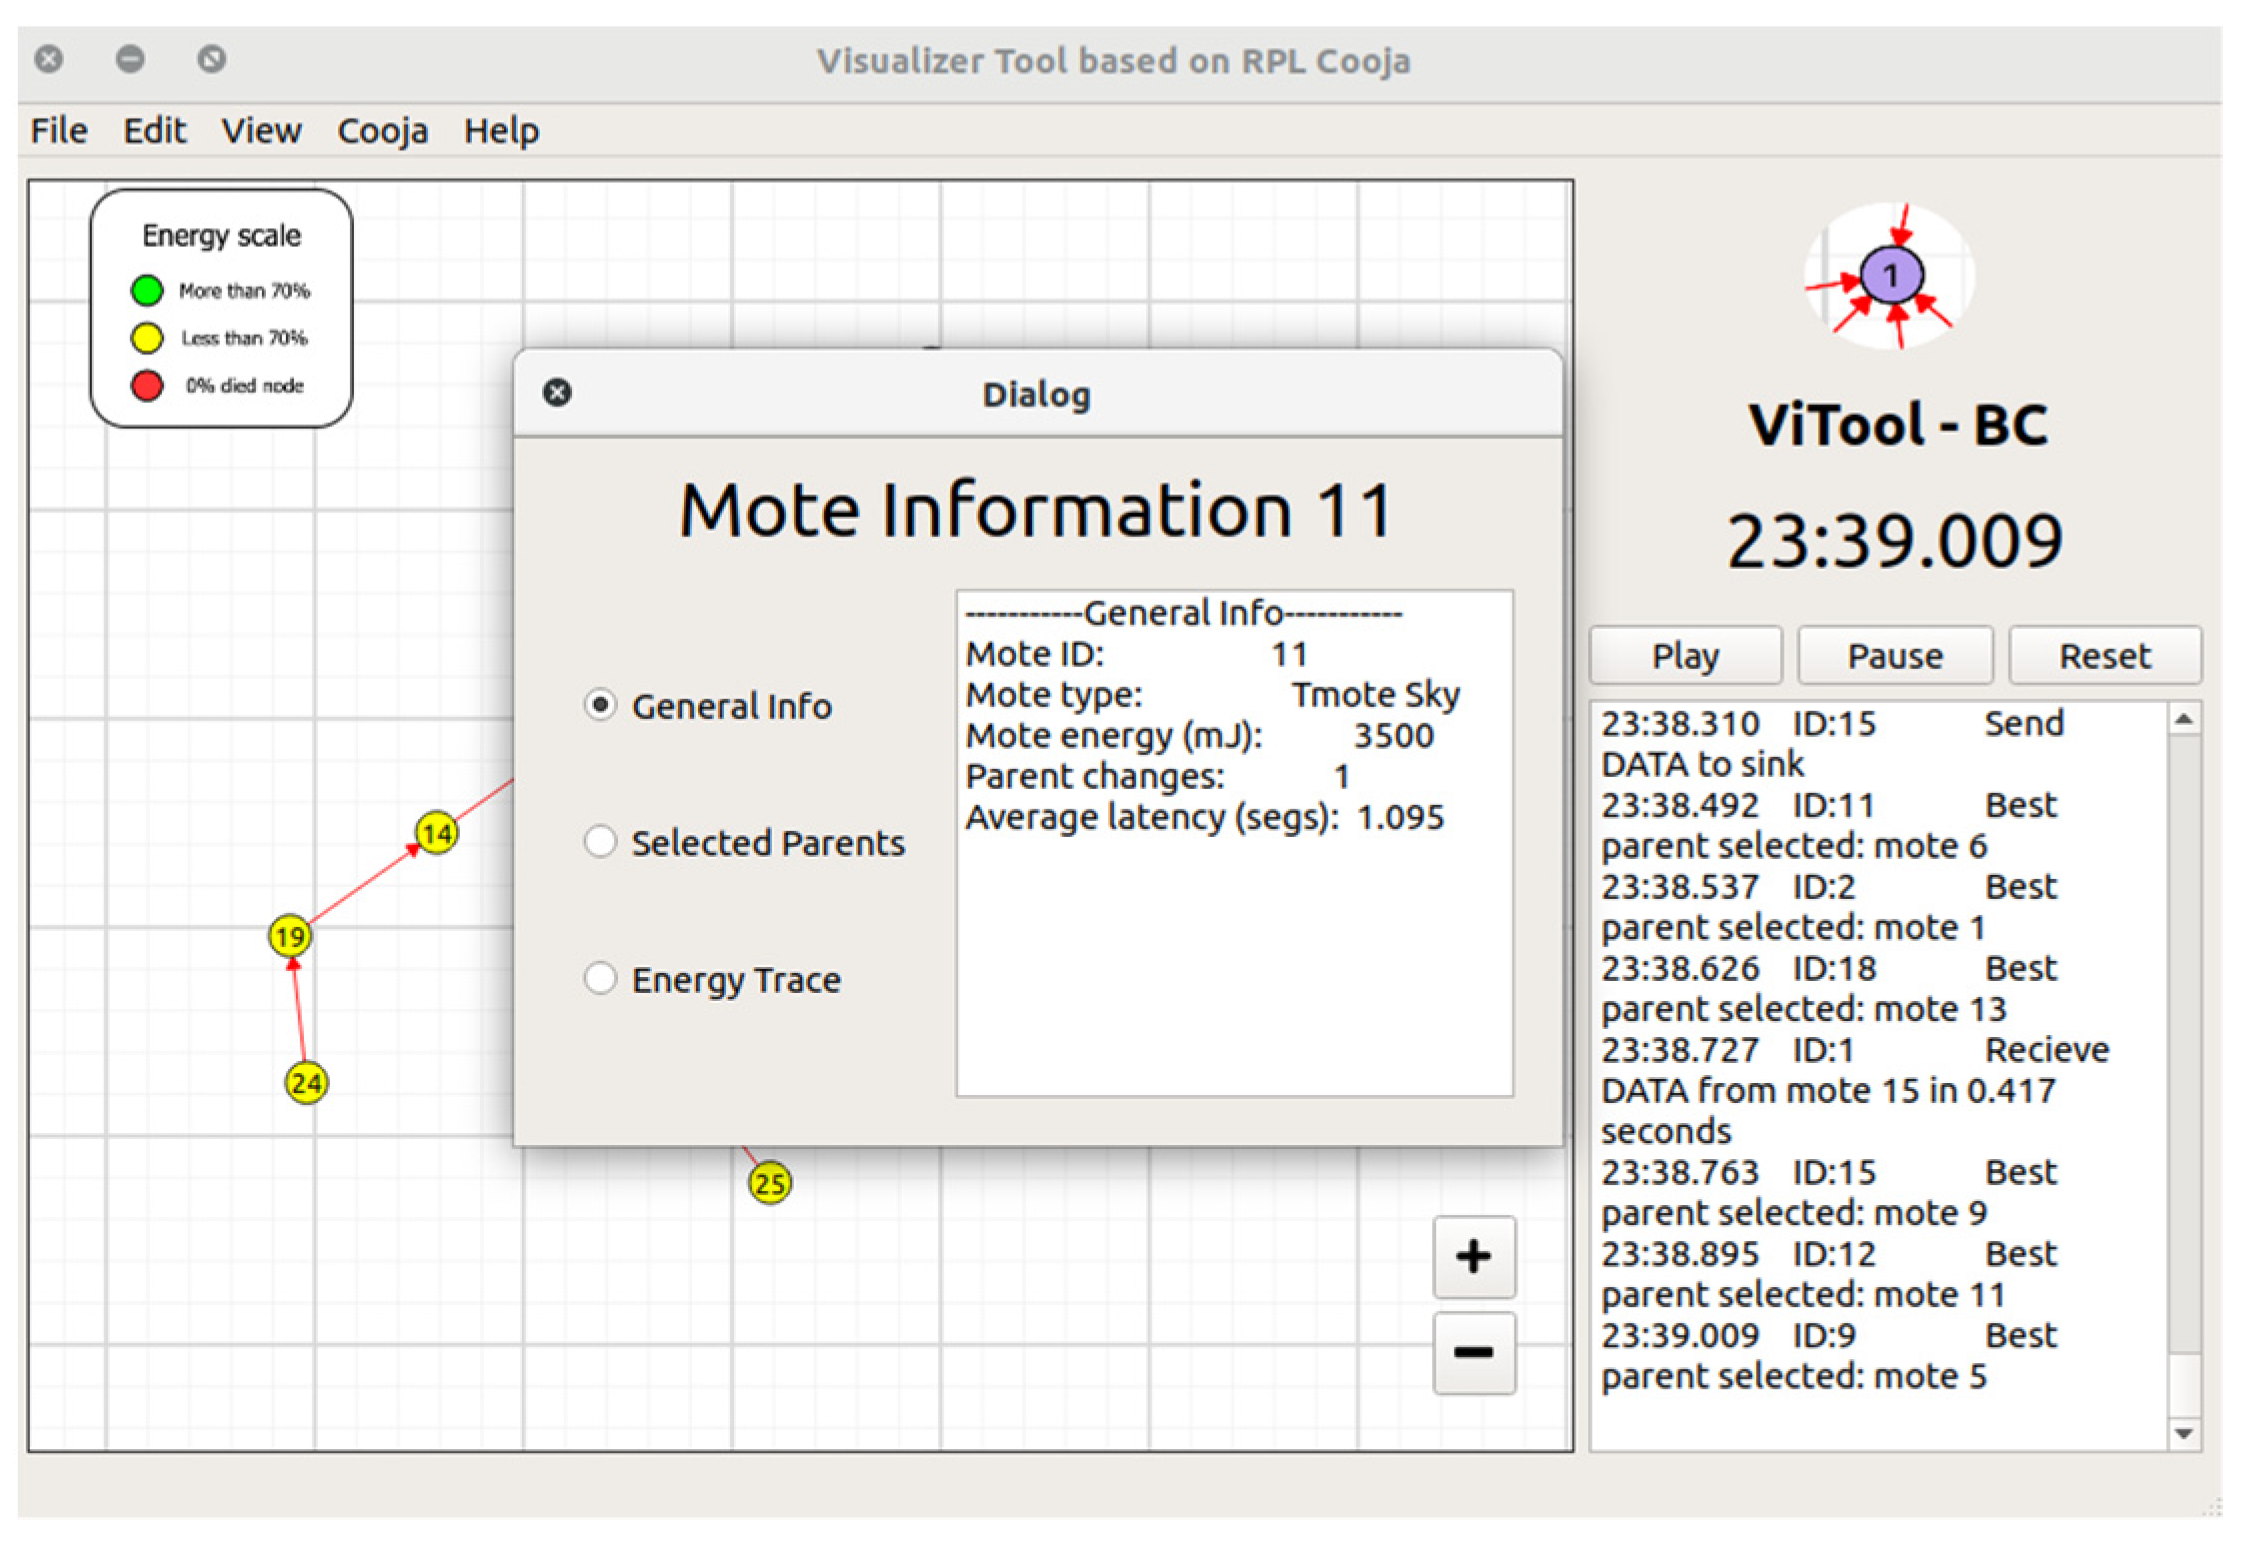
4.2.4. Tree View
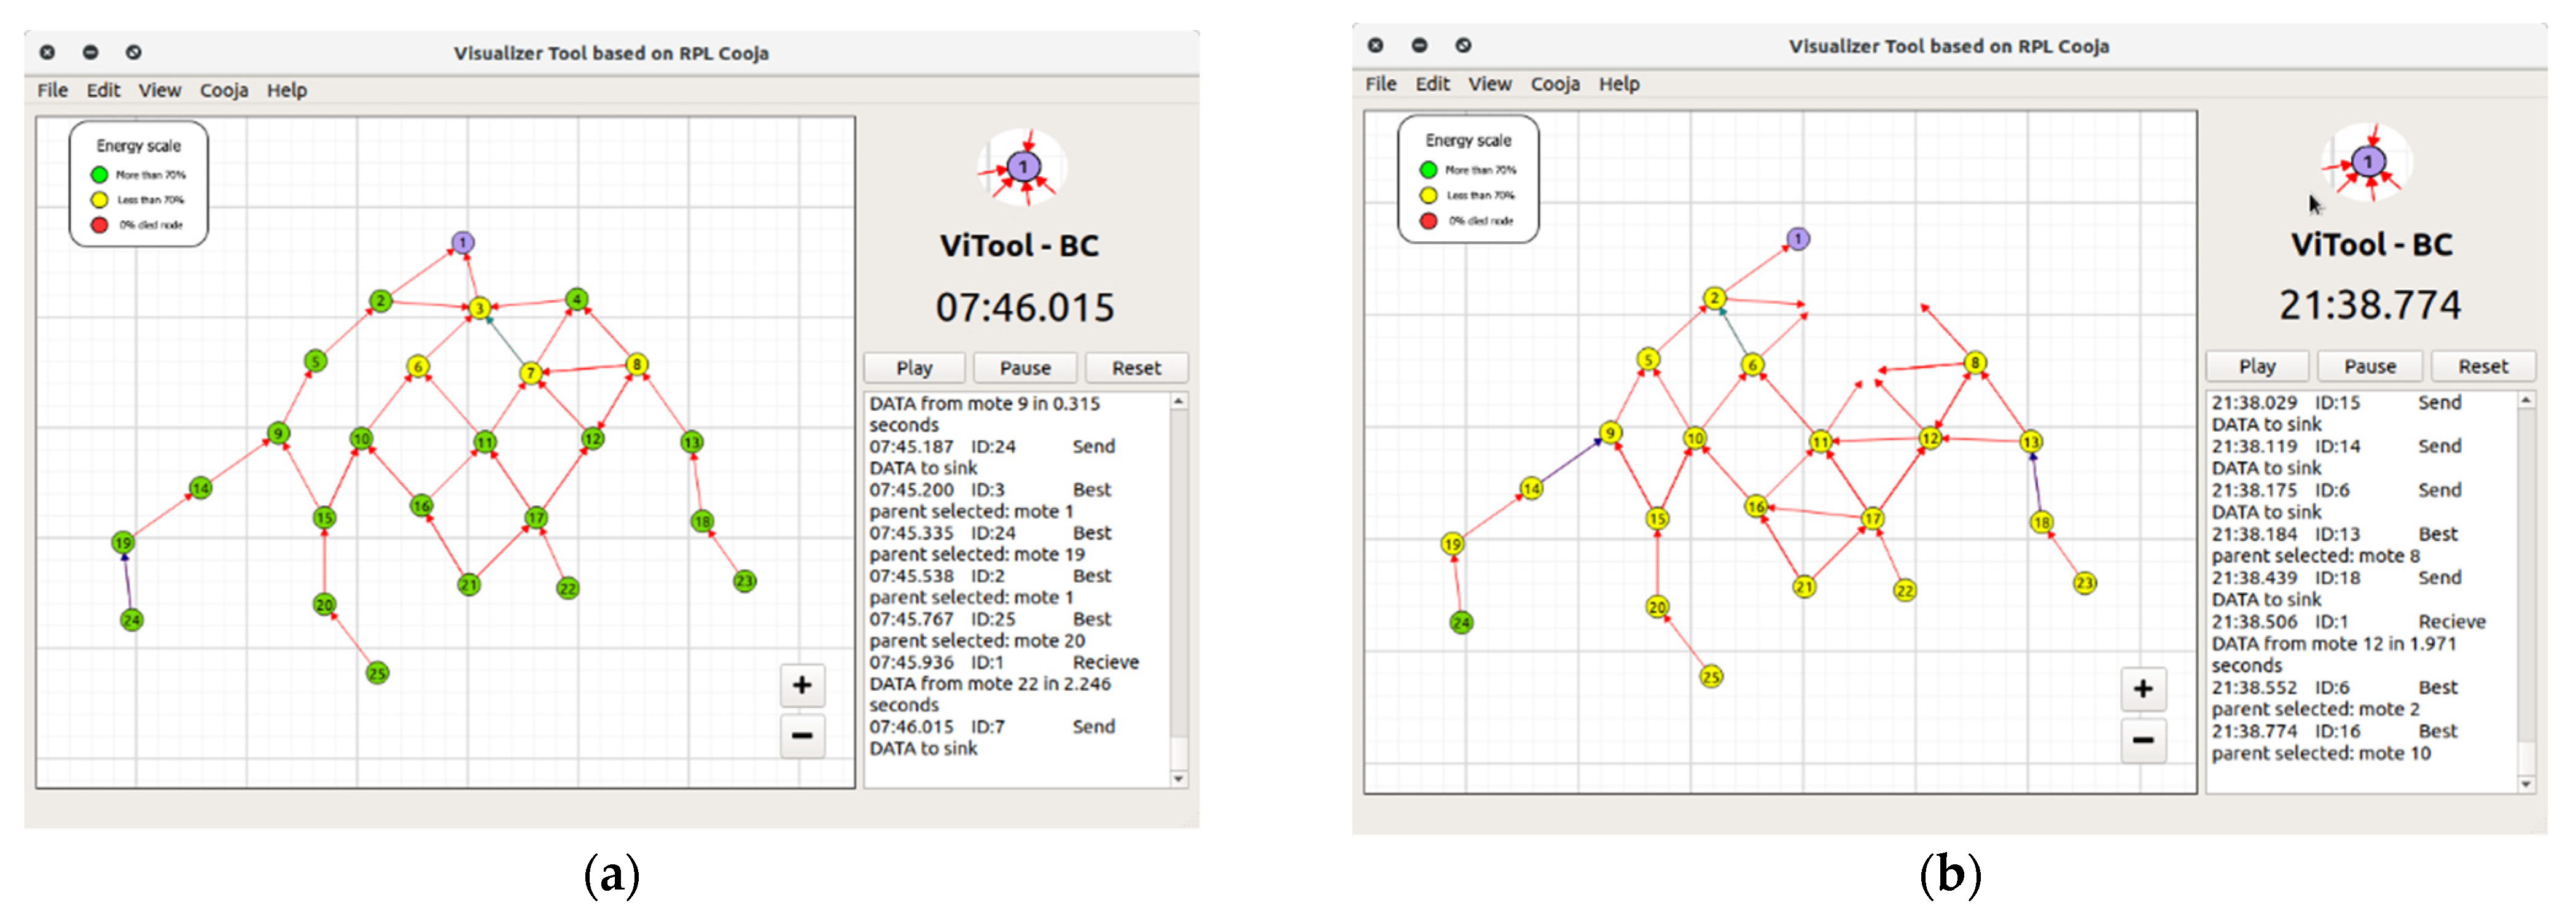
5. Case of Use: Experiment over RPL Protocol
- The considered energy was not enough. More than 50% of the nodes are in the yellow state (less than 70% of battery remaining) after the half of the simulation time.
- The network stability is maintained; the parent change and communication path changes of all nodes in the network are less than three, on average. These parameters are directly influenced by the disposition of the nodes in the analyzed area.
- The latency between the nodes is, on average, less than 2 s. The node in the down level takes more time to successfully communicate with the root because multiple hops are implied.
- At the time 19:01.252, node 3 lost all of its energy and was eliminated for the topology. This information allows the estimation of the network lifetime and could be analyzed and compared between protocols and variations of them.
6. Conclusions
Author Contributions
Funding
Conflicts of Interest
References
- Modieginyane, K.M.; Letswamotse, B.B.; Malekian, R.; Abu-Mahfouz, A.M. Software defined wireless sensor networks application opportunities for efficient network management: A survey. Comput. Electr. Eng. 2018, 66, 274–287. [Google Scholar] [CrossRef] [Green Version]
- Gulati, K.; Boddu, R.S.K.; Kapila, D.; Bangare, S.L.; Chandnani, N.; Saravanan, G. A review paper on wireless sensor network techniques in Internet of Things (IoT). Mater. Today Proc. 2021. [Google Scholar] [CrossRef]
- Rashid, B.; H, M. Rehmani. Applications of wireless sensor networks for urban areas: A survey. J. Netw. Comput. Appl. 2016, 60, 192–219. [Google Scholar] [CrossRef]
- Adeel, A.; Gogate, M.; Farooq, S.; Ieracitano, C.; Dashtipour, K.; Larijani, H.; Hussain, A. A Survey on the Role of Wireless Sensor Networks and IoT in Disaster Management. In Geological Disaster Monitoring Based on Sensor Networks; Durrani, T.S., Wang, W., Forbes, S.M., Eds.; Springer: Singapore, 2019; pp. 57–66. [Google Scholar]
- Nam, W.-H.; Kim, T.; Hong, E.-M.; Choi, J.-Y.; Kim, J.-T. A Wireless Sensor Network (WSN) application for irrigation facilities management based on Information and Communication Technologies (ICTs). Comput. Electron. Agric. 2017, 143, 185–192. [Google Scholar] [CrossRef]
- de Souza, P.S.S.; Rubin, F.; Hohemberger, R.; Ferreto, T.C.; Lorenzon, A.F.; Luizelli, M.C.; Rossi, F.D. Detecting abnormal sensors via machine learning: An IoT farming WSN-based architecture case study. Measurement 2020, 164, 108042. [Google Scholar] [CrossRef]
- Belghith, A.; S, M. Obaidat. Chapter 2—Wireless sensor networks applications to smart homes and cities. In Smart Cities and Homes; Obaidat, M.S., Nicopolitidis, P., Eds.; Morgan Kaufmann: Boston, MA, USA, 2016; pp. 17–40. [Google Scholar]
- Silva, B.N.; Khan, M.; Han, K. Towards sustainable smart cities: A review of trends, architectures, components, and open challenges in smart cities. Sustain. Cities Soc. 2018, 38, 697–713. [Google Scholar] [CrossRef]
- Shabbir, N.; Hassan, S.R. Routing Protocols for Wireless Sensor Networks (WSNs). In Wireless Sensor Networks; Sallis, P., Ed.; IntechOpen: Rijeka, Croatia, 2017. [Google Scholar]
- Tan, K.; Wu, D.; Chan, A.J.; Mohapatra, P. Comparing simulation tools and experimental testbeds for wireless mesh networks. Pervasive Mob. Comput. 2011, 7, 434–448. [Google Scholar] [CrossRef]
- Maamar, S. Evaluation of QoS parameters with RPL protocol in the Internet of Things. In Proceedings of the International Conference on Computing for Engineering and Sciences, Shanghai, China, 22–24 July 2017; pp. 86–91. [Google Scholar]
- Lera, I.; Guerrero, C.; Juiz, C. YAFS: A Simulator for IoT Scenarios in Fog Computing. IEEE Access 2019, 7, 91745–91758. [Google Scholar] [CrossRef]
- Barthel, D.; Vasseur, J.P.; Pister, K.; Kim, M.; Dejean, N. Routing Metrics Used for Path Calculation in Low-Power and Lossy Networks. In RFC 6551; IETF: Fremont, CA, USA, 2012. [Google Scholar] [CrossRef] [Green Version]
- Muñoz, A.; Gonzalez, J.; Maña, A. A Performance-Oriented Monitoring System for Security Properties in Cloud Computing Applications. Comput. J. 2012, 55, 979–994. [Google Scholar] [CrossRef]
- Serrano, D.; Ruíz, J.F.; Muñoz, A.; Maña, A.; Armenteros, A.; Crespo, B.G.-N. Development of Applications Based on Security Patterns. In Proceedings of the 2009 Second International Conference on Dependability, Manchester, UK, 21–22 May 2009; IEEE: Piscataway, NJ, USA, 2009; pp. 111–116. [Google Scholar] [CrossRef]
- Osterlind, F.; Dunkels, A.; Eriksson, J.; Finne, N.; Voigt, T. Cross-Level Sensor Network Simulation with COOJA. In Proceedings of the 2006 31st IEEE Conference on Local Computer Networks, Tampa, FL, USA, 14–16 November 2006; pp. 641–648. [Google Scholar] [CrossRef] [Green Version]
- Sarkar, A.; Murugan, T.S. Routing protocols for wireless sensor networks: What the literature says? Alex. Eng. J. 2016, 55, 3173–3183. [Google Scholar] [CrossRef] [Green Version]
- Bokde, N.D.; Peshwe, P.D.; Gupta, A.; Kulat, K.D. RemoteWSN: A novel technique for remotely visualizing connectivity in WSN working on a weight based routing algorithm. In Proceedings of the 2015 National Conference on Recent Advances in Electronics Computer Engineering (RAECE), Roorkee, India, 13–15 February 2015; pp. 92–95. [Google Scholar] [CrossRef]
- Qaqos, N.; Zeebaree, S.; Hussan, B. Opnet Based Performance Analysis and Comparison Among Different Physical Network Topologies. Acad. J. Nawroz Univ. 2018, 7, 48–54. [Google Scholar] [CrossRef]
- Al-khatib, A.A.; Hassan, R. Performance Evaluation of AODV, DSDV, and DSR Routing Protocols in MANET Using NS-2 Simulator. In Recent Trends in Information and Communication Technology; Springer: Cham, Switzerland, 2017; pp. 276–284. [Google Scholar]
- Bukhari, S.H.R.; Siraj, S.; Rehmani, M.H. NS-2 based simulation framework for cognitive radio sensor networks. Wirel. Netw. 2016, 24, 1543–1559. [Google Scholar] [CrossRef]
- Baidya, S.; Shaikh, Z.; Levorato, M. FlyNetSim: An Open Source Synchronized UAV Network Simulator Based on Ns-3 and Ardupilot. In Proceedings of the 21st ACM International Conference on Modeling, Analysis and Simulation of Wireless and Mobile Systems, Montreal, QC, Canada, 28 October 2018; pp. 37–45. [Google Scholar] [CrossRef]
- Hayamizu, Y.; Matsuzono, K.; Asaeda, H. CeforeSim: Cefore Compliant NS-3-Based Network Simulator. In Proceedings of the 2019 IEEE 27th International Conference on Network Protocols (ICNP), Chicago, IL, USA, 8–10 October 2019; IEEE: Piscataway, NJ, USA, 2019; pp. 1–2. [Google Scholar]
- Varga, A.; Hornig, R. An Overview of the OMNeT++ Simulation Environment. In Proceedings of the 1st International Conference on Simulation Tools and Techniques for Communications, Networks and Systems & Workshops, Marseille, France, 3–7 March 2008; ICST: Kolkata, India, 2008. [Google Scholar]
- Varga, A. A practical introduction to the OMNeT++ simulation framework. In Recent Advances in Network Simulation; Springer: Berlin, Germany, 2019; pp. 3–51. [Google Scholar]
- Udugama, A.; Förster, A.; Dede, J.; Kuppusamy, V.; Muslim, A.B. Opportunistic Networking Protocol Simulator for OMNeT++. arXiv 2017, arXiv:1709.02210. [Google Scholar]
- Sliwa, B.; Ide, C.; Wietfeld, C. An OMNeT++ based Framework for Mobility-aware Routing in Mobile Robotic Networks. arXiv 2016, arXiv:1609.05351. [Google Scholar]
- Levis, P.; Lee, N.; Welsh, M.; Culler, D. TOSSIM: Accurate and scalable simulation of entire TinyOS applications. In Proceedings of the 1st International Conference on Embedded Networked Sensor Systems, Los Angeles, CA, USA, 5–7 November 2003; pp. 126–137. [Google Scholar]
- Al-Roubaiey, A.; Sheltami, T.; Mahmoud, A.; Yasar, A. EATDDS: Energy-aware middleware for wireless sensor and actuator networks. Futur. Gener. Comput. Syst. 2019, 96, 196–206. [Google Scholar] [CrossRef]
- Mora-Merchan, J.M.; Larios, D.F.; Barbancho, J.; Molina, F.J.; Sevillano, J.L.; León, C. mTOSSIM: A simulator that estimates battery lifetime in wireless sensor networks. Simul. Model. Pract. Theory 2013, 31, 39–51. [Google Scholar] [CrossRef]
- Sabor, N.; Sasaki, S.; Abo-Zahhad, M.; Ahmed, S.M. A Graphical-based educational simulation tool for Wireless Sensor Networks. Simul. Model. Pract. Theory 2016, 69, 55–79. [Google Scholar] [CrossRef]
- Youssef, A.; Maheswaran, M.; Youssef, L. Wireless GINI: An educational platform for hosting virtual wireless networks. Softw. Pract. Exp. 2017, 47, 21–59. [Google Scholar] [CrossRef]
- Goyal, T.; Singh, A.; Agrawal, A. Cloudsim: Simulator for cloud computing infrastructure and modeling. Procedia Eng. 2012, 38, 3566–3572. [Google Scholar] [CrossRef] [Green Version]
- Son, J.; He, T.; Buyya, R. {CloudSimSDN}-{NFV}: Modeling and simulation of network function virtualization and service function chaining in edge computing environments. Softw. Pract. Exp. 2019, 49, 1748–1764. [Google Scholar] [CrossRef]
- Gupta, H.; Vahid Dastjerdi, A.; Ghosh, S.K.; Buyya, R. {iFogSim}: A toolkit for modeling and simulation of resource management techniques in the Internet of Things, Edge and Fog computing environments. Softw. Pract. Exp. 2017, 47, 1275–1296. [Google Scholar] [CrossRef] [Green Version]
- Contiki, O.S. Contiki: The Open Source Operating System for the Internet of Things. Wirel. Netw. 2018, 55, 1543–1559. [Google Scholar] [CrossRef]
- Sitanayah, L.; Sreenan, C.J.; Fedor, S. A Cooja-based tool for coverage and lifetime evaluation in an in-building sensor network. J. Sens. Actuator Netw. 2016, 5, 4. [Google Scholar] [CrossRef] [Green Version]
- Ferracuti, F.; Freddi, A.; Monteriù, A.; Prist, M. An Integrated Simulation Module for Cyber-Physical Automation Systems. Sensors 2016, 16, 645. [Google Scholar] [CrossRef] [PubMed] [Green Version]
- Bumb, A.; Iancu, B.; Cebuc, E. Extending Cooja simulator with real weather and soil data. In Proceedings of the 2018 17th RoEduNet Conference: Networking in Education and Research (RoEduNet), Cluj-Napoca, Romania, 6–8 September 2018; pp. 1–5. [Google Scholar] [CrossRef]
- Aminian, B.; Araújo, J.; Johansson, M.; Johansson, K.H. GISOO: A virtual testbed for wireless cyber-physical systems. In Proceedings of the IECON 2013-39th Annual Conference of the IEEE Industrial Electronics Society, Vienna, Austria, 10–13 November 2013; pp. 5588–5593. [Google Scholar]
- Cheong, E.; Lee, E.A.; Zhao, Y. Viptos: A Graphical Development and Simulation Environment for TinyOS-Based Wireless Sensor Networks. February 2006. Available online: http://www2.eecs.berkeley.edu/Pubs/TechRpts/2006/EECS-2006-15.html (accessed on 2 November 2005).
- Baldwin, P.; Kohli, S.; Lee, E.A.; Liu, X.; Zhao, Y.; Ee, C.T.; Zhou, R. Visualsense: Visual modeling for wireless and sensor network systems. Tech. Memo. UCB/ERL 2005, 5. [Google Scholar]
- Ptolemaeus, C. System Design, Modeling, and Simulation: Using Ptolemy II; Ptolemy. org: Berkeley, CA, USA, 2014; Volume 1. [Google Scholar]
- Cheong, E. PtinyOS: Simulating TinyOS in Ptolemy II. Ptolemy.org. 2004. Available online: http://ptolemy.org/books/Systems (accessed on 18 August 2021).
- Shu, L.; Hauswirth, M.; Chao, H.-C.; Chen, M.; Zhang, Y. NetTopo: A framework of simulation and visualization for wireless sensor networks. Ad. Hoc. Netw. 2011, 9, 799–820. [Google Scholar] [CrossRef]
- Ma, L.; Wang, L.; Shu, L.; Zhao, J.; Li, S.; Yuan, Z.; Ding, N. NetViewer: A Universal Visualization Tool for Wireless Sensor Networks. In Proceedings of the 2010 IEEE Global Telecommunications Conference GLOBECOM 2010, Miami, FL, USA, 6–10 December 2010; pp. 1–5. [Google Scholar] [CrossRef]
- Castillo, J.A.; Ortiz, A.M.; López, V.; Olivates, T.; Orozco-Barbosa, L. WiseObserver: A Real Experience with Wireless Sensor Networks. In Proceedings of the 3nd ACM Workshop on Performance Monitoring and Measurement of Heterogeneous Wireless and Wired Networks, New York, NY, USA, 31 October 2008; pp. 23–26. [Google Scholar] [CrossRef]
- Wang, Z.; Zhang, L.; Zheng, Z.; Wang, J. Energy balancing RPL protocol with multipath for wireless sensor networks. Peer-Peer Netw. Appl. 2018, 11, 1085–1100. [Google Scholar] [CrossRef]
- Summerfield, M. Rapid GUI Programming with Python and Qt: The Definitive Guide to PyQt Programming (Paperback); Pearson Education: London, UK, 2007. [Google Scholar]
- Bucanek, J. Model-view-controller pattern. In Learn Objective-C for Java Developers; Apress: New York, NY, USA, 2009; pp. 353–402. [Google Scholar]
- Gurgens, S.; Rudolph, C.; Mana, A.; Munoz, A. Facilitating the Use of TPM Technologies through S&D Patterns. In Proceedings of the 18th International Workshop on Database and Expert Systems Applications (DEXA 2007), Regensburg, Germany, 3–7 September 2007; pp. 765–769. [Google Scholar] [CrossRef]
- Muñoz, A.; Sánchez-Cid, F.; el Khoury, P.; Compagna, L. {XACML} as a Security and Dependability Pattern for Access Control in {AmI} environments. In Developing Ambient Intelligence; Springer: Paris, France, 2008; pp. 143–155. [Google Scholar]
- Sales, F.O.; Marante, Y.; Vieira, A.B.; Silva, E.F. Energy Consumption Evaluation of a Routing Protocol for Low-Power and Lossy Networks in Mesh Scenarios for Precision Agriculture. Sensors 2020, 20, 3814. [Google Scholar] [CrossRef]
- Avila, K.; Jabba, D.; Gomez, J. Security Aspects for Rpl-Based Protocols: A Systematic Review in IoT. Appl. Sci. 2020, 10, 6472. [Google Scholar] [CrossRef]
- Winter, T.; Thubert, P.; Brandt, A.; Hui, J.W.; Kelsey, R.; Levis, P.; Alexander, R.K. RPL: IPv6 Routing Protocol for Low-Power and Lossy Networks. RFC 2012, 6550, 1–157. [Google Scholar] [CrossRef]


| Tool | Programming Language | Support Platforms | Advantages | Disadvantage |
|---|---|---|---|---|
| Viptos [41] | C y nesC | Tiny OS stack and Ptolemy II environment | -Additions of models through Ptolemy II. -It is an editing environment over nesC files. -Packet level simulation. | -TinyOS and TOMSSIM dependency. -Multiple compilation files and base programs for execution -Routing protocols and its visualization is not supported. |
| NetTopo [45] | Java | Not specified, but considered the used of external Wrappers | -Control of multiple network parameters such as energy consumption, bandwidth Management, etc. -Extensibility and API support for modified the behavior of a WSN. -Support real device connection and management. | -Algorithm-oriented, not consider the mote operation itself. -Requires externals addons for support others mote platforms |
| NetViewer [46] | Java | No specified | -Packet analysis. -Topology construction draw. -Replay module for historical actions of the simulation. | -It is an independent tool that has not specified the real mote controllers that can be executed. -The energy consumption is not considered. |
| mTOMSSIM [30] | C | Tiny OS stack | -Considered the Battery level for more real simulations. -Support indoor and outdoor environments. | -Requires the TOMSSIM simulator execution. |
| WiseObserver [47] | C# | No specified | -Parameters charts by node. -Interpolation maps of the topology. -Evolution videos and report from simulation. | -It is an independent tool that has not specified the real mote controllers that can be executed. |
| ViTool-BC | Python | Contiki OS stack | -Energy trace and modelling. -Topology construction -Network parameters management by node. -Heat map of energy consumption | -Required files generated previously on Cooja -Not allow modified topology environment into the GUI. |
| Parameters | Value |
|---|---|
| Operative System | Contiki 2.7 |
| Type of node | TMote sky |
| Routing protocol | RPL |
| MAC/Adaptation layer | ContikiMAC/6LowPAN |
| Simulation time | 30 min |
| Battery level considered | 3500 mJ |
| Transmission radio | 70 m |
| Time for periodic sent of data | 30 seg |
| RPL parameter | MinHopRankIncrease = 256 |
Publisher’s Note: MDPI stays neutral with regard to jurisdictional claims in published maps and institutional affiliations. |
© 2021 by the authors. Licensee MDPI, Basel, Switzerland. This article is an open access article distributed under the terms and conditions of the Creative Commons Attribution (CC BY) license (https://creativecommons.org/licenses/by/4.0/).
Share and Cite
Jabba, D.; Acevedo, P. ViTool-BC: Visualization Tool Based on Cooja Simulator for WSN. Appl. Sci. 2021, 11, 7665. https://doi.org/10.3390/app11167665
Jabba D, Acevedo P. ViTool-BC: Visualization Tool Based on Cooja Simulator for WSN. Applied Sciences. 2021; 11(16):7665. https://doi.org/10.3390/app11167665
Chicago/Turabian StyleJabba, Daladier, and Pedro Acevedo. 2021. "ViTool-BC: Visualization Tool Based on Cooja Simulator for WSN" Applied Sciences 11, no. 16: 7665. https://doi.org/10.3390/app11167665
APA StyleJabba, D., & Acevedo, P. (2021). ViTool-BC: Visualization Tool Based on Cooja Simulator for WSN. Applied Sciences, 11(16), 7665. https://doi.org/10.3390/app11167665