1. Introduction
Technological development and demonstration projects for autonomous shipping have been carried out around the world since the 1990s. Although fully robotic ships are distant in the future, it is not in doubt whether they will arise, but when [
1].
There is a growing interest in the topic of unmanned, fully autonomous ships. This idea could be a milestone in the advancement of the maritime industry. The concept of Unmanned Autonomous Vehicles UAV or, more precisely, Unmanned Maritime Vehicles [
2], has been well known at an academic level for a while. Recently, the industry has begun developing small-scale [
3] and full-scale vessels for the bulk [
4,
5,
6,
7,
8,
9], container [
10,
11,
12,
13,
14], ferry [
15,
16,
17], inland [
18,
19,
20], offshore [
21] and tug [
22,
23,
24] sectors. Detailed surveys [
25] were presented in the scope of: the opportunities in logistics [
26], the development of autonomous technologies [
27] and the accuracy in performing planned trajectories [
28].
An unmanned ship is defined by the bridge being unmanned in periods (periodically) or continuously. This may be performed with the help of autonomy but may also be implemented by direct remote control. Thus, autonomous and unmanned are at least partly independent. The degree of advancement of technological solutions and the level of crew reduction adopted in the currently implemented UMV projects categorize them into specific automation ranges. The categorization of systems in terms of the level of advancement of technological solutions was proposed by: Lloyd’s Register [
29], Rolls-Royce [
30], Bureau Veritas, Norwegian Forum for Autonomous Ships (NFAS), Ramboll and Core, UK Marine Industries Alliance [
31], assuming the lowest level of automation as “All action and decision-making performed manually” and the highest as “The computer does everything autonomously, operation are unsupervised by a human”. On the other hand, the ranges of automation resulting from the presence of the ship’s crew and the general approach to the problem were presented [
2].
The official classification of the UMV, which was officially named Marine Autonomous Surface Ships (MASS), in terms of automation level of the applied system, is presented in the working group report of IMO Maritime Safety Committee 100th session MSC 100/WP.8. According to this scale, degree 1 of autonomy involves seafarers onboard to operate and control the shipboard systems and functions. Under degrees 2 and 3, the ship is controlled and operated by remote control operators from another location. Seafarers are available onboard to take control in degree 2, whereas the ship is unmanned and remotely controlled in degree 3. In degree 4, the ship is fully autonomous as the operating system will be able to make decisions and determine actions by itself and operate independently of direct human interaction [
32].
The analysis of voyage phases of modern UMVs from the point of view of human presence on board showed that the passage of the ship in a restricted area as well as mooring, unberthing and turning maneuvers will not be fully automatic in the near future without assurance of emergency management, monitoring and taking over the remote control. This is due to a number of limitations or the inability to perform the tasks [
26], including ensuring safe e-navigation by fully autonomous systems during maneuvers in restricted areas [
2,
6,
30].
Due to the above, the institutions involved in the legislative process accompanying the development of the autonomous ships sector developed and implemented a number of guidelines for MASS operation. The most important of them have been published by, among others: IMO [
33,
34], DNV [
35], EMSA [
36] or ClassNK [
37].
The guidelines indicate, inter alia, that for tests of autonomous and remote-controlled ships in restricted areas, it is required to monitor the parameters of the vessel’s movement by the Remote Operation Station (ROC) in an efficient and effective way. The tools used should provide a high level of situational awareness (SA) to the MASS operator. In the case of navigation in a restricted area, enable the remote vessel to be controlled, and in case of an emergency, enable it to take full control of the autonomous vessel. The system that performs this task is referred to as an unmanned look-out [
6].
Remote-controlled ships interact and communicate with human-operated systems. In this way, human operators carry out an e-navigation and continuously monitor the vessel from the ROC to avoid accidents. The onboard systems follow well-established international regulations, whereas the implementation of ROCs is not standardized, and companies develop their own [
38].
The system must ensure a proper lookout at all times [
35]. The ROC e-navigation system must be at least equivalent to the function of an on-board human look-out as per COLREGs Rule 5, SOLAS Reg. 24, and the STCW. For monitoring and remote control, it is enough that the system transfers sufficient visual and sound data to the ROC.
The level of the operator’s situational awareness in the ROC in terms of the ship’s position in space depends largely on the type of navigation information and the form of its presentation, i.e., generally on the Human–Machine Interface (HMI) used. A literature review from the maritime perspective, based on solutions from various areas of HMI, is presented [
38].
The analysis of the literature of the MASS systems listed in this section in terms of the tools used in Autonomous Navigation Systems (ANS) showed that the most frequently used Human–Machine Interface used in e-navigation to provide situational awareness to the operator in terms of the position and orientation of the ship in restricted areas are:
top-view, two-dimensional graphic representation of the ship (popular in ECDIS, DP and pilot systems) enriched with alphanumeric data obtained from sensors fusion;
cameras image enriched with elements in augmented reality technology (AR).
Research shows that the current e-navigation systems used in ROC provide a limited scope for the SA, as expressed in the model Goal-Based Gap Analysis (GBGA) [
39] and research on human factor issues for autonomous ships purposes [
38,
40,
41,
42].
The report of the 58th session of the Subcommittee on Navigation Safety (NAV) [
43] also refers to SA in its discussion of various user gaps and initial potential solutions for the operational areas of e-navigation solutions; some of the solutions identified could possibly also be applied to the field of MASS, for instance, the integrated presentation of available information. Research has shown that there is no harmonized presentation of local information to increase SA for ROC services for remote vessel operation [
6].
It was noted that on-board navigation systems could, for example, benefit from better integration of own ship sensors and standard user interfaces, while the shore management could benefit from more comprehensive but easily understandable data provided by a seamless information transfer [
6,
30] or by its augmentation with the use of 3D Mixed Reality (MR) features [
22].
MR technology allows the ship’s environment to be recreated in 3D on shore from real-time ship data. This can be conducted using no more data than the current data sent to the ROC. By placing the ship into a 3D recreation of the world, one can gain SA in a more natural and traditional way by developing an enhanced understanding of the 3D space surrounding the ship. This will facilitate a smoother transition into an actual reality provided during direct control and other real-time video transfers by reducing the psychological distance and increase distance measurements [
44,
45].
With regard to the above authors present, a navigational information real-time Augmented Virtuality (AV—the component of MR) display method, using geometric 3D virtual models, created at the stage of system’s database development, shown in a perspective and/or parallel 2D view on an electronic device screen. The method assumes a possibly faithful representation of the environment and the actual SA via the ROC Decision Support System (DSS) interface during the ship maneuvers in a restricted area. A detailed description of the method was presented to the reader in the previous publication [
46]. This paper presents a study of the impact of the method of navigational information display using augmented virtuality on the safety of navigation for selected vessels, whose types are currently the subject of research in the field of MASS.
2. Methodology
It was impossible to investigate the impact of the method of displaying navigation information in the technology of augmented virtuality on the safety of maneuvers in real conditions. Maneuvering the ship in real conditions on the basis of information obtained only from the use of the described method was unacceptable in terms of the safety of the maneuvering ship. Moreover, conducting such tests in the prototype phase was economically unjustified.
Due to the above, in order to investigate the influence of the method of displaying navigation information in the technology of augmented virtuality on the safety of maneuvers performed on the basis of indications of the spatial decision support system (SDSS), a simulation experiment was carried out.
The experiment consisted of the performance by 20 navigators with a valid watch officer or captain diploma of a series of separate trials using the simulation environment model and other sources of navigation information commonly available on the bridge in various maneuvering scenarios. The traffic parameters recorded during the trials were subjected to comparative analysis in terms of selected navigation safety criteria. All simulation trials took place in local waters, well-known to each participant of the study.
2.1. Test Bed
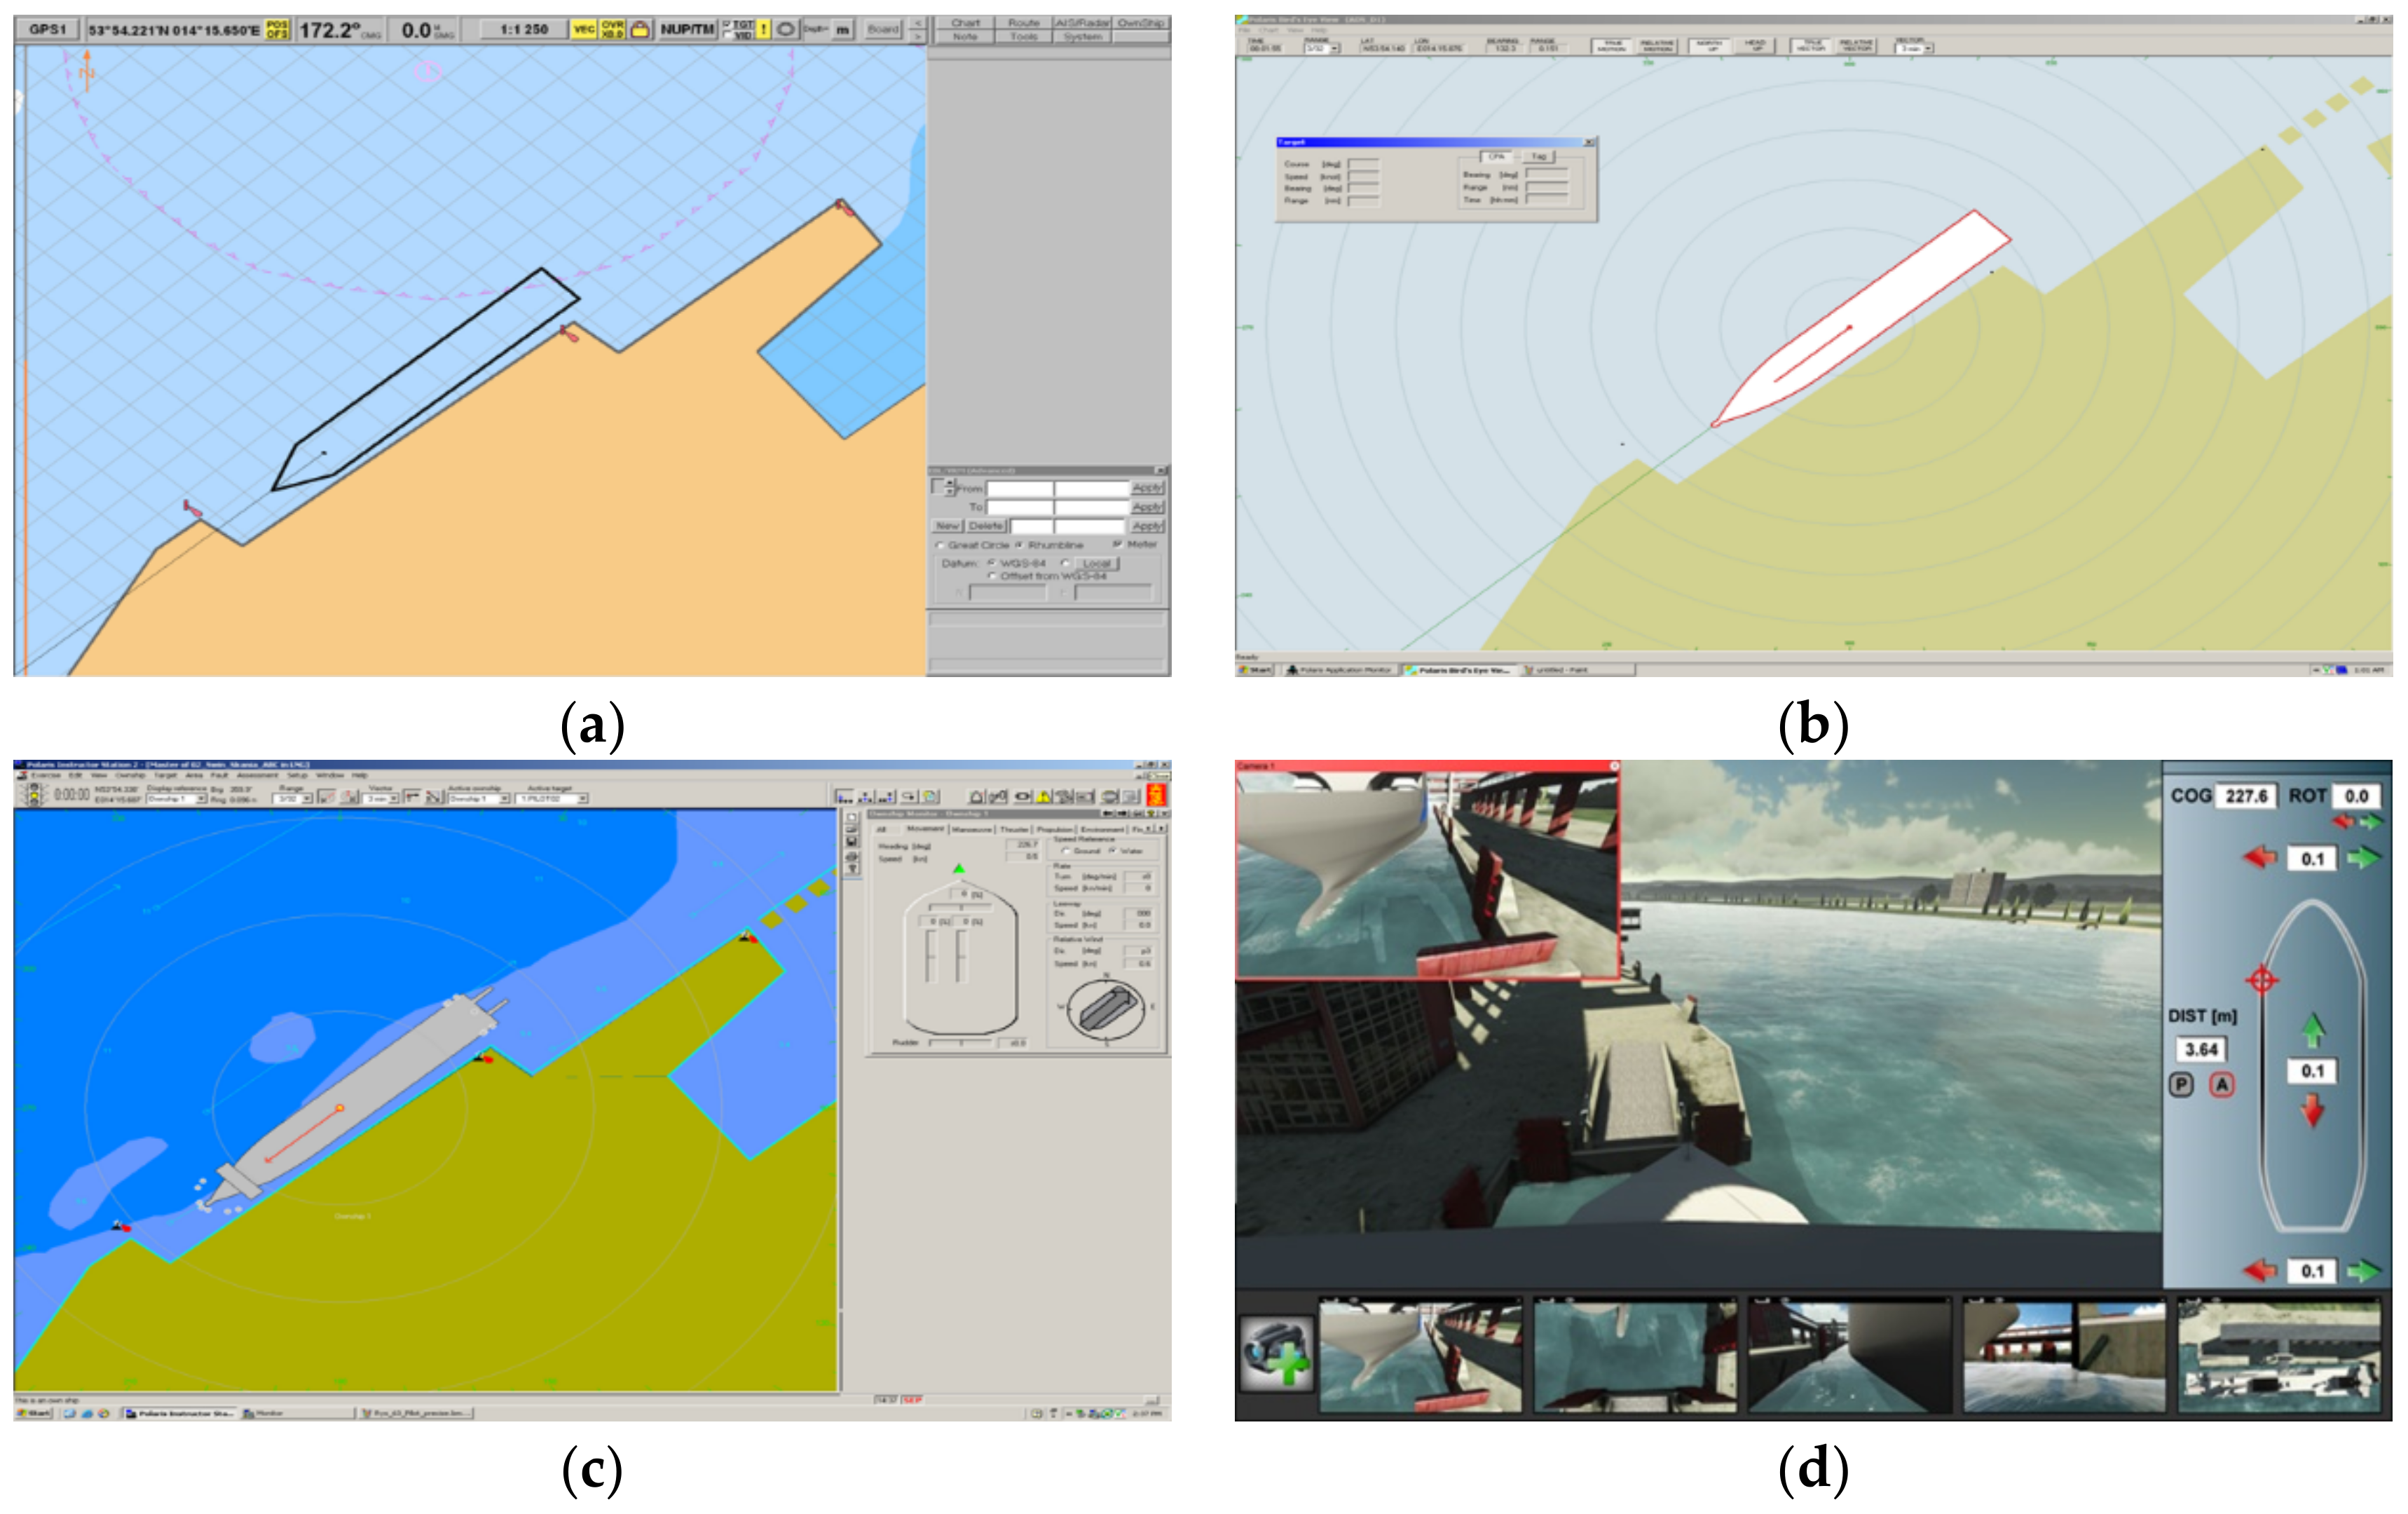
The simulation tests were carried out on a certified Polaris Navigation and Maneuvering Simulator by Kongsberg Maritime AS (Kongsberg, Norway), located at the Department of Marine Simulations at the Maritime University of Szczecin. The maneuvering simulator with an implemented simulation model of the vessel’s movement was equipped, in addition to standard navigation and maneuvering devices and visual station for environment imaging, SDSS such as:
The ECDIS decision support system in the form of the electronic navigational chart (ENC), 1:4000 scale (
Figure 1a);
The system of decision support with navigational display, with parallel top view projection, with a maximum contour of the vessel, was preliminarily called (Pmax) (
Figure 1b);
The system of decision support with navigational display, realized in the parallel top view projection, with the contour of the vessel on the theoretical plane of contact with the shore, labeled Pilot_precise (Pprecise) (
Figure 1c);
The spatial decision support system with the implemented display method in augmented virtuality technology, denoted by AV (
Figure 1d), the construction of which has been described [
46].
The test stand used in the simulation studies is shown in
Figure 2.
In order to eliminate errors in the indications of individual SDSSs, the process of calibration and verification of their indications in terms of mapping the shape and scale of objects as well as their position and orientation was carried out. This process consisted of exporting databases to one graphic environment, where the shape and scale of each object were verified. The re-exported objects were verified in terms of the correctness of their position and orientation, using the navigation tools built into individual decision support systems.
2.2. Navigation Safety Assessment Criteria
To conduct a simulation experiment with the use of the navigator’s spatial decision support system with the implemented method of displaying information in AV technology, detailed and general research assumptions were defined.
Depending on the variant of the runs in the simulation experiment (described in detail later in this section), the following criteria were adopted as a measure of the evaluation of a series of simulation tests:
The primary (superior) criteria for the assessment of navigational safety, i.e.,:
the average maneuvering area of the ship estimated for the confidence coefficient 0.95, determined by the estimation of the interval boundaries, which at 95% probability will cover the true value of the mean distance from the reference point center;
maximum maneuvering area of the ship, where the calculation is based on the determination of maximum distances of ship’s contour points in a given sector, from the determined coordinate of the center of the adopted reference point and using those for further analysis;
resultant value of vessel’s speed determined at the moment of ship’s hull contact with a fender (modified criterion of the kinetic energy of the first contact with the shore);
the value of the minimum distance of the ship’s hull from the navigational obstacle.
Secondary (subordinate) criterion for assessing the efficiency of maneuvering, i.e., maneuvering time.
The secondary criterion of assessment of the maneuvering efficiency was applied in the analysis when it was impossible to unequivocally assess recorded movement parameters using the primary criterion.
2.3. Detailed Assumptions of Simulation Study (Simulation Scenarios)
The simulation study utilized models of real ships; their parameters can be found in any generally available database of merchant ships. Maneuvering variants for the constructed models of ships, corresponding to the actual navigational situations in the studied waters, were determined with the use of an expert survey method. The study consisted of assigning five different types of maneuvers to the given units, using the existing devices of the integrated bridge and the developed spatial decision support system with the implemented method of imaging in AV technology, which, according to the expert, were the most appropriate to be performed in the studied area, which was the port of Świnoujście, located in the north-western part of Poland, in the Baltic Sea basin. The number of questionnaires was defined as n = 20. Each time the study was preceded by the expert acquainting with the developed method.
The analysis of the results of the expert study made it possible to identify variants of maneuvers carried out under the scenarios in the simulation experiment in question. The scenarios were built, taking into account the maneuvers with the highest scores for a given unit. For the towed train, 2 variants with the highest scores were adopted: unberthing and turning. The unit-simulation maneuver configuration matrix is presented in
Table 1.
2.3.1. Scenario 1. Container Ship
The simulation test scenario assumed that experts would perform a series of simulation passages consisting of safe berthing of the container ship Green Breeze, port side alongside Hutników Quay in the port of Świnoujście (
Figure 3).
The maximum contour of the ship presented in the Pilot_max system overlapped with the collision contour presented in the Pilot_precise system. Therefore, simulation passages were conducted for one system, assumed to be more accurate, i.e., Pilot_precise.
The detailed assumptions of Scenario 1 were as follows:
Objective to be achieved: The lowest resultant value of the speed at the moment of contact of the ship’s hull with the fender while achieving the shortest possible maneuver time.
Main ship parameters:
- ◦
LOA = 121.4 m, breadth = 20.8 m, draught = 6.88 m;
- ◦
Displacement = 11,250 t;
- ◦
Block coefficient = 0.709;
- ◦
Main engine: 1 × diesel, total power = 4000 kW;
- ◦
Max speed = 14.2 kn;
- ◦
Type of propulsion: 1 × fpp, clockwise;
- ◦
Number of rudders: 1;
- ◦
Max rudder angle = 35.0 deg.;
- ◦
Number of thrusters: 1;
- ◦
Bow thruster power = 360 kW.
Navigational-maneuvering conditions:
- ◦
The initial position of the ship: parallel to berth, distance—two ship’s breadths from Hutników Quay;
- ◦
ship’s final position: Hutników Quay;
- ◦
initial SOG: longitudinal vw = 0.0 kn, transverse to port side vp = 0.5 kn;
- ◦
heading: HDG = 200°.
The criteria used for assessment:
- ◦
Primary: value of the resultant speed of the ship determined at the moment of contact with a fender;
- ◦
Secondary: efficiency of maneuvering—time length of maneuvers.
The moment of measuring significant parameters: contact of the hull of the ship with a fender.
The types of displays used, the name of the series and the number of trials in a given series of the Scenario 1 are presented in the
Table 2.
2.3.2. Scenario 2. General Cargo Ship
The simulation test scenario assumed that experts would perform a series of simulation trials consisting of safe berthing at an angle to the shore of the general cargo ship Arklow River, using a spring line, to Chemików Quay in the port of Świnoujście (
Figure 4).
The detailed assumptions of Scenario 2 were as follows:
Objective to be achieved: The lowest resultant value of the speed at the moment of contact of the ship’s hull with the fender while achieving the shortest possible maneuver time.
Main ship parameters:
- ◦
LOA = 90 m, breadth = 14 m, draught = 5.7 m;
- ◦
Displacement = 5906 t;
- ◦
Block coefficient = 0.853;
- ◦
Main engine: 1 × diesel, total power = 1499 kW;
- ◦
Max speed = 12 kn;
- ◦
Type of propulsion: 1 × cpp, counter-clockwise;
- ◦
Number of rudders: 1;
- ◦
Max rudder angle = 45.0 deg.;
- ◦
Number of thrusters: 1;
- ◦
Bow thruster power = 250 kW.
Navigational-maneuvering conditions:
- ◦
the initial position of the ship: 30° angle, distance of one length and two breadths of the ship from Chemików Quay;
- ◦
the ship’s final position: Chemików Quay;
- ◦
initial SOG: longitudinal forward vw = 0.5 kn, transverse vp = 0.0 kn;
- ◦
heading: HDG = 159°.
The criteria used for assessment:
- ◦
Primary: the value of the resultant speed of the ship determined at the moment of contact with a fender;
- ◦
Secondary: efficiency of maneuvering—time length of maneuvers.
The moment of measuring significant parameters: contact of the hull of the ship with a fender.
The types of displays used, the name of the series and the number of trials in a given series of the Scenario 2 are presented in the
Table 3.
2.3.3. Scenario 3. Sea Ferry
The simulation test scenario assumed that experts would perform a series of simulation passages consisting of safe bow-to-berthing of the sea ferry Skania to the Ferry Terminal in Świnoujście (
Figure 5). The mooring should have been such that the bow door of the ship could be opened, and the loading ramp could be connected.
It was assumed that the reference point lies in the line of the Ferry Terminal berth edge, on the symmetry plane of the discharge ramp, 10 m from the ramp. The moment of measuring the significant parameters took place at the moment when the navigator decided that he had reached the shortest distance from the reference point assumed in the study.
The detailed assumptions of Scenario 3 were as follows:
Objective to be achieved: The lowest possible value of the ship distance from the theoretical point determining the ship’s bow position in which the bow ramp can be effectively connected to the shore.
Main ship parameters:
- ◦
LOA = 173.7 m, breadth = 24 m, draught = 6.4 m;
- ◦
Displacement = 15,800 t;
- ◦
Block coefficient = 0.684;
- ◦
Main engine: 4 × diesel, total power = 31,680 kW;
- ◦
Max speed = 27 kn;
- ◦
Type of propulsion: 2 × cpp, outwards;
- ◦
Number of rudders: 2;
- ◦
Max rudder angle = 45.0 deg;
- ◦
Number of thrusters: 3;
- ◦
Bow thruster power = 3800 kW.
Navigational-maneuvering conditions:
- ◦
the initial position of the ship: parallel, distance half the ship’s length from the ramp and two ship’s breadths from the Ferry Terminal Quay;
- ◦
the ship’s final position: Ferry Terminal Quay;
- ◦
initial SOG: longitudinal ahead vw = 0.5 kn, transverse to port side vp = 0.1 kn;
- ◦
heading: HDG = 227°.
The criteria used for assessment:
- ◦
Primary: the value of the minimum distance of ship’s hull from the navigational obstruction (assumed reference point);
- ◦
Secondary: efficiency of maneuvering—time length of maneuvers.
The moment of measuring significant parameters: on the explicit command of the navigator, when the navigator considers that the ship has reached the lowest distance to the assumed reference point.
The types of displays used, the name of the series and the number of trials in a given series of the Scenario 3 are presented in the
Table 4.
2.3.4. Scenario 4. Cruise Ship
The simulation test scenario assumed that experts would perform a series of simulation trials consisting of the safe passage of the cruise ship Lirica along the determined section of the Świnoujście-Szczecin fairway. The ship passage consisted of the withdrawal of the ship from Kanał Grabowski to Przesmyk Orli turning basin, starboard turn and entry into a straight fairway section called Przekop Mieleński, towards the port of Świnoujście (
Figure 6).
During the experiment, the navigator was required to achieve the lowest possible value of the distance from the ship’s hull to the east shore of Gryfia Island. The maneuver was necessary to keep the ship’s stern away from Wielka Kempa island as adjacent waters are not navigable.
The detailed assumptions of Scenario 4 were as follows:
Objective to be achieved: the lowest possible value of the distance from the ship’s hull to the east shore of Gryfia Island.
Main ship parameters:
- ◦
LOA = 251.25 m, breadth = 28.8 m, draught = 6.84 m;
- ◦
Displacement = 59,058 t;
- ◦
Block coefficient = 0.649;
- ◦
Main engine: 4 × diesel, total power = 31,500 kW;
- ◦
Max speed = 22.5 kn;
- ◦
Type of propulsion: 2 × cpp, outwards;
- ◦
Number of rudders: 2;
- ◦
Max rudder angle = 45.0 deg;
- ◦
Number of thrusters: 4;
- ◦
Bow thruster power = 4200 kW;
- ◦
Stern thruster power = 2800 kW.
Navigational-maneuvering conditions:
- ◦
the initial position of the ship: Kanał Grabowski, next to Przesmyk Orli turning basin;
- ◦
the ship’s final position: Przekop Mieleński, as far as Trymerski Basin towards Świnoujście;
- ◦
initial SOG: longitudinal astern vw = 4.0 kn, transverse vp = 0.0 kn;
- ◦
heading: HDG = 228°.
The criteria used for assessment:
- ◦
Primary: the value of the minimum distance of ship’s hull from the navigational obstruction (east shore of Gryfia Island);
- ◦
Secondary: efficiency of maneuvering—time length of maneuvers.
The moment of measuring significant parameters: after the passage ends, the least recorded value of the cruise ship distance from the east shore of Gryfia Island, determined from a single passage.
The types of displays used, the name of the series and the number of trials in a given series of the Scenario 4 are presented in the
Table 5.
2.3.5. Scenario 5a. Tow Train—Unberthing
The simulation test Scenario 5a included the experts’ simulated series of passages consisting of safe unberthing of the sea barge Wagenborg 4 from Jachtowe Quay, using two tugs Java Victor, connected with the barge by towing lines. The passage consisted of unberthing and towing the sea barge possibly close to the Świnoujście-Szczecin fairway center line, then directing the tug-barge train to proceed along a straight stretch of the Odra Zachodnia river, towards the port of Świnoujście (
Figure 7).
The detailed assumptions of Scenario 5a were as follows:
Objective to be achieved: the lowest possible value of the maneuvering area width, determined by the barge’s contour and the two towing vessels.
Main tow train parameters:
- ◦
Barge LOA = 100 m, breadth = 33 m, draught = 6.05 m;
- ◦
Tug LOA = 41.8 m, breadth = 11.4 m, draught = 4 m;
- ◦
Displacement = 1036 t;
- ◦
Block coefficient = 0.555;
- ◦
Main engine: 2 × diesel, total power = 2939 kW;
- ◦
Max speed = 13.6 kn;
- ◦
Type of propulsion: 2 × fpp, outwards;
- ◦
Number of rudders: 2;
- ◦
Max rudder angle = 45.0 deg.
Navigational-maneuvering conditions:
- ◦
the initial position of the tow: parallel to Jachtowe Quay;
- ◦
the final position of the tow: the center line of Szczecin-Świnoujście fairway northward;
- ◦
initial SOG: longitudinal vw = 0.0 kn, transverse vp = 0.0 kn;
- ◦
heading: HDG = 025°.
The criteria used for assessment:
- ◦
Primary: the value of the average and maximum maneuvering area of the tow train, determined from maximum distances of the tow train’s contour from the assumed reference point;
- ◦
Secondary: efficiency of maneuvering—time length of maneuvers.
The moment of measuring significant parameters: maximum distances of the tow train’s contour from the adopted reference point, calculated analytically after the passage was completed on the basis of registered coordinates of the center of gravity of the barge and tugs.
The types of displays used, the name of the series and the number of trials in a given series of the Scenario 5a are presented in the
Table 6.
2.3.6. Scenario 5b. Two Train—Turning
The simulation test Scenario 5b included the experts’ simulated series of passages consisting of a safe turning of the sea barge Wagenborg 4 from Jachtowe Quay, using two tugs Java Victor, connected with the barge by towing lines.
The passage consisted in towing the sea barge from Dock No 5 to a turning basin on the Odra Zachodnia river, opposite Cal Quay, then turning the barge around its starboard side and passage of the tow train along the straight section of Przekop MIeleński canal (
Figure 8).
The detailed assumptions of Scenario 5b were as follows:
Objective to be achieved: same as in Scenario 5a.
Main ship parameters: same as in Scenario 5a.
Navigational-maneuvering conditions:
- ◦
the initial position of the tow: parallel to Jachtowe Quay;
- ◦
the final position of the tow: the center line of Szczecin-Świnoujście fairway northward;
- ◦
initial SOG: longitudinal vw = 0.0 kn, transverse vp = 0.0 kn;
- ◦
heading: HDG = 025°.
The criteria used for assessment: same as in Scenario 5a.
The moment of measuring significant parameters: same as in Scenario 5a.
The types of displays used, the name of the series and the number of trials in a given series of the Scenario 5b are presented in the
Table 7.
2.4. Data Recording and Analysis
Scenario 5a,b included two variants of the passages using the display of the SDSS, defined as the most precise in Scenarios 1–4. Based on the test results analysis referring to the previous scenarios, the variants of passages using the displays as indicated in
Table 6 and
Table 7.
In the simulation passages for the tow train variant, it was impossible to use visual display due to hardware limitations of the simulated movement model (technological solutions used on the simulator bridge). The limitation consisted in the need to use a peripheral device, such as a joystick, to change the navigator’s field of vision. Taking into account the limitations in the visual observation field to 30° (small bridge option), the necessity of frequent change in the observation point made the effective control of the tug impossible.
Commonly known empirical methods were used to calculate the maneuvering area of the vessels [
47].
The detailed conditions of the simulation study for all scenarios are as follows:
Hydro-meteorological conditions:
wind speed and direction: no wind;
speed and direction of the current: output current vc = 0.0 kn up to 0.1 kn;
visibility: good;
time of day: day;
waves: no waves;
the effects implemented in the model: ship-shore and squat.
Automatic registration of significant parameters (random variables) in the simulation model of ship movement and the model of the visualization method in AV technology in the interval of 2 s.
2.5. General Assumptions of the Simulation Study
The general assumptions of the simulation study for all the scenarios were as follows:
Where it was considered appropriate, a series of simulation passages in specific scenarios were conducted for all four graphic SDSS and visual observation.
Each series of simulation passages was conducted separately for each of the selected SDSSs, i.e., at the moment of using a given system, all the systems under consideration in the testing were excluded (not applicable to visual observation). This was intended to increase the probability that during maneuvering, the navigator does not use information from another system, which could falsify the results.
The series of passages were not fewer than the specified minimum number of simulation tests for a given test scenario.
All the systems used were provided with the same input data necessary for their correct operation, i.e., standardized NMEA data.
Each passage was preceded by one trial passage, and the navigator could read the ship’s documentation to familiarize himself with the maneuvering characteristics.
The passages that did not meet the assumed criteria were not accepted for analysis. A passage was considered invalid if:
the ship had contact with the shore, bottom or surface object, as a result of which critical values of acceleration forces determined in the simulation model of ship movement were exceeded,
maneuvers significantly differed from assumptions defined by the author in the scenario.
3. Results
The herein presented statistical analysis of recorded simulation passage data consisted of the verification of the hypotheses on the normality of random variables distribution (
Table 8):
resultant speed V1 of the container ship determined at the moment of contact with the fender and time T1 of maneuver performance, obtained for four variants of Scenario 1;
resultant speed V2 of the general cargo ship determined at the moment of contact with the fender and time T2 of maneuver performance, obtained for four variants of Scenario 2;
the distances of the sea ferry from the assumed point of reference X3 obtained for five variants of Scenario 3;
the distances X4 of the cruise ship from the east shore of Gryfia Island obtained for five variants of Scenario 4;
the distances of the tow train contour points from the assumed reference point D5a obtained for two variants of Scenario 5a and D5b obtained for two variants of Scenario 5b;
and the comparison of the mean, variance and multiple comparisons of the means. Depending on the number of variants in simulation scenarios (number of independent groups), the statistical inference was conducted as presented below.
Table 8.
The list of random variables subjected to statistical analysis based on the scenario variant.
Table 8.
The list of random variables subjected to statistical analysis based on the scenario variant.
| 1 | 2 | 3 | 4 | 5 | 6 |
|---|
| Scenario | Variant of the Scenario | Random Variable of the Primary Criterion | Independent Groups of the Random Variable of the Primary Criterion | Random Variable of the Secondary Criterion | Independent Groups of the Random Variable of the Secondary Criterion T |
| 1 | 1_Visual | V1—resultant speed of the container ship determined at the moment of contact with the fender (kn) | V1_Visual | T1—time of maneuver performance (s) | T1_Visual |
| 1_ECDIS | V1_ECDIS | T1_ECDIS |
| 1_Pprecise | V1_Pprecise | T1_Pprecise |
| 1_AV | V1_AV | T1_AV |
| 2 | 2_Visual | V2—resultant speed of the general cargo ship determined at the moment of contact with the fender (kn) | V2_Visual | T2—time of maneuver performance (s) | T2_Visual |
| 2_ECDIS | V2_ECDIS | T2_ECDIS |
| 2_Pmax | V2_Pmax | T2_Pmax |
| 2_Pprecise | V2_Pprecise | T2_Pprecise |
| 2_AV | V2_AV | T2_AV |
| 3 | 3_Visual | X3—distance of the sea ferry from the assumed point of reference (m) | X3_Visual | |
| 3_ECDIS | X3_ECDIS |
| 3_Pmax | X3_Pmax |
| 3_Pprecise | X3_Pprecise |
| 3_AV | X3_AV |
| 4 | 4_Visual | X4—distance of the cruise ship from the east shore of Gryfia Island (m) | X4_Visual |
| 4_ECDIS | X4_ECDIS |
| 4_Pmax | X4_Pmax |
| 4_Pprecise | X4_Pprecise |
| 4_AV | X4_AV |
| 5a | 5a_Pprecise | D5a—distance of the tow train contour points from the assumed reference point (m) | D5a_Pprecise |
| 5a_AV | D5a_AV |
| 5b | 5b_Pprecise | D5b—distance of the tow train contour points from the assumed reference point (m) | D5b_Pprecise |
| 5b_AV | D5b_AV |
For the scenario of unberthing (5a) and turning (5b) of the tow train, where statistical analysis was applied to k = 2 independent groups of the random variable of the distance of the tow train contour points from the adopted reference point, the equality of the means was verified by the parametric test. The specific hypotheses were adopted:
Hypothesis 0 (H0). The mean distances of the tow train contour from the reference point assumed for the tests using a specific navigator’s decision support system and the system in the augmented virtuality method are equal mb = mAV.
Hypothesis 1 (H1). The mean distances of the tow train contour points from the reference point assumed for the tests using a specific navigator’s decision support system and the system in the augmented virtuality method are different mb ≠ mAV.
Depending on the outcome of the test on the homogeneity of the variance of the distribution of the random variable distance of the tow train contour from the assumed reference point in the independent groups of Scenarios 5a,b, two variants of the significance test of the mean differences were used:
For the simulation test Scenarios 1–4, where each statistical analysis was conducted for more than
k > 2 independent groups (
Table 8) of the random variables of the primary criterion
V1,
V2,
X3,
X4, the equality of the means in the groups of the given simulation experiment scenario was verified by the parametric test. The specific hypotheses were adopted:
Hypothesis 0 (H0). The means of random variable distribution in all independent groups for the tests using the decision support systems defined in the assumptions of a given simulation experiment scenario are equal, m1 = m2 = m3 = mk.
Hypothesis 1 (H1). At least two means of random variables distributions in independent groups for tests using the decision support systems defined in the assumptions of the given simulation experiment are different.
Depending on the outcome the homogeneity test of random variables distribution variances
V1,
V2,
X3,
X4, in independent groups (
Table 8) of Scenarios 1–4, two variants of the significance test of the mean differences were applied:
one-factor ANOVA analysis of the variance for independent tests, when the variances were homogeneous;
Welsh test and Brown–Forsyth test for heterogeneous variances.
In the case of heterogeneous variances, the non-parametric Kruskal–Wallis test was excluded as the distributions of the analyzed random variables in independent groups were close to the normal distribution of the same size, their distributions were not similar, and the test is of lower power than parametric tests.
For the simulation test Scenarios 1–4, where each statistical analysis was conducted for more than 2 independent groups (k > 2) of the primary criterion V1, V2, X3, X4, and the outcome of the analysis of the mean equality was statistically significant, multiple comparisons between the groups analyzed were conducted using post hoc tests.
Depending on the outcome of the test for the homogeneous degree of variance, two variants of the multiple comparisons were applied:
The adopted level of significance of the tests was α = 0.05.
When the significance tests revealed no statistically significant differences between the means of the distributions of the random variables of the primary criterion V1, V2, X3, X4, D5a, D5b in independent groups obtained in all the variants of the Scenarios 1–5b or the multiple comparisons tests revealed no statistically significant differences between the means of distributions of the random variables of primary criterion V1, V2, X3, X4, D5a, D5b in independent groups obtained in the variant passages using the AV system and the groups of the other passages in the Scenarios 1–5b, a statistical analysis of independent groups of random variables of the secondary criterion (the time of maneuvering) T was conducted, where the inference process was similar to that described in this section.
The statistical analysis, discussed further in this section, of the random variables of primary criterion V1, V2, X3, X4, in the independent groups of Scenarios 1–4 showed that there was a need to carry out a similar inference for the random variable of the Secondary criterion, time of maneuvering T, in Scenarios 1 and 2. Therefore, the description of the statistical inference for the random variables of the primary criterion includes statistical analysis for the random variable of the secondary criterion in Scenarios 1 and 2.
3.1. Verification of Hypotheses on the Normality of the Random Variable Distribution
After the analysis of the values of the test statistics obtained from the performed tests of the normality of the distribution of random variables of the primary criterion, in the independent groups of Scenarios from 1 to 5b, there was no basis for the rejection of the hypotheses on the normality of the distribution of the tested random variables.
In all cases, the W test statistics (Shapiro–Wilk test) of the random variables of the primary criterion, as well as the random variables of the secondary criterion in Scenario 1 (container ship berthing) and Scenario 2 (general cargo ship berthing) turned out insignificant (p > 0.05); therefore, the hypotheses on the normality of distribution was accepted.
3.2. The Comparison of the Random Variables Obtained from the Series of Tests for All Variants of Simulation Scenarios
The first stage of the analysis of the obtained results consisted in the comparison of the arithmetic means of distributions of all random variables:
V1,
T1,
V2,
T2,
X3,
X4,
D5a,
D5b in independent groups (
Table 8), obtained during all simulation passages of the ships.
It should be noted that for Scenarios 1 and 2, the measured parameter—resultant speed—has relatively small values, which may vary from the actual operational parameters of the given ship. This is due to the assumption that the simulation experiment requires the navigator to achieve the lowest possible value of resultant speed while performing the maneuver in the possibly shortest time. The assumption was aimed to eliminate the situation where the navigator would adopt a subjective, higher level of the resultant speed, that in his judgement would be safe for a given ship (depending on the navigator’s habits). That, in some way, specified the reference level for the analyzed random variables. This is important for statistical analysis of the measurement results and enables the assessment of the usefulness of the system during maneuvering.
3.3. The Comparison of the Random Variables of Scenario 1. Container Ship
The values of the arithmetic mean of the distributions of the resultant container ship speed determined at the moment of container ship contact with the fender, during parallel berthing along the ship’s port side, are similar for all variants of passage, except for the test series using the ECDIS system (
Table 9). The value of the mean distribution of the random variable V1_ECDIS is on average larger by 20% than the other.
The analysis of the values of the arithmetic means of the distribution of the random variable of maneuvering time in independent groups for the container ship, like previously, showed a slight difference in the values, except the passages using the ECDIS system. The difference between the arithmetic mean of the distribution of the random variable T1_ECDIS obtained during passages using that system and the other was on average 15%. No significant differences were observed in the mean distribution of the random variables of maneuvering times for the other series of simulation tests.
It should be noted that despite clear differences in the mean distribution of resultant speed and time length of performed maneuvers in independent groups for variants 1_Visual, 1_Pprecise, 1_AV, for the latter two, the mean is slightly larger than for the variant with visual observation. This dependence occurs when we adopt the conditions of good visibility for visual observation. When restricted visibility is introduced, such a relationship may not occur.
The differences observed (at least one pair) in the values of the mean distribution of the random variables of resultant speed and maneuvering time in independent groups obtained for four variants of Scenario 1 gave the basis for further analysis, in which the means were compared at the confidence level 0.95.
3.4. The Comparison of the Random Variables of Scenario 2. General Cargo Ship
The values of the arithmetic mean of the distribution of the resultant speed of the general cargo ship determined at the moment of contact with the fender, performing diagonal berthing along the port side, vary for all five passage variants (
Table 10). The lowest value of the arithmetic mean of the distribution of the random variable speed
V2 and maneuvering time
T2 was observed for the 2_AV variant passage using the decision support system featuring the AV-based display method. The highest values of the mean distribution of resultant speed
V2 and maneuvering time
T2 were obtained for the passage variant 2_ECDIS.
The difference between the largest and the smallest values of the mean distribution of resultant ship speed in independent groups, obtained for five variants of Scenario 2, is approximately 60% and close to 80% for maneuvering time. This relationship that was created on the basis for further analysis conducted similarly to that for the container ship passages in Scenario 1.
3.5. The Comparison of the Random Variables of Scenario 3. Sea Ferry and Scenario 4 Cruise Ship
Similar to Scenario 2, in Scenarios 3 and 4, similar relationships were observed between the arithmetic mean of the distribution of the random variable of the ship’s hull distance from the assumed reference point in the independent groups, obtained in all the variants of Scenario 3 for the sea ferry and all five variants of Scenario 4 for the cruise ship.
In Scenario 3, the difference between the largest value of the distribution of the random variable X3_ECDIS obtained in the variant 3_ECDIS (passages using the ECDIS system) and the smallest value of the mean distribution of the random variable X3_AV obtained in the variant 3_AV was more than nine-fold (
Table 11).
In Scenario 4, the difference between the largest value of the mean distribution of the random variable X4_ECDIS obtained in variant 4_ECDIS and the smallest value of the mean distribution of the random variable X4_AV obtained in the variant 4_AV was over eleven-fold (
Table 11).
It can be noted from the results that the value of the mean distribution of the random variable of the cruise ship distance from the east shore of Gryfia Island obtained for the passage variant 4_Pprecise (using the Pilot_precise system) is lower than for the sea ferry passage variant with the same system, while the values obtained for the other systems are in the inverse relationship. This is due to different moments of measuring the significant value for each variant. The shortest distance from the east quay of Gryfia Island during cruise ship turning was the lowest value of all recorded populations in the test sample. With a clearly specified reference in the form of the shoreline, the difficulty of the navigational task came down to get the ship’s contour skillfully as close as possible during the turning maneuver.
In the case of the sea ferry berthing variant, the value of the lowest distance of the hull from the assumed (not visible) reference point was measured at the moment of the ‘stop’ command given by the navigator. The discretely monitored measurement of the distance using a marker was burdened with an error of marker setting and the absence of a clearly defined reference point. This situation did not refer to the AV system, and in the case of large inaccuracy in the estimation of distances using other systems and visual observation (place of the ship not visible from the bridge), it had a lower impact on the overall value.
The differences observed (at least one pair) in the values of the mean distribution of the random variable distance of the sea ferry from the assumed reference point in the independent groups, obtained for five variants of Scenario 3 and the mean distribution of the random variable of the cruise ship distance from the east shore of Gryfia Island in independent groups, obtained for five variants of Scenario 4, made the basis for further analysis, conducted similarly to the previous passages.
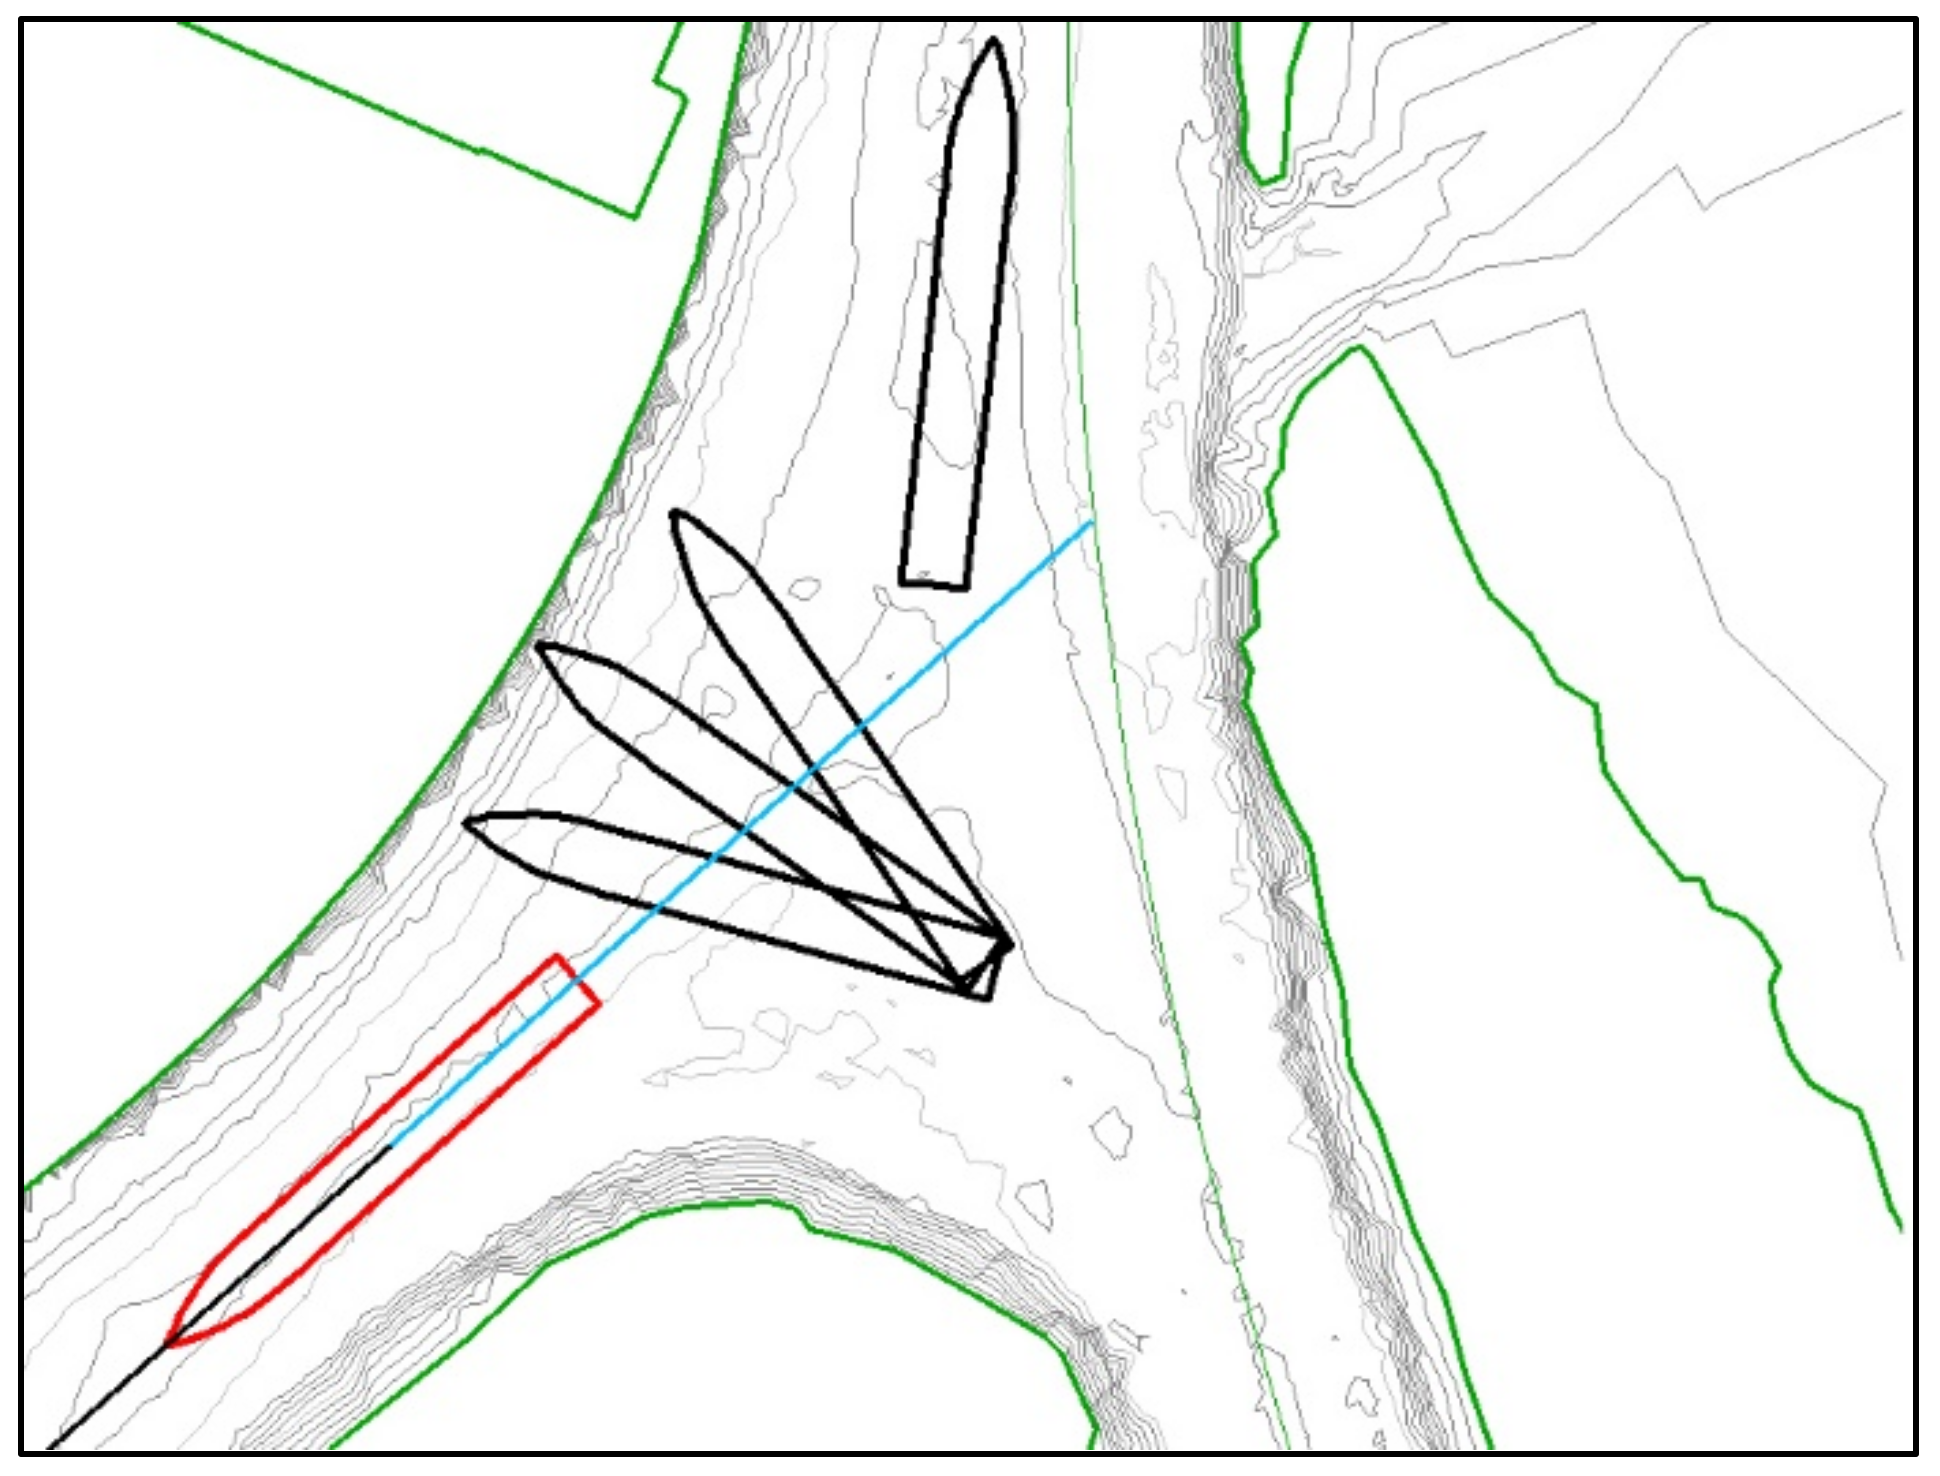
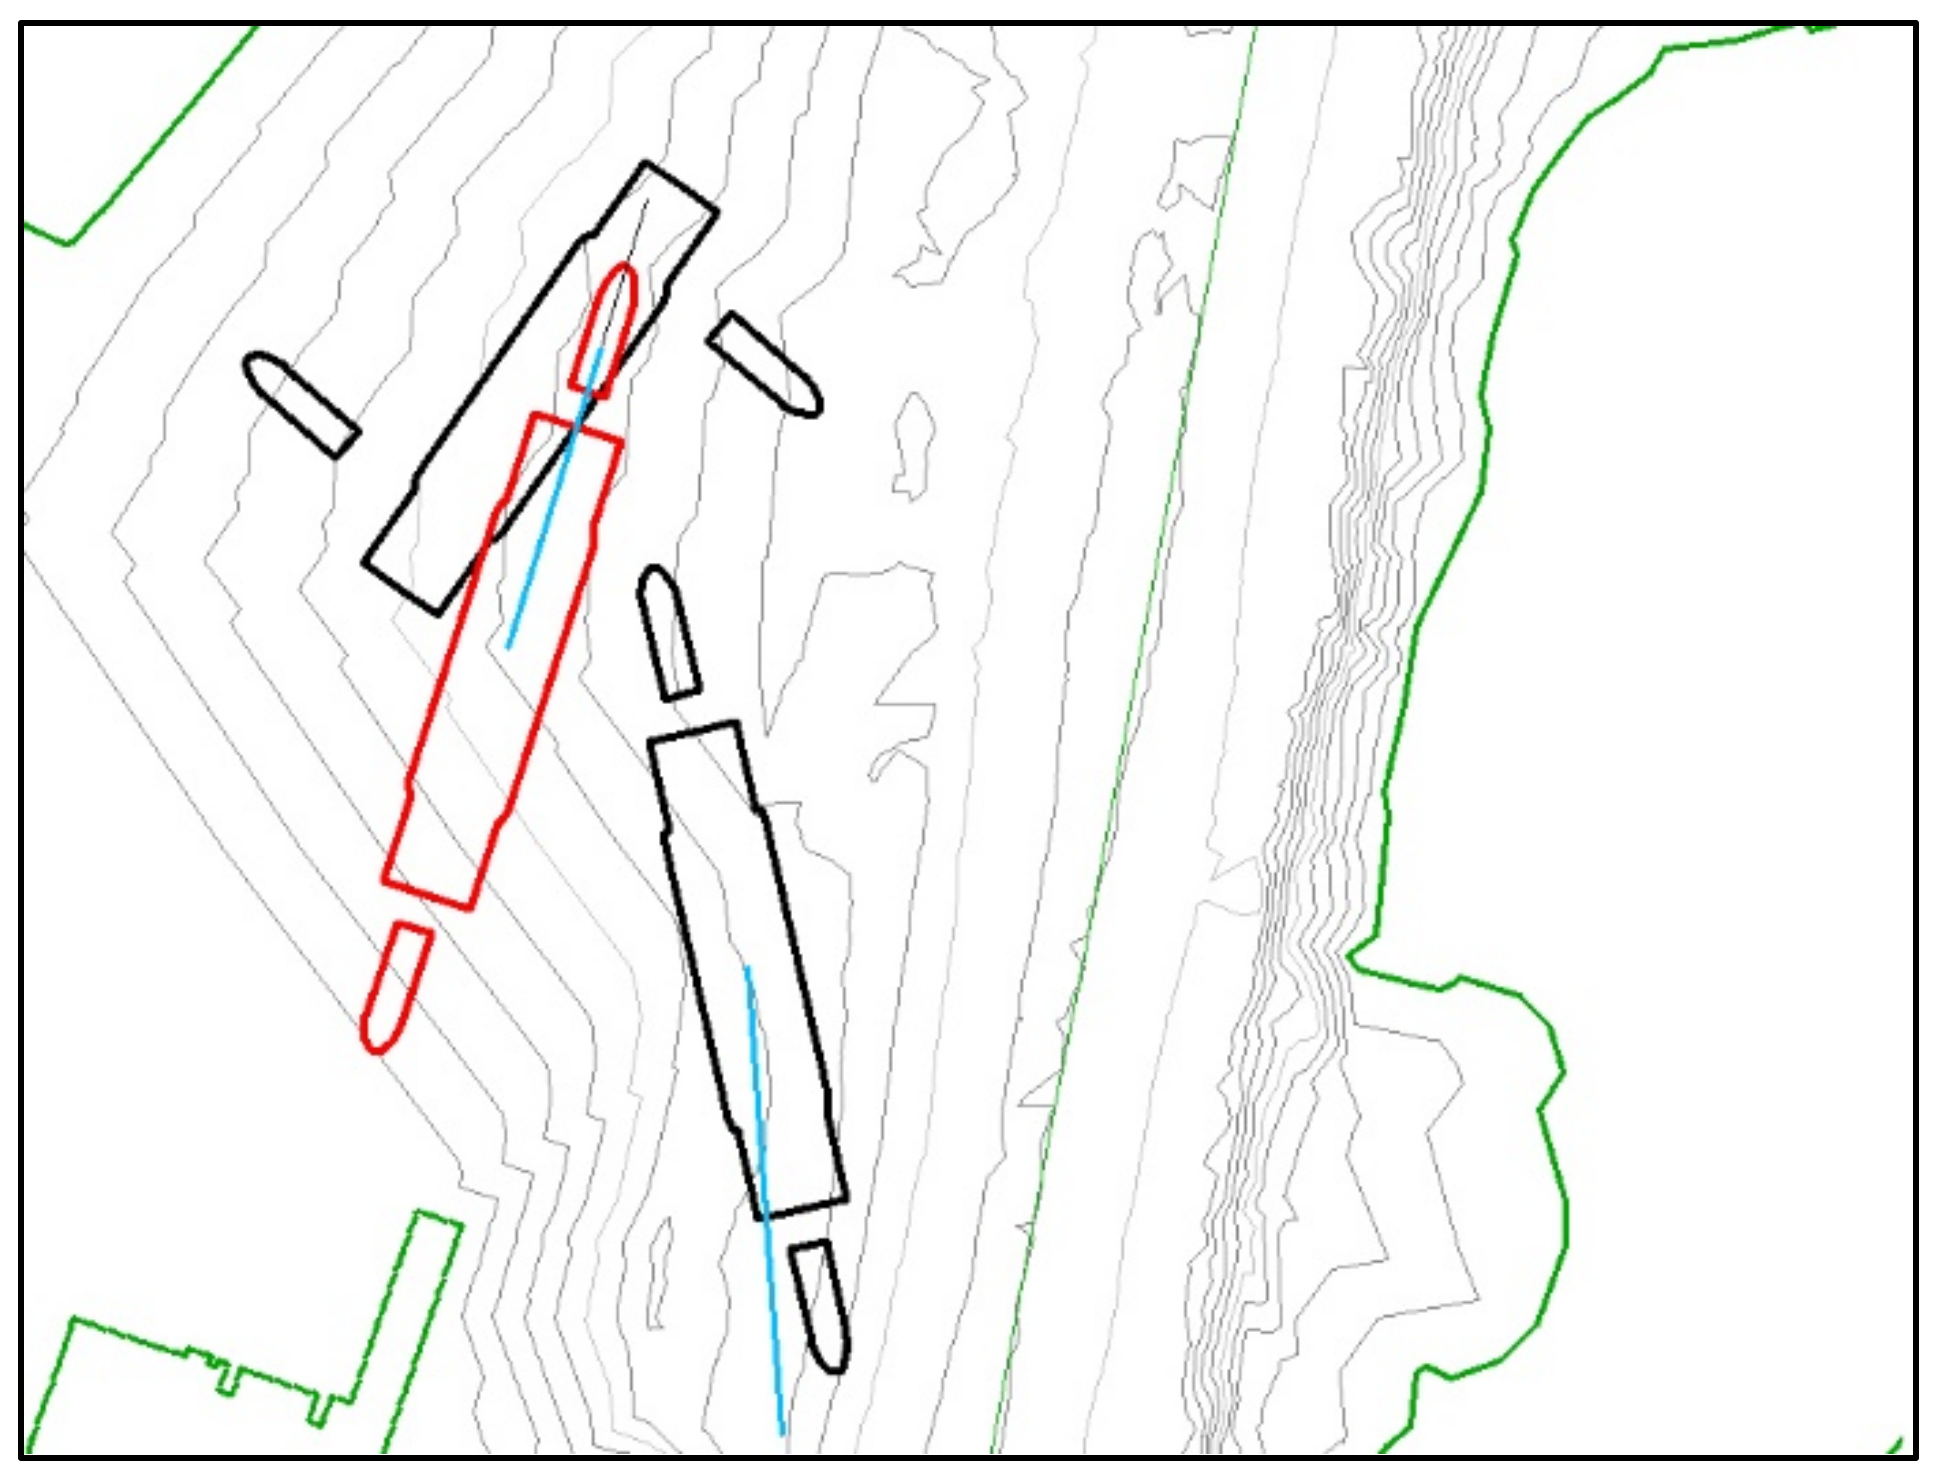
3.6. The Comparison of the Random Variables of Scenarios 5a and 5b. The Tow Train
The values of the arithmetic mean of the distributions of the distances of the tow train contour from the assumed reference point for the passages variants 5a_Pprecise and 5a_AV in Scenario 5a and for variants 5b_Pprecise and 5b_AV in Scenario 5b differ significantly in the case of the mean and maximum areas.
The mean and maximum areas determined for variant 5a_Pprecise (using the Pilot_precise system) of Scenario 5a (unberthing of the tow train) was on average more than 15% wider than the same areas obtained in the variants of passages 5a_AV (with the AV system) (
Table 12).
Similarly, the mean and maximum areas determined for variant 5b_Pprecise Scenario 5b (turning of the tow train) were on average 16% wider than the same areas obtained in the variant of passages 5b_AV (
Table 13).
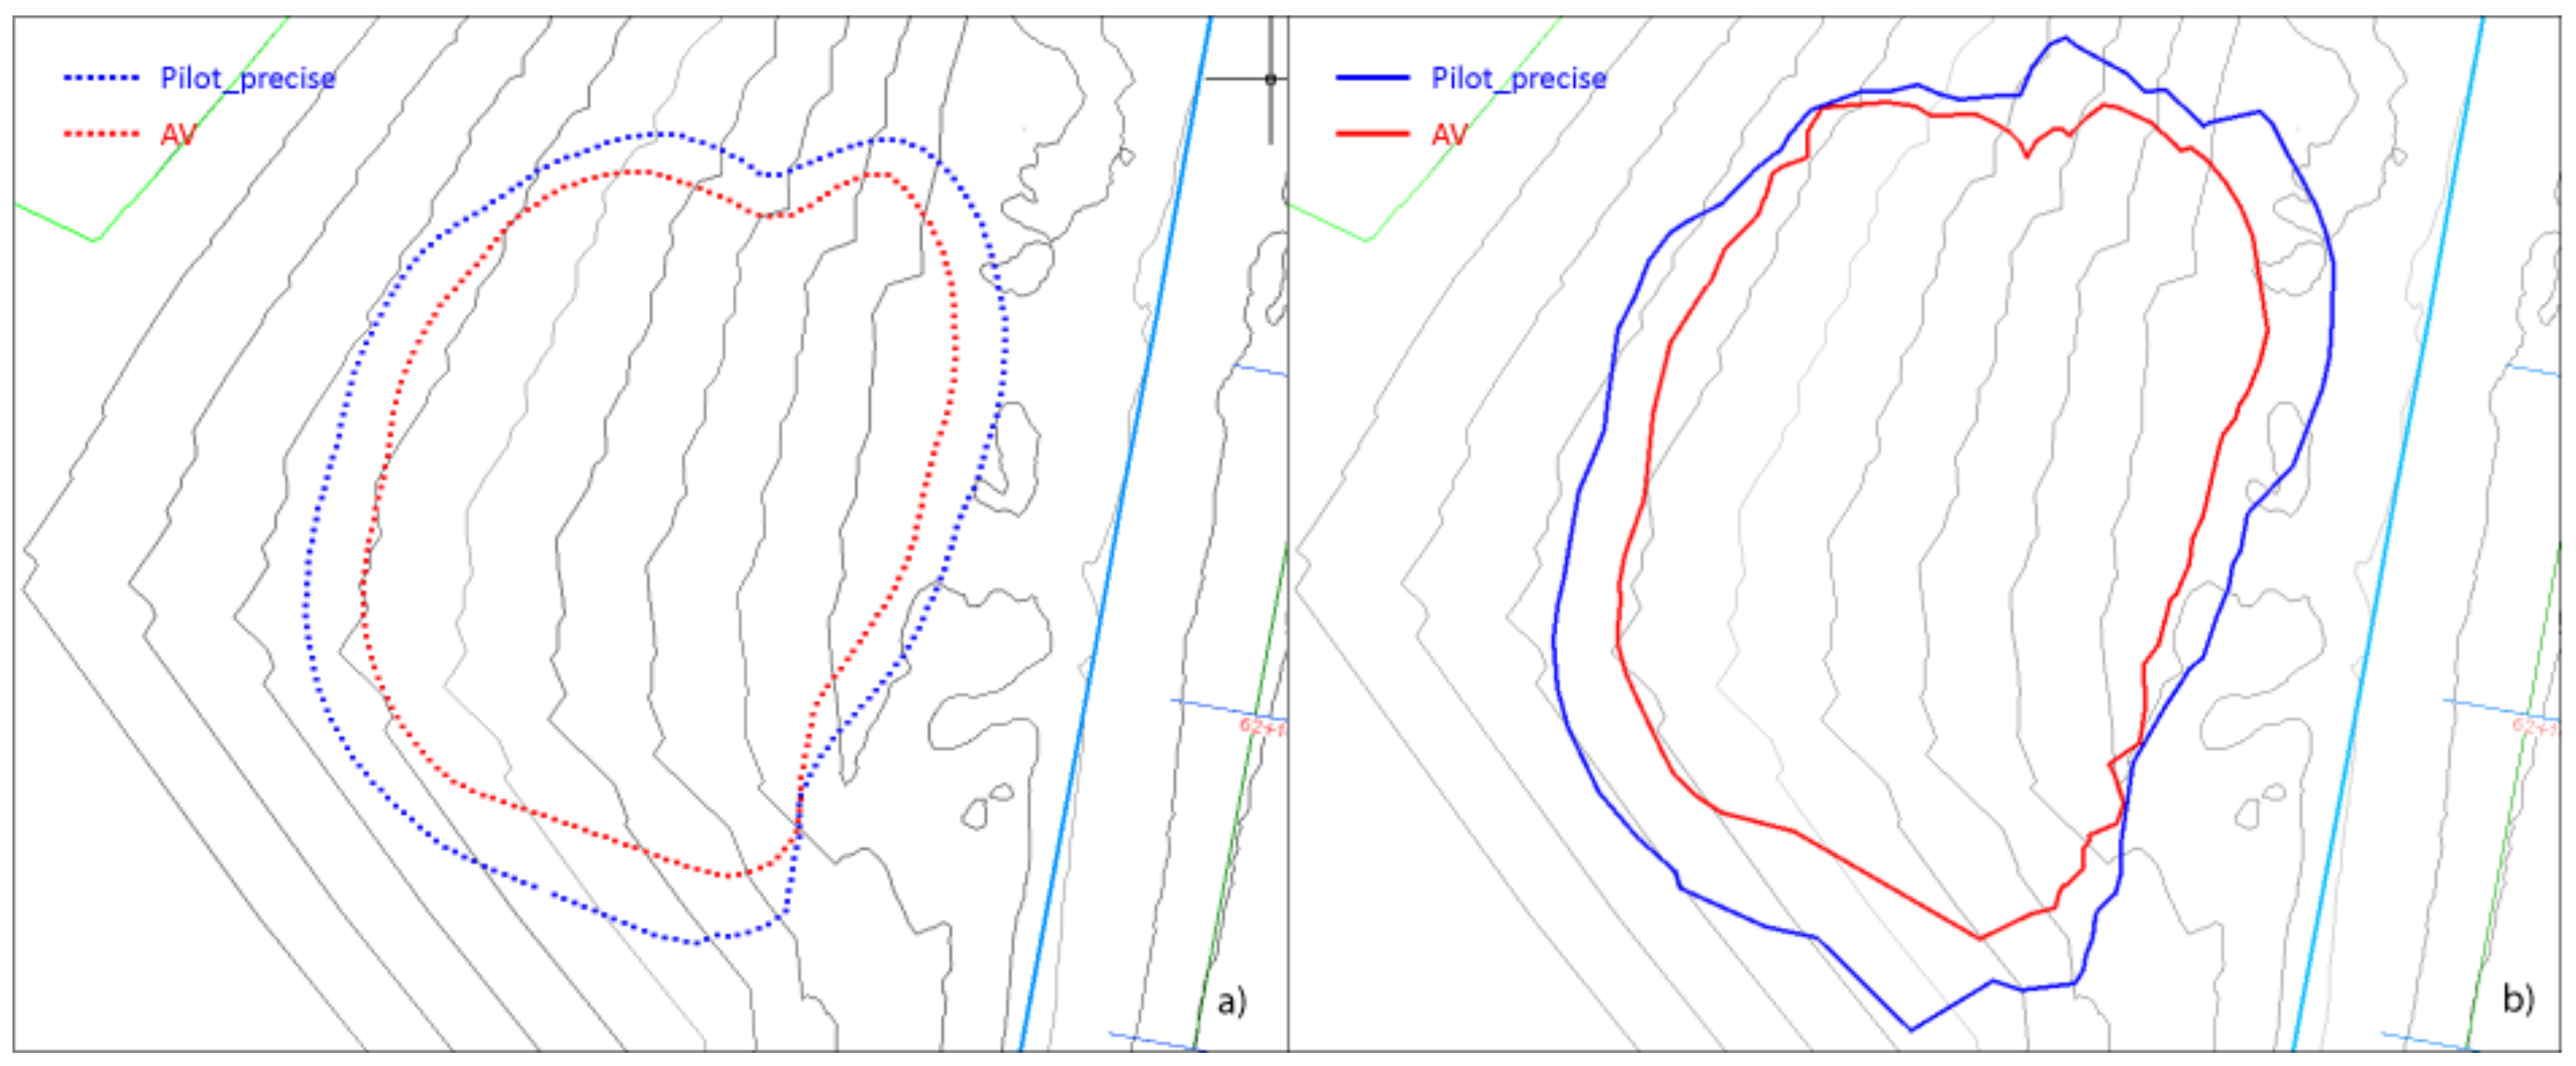
The comparison of the maneuvering areas of the tow train for unberthing and turning maneuvers are given in
Figure 9 and
Figure 10.
The boundaries were determined according to the criteria of the mean area and the maximum area based on the assessment of the size and location of maneuvering areas calculated for simulation tests using the Pilot_precise system and AV.
The above relationships gave the basis for the further analysis conducted, similarly to the variants above, to check whether the differences observed in the first stage could be confirmed by a more detailed statistical analysis.
3.7. Statistical Tests of Differences between Random Variables Parameters Obtained from Series of Tests for All Variants of Simulation Scenarios
The initial analysis has shown differences in the mean distributions of all random variables in independent groups obtained in all the variants of simulation passages defined in the given experiment.
Therefore, it was decided to carry out statistical verification of the hypotheses on the equality of the means and variances for all the distributions of random variables (
Table 8) in the independent groups obtained for all the simulated passage variants defined in Scenarios 1–5b.
To carry out statistical analysis for the random variable of the distance of the tow train contour points from the assumed reference point in the independent groups obtained for the variants of simulation passages:
5a_Pprecise and 5a_AV defined in Scenario 5a,
5b_Pprecise and 5b_AV defined in Scenario 5b,
the test population was reduced to the values obtained in 20 selected sectors of the mean and maximum maneuvering areas (
Table 14).
To determine the homogeneity of the variances of the distributions of the random variables of primary criterion
V1,
V2,
X3,
X4,
D5a,
D5b and secondary criterion
T1,
T2, (
Table 8), in the independent groups obtained in all the simulation variants of the given Scenario s 1–5b, Levene tests and Brown-Forsyth tests were conducted.
The analysis of results indicated that in independent groups of random variables of the primary criterion V1, V2, X3, X4 and the secondary criterion T1, T2, obtained in all the simulation variants of the given Scenario 1–4, there are significant differences between the variances (the basis for the rejection of H0 at the significance level α = 0.05) for all the tests used.
For Scenarios 1–4, the level of the significance of the Leven test statistic and the Brown and Forsyth statistic assumed the values p < 0.05. Therefore, it was concluded that the assumption on the homogeneity of the variances of the distributions of the random variables of the primary criterion V1, V2, X3, X4 and the secondary criterion T1 and T2 is not satisfied in the independent groups obtained in all the simulation variants of the given Scenario 1–4. This meant the need to use parametric tests for the independent groups with heterogeneous variances to determine the significance of the differences in the mean distributions of the random variables.
As the result of the analysis of all the independent groups of the random variables of the primary criterion, D5a and D5b, obtained in all the simulation variants of the given Scenario 5a,b, statistically significant differences were found between the variances (the basis for the rejection of the H0 on the defined level of significance α = 0.05) for all the tests used.
The analysis of the results of the Leven tests and Brown and Forsyth tests conducted for the independent groups of the distances of the tow train contour points from the assumed reference points D5a and D5b, obtained in all the simulation variants of the given Scenario 5a,b, showed that there are no statistically significant differences between the variances (there was no basis for the rejection of the H0 at the determined level of significance α = 0.05) for all the tests used.
For Scenario 5a,b, the level of significance of the Leven test statistic and Brown and Forsyth test statistic assumed the values p > 0.05. Therefore, it was concluded that the assumption on the homogeneity of the variances of the distribution of the random variables of the primary criterion, i.e., the distances of the tow train contour points from the assumed reference point in the independent groups D5a_Pprecise and D5a_AV and independent groups D5b_Pprecise and D5b_AV of the mean and the maximum maneuvering areas is satisfied. This meant the need to use parametric tests for the independent groups with homogeneous variances to determine the significance of the differences in the mean distributions of the random variables.
To determine the significance of the mean differences for all variants of the simulation experiment scenarios, parametric tests were conducted. For Scenarios 1–4, in which each time a statistical analysis was conducted for more than two independent groups (k > 2) of the primary criterion, i.e.:
the resultant speed of the container ship determined at the moment of contact with the fender obtained for four variants of Scenario 1: V1_Visual, V1_ECDIS, V1_Pprecise, V1_AV;
the resultant speed of the general cargo ship determined at the moment of contact with the fender obtained for five variants of Scenario 2: V2_Visual, V2_ECDIS, V2_Pmax, V2_Pprecise, V2_AV;
distances of the sea ferry from the assumed reference point obtained for five variants of Scenario 3: X3_Visual, X3_ECDIS, X3_Pmax, X3_Pprecise, X3_AV;
distances of the cruise ship from the east quay of Gryfia Island obtained for five variants of Scenario 4: X4_Visual, X4_ECDIS, X4_Pmax, X4_Pprecise, X4_AV;
and the random variables of the secondary criterion:
time of maneuvering obtained for four variants of Scenario 1: T1_Visual, T1_ECDIS, T1_Pprecise, T1_AV,
time of maneuvering obtained for five variants of Scenario 2: T2_Visual, T2_ECDIS, T2_Pmax, T2_Pprecise, T2_AV,
and at the same time, the variances were found to be heterogeneous in the above groups, and the equality of the mean distributions of the above random variables in the independent groups was verified by the Welsh test and the Brown and Forsyth test.
The results of Welsh tests and Brown and Forsyth tests showed no statistically significant differences between the mean distributions of the random variables of the container ship’s speed V1 determined at the moment of contact with the fender and the time of maneuvering T1 in the independent groups obtained for all four simulation variants of Scenario 1.
The significance level of the test statistic for Scenario 1 assumed the value of p > 0.05, which was the basis for accepting H0 at the set level of significance α = 0.05. There were no statistically significant differences between the mean distributions of the random variable V1 in the independent groups V1_Visual, V1_ECDIS, V1_Pprecise, V1_AV and the random variable T1 in the independent groups T1_Visual, T1_ECDIS, T1_Pprecise, T1_AV, which gave no basis for further thorough analysis—multiple comparisons—of the means using post hoc tests.
The results of the Welsh tests and Brown and Forsyth tests showed significant differences between the mean distributions of the random variables V2, T2, X3, X4 in k > 2 independent groups obtained for all the simulation variants of Scenarios 2–4.
The significance level of the test statistic for the given Scenario 2–4 had a value p < 0.05, which was the basis for rejecting H0 at the set level of significance α = 0.05.
The statistically significant differences between the mean distributions of the random variables were found:
- 3.
V2 in the independent groups V2_Visual, V2_ECDIS, V2_Pmax, V2_Pprecise, V2_AV and T2 in the independent groups T1_Visual, T1_ECDIS, T2_Pmax, T1_Pprecise, T1_AV in Scenario 2 for the general cargo ship,
- 4.
X3 in the independent groups X3_Visual, X3_ECDIS, X3_Pmax, X3_Pprecise, X3_AV in Scenario 3 for the sea ferry,
- 5.
X4 in the independent groups X4_Visual, X4_ECDIS, X4_Pmax, X4_Pprecise, X4_AV in Scenario 4 for the cruise ship,
which created a basis for a further thorough analysis of the multiple comparisons of the means using post hoc tests.
Based on the Student’s t-test, statistically significant differences were found between the mean distributions of the random variables of the tow train contour points from the assumed reference point D5a, D5b, in the independent groups obtained for all the simulation variants of Scenarios 5a,b. Therefore, the H0 hypothesis was rejected at the determined level of significance α = 0.05 for all the groups examined by that test.
The significance level of the Student’s t-test statistic assumed the values in the interval (0.000287;0.00182) for the mean and maximum maneuvering areas in Scenario 5a and (0.00399;0.000544) for the mean and maximum maneuvering areas in Scenario 5b. Therefore, it was ascertained that in all the variants, the assumption on the equality of the mean distributions of the random variables of the distances of the tow train contour points from the assumed reference point of the mean and the maximum maneuvering area was not satisfied.
3.8. Analysis of Multiple Comparisons of the Means Using the Post Hoc Test
To specifically determine significant differences between the mean distributions of the random variables V2, T2, X3, X4 in the independent groups obtained for all the simulation variants of a given Scenario 2–4, the multiple comparison analysis was conducted. Rejecting the hypothesis H0 on the homogeneity of the variances (p < 0.05) in all the independent groups of Scenarios 2–4, where each time a statistical analysis was conducted for more than k > 2 independent groups of the random variables V2, T2, X3, X4, the author used the Games–Howell test for heterogeneous variances.
3.8.1. Multiple Comparison Analysis of the Parameters in Scenario 2. General Cargo Ship
For the distributions of the random variable of the primary criterion, i.e., the resultant speed
V2 of the general cargo ship determined at the moment of contact with the fender in the independent group V2_AV obtained for variant 2_AV, the means differences turned out to be statistically significant for the level of significance
p < 0.0001, compared with the independent groups V2_Visual, V2_ECDIS, V2_Pmax, obtained for variants 2_Visual, 2_ECDIS and 2_Pmax, Scenario 2 (
Table 15). That was a basis for rejecting the hypothesis H
0 stating the equality of the means in the examined independent groups.
No statistically significant differences were observed in the mean distributions of the random variable V2 in the independent group V2_AV obtained for variant 2_AV, compared with the independent group V2_Pprecise obtained for variant 2_Pprecise. For the latter, there was a basis for accepting hypothesis H0.
For the distributions of the random variable of the secondary criterion, i.e., the time of maneuvering
T2 in the independent group T2_AV obtained for variant 2_AV, the differences turned out to be statistically significant for the level of significance having values (
p < 0.0001; 0.025), compared with independent groups T2_Visual, T2_ECDIS, obtained for variants 2_Visual, 2_ECDIS, Scenario 2 (
Table 15). Thus, there was a basis for rejecting the hypothesis H
0 stating the equality of the means in the examined independent groups.
No statistically significant differences were observed in the mean distributions of the random variable T2 in the independent group T2_AV obtained for variant 2_AV, compared with independent groups T2_Pmax, T2_Pprecise, obtained in variants 2_Pmax and 2_Pprecise. For the latter variants, there was a basis for accepting hypothesis H0.
3.8.2. Analysis of Multiple Comparisons of the Parameters in Scenario 3. Sea Ferry
For the distributions of the random variable of the primary criterion, the distance of the sea ferry from the assumed reference point
X3 in the independent group
X3_
AV obtained for variant 3_AV, the differences of the means turned out to be statistically significant for the level of significance assuming values
p (<0.0001; 0.002), compared with independent groups X3_Visual, X3_ECDIS, X3_Pmax and X3_Pprecise, obtained for variants 3_Visual, 3_ECDIS, 3_Pmax and 3_Pprecise of the Scenario 3 (
Table 16). Thus, there was a basis for rejecting the hypothesis H
0 stating the equality of the means in the examined independent groups.
3.8.3. Analysis of Multiple Comparisons of the Parameters in Scenario 4. Cruise Ship
Similar values of the significance level of test statistics were observed for the cruise ship variant in passages using the decision support system with AV-based navigational information display.
For the distributions of the random variable of the primary criterion, i.e., the distances
X4 of the sea ferry from the eastern berth of Gryfia Island in the independent group X4_AV, the differences of the means turned out to be significant for the level assuming values
p < 0.0001, compared with independent groups X4_Visual, X4_ECDIS, X4_Pmax and X4_Pprecise, obtained for variants 4_Visual, 4_ECDIS, 4_Pmax and 4_Pprecise, of Scenario 4 (
Table 17). Thus, there was a basis for rejecting hypothesis H
0 stating the equality of the means in the examined independent groups.


