
Factors Influencing the Action Point of the Collision Avoidance Manoeuvre


Abstract
:1. Introduction
2. Materials and Methods
- When an encounter situation was noticed by the OOW
- When the manoeuvre was started
- When the CPA was reached
- Normal,
- Weibull,
- Rayleigh,
- Log-normal
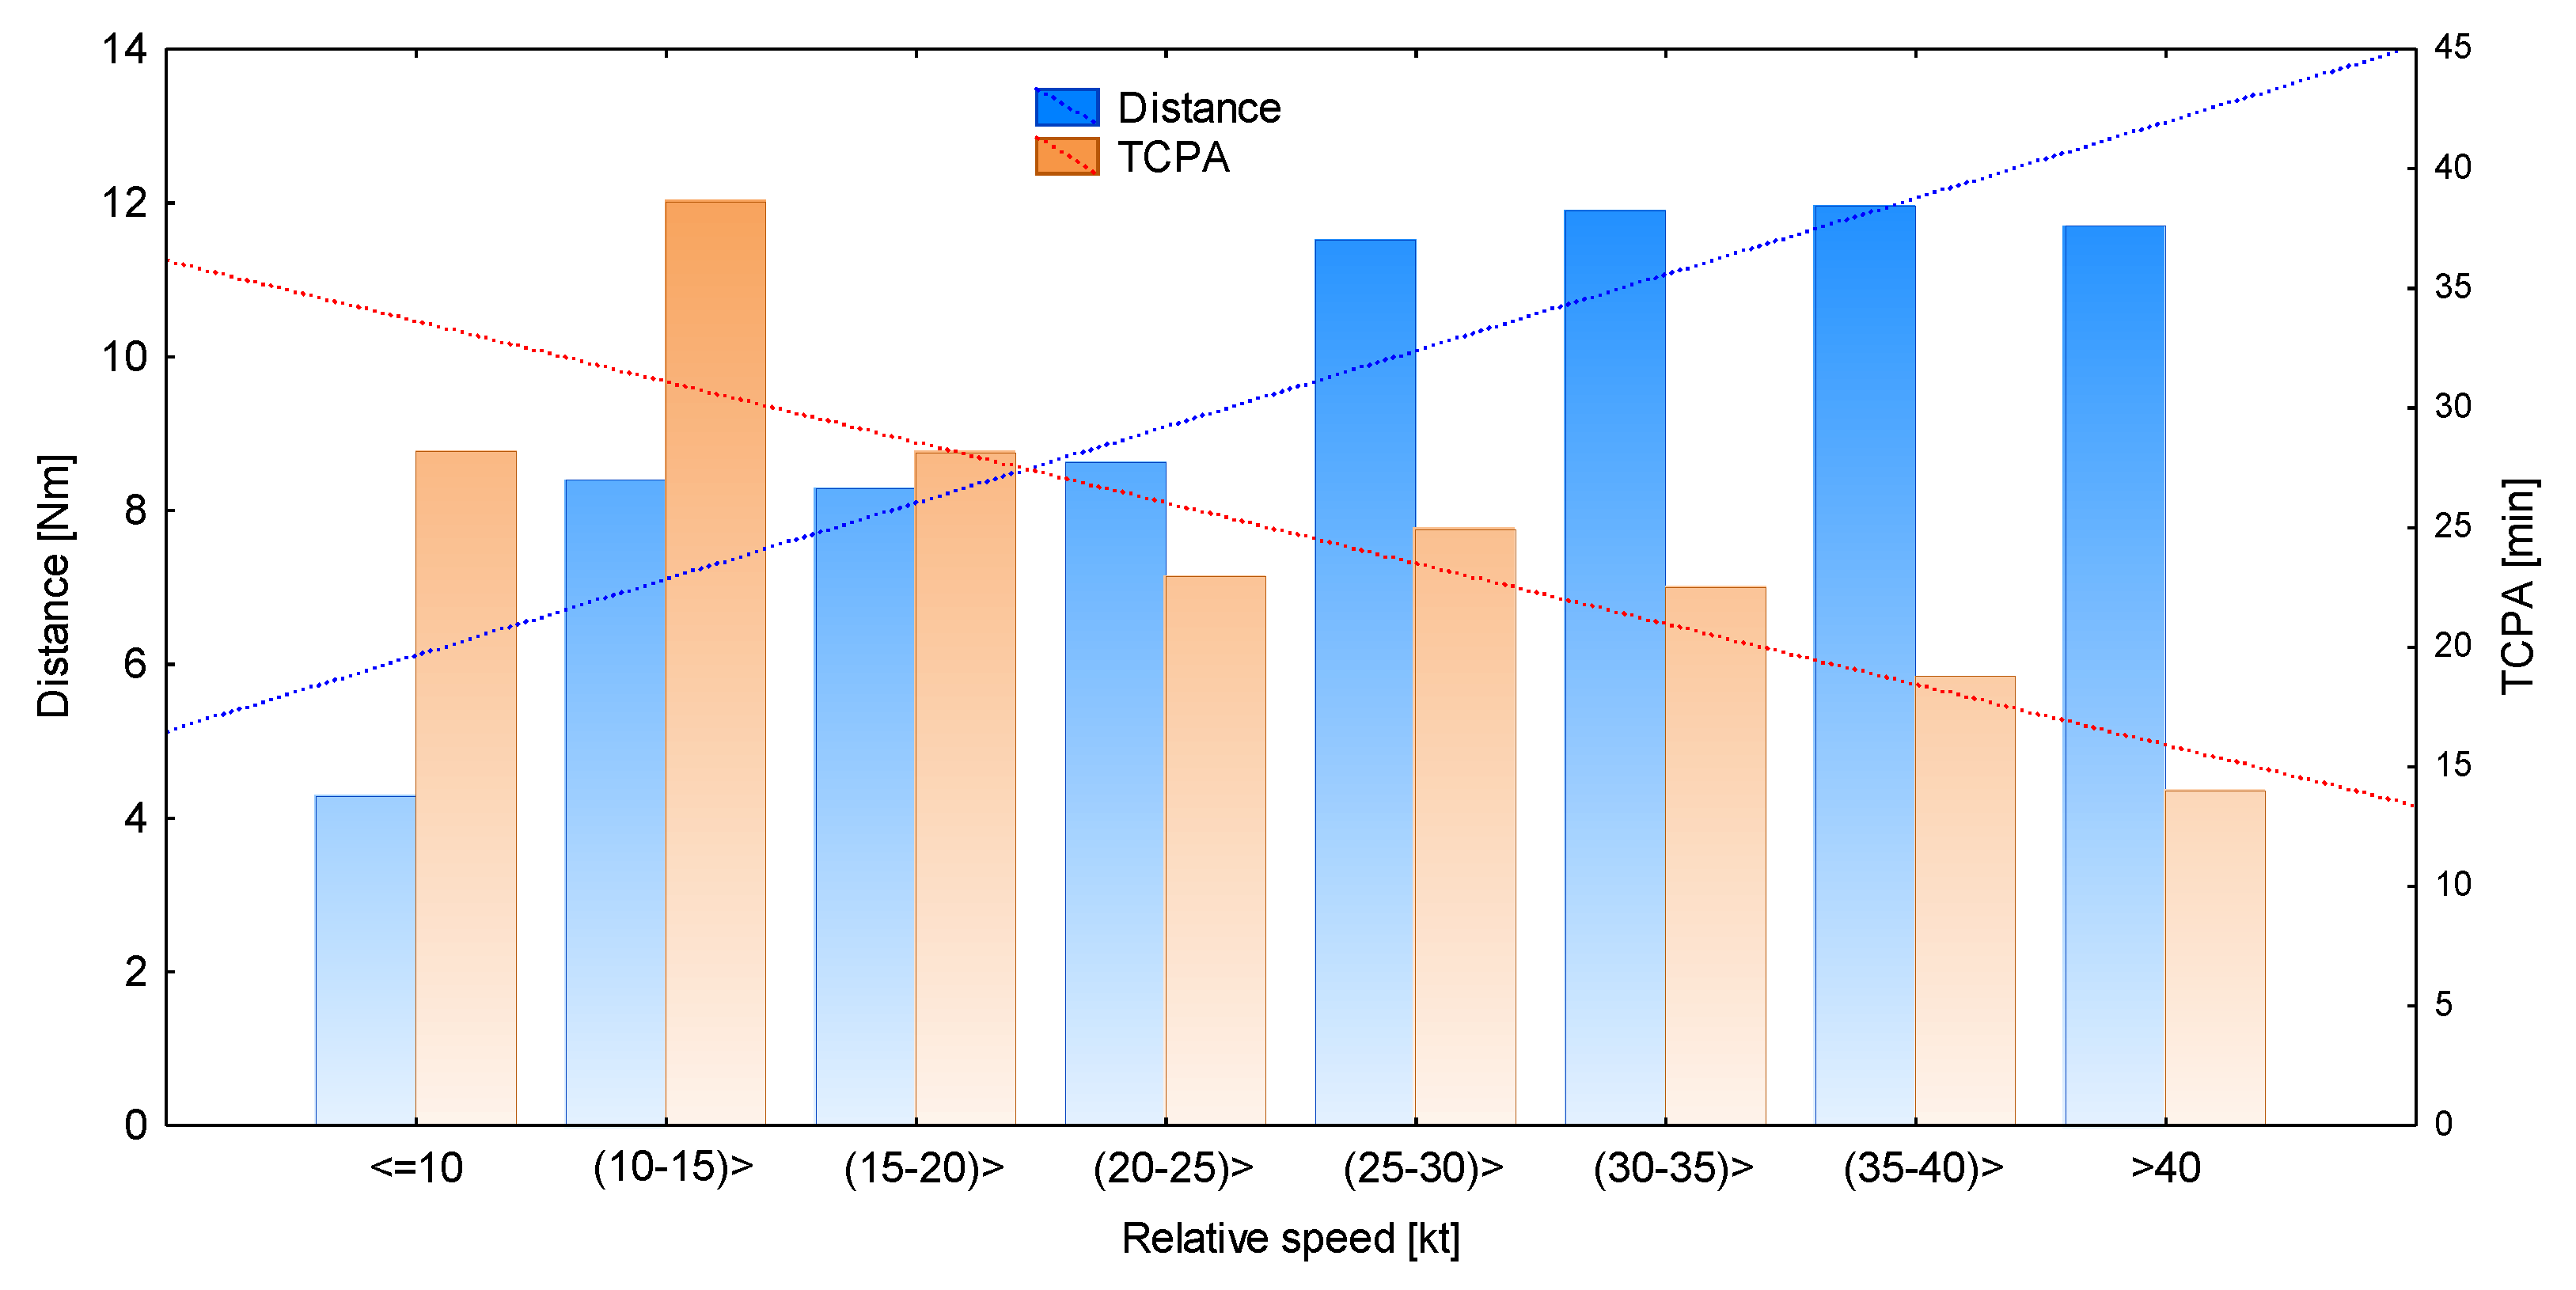
- Relative speed
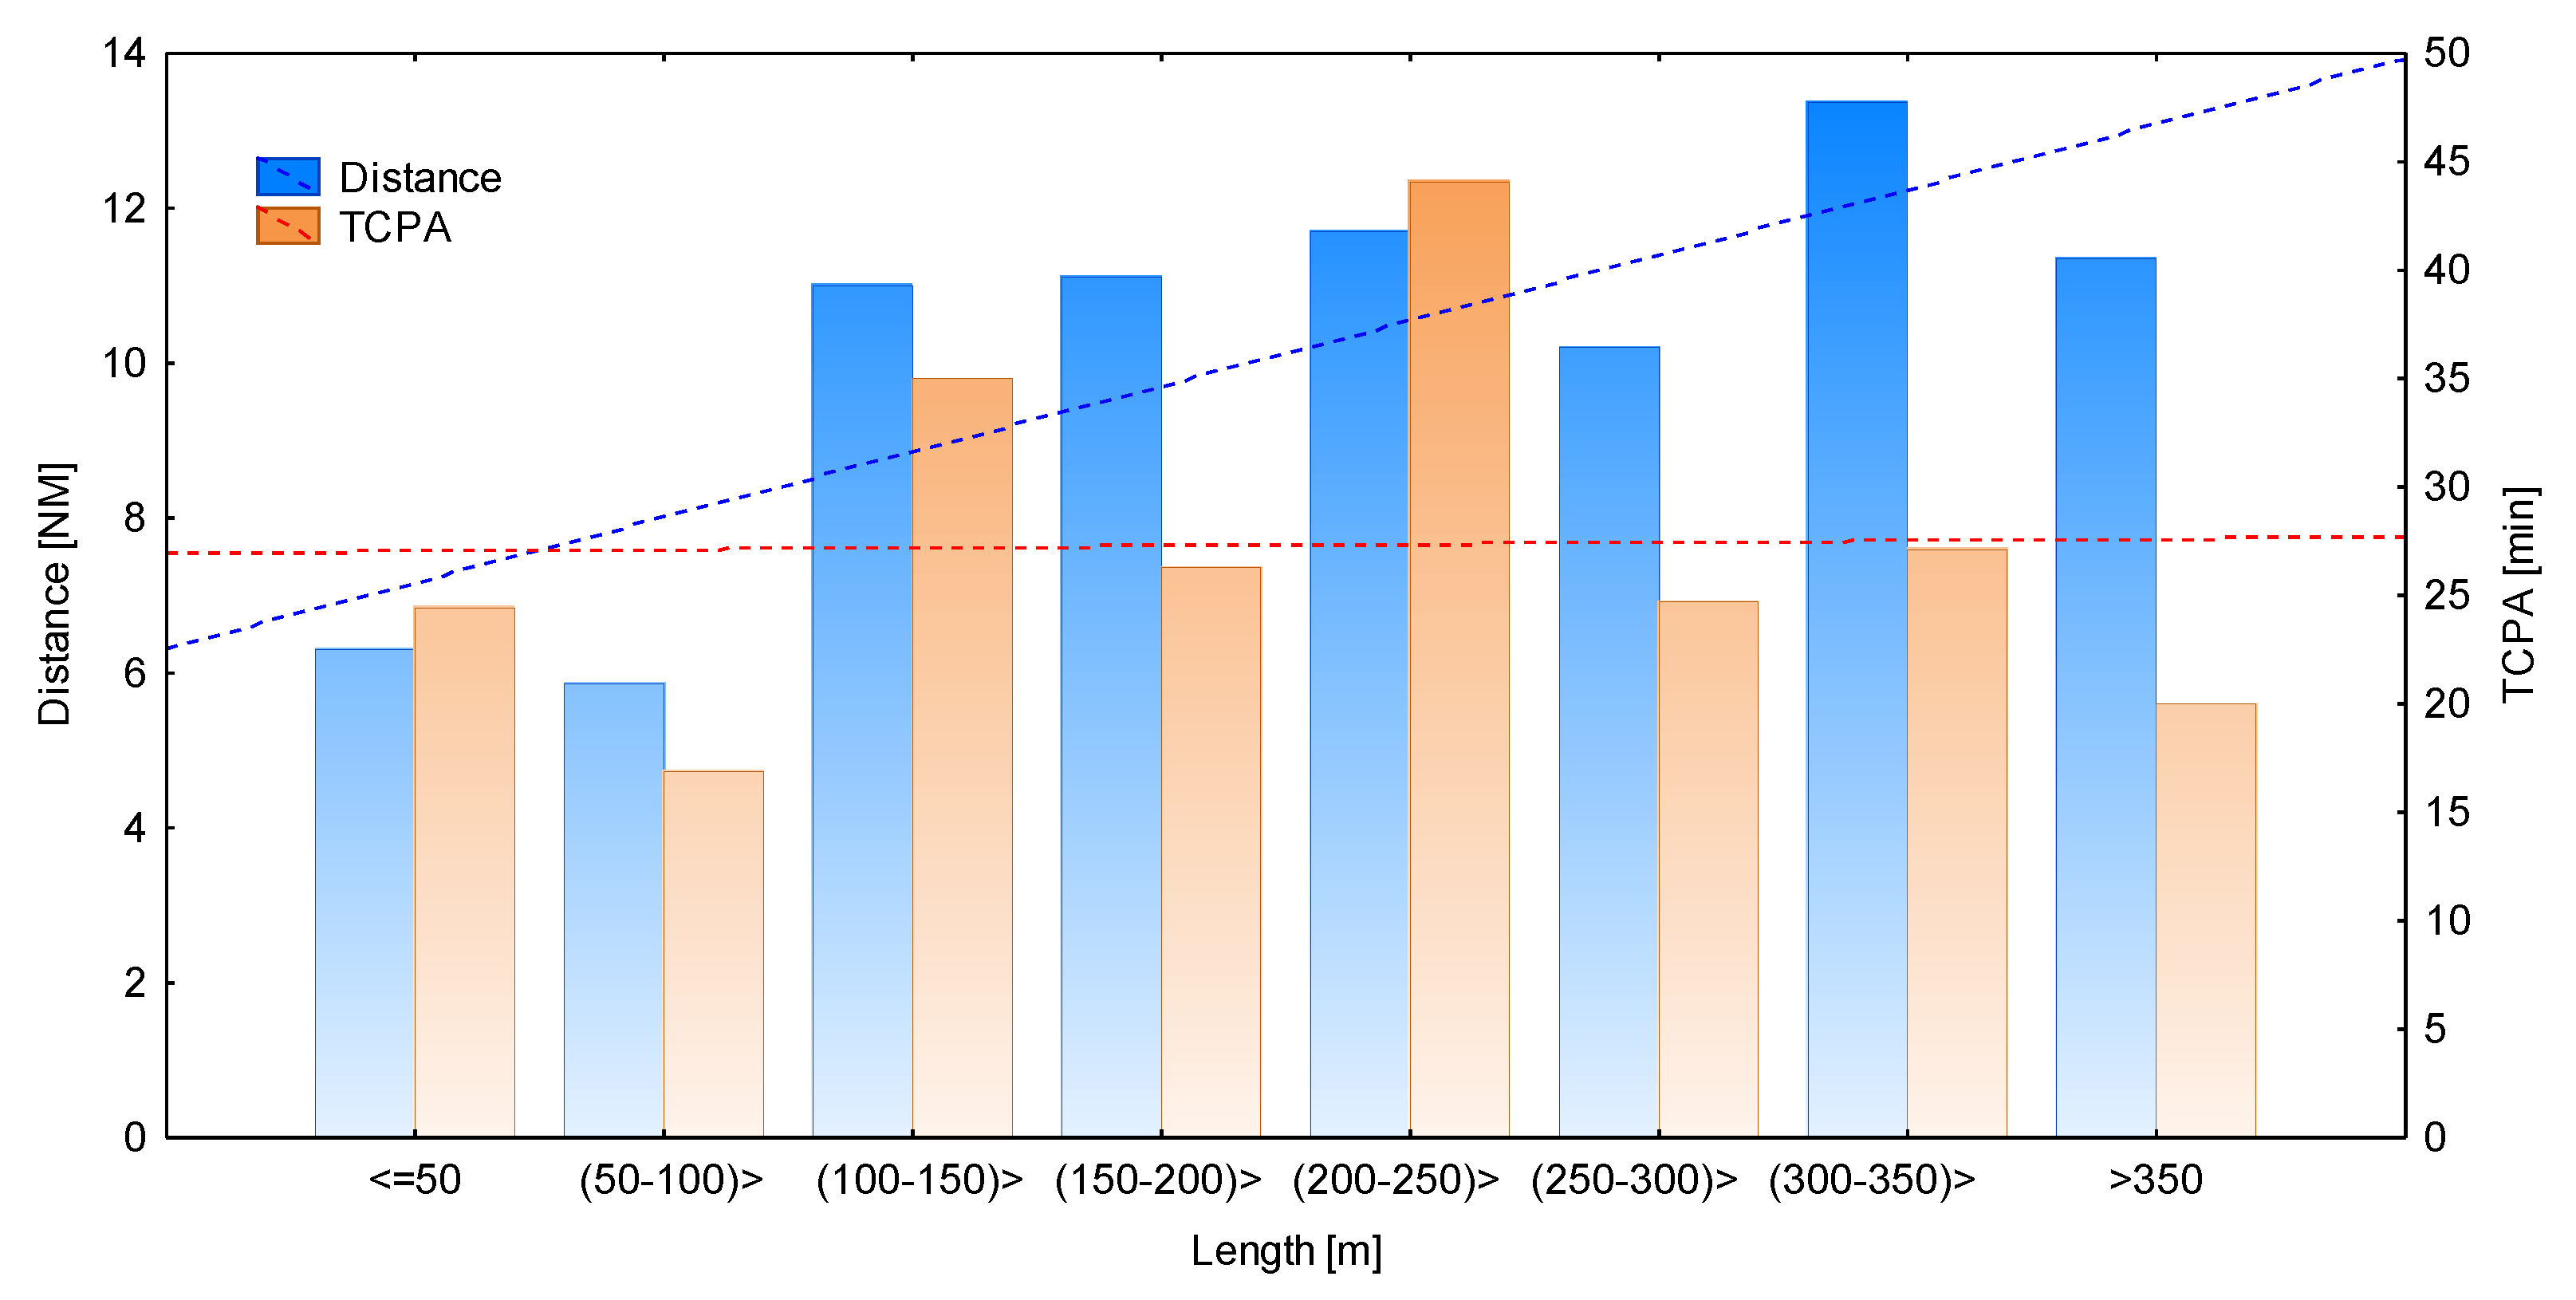
- The size of the target ship
3. Results
3.1. Stage I
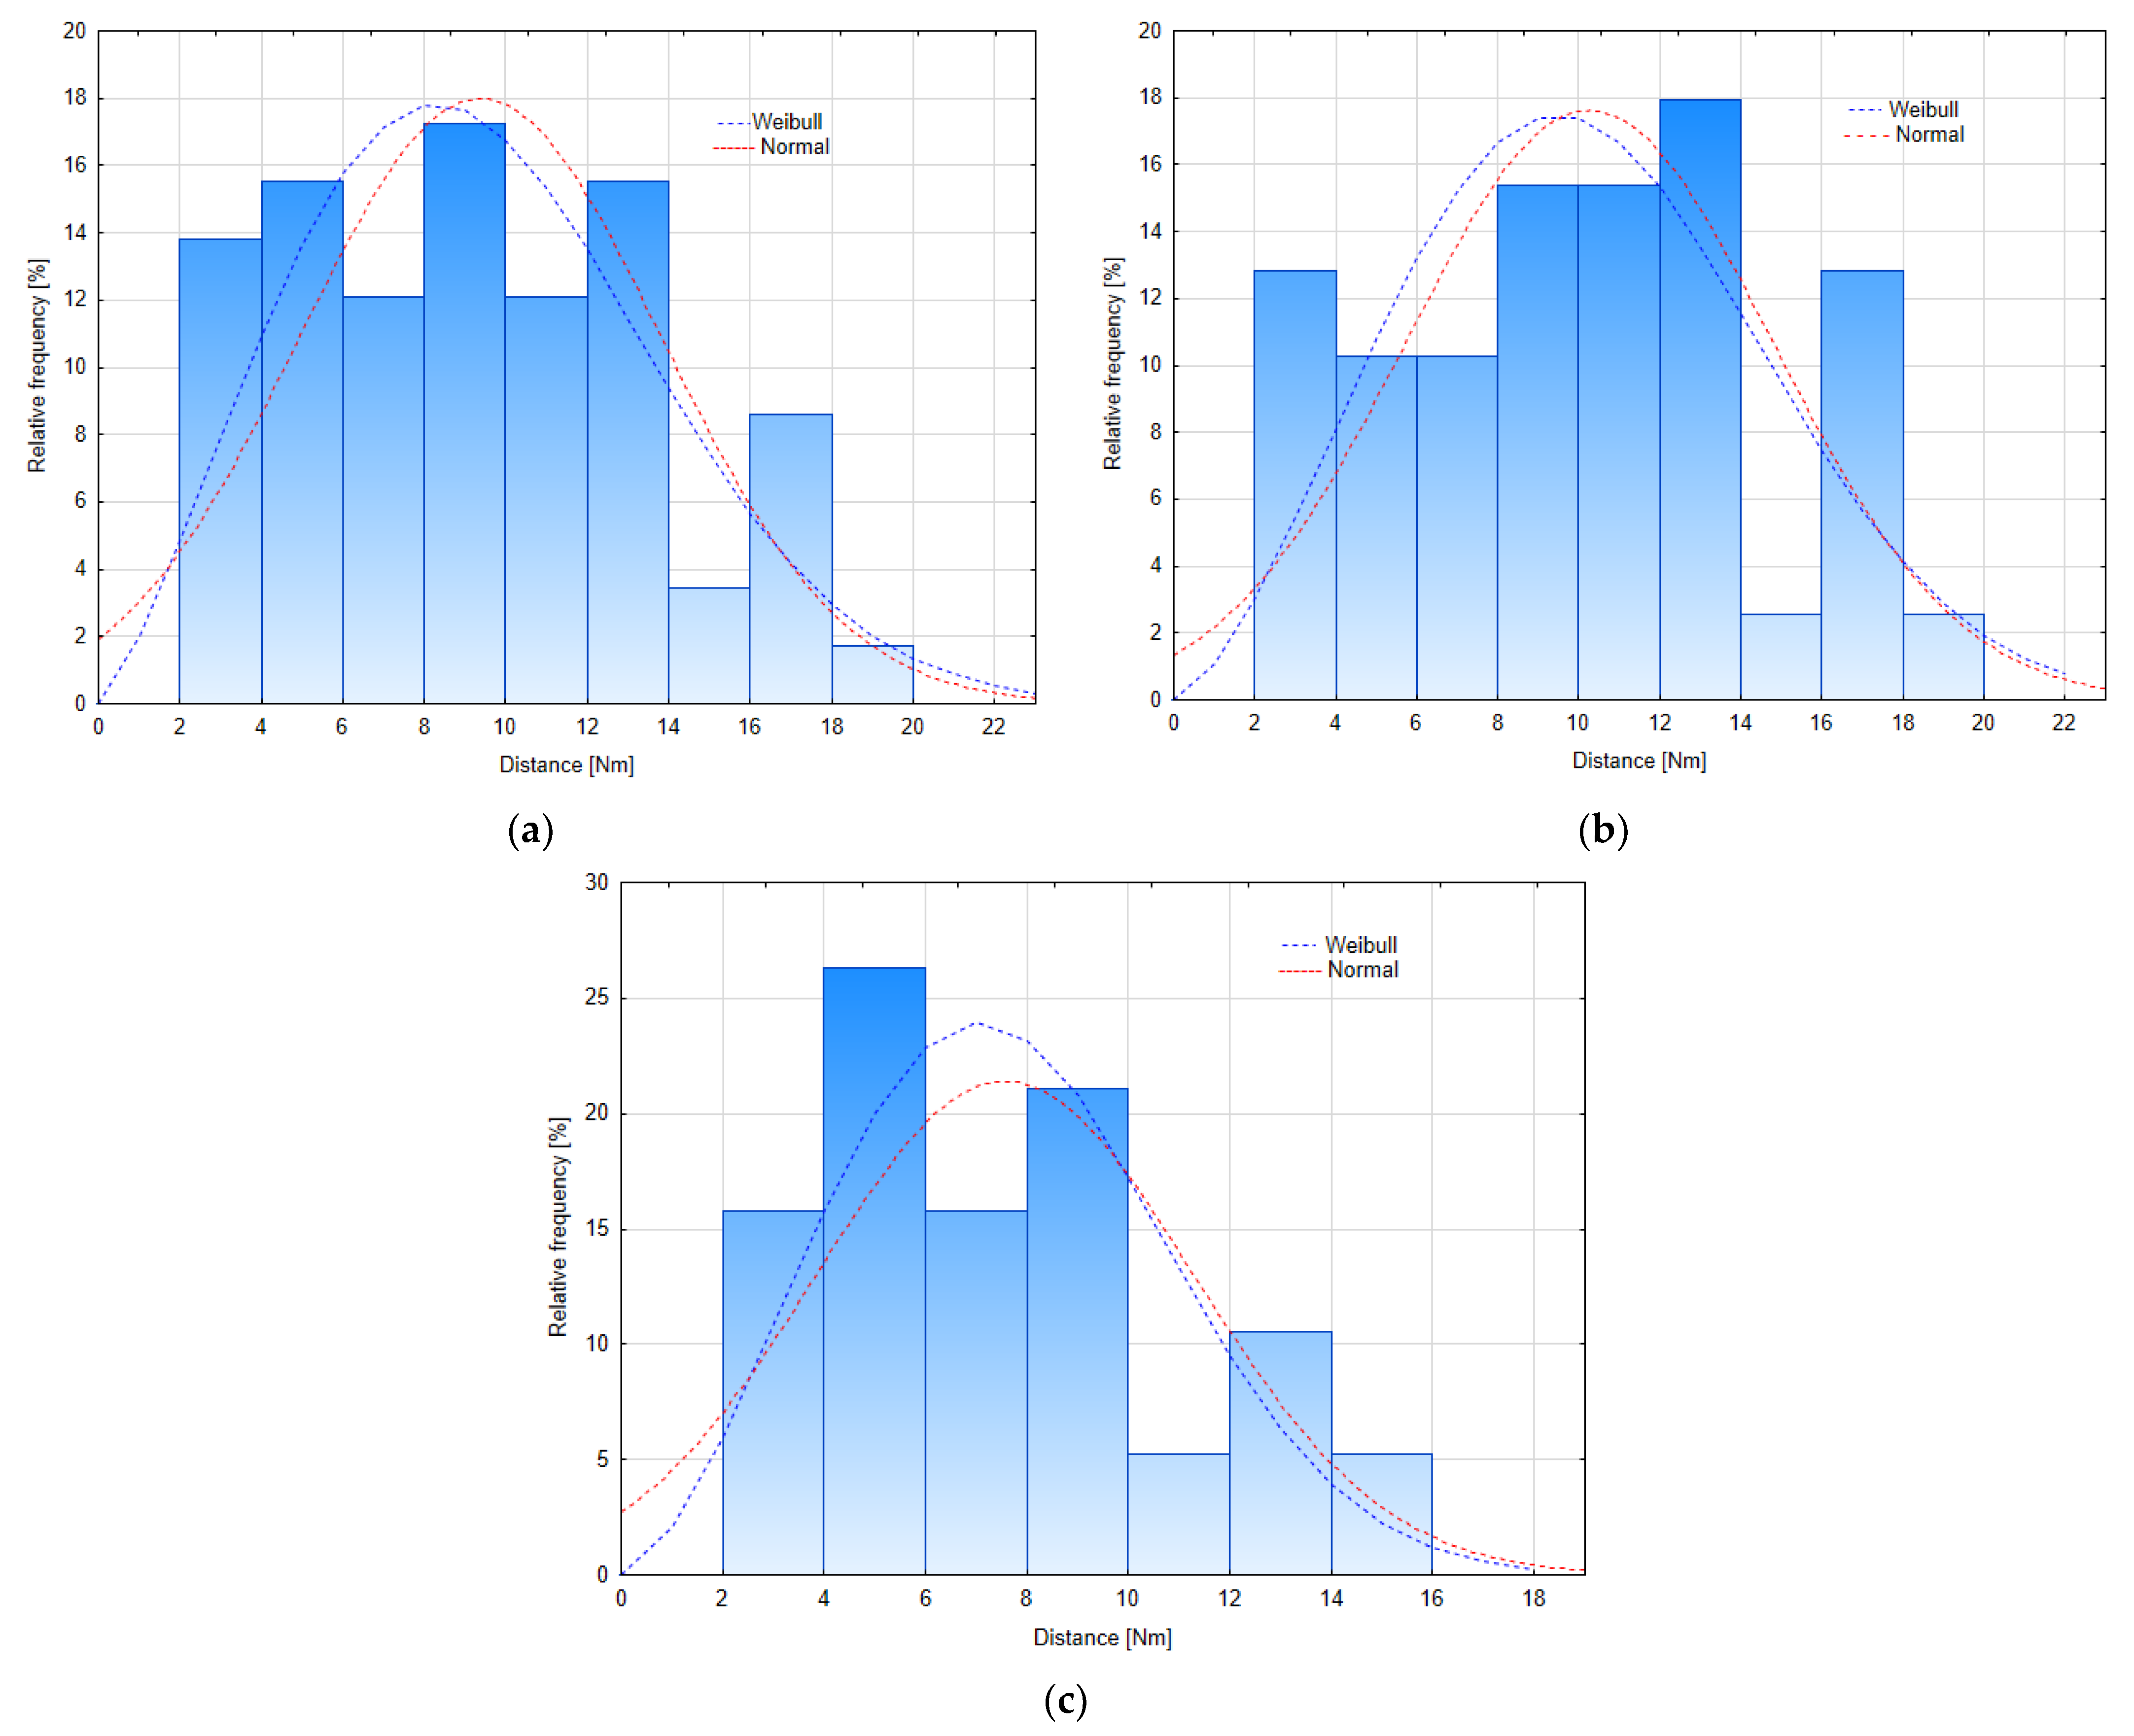
3.1.1. Distance between Ships at the Start of the Manoeuvre
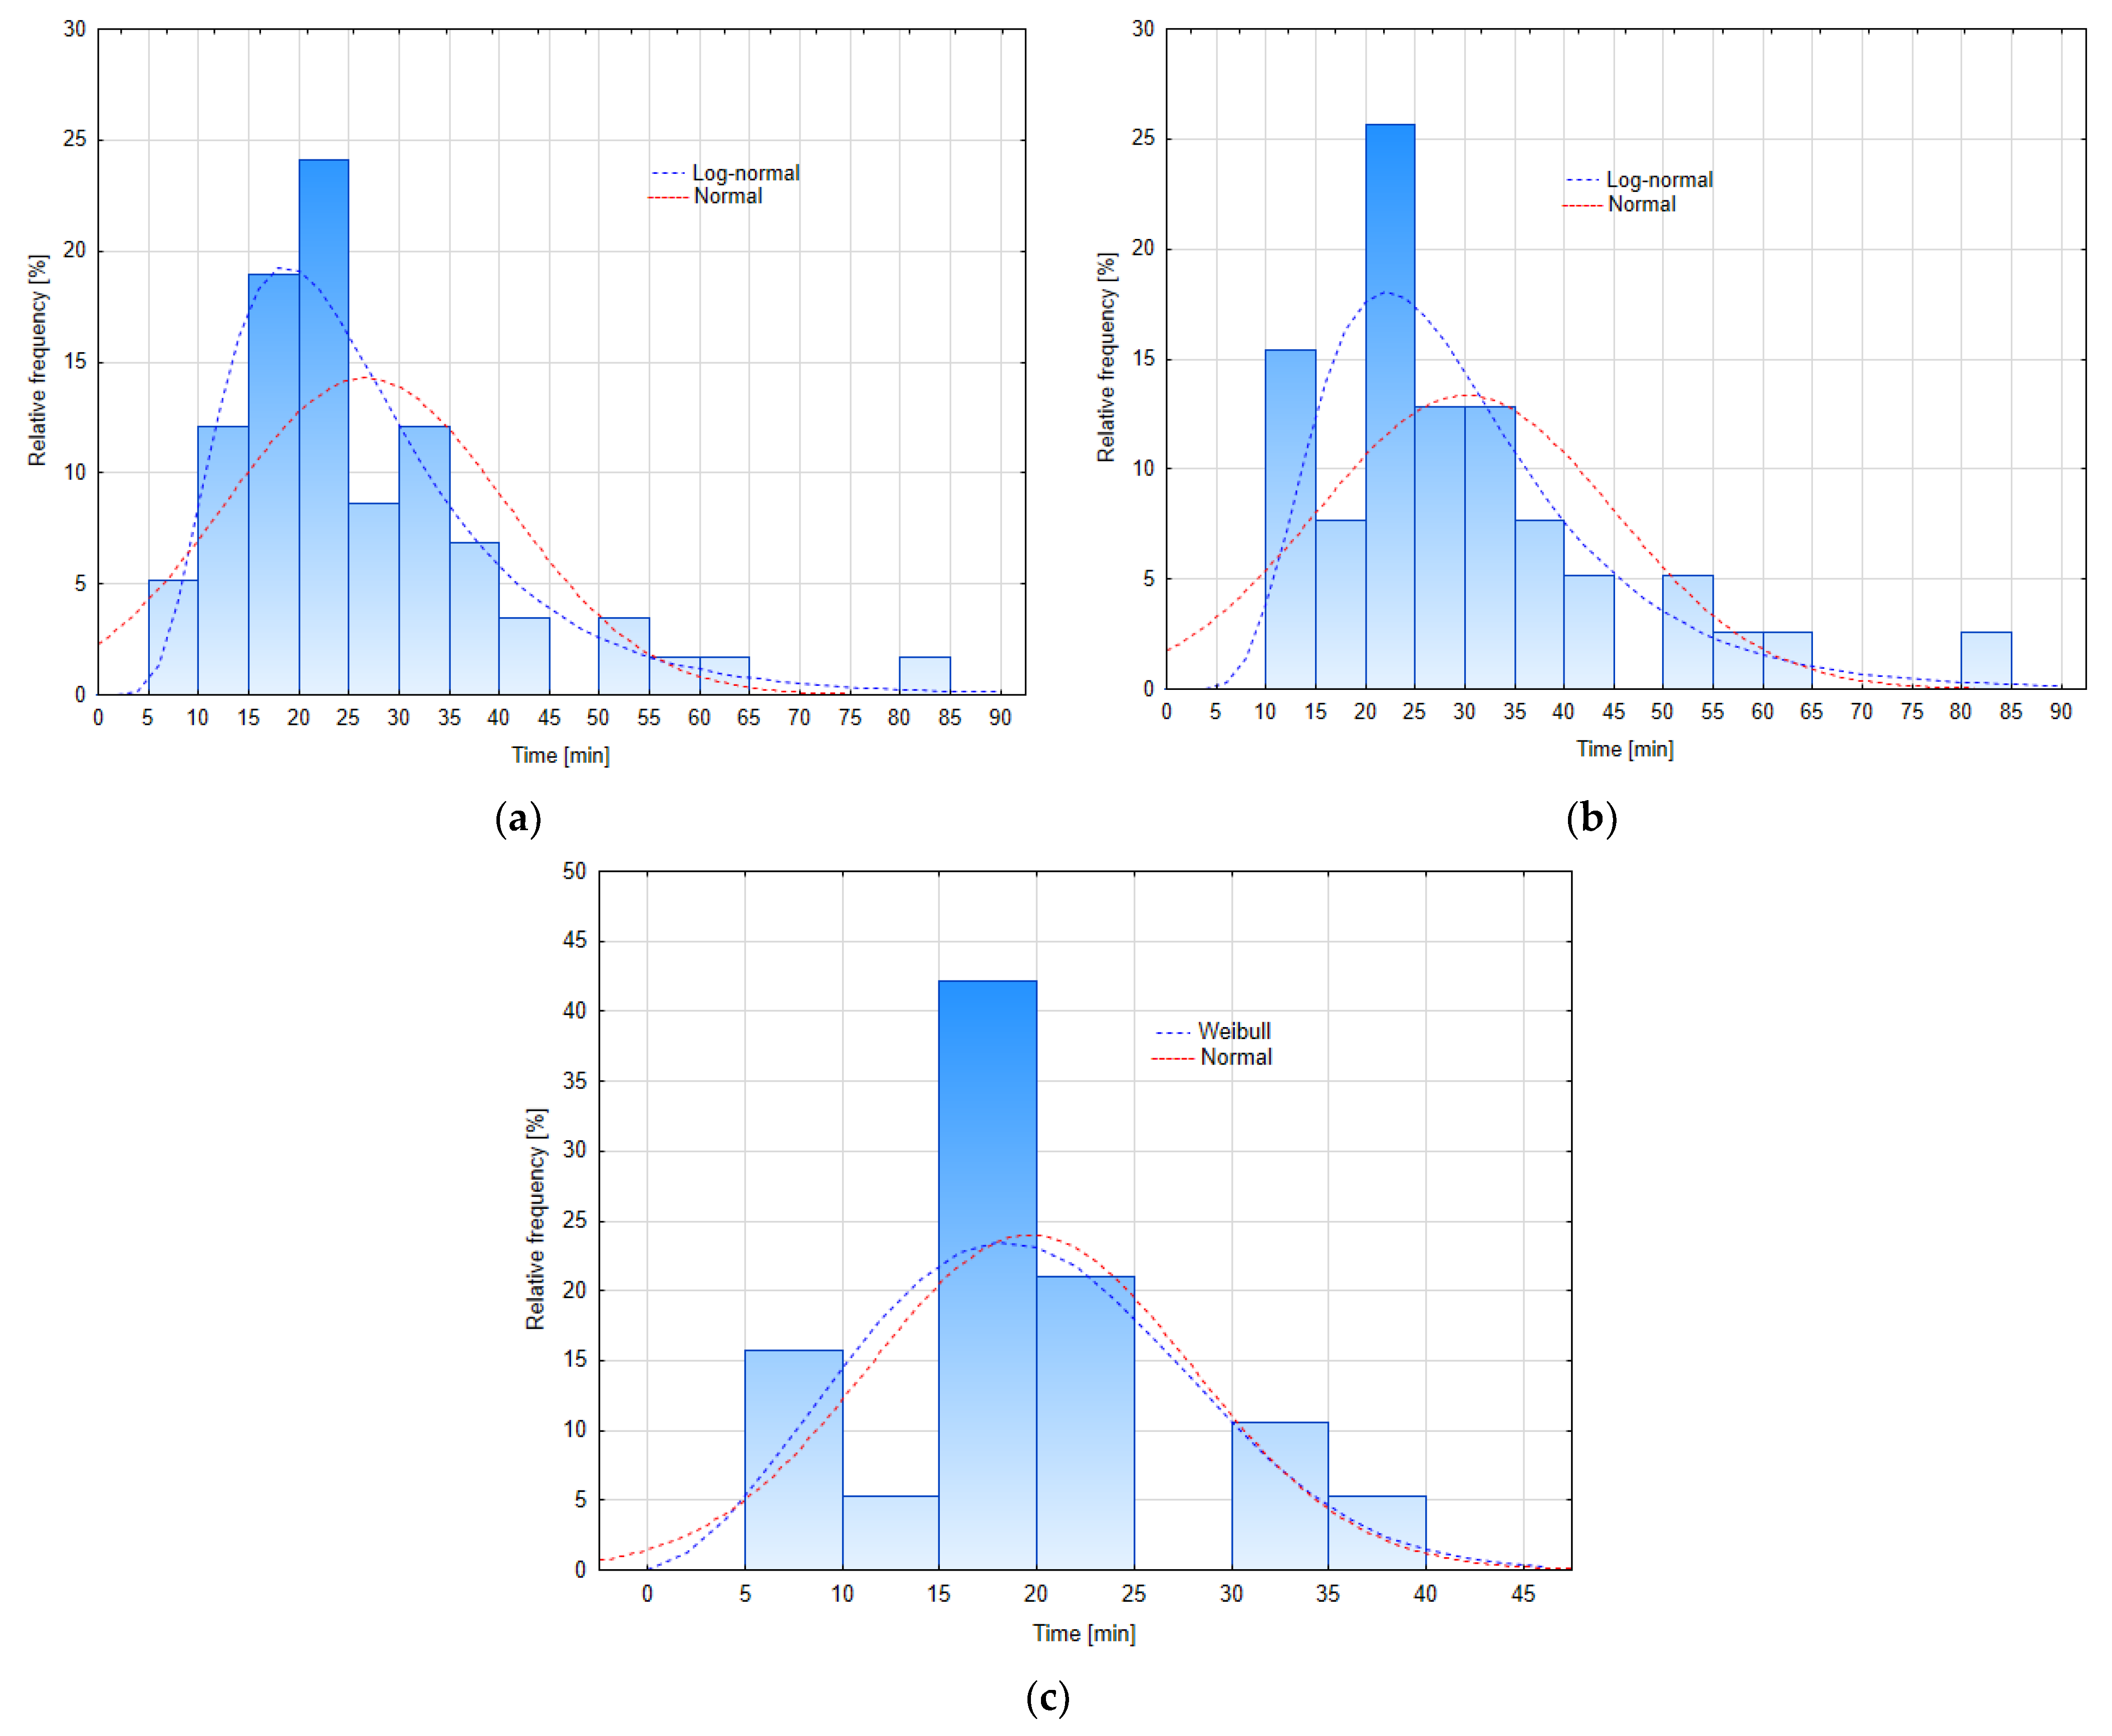
3.1.2. Time to CPA (TCPA) at the Start of the Manoeuvre
3.2. Stage II
3.2.1. Influence of Relative Speed on the Distance between Ships and TCPA at the Start of the Manoeuvre
3.2.2. Influence of the Size of the Target Ship on the Distance between the Ships and the TCPA at the Start of the Manoeuvre
4. Discussion and Conclusions
- Type of sea area
- Relative speed of the ships
- Size of the target ship
Author Contributions
Funding
Conflicts of Interest
References
- HELCOM. Shipping Accidents in the Baltic Sea 2018; Baltic Marine Environment Protection Commission: Helsinki, Finland, 2019; pp. 1–33. [Google Scholar]
- AGCS. Safety and Shipping Review 2020; Allianz Global Corporate & Speciality: Hongkong, China, 2020. [Google Scholar]
- EMSA. Annual Overview of Marine Casualties and Accidents 2020; European Maritime Safety Agency: Lisbon, Portugal, 2020. [Google Scholar]
- Soares, C.; Teixeira, A. Risk assessment in maritime transportation. Reliab. Eng. Syst. Saf. 2001, 74, 299–309. [Google Scholar] [CrossRef]
- Barnett, M.L. Searching for the root causes of maritime casualties. WMU J. Marit. Aff. 2005, 4, 131–145. [Google Scholar] [CrossRef]
- Acejo, I.; Sampson, H.; Turgo, N.; Ellis, N.; Tang, L. The Causes of Maritime Accidents in the Period 2002–2016; Seafarers International Research Centre (SIRC), Cardiff University: Cardiff, UK, 2018; pp. 1–18. [Google Scholar]
- IMO. Convention on the International Regulations for Preventing Collisions at Sea; International Maritime Organization: London, UK, 1972.
- Li, J.; Wang, H.; Guan, Z.; Pan, C. Distributed Multi-Objective Algorithm for Preventing Multi-Ship Collisions at Sea. J. Navig. 2020, 73, 971–990. [Google Scholar] [CrossRef]
- Zhang, J.; Zhang, D.; Yan, X.; Haugen, S.; Soares, C.G. A distributed anti-collision decision support formulation in multi-ship encounter situations under COLREGs. Ocean Eng. 2015, 105, 336–348. [Google Scholar] [CrossRef]
- Cockcroft, A.; Lameijer, J. A Guide to the Collision Avoidance Rules; Elsevier: Amsterdam, The Netherlands, 2012. [Google Scholar]
- Wang, X.; Liu, Z.; Cai, Y. The ship maneuverability based collision avoidance dynamic support system in close-quarters situation. Ocean Eng. 2017, 146, 486–497. [Google Scholar] [CrossRef]
- Liu, Z.; Wu, Z.; Zheng, Z. An Improved Danger Sector Model for Identifying the Collision Risk of Encountering Ships. J. Mar. Sci. Eng. 2020, 8, 609. [Google Scholar] [CrossRef]
- Aarsæther, K.G.; Moan, T. Combined maneuvering analysis, ais and full-mission simulation. TransNav Int. J. Mar. Navig. Saf. Sea Transp. 2007, 1, 31–36. [Google Scholar]
- Hansen, M.G.; Jensen, T.K.; Lehn-Schiøler, T.; Melchild, K.; Rasmussen, F.M.; Ennemark, F. Empirical Ship Domain based on AIS Data. J. Navig. 2013, 66, 931–940. [Google Scholar] [CrossRef] [Green Version]
- Szlapczynski, R.; Krata, P.; Szlapczynska, J. A Ship Domain-Based Method of Determining Action Distances for Evasive Manoeuvres in Stand-On Situations. J. Adv. Transp. 2018, 2018, 1–19. [Google Scholar] [CrossRef]
- Cordon, J.R.; Mestre, J.M.; Walliser, J. Human factors in seafaring: The role of situation awareness. Saf. Sci. 2017, 93, 256–265. [Google Scholar] [CrossRef]
- Yim, J.-B.; Park, D.-J.; Youn, I.-H. Development of Navigator Behavior Models for the Evaluation of Collision Avoidance Behavior in the Collision-Prone Navigation Environment. Appl. Sci. 2019, 9, 3114. [Google Scholar] [CrossRef] [Green Version]
- Žagar, D.; Svetina, M.; Košir, A.; Dimc, F. Human Factor in Navigation: Overview of Cognitive Load Measurement during Simulated Navigational Tasks. J. Mar. Sci. Eng. 2020, 8, 775. [Google Scholar] [CrossRef]
- Zhou, K.; Chen, J.; Liu, X. Optimal Collision-Avoidance Manoeuvres to Minimise Bunker Consumption under the Two-Ship Crossing Situation. J. Navig. 2017, 71, 151–168. [Google Scholar] [CrossRef]
- Fang, M.-C.; Tsai, K.-Y.; Fang, C.-C. A Simplified Simulation Model of Ship Navigation for Safety and Collision Avoidance in Heavy Traffic Areas. J. Navig. 2017, 71, 837–860. [Google Scholar] [CrossRef]
- Hu, Y.; Zhang, A.; Tian, W.; Zhang, J.; Hou, Z. Multi-Ship Collision Avoidance Decision-Making Based on Collision Risk Index. J. Mar. Sci. Eng. 2020, 8, 640. [Google Scholar] [CrossRef]
- Ni, S.; Liu, Z.; Cai, Y. Ship Manoeuvrability-Based Simulation for Ship Navigation in Collision Situations. J. Mar. Sci. Eng. 2019, 7, 90. [Google Scholar] [CrossRef] [Green Version]
- Pietrzykowski, Z.; Wołejsza, P.; Borkowski, P. Decision Support in Collision Situations at Sea. J. Navig. 2016, 70, 447–464. [Google Scholar] [CrossRef]
- Hu, L.; Naeem, W.; Rajabally, E.; Watson, G.; Mills, T.; Bhuiyan, Z.; Salter, I. COLREGs-Compliant Path Planning for Autonomous Surface Vehicles: A Multiobjective Optimization Approach. The authors should like to thank Innovate UK, grant reference, TSB 102308, for the funding of this project. IFAC PapersOnLine 2017, 50, 13662–13667. [Google Scholar] [CrossRef]
- He, Y.; Jin, Y.; Huang, L.; Xiong, Y.; Chen, P.; Mou, J. Quantitative analysis of COLREG rules and seamanship for autonomous collision avoidance at open sea. Ocean Eng. 2017, 140, 281–291. [Google Scholar] [CrossRef]
- Huang, Y.; van Gelder, P.; Wen, Y. Velocity obstacle algorithms for collision prevention at sea. Ocean Eng. 2018, 151, 308–321. [Google Scholar] [CrossRef]
- Shen, H.; Hashimoto, H.; Matsuda, A.; Taniguchi, Y.; Terada, D.; Guo, C. Automatic collision avoidance of multiple ships based on deep Q-learning. Appl. Ocean Res. 2019, 86, 268–288. [Google Scholar] [CrossRef]
- Brcko, T.; Androjna, A.; Srše, J.; Boć, R. Vessel Multi-Parametric Collision Avoidance Decision Model: Fuzzy Approach. J. Mar. Sci. Eng. 2021, 9, 49. [Google Scholar] [CrossRef]


| LOA | 366 [m] |
| Breadth | 48 [m] |
| Gross tonnage | 140,000 |
| Max. draft | 16 [m] |
| Speed | 19.2 [kt] |
| Value | All Situations | Open Sea | Restricted Sea |
|---|---|---|---|
| Mean | 9.4 NM | 10.3 NM | 7.6 NM |
| Standard deviation | 4.4. NM | 4.5 NM | 3.7 NM |
| Min | 2.7 NM | 3.5 NM | 2.7 NM |
| Max | 19.8 NM | 19.8 NM | 14.8 NM |
| Range | 17.1 NM | 16.3 NM | 12.1 NM |
| S-W p-value | 0.0295 | 0.16 | 0.14 |
| Distribution | All Situations | Open Sea Area | Restricted Sea Are | ||||||
|---|---|---|---|---|---|---|---|---|---|
| K-S p-Value | Chi-Squared p-Value | Distribution Parameters | K-S p-Value | Chi-Squared p-Value | Distribution Parameters | K-S p-Value | Chi-Squared p-Value | Distribution Parameters | |
| Weibull | 0.445 | 0.301 | 10.62; 2.30 | 0.797 | 0.223 | 11.59; 2.51 | 0.698 | N/A | 8.59; 2.56 |
| Normal | 0.406 | 0.002 | 9.38; 4.44 | 0.849 | 0.472 | 10.26; 4.53 | 0.502 | N/A | 7.57; 3.73 |
| Rayleigh | 0.384 | 0.166 | 7.32 | 0.368 | 0.728 | 7.91 | 0.672 | 0.335 | 5.93 |
| Log-normal | 0.132 | 0.025 | 2.11; 0.53 | 0.293 | 0.112 | 2.22; 0.51 | 0.497 | N/A | 1.90; 0.52 |
| Value | All Situations | Open Sea | Restricted Sea |
|---|---|---|---|
| Mean | 26.7 min | 30.1 min | 19.7 min |
| Standard deviation | 14.0 min | 14.9 min | 8.3 min |
| Min | 5.5 min | 13.2 min | 5.5 min |
| Max | 82 min | 82 min | 39 min |
| Range | 76.5 min | 68.8 min | 33.5 min |
| S-W p-value | 0.00002 | 0.0002 | 0.481 |
| Distribution | All Situations | Open Sea Area | Restricted Sea Are | ||||||
|---|---|---|---|---|---|---|---|---|---|
| K-S p-Value | chi-Squared p-Value | Distribution Parameters | K-S p-Value | Chi-Squared p-Value | Distribution Parameters | K-S p-Value | chi-Squared p-Value | Distribution Parameters | |
| Log-normal | 0.932 | 0.718 | 3.17; 0.49 | 0.832 | 0.389 | 3.30; 0.45 | 0.406 | N/A | 2.88; 0.47 |
| Rayleigh | 0.356 | 0.560 | 21.27 | 0.363 | 0.024 | 23.71 | 0.266 | 0.071 | 15.04 |
| Weibull | 0.297 | 0.168 | 30.25; 2.05 | 0.408 | 0.252 | 34.15; 2.17 | 0.782 | N/A | 22.16; 2.60 |
| Normal | 0.079 | 0.009 | 26.7; 14.0 | 0.172 | 0.105 | 30.1; 14.9 | 0.631 | N/A | 19.67; 8.31 |
Publisher’s Note: MDPI stays neutral with regard to jurisdictional claims in published maps and institutional affiliations. |
© 2021 by the authors. Licensee MDPI, Basel, Switzerland. This article is an open access article distributed under the terms and conditions of the Creative Commons Attribution (CC BY) license (https://creativecommons.org/licenses/by/4.0/).
Share and Cite
Przywarty, M.; Boć, R.; Brcko, T.; Perkovič, M. Factors Influencing the Action Point of the Collision Avoidance Manoeuvre. Appl. Sci. 2021, 11, 7299. https://doi.org/10.3390/app11167299
Przywarty M, Boć R, Brcko T, Perkovič M. Factors Influencing the Action Point of the Collision Avoidance Manoeuvre. Applied Sciences. 2021; 11(16):7299. https://doi.org/10.3390/app11167299
Chicago/Turabian StylePrzywarty, Marcin, Renata Boć, Tanja Brcko, and Marko Perkovič. 2021. "Factors Influencing the Action Point of the Collision Avoidance Manoeuvre" Applied Sciences 11, no. 16: 7299. https://doi.org/10.3390/app11167299
APA StylePrzywarty, M., Boć, R., Brcko, T., & Perkovič, M. (2021). Factors Influencing the Action Point of the Collision Avoidance Manoeuvre. Applied Sciences, 11(16), 7299. https://doi.org/10.3390/app11167299