
Evaluation of Shear Effect on Deflection of RC Beams


Abstract
:1. Introduction
2. Experimental Study
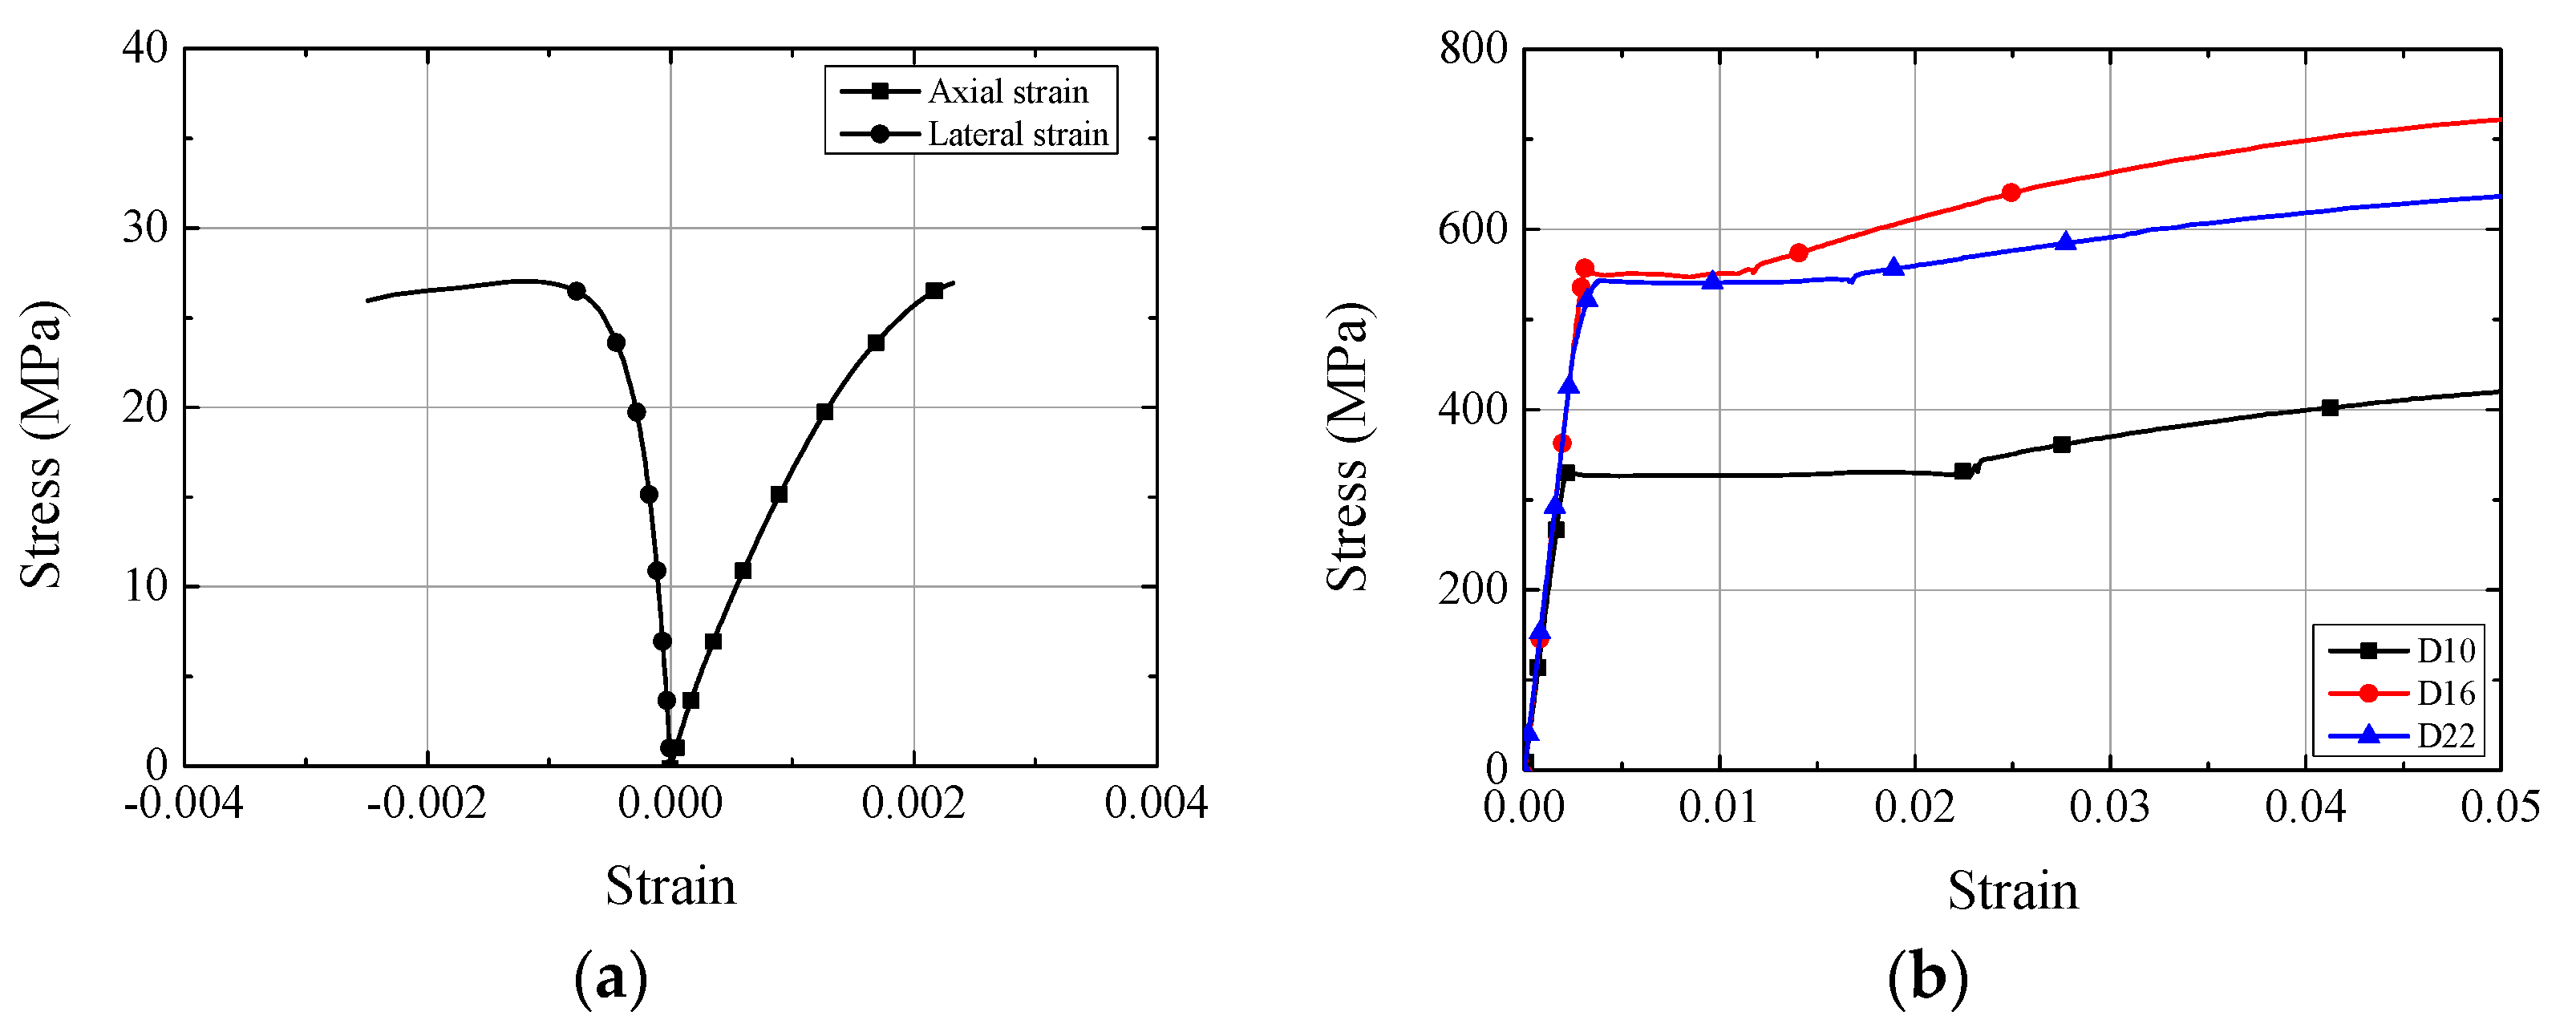
2.1. Materials
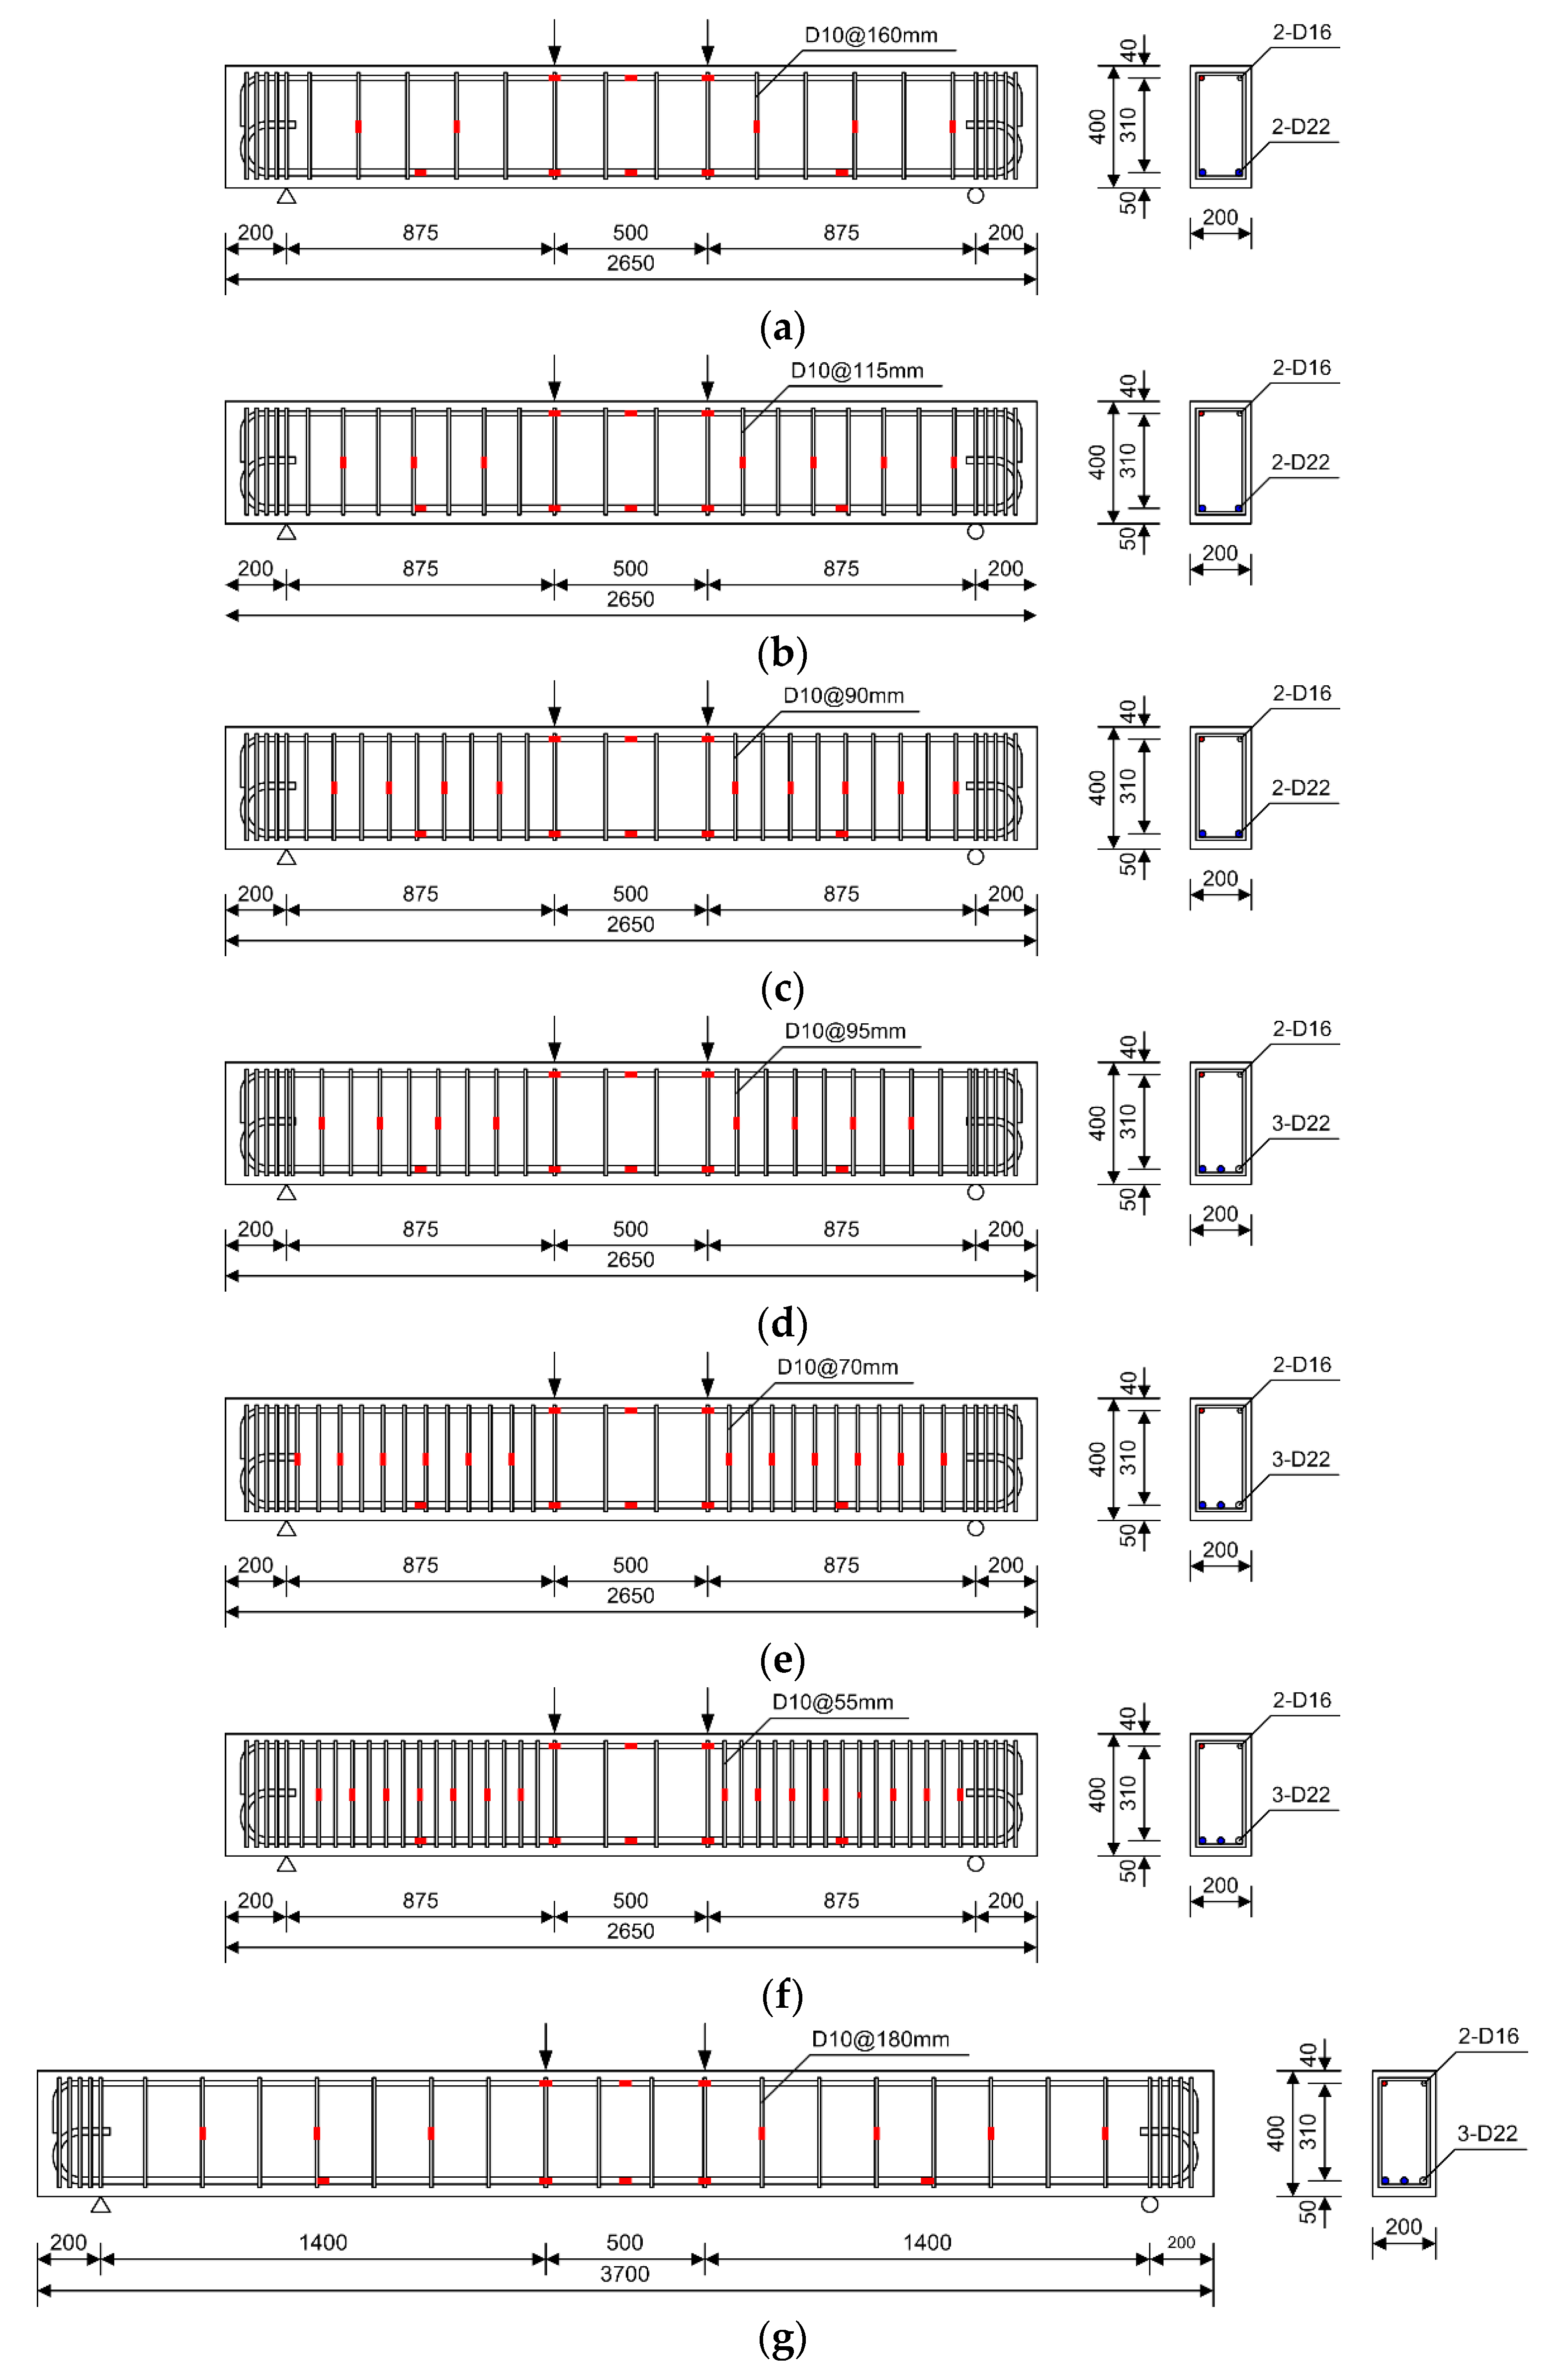
2.2. Test Specimens
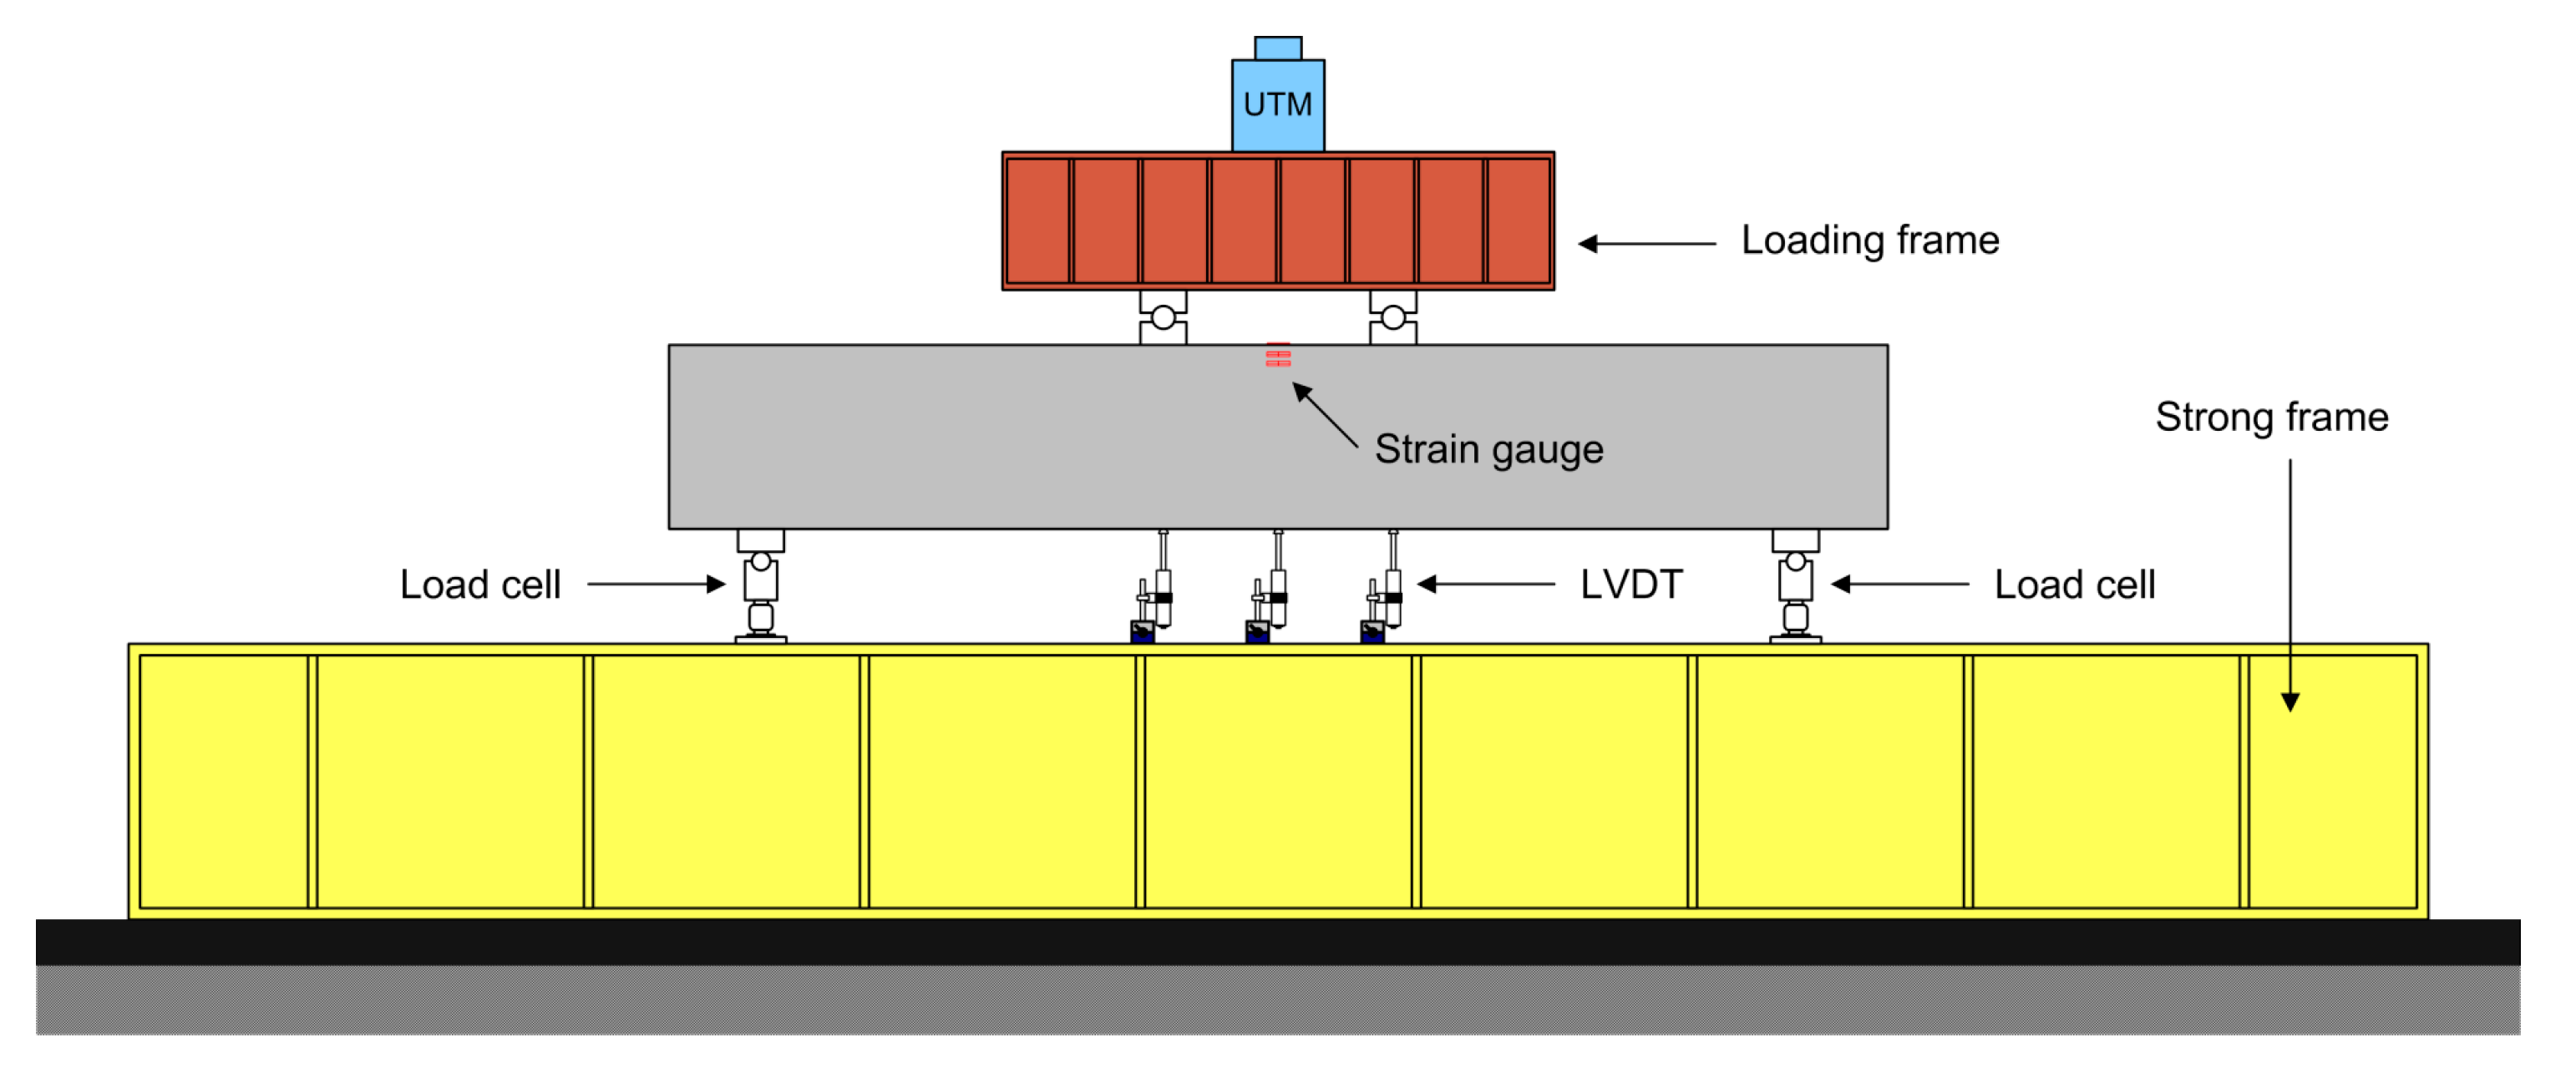
2.3. Test Setup and Loading Procedure
3. Experimental Results
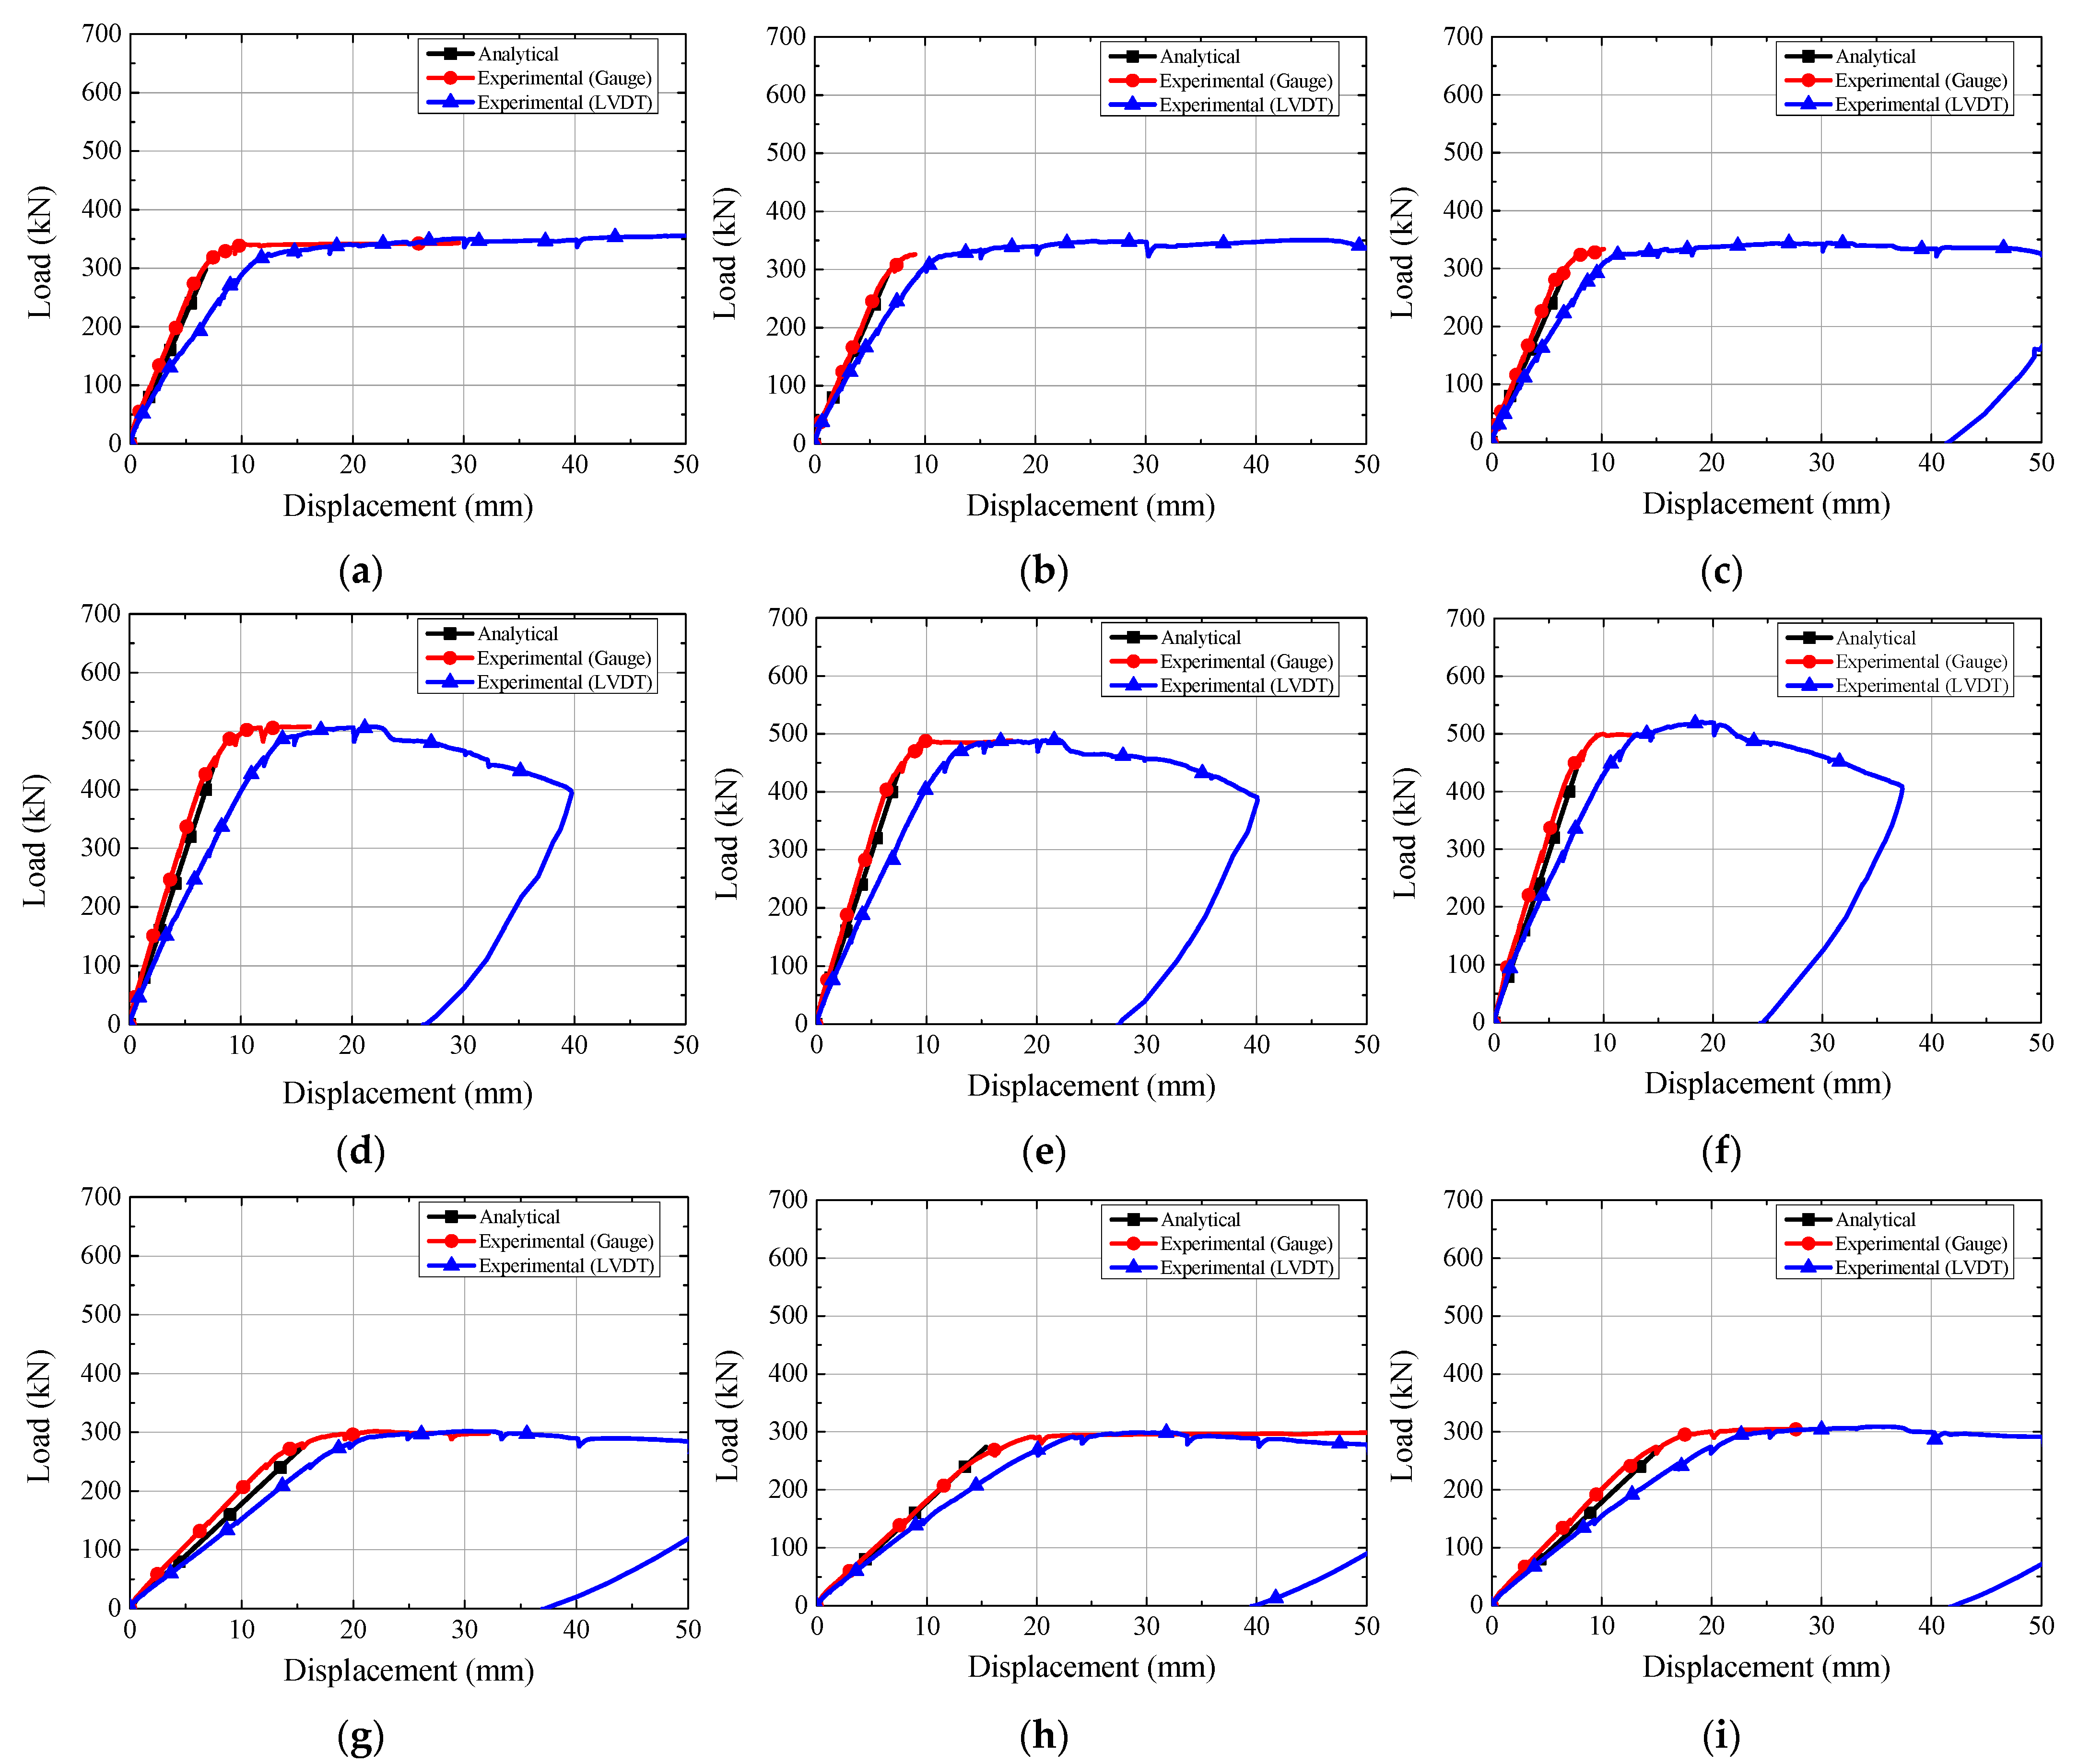
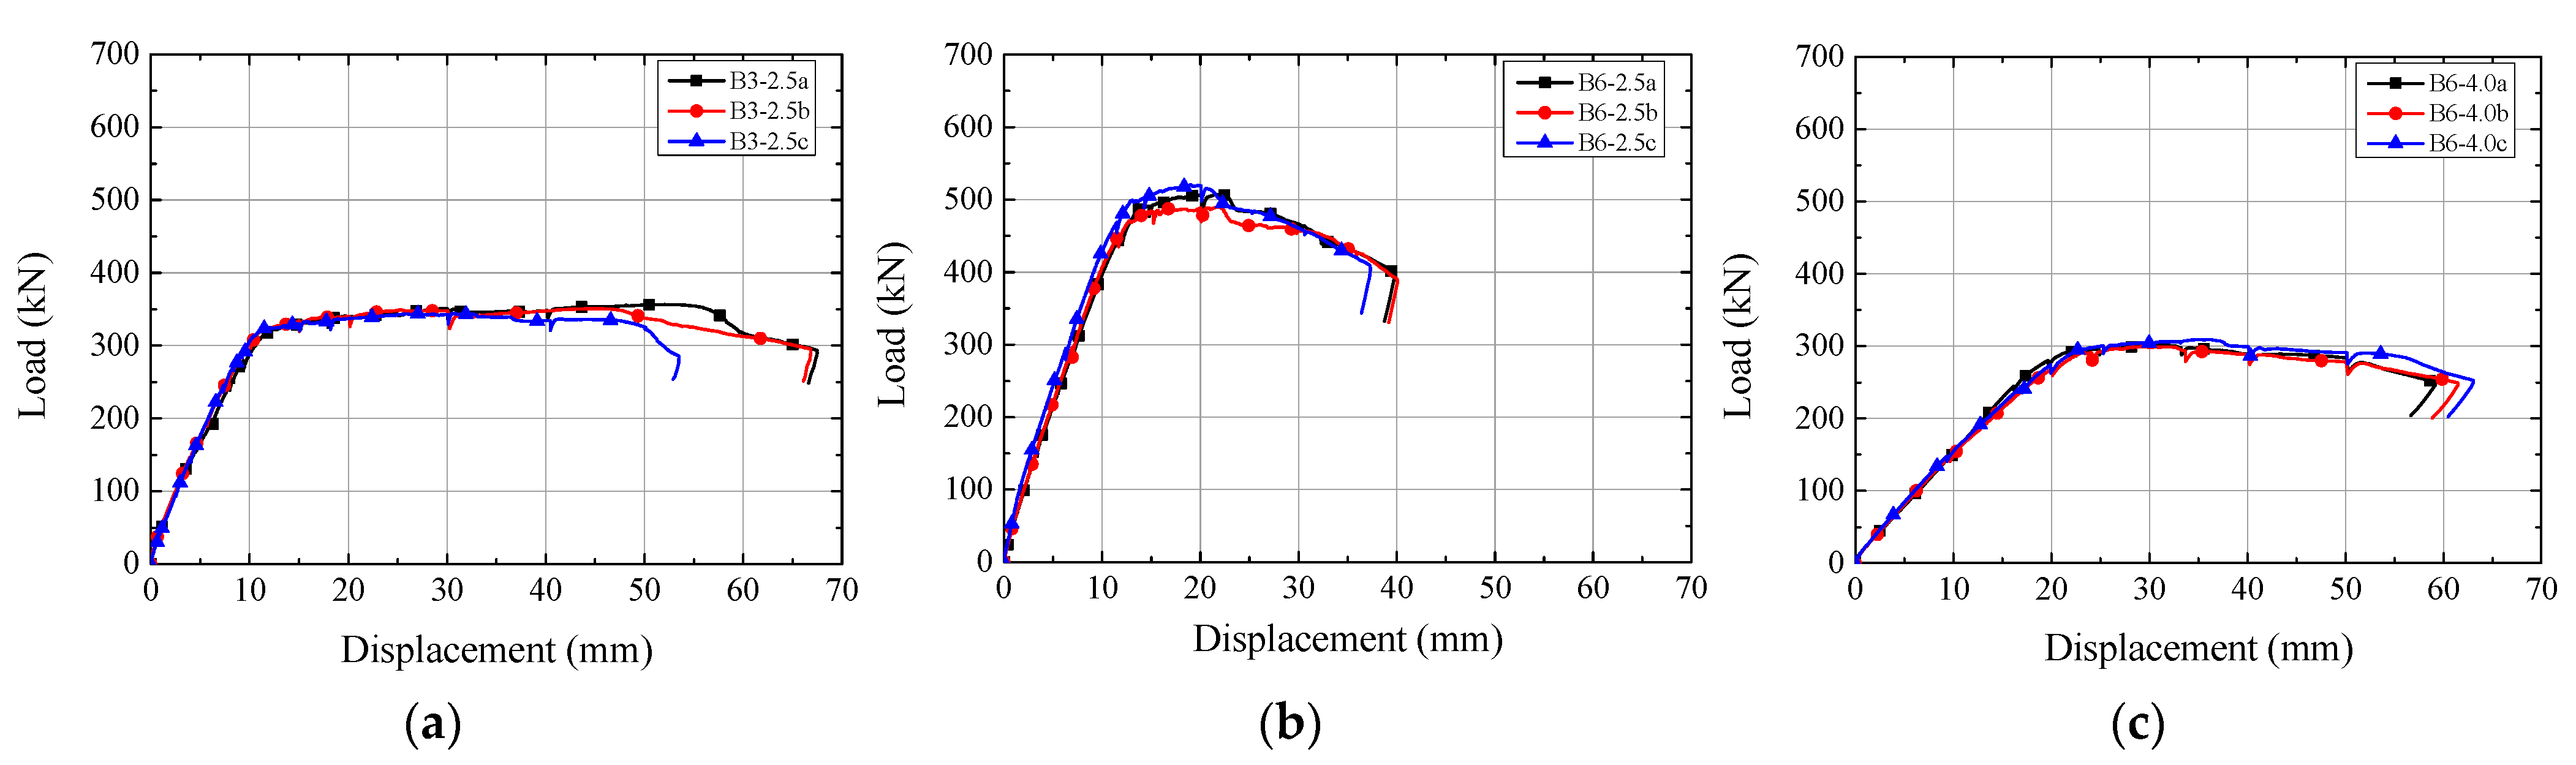
3.1. Load vs. Deflection Relationships
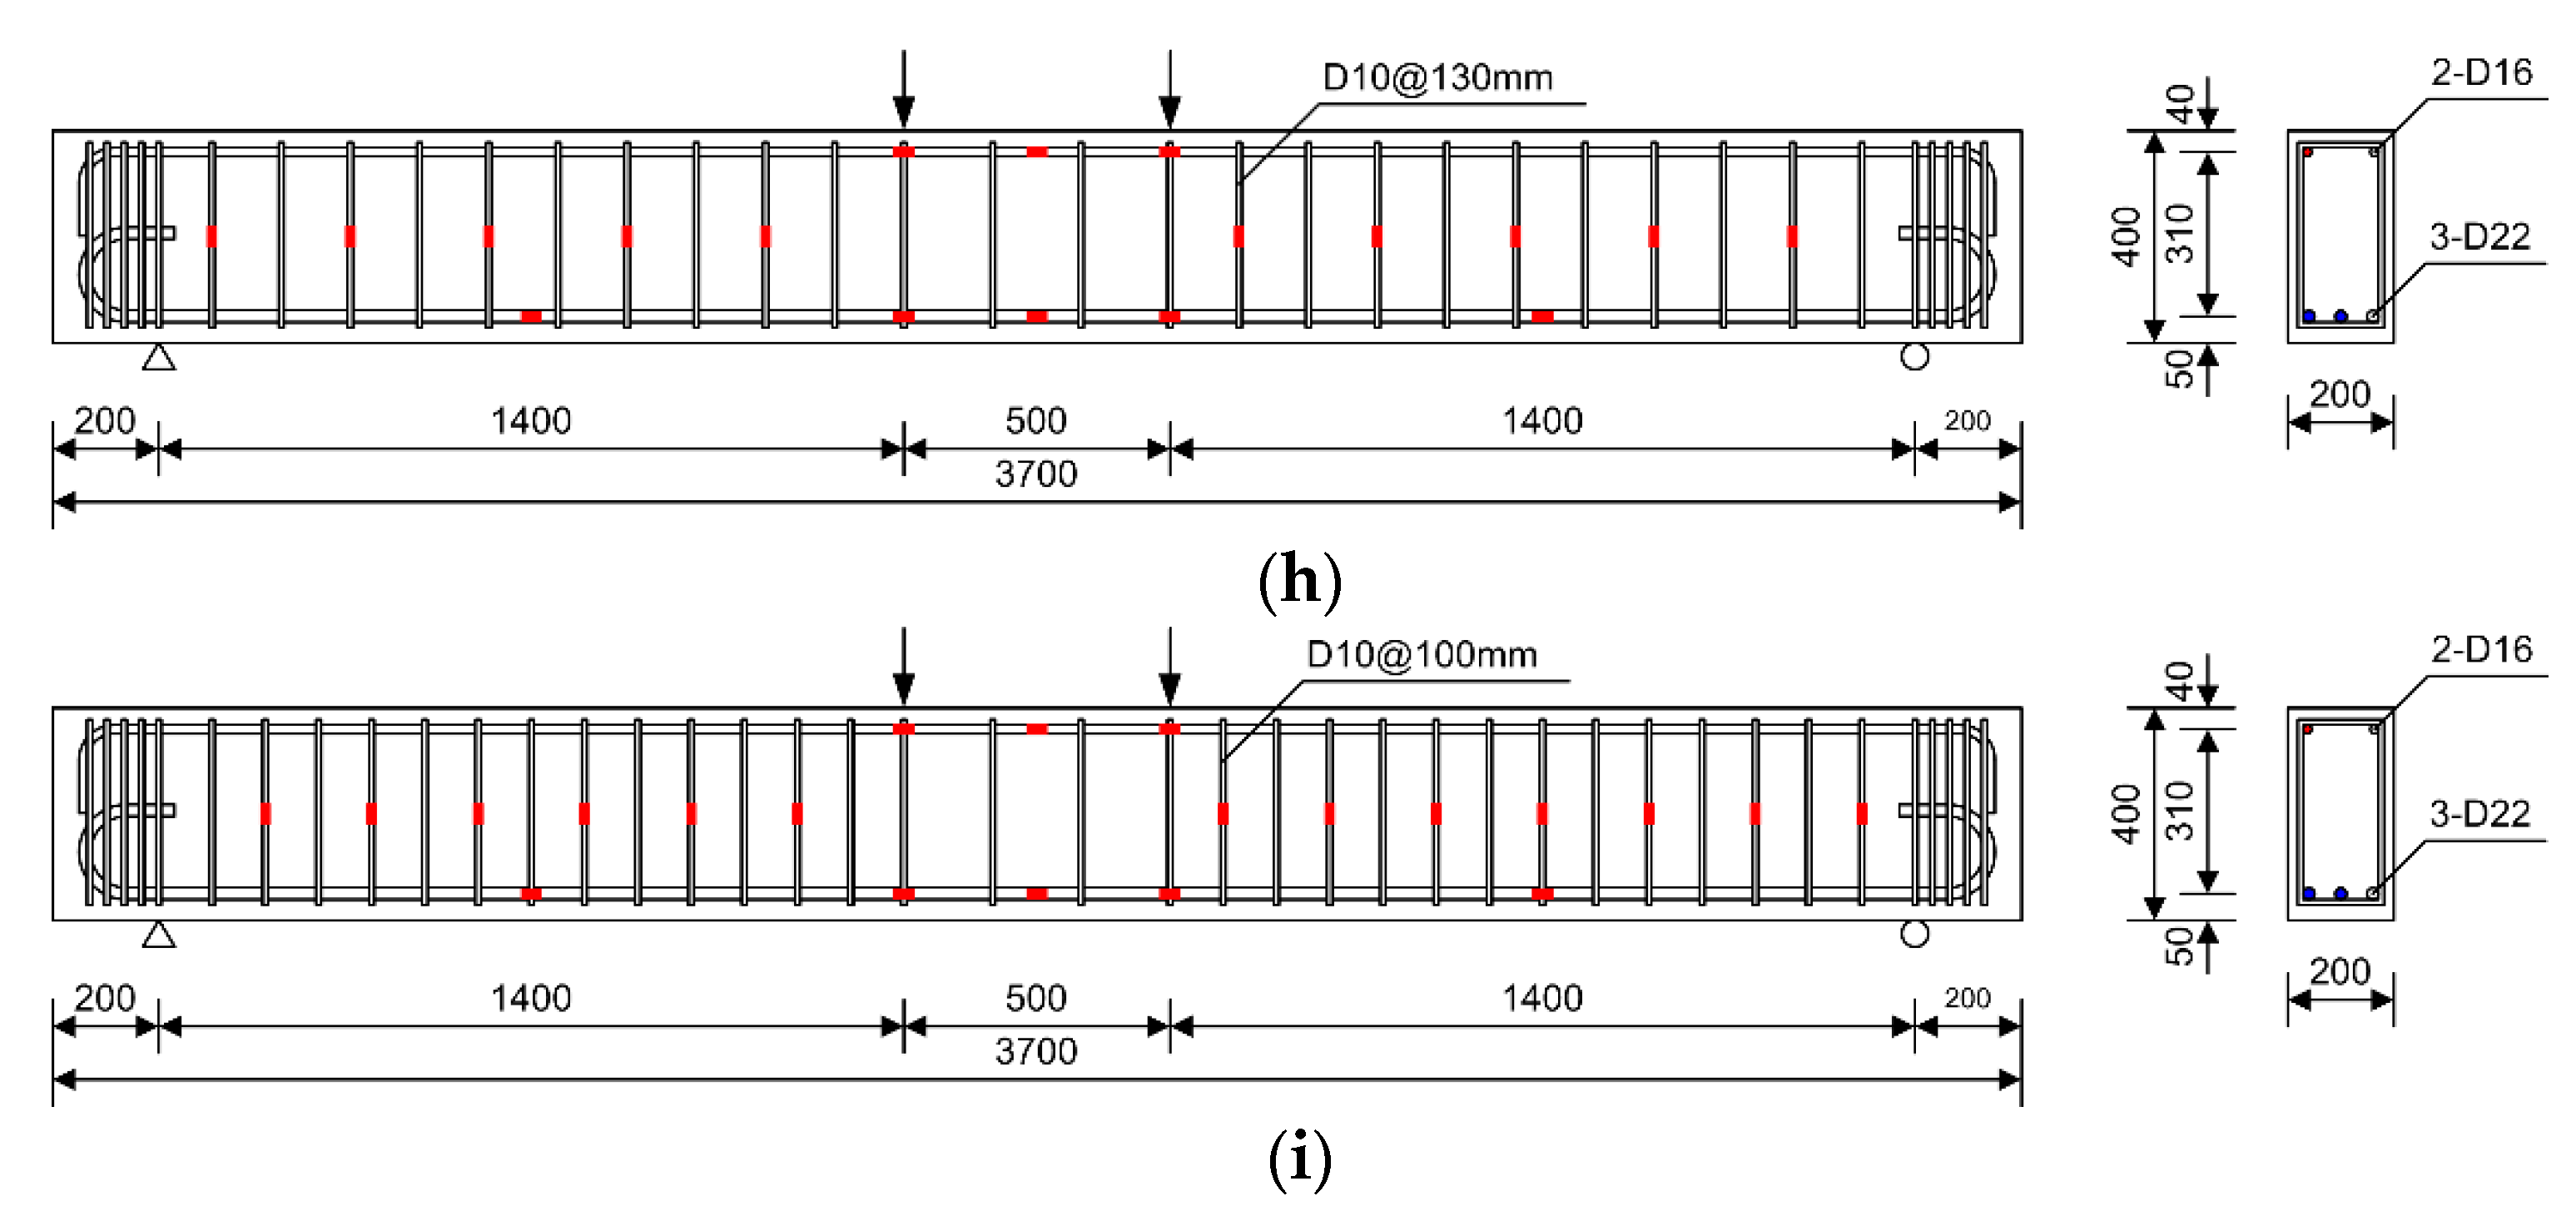
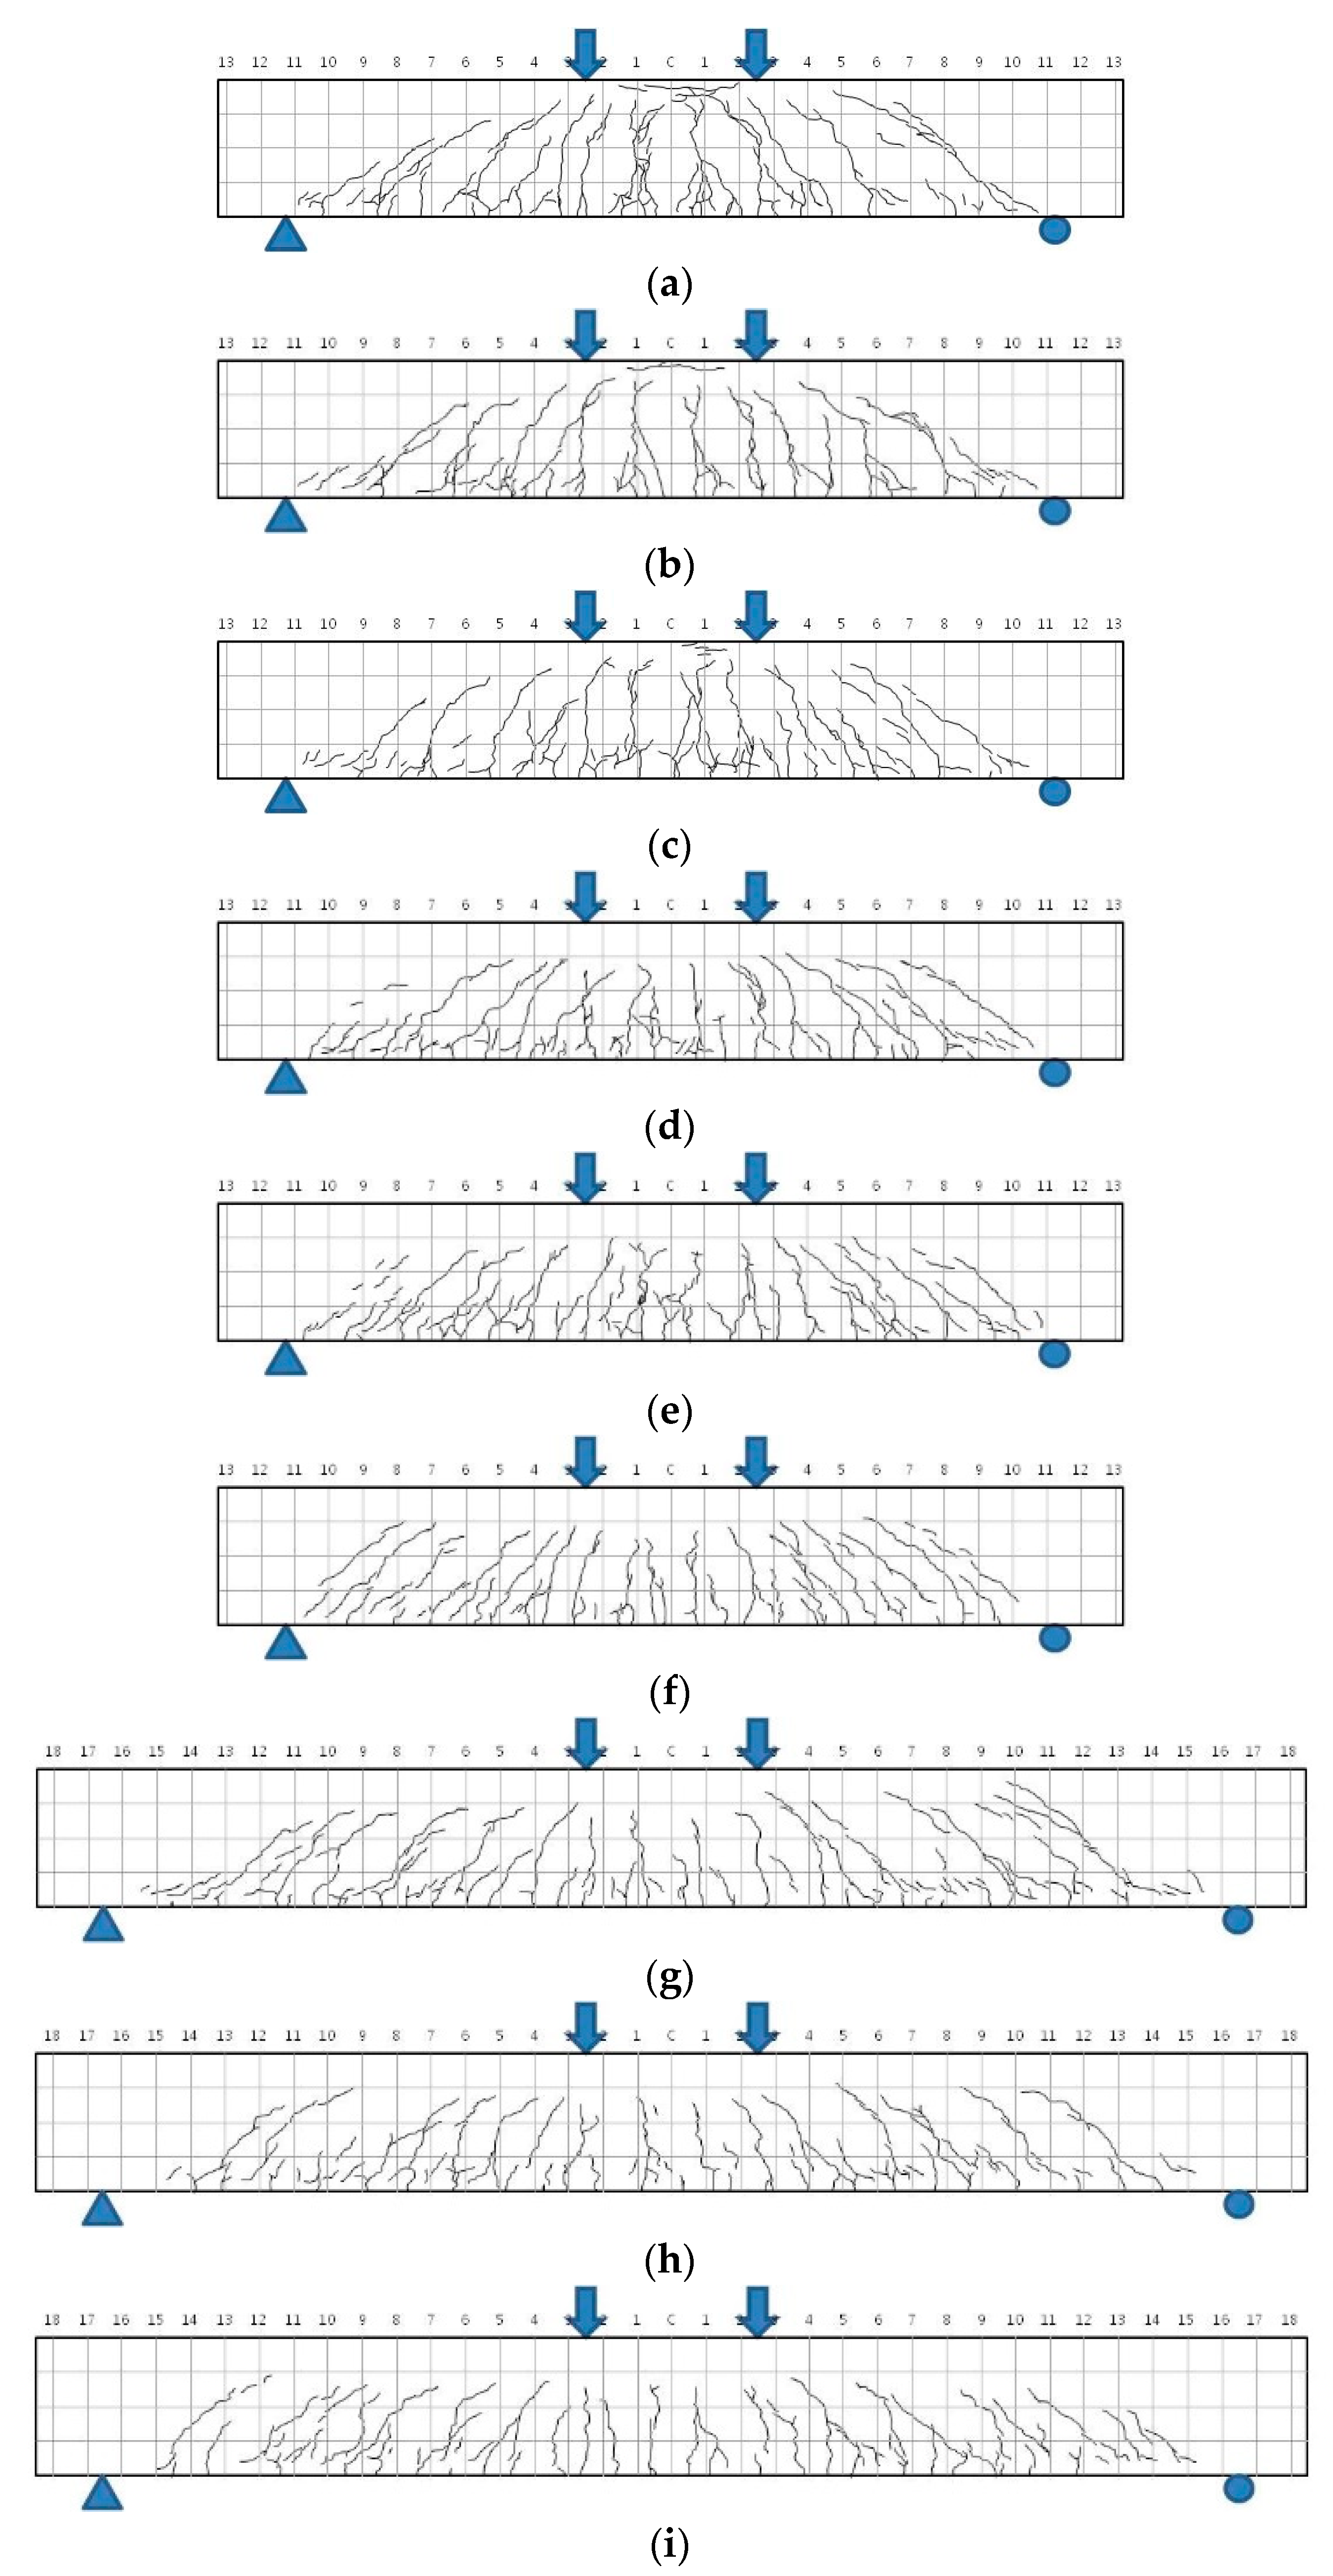
3.2. Crack Patterns
4. Discussions
4.1. Flexural Strength at First Flexural Yield and Ultimate State
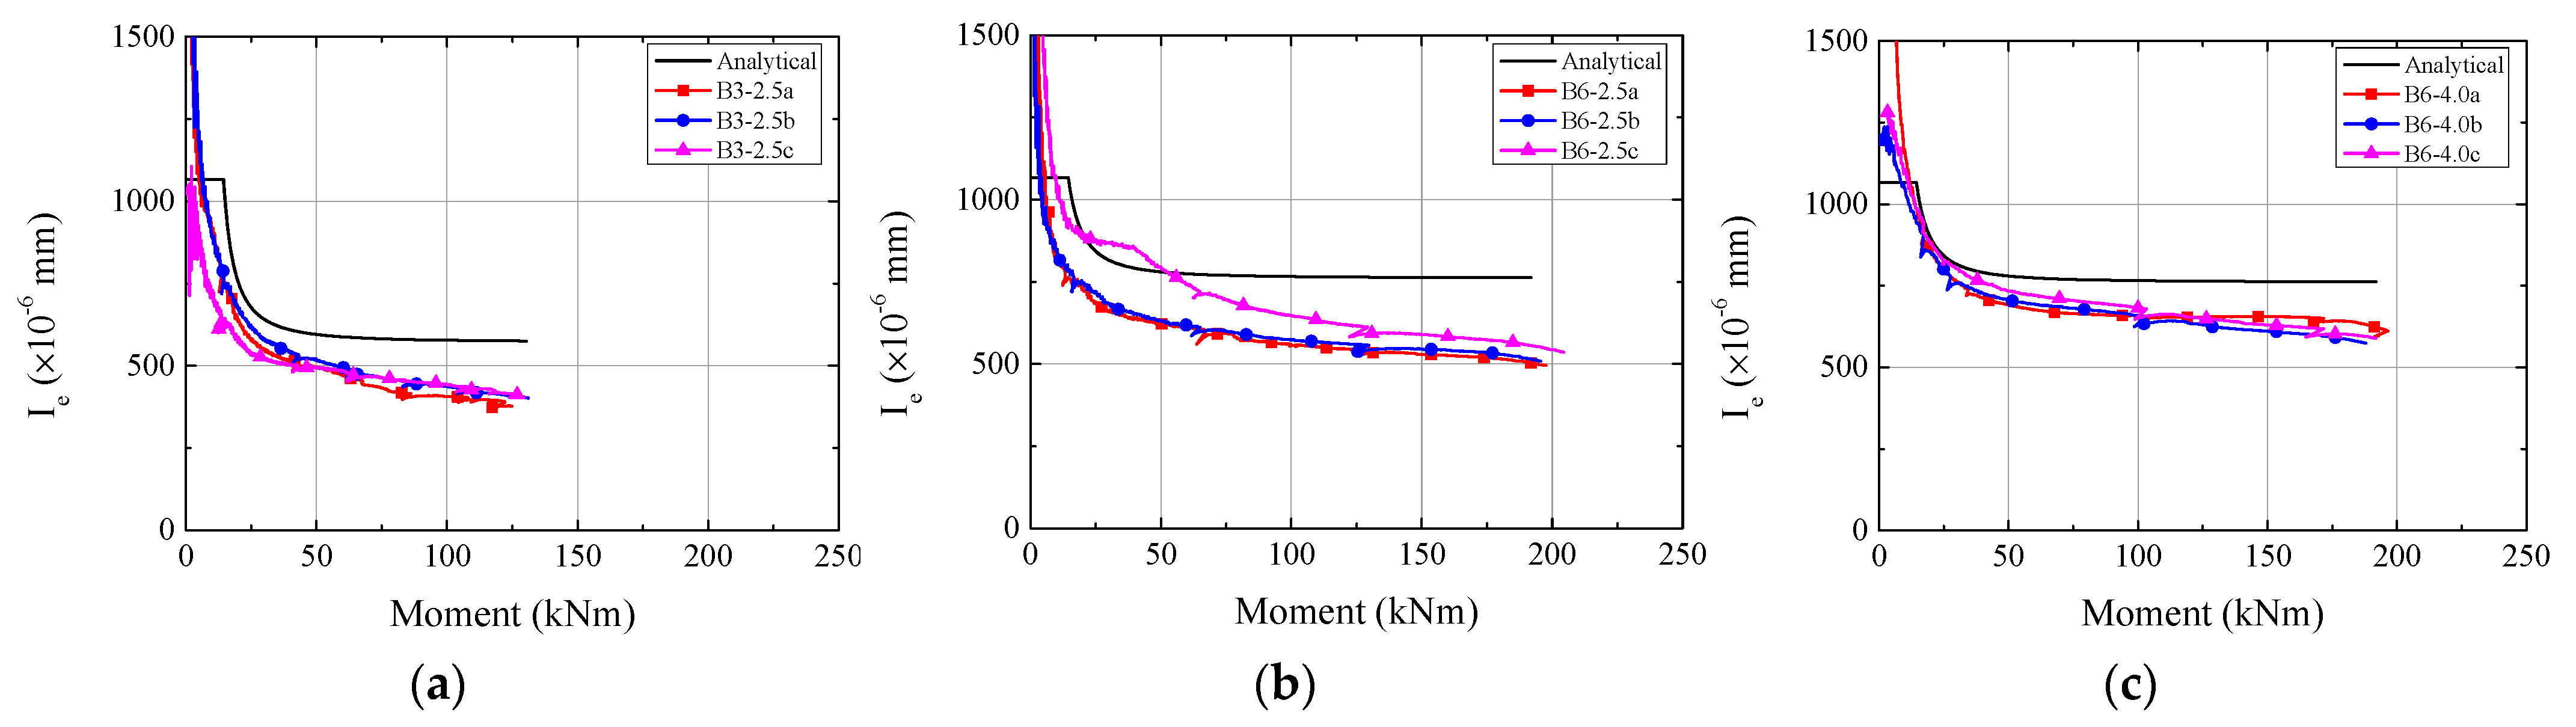
4.2. Effective Moment of Inertia
4.3. Deflection
5. Conclusions
- (1)
- From flexural tests of RC beams with tension reinforcement ratios of 0.3 and 0.6 and shear span-to-depth ratios of 2.5 and 4.0, when the amount of shear reinforcement recommended in the ACI code was satisfied, no additional deflection due to the change in the shear capacity ratio was observed.
- (2)
- When the shear span-to-depth ratio was small or the tension reinforcement ratio was high, it was observed that the number of inclined shear cracks increased and their spacing narrowed because a relatively large shear force was applied to the shear span of the specimens.
- (3)
- From the moment versus effective moment of inertia relationships, it was confirmed that the accuracy of ACI 318-19 formula decreased as the effect of shear increased. In other words, when the shear span-to-depth ratio was low or the tension reinforcement ratio was high, the difference between the analytical results using ACI equation and the experimental results obtained from LVDT combined shear-bending component increased.
- (4)
- The deflection at the yield moment obtained using ACI equation almost coincided with the deflection obtained using the curvature measured in the pure bending region, regardless of the shear span-to-depth ratio and tension reinforcement ratio of the specimens, with an average of 1.0. On the other hand, the ACI equation underestimated the experimental results measured by LVDT combined shear-bending component by a maximum of 1.6 times. This is because the ACI equation does not consider the effect of shear on deflection of RC beams.
Author Contributions
Funding
Institutional Review Board Statement
Informed Consent Statement
Data Availability Statement
Conflicts of Interest
References
- ACI Committee 318. Building Code Requirements for Structural Concrete (ACI 318-19) and Commentary (ACI 318R-19); American Concrete Institute: Farmington Hills, MI, USA, 2019; 623p. [Google Scholar]
- Branson, D.E. Instantaneous and Time-Dependent Deflections on Simple and Continuous Reinforced Concrete Beams; HPR Report No. 7, Part 1; Alabama Highway Department, Bureau of Public Roads: Montgomery, AL, USA, 1965; pp. 1–78. [Google Scholar]
- Mancuso, C.; Bartlett, F.M. ACI 318-14 criteria for computing instantaneous deflections. ACI Struct. J. 2017, 114, 1299–1310. [Google Scholar] [CrossRef]
- Bischoff, P.H. Reevaluation of deflection prediction for concrete beams reinforced with steel and fiber-reinforced polymer bars. J. Struct. Eng. 2005, 131, 752–767. [Google Scholar] [CrossRef]
- Yu, W.-W.; Winter, G. Instantaneous and long-time deflections of reinforced concrete beams under working loads. ACI J. Proc. 1960, 57, 29–50. [Google Scholar]
- Grossman, J.S. Simplified computations for effective moment of inertia Ie and minimum thickness to avoid deflection computations. ACI J. Proc. 1981, 78, 423–434. [Google Scholar]
- Rangan, B.V. Control of beam deflections by allowable span-depth ratios. ACI J. Proc. 1982, 79, 372–377. [Google Scholar]
- Al-Shaikh, A.H.; Al-Zaid, R.Z. Effect of reinforcement ratio on the effective moment of inertia of reinforced concrete beams. ACI Struct. J. 1993, 90, 144–149. [Google Scholar]
- Fikry, A.M.; Thomas, C. Development of a model for the effective moment of inertia of one-way reinforced concrete elements. ACI Struct. J. 1998, 95, 444–455. [Google Scholar]
- Araújo, J.M. Improvement of the ACI method for calculation of deflections of reinforced concrete beams. Theory Pract. Civ. Eng. 2005, 7, 49–60. [Google Scholar]
- Akmaluddin, A.; Thomas, C. Experimental verification of effective moment of inertia used in the calculation of reinforced concrete beam deflection. Int. Civ. Eng. Conf. 2006, 89–98. [Google Scholar]
- Bischoff, P.H.; Scanlon, A. Effective moment of inertia for calculating deflections of concrete members containing steel reinforcement and fiber-reinforced polymer reinforcement. ACI Struct. J. 2007, 104, 68–75. [Google Scholar]
- Scanlon, A.; Bischoff, P.H. Shrinkage restraint and loading history effects on deflections of flexural members. ACI Struct. J. 2008, 105, 498–506. [Google Scholar]
- Issa, M.S.; Mahmoud, M.R.; Torkey, A.M.; Mostafa, M.T. Effective moment of inertia of reinforced medium strength concrete beams. HBRC J. 2009, 5, 47–58. [Google Scholar]
- Kheyroddin, A.; Maleki, F. Prediction of effective moment of inertia for hybrid FRP-steel reinforced concrete beams using the genetic algorithm. Numer. Methods Civ. Eng. 2017, 2, 15–23. [Google Scholar]
- Bertero, R.; Bertero, A. Statistical evaluation of minimum thickness provisions for slab deflection control. ACI Struct. J. 2018, 115, 1659–1670. [Google Scholar] [CrossRef]
- Bischoff, P.H. Service load deflection of tilt-up concrete wall panels. Can. J. Civil Eng. 2018, 45, 684–689. [Google Scholar] [CrossRef]
- Bischoff, P.H. Comparison of existing approaches for computing deflection of reinforced concrete. ACI Struct. J. 2020, 117, 231–240. [Google Scholar] [CrossRef]
- ACI Committee 318. Building Code Requirements for Structural Concrete (ACI 318M-14) and Commentary (ACI 318RM-14); American Concrete Institute: Farmington Hills, MI, USA, 2015; 519p. [Google Scholar]
- Park, R.; Paulay, T. Reinforced Concrete Structures; Wiley: New York, NY, USA, 1975; 769p. [Google Scholar]


| Design Strength (MPa) | W/B (%) | S/a (%) | Unit Weight (Kg/m3) | ||||||
|---|---|---|---|---|---|---|---|---|---|
| W | C | S/P | F/A | S | G | AD | |||
| 24 | 53.6 | 49.2 | 177 | 221 | 50 | 59 | 871 | 899 | 1.98 |
| Specimens | (mm) | Reinforcing Bars | ||||||
|---|---|---|---|---|---|---|---|---|
| Tension | Compression | Shear | ||||||
| (mm) | (%) | |||||||
| B3-2.5a | 0.3 | 875 | 2.5 | 2-D22 ( = 0.0111) | 2-D16 ( = 0.0057) | D10@160 | 0.45 | 1.1 |
| B3-2.5b | D10@115 | 0.62 | 1.4 | |||||
| B3-2.5c | D10@90 | 0.79 | 1.6 | |||||
| B6-2.5a | 0.6 | 875 | 2.5 | 3-D22 ( = 0.0166) | D10@95 | 0.75 | 1.1 | |
| B6-2.5b | D10@70 | 1.02 | 1.4 | |||||
| B6-2.5c | D10@55 | 1.30 | 1.7 | |||||
| B6-4.0a | 1400 | 4.0 | D10@180 | 0.40 | 1.1 | |||
| B6-4.0b | D10@130 | 0.55 | 1.4 | |||||
| B6-4.0c | D10@100 | 0.71 | 1.7 | |||||
| Specimens | At First Crack | At First Flexural Yield | At Peak Load | |||||||
|---|---|---|---|---|---|---|---|---|---|---|
(kN) | (mm) | (kN) | (mm) | (mm) | (kN) | (mm) | ||||
| B3-2.5a | 31.2 | 0.51 | 285.3 | 9.9 | 6.1 | 1.62 | 1.44 | 0.89 | 356.6 | 52.0 |
| B3-2.5b | 33.3 | 0.57 | 299.7 | 9.8 | 6.9 | 1.42 | 1.43 | 1.01 | 350.7 | 44.7 |
| B3-2.5c | 31.2 | 0.62 | 296.1 | 9.5 | 6.6 | 1.44 | 1.38 | 0.96 | 344.4 | 30.5 |
| B6-2.5a | 30.4 | 0.52 | 451.6 | 11.9 | 7.6 | 1.57 | 1.56 | 1.00 | 507.7 | 22.1 |
| B6-2.5b | 37.9 | 0.65 | 446.8 | 11.5 | 7.7 | 1.49 | 1.51 | 1.01 | 489.8 | 21.9 |
| B6-2.5c | 37.4 | 0.54 | 467.0 | 11.4 | 8.0 | 1.43 | 1.49 | 1.05 | 520.2 | 19.0 |
| B6-4.0a | 25.0 | 1.17 | 275.1 | 19.8 | 14.7 | 1.35 | 1.27 | 0.94 | 301.3 | 30.4 |
| B6-4.0b | 24.8 | 1.18 | 268.7 | 20.1 | 16.1 | 1.25 | 1.29 | 1.03 | 299.1 | 29.4 |
| B6-4.0c | 24.9 | 1.13 | 274.1 | 19.9 | 14.9 | 1.34 | 1.27 | 0.95 | 308.9 | 34.9 |
| Mean | 1.43 | 1.40 | 0.98 | - | - | |||||
| COV (%) | 8.13 | 7.75 | 5.08 | - | - | |||||
| Specimens | Experimental | Experimental/Analytical | ||
|---|---|---|---|---|
(kNm) | (kNm) | |||
| B3-2.5a | 124.8 | 156.0 | 0.94 | 1.18 |
| B3-2.5b | 131.1 | 153.4 | 0.99 | 1.16 |
| B3-2.5c | 129.5 | 150.7 | 0.97 | 1.14 |
| B6-2.5a | 197.6 | 222.1 | 1.01 | 1.17 |
| B6-2.5b | 195.5 | 214.3 | 1.00 | 1.13 |
| B6-2.5c | 204.3 | 227.6 | 1.05 | 1.20 |
| B6-4.0a | 192.6 | 210.9 | 0.99 | 1.11 |
| B6-4.0b | 188.1 | 209.4 | 0.96 | 1.10 |
| B6-4.0c | 191.9 | 216.2 | 0.98 | 1.14 |
| Mean | 0.99 | 1.15 | ||
| COV (%) | 3.06 | 2.78 | ||
Publisher’s Note: MDPI stays neutral with regard to jurisdictional claims in published maps and institutional affiliations. |
© 2021 by the authors. Licensee MDPI, Basel, Switzerland. This article is an open access article distributed under the terms and conditions of the Creative Commons Attribution (CC BY) license (https://creativecommons.org/licenses/by/4.0/).
Share and Cite
Kim, S.-W.; Han, D.-S.; Kim, K.-H. Evaluation of Shear Effect on Deflection of RC Beams. Appl. Sci. 2021, 11, 7690. https://doi.org/10.3390/app11167690
Kim S-W, Han D-S, Kim K-H. Evaluation of Shear Effect on Deflection of RC Beams. Applied Sciences. 2021; 11(16):7690. https://doi.org/10.3390/app11167690
Chicago/Turabian StyleKim, Sang-Woo, Dong-Seok Han, and Kil-Hee Kim. 2021. "Evaluation of Shear Effect on Deflection of RC Beams" Applied Sciences 11, no. 16: 7690. https://doi.org/10.3390/app11167690
APA StyleKim, S.-W., Han, D.-S., & Kim, K.-H. (2021). Evaluation of Shear Effect on Deflection of RC Beams. Applied Sciences, 11(16), 7690. https://doi.org/10.3390/app11167690