Article

Research on Temperature Compensation Method in Crankshaft Online Measurement System

1
College of Mechanical and Electrical Engineering, Nanjing University of Aeronautics and Astronautics, 29 Yudao Street, Qinhuai District, Nanjing 210016, China
2
Jincheng College, Nanjing University of Aeronautics and Astronautics, 88 Hangjin Avenue, Jiangning District, Nanjing 211156, China
*
Authors to whom correspondence should be addressed.
Appl. Sci. 2021, 11(16), 7558; https://doi.org/10.3390/app11167558
Submission received: 30 June 2021 / Revised: 11 August 2021 / Accepted: 14 August 2021 / Published: 18 August 2021
(This article belongs to the Special Issue Smart Manufacturing Technology)

Abstract

:

Featured Application

The LVDT sensor is used in a follow-up journal synchronous measurement structure, can reduce the influence of errors caused by the random circle runout and the probe movement, and can ensure the measurement efficiency. The influence of temperature on the measuring machine, calibration parts, measured crankshaft and sensor is all taken into consideration, and the measurement accuracy of the system is improved.

Abstract

The crankshaft online measurement system has realized the full inspection function with fast beats, at the same time it requires for high-precision measurement. Considering the effect of ambient temperature and temperature changes on measuring machine, the calibration part, the measured crankshaft and displacement sensor, a temperature compensation method is proposed. Firstly, relationship between calibration part and ambient temperature can be get through the zero calibration. Then use the material properties to obtain compensation values of the calibration part and the measured crankshaft part at different temperatures. Finally, the compensation parameters for displacement sensor can be obtained through the BP algorithm. The improved dragonfly algorithm (DA) is used to optimize the parameters of BP neural network algorithm. Experiments verify the effectiveness of IDA-BP for LVDT in temperature compensation. After temperature compensation, the error range of main journal radius is reduced from 0.0156 mm to 0.0028 mm, the residual error decreased from −0.0282 mm~+0.0018 mm to −0.0058 mm~−0.0008 mm. The influence of temperature changes on the measurement is reduced and measurement accuracy is improved through the temperature compensation method. The effectiveness of the method is proved.

1. Introduction

Measurement is the important link in the manufacturing process. The automobile manufacturing industry produces tens of thousands of shaft parts every year, so the measurement task is heavy. The shaft parts can only be sampled in the measurement room, and the offline measurement efficiency is low. To ensure the quality of parts, a full inspection must be achieved. Online measurement is an effective solution to achieve full inspection of parts [1,2,3]. While ensuring the measurement speed, it also guarantees the measurement accuracy.
High-precision and high-quality demand are increasing in industry, so that accurate measurements are required. During the measurement of the crankshaft, the temperature changes will cause the crankshaft to expand and contract, will also affect the measuring precision of the sensor, so that a great error is brought to the measurement results. Therefore, it is necessary to perform error analysis and optimization on the sensor and the crankshaft measuring machine, to achieve the temperature compensation of measurement.
At present, a temperature compensation method is introduced into Italian MARPOSS crankshaft final inspection machine (online measuring machine). Dall Aglio [4] analyzes temperature compensation of a MARPOSS crankshaft terminal inspection machine by a security source, the standard temperature in the qualification judgment criterion of the crankshaft journal is not introduced into the temperature error compensation method, the size of a workpiece at the standard temperature cannot be directly obtained, and size conversion is still needed after compensation. When the temperature compensation coefficient is obtained, the temperature curve is approximately corrected to be a straight line, the crankshaft journal is a cylinder, the thermal expansion coefficient of the diameter parameter of the crankshaft journal is not linear, and the correction method is easy to introduce errors. And the variation range of the temperature of the workpiece and the environment is limited, and the error compensation under various temperature conditions can not be realized. Marcotuli [5] developes a compensation algorithm, taking fluctuation of the ambient temperature into measurement system. The errors caused by the temperature of workbench and workpiece to the measurement results are respectively analyzed. But temperature drift nature of displacement sensor is ignored. Zhu [6] put forward a concept of temperature compensation factor to compensate measurement error caused by the difference between calibration temperature and environment temperature. However, this compensation method is applied in rail gauge measurement, does not consider the influence of temperature on other factors.
Regarding the influence of temperature on the sensor, different studies have carried out to enhance the capabilities of displacement sensor to obtain more accurate measurement results [7,8,9]. For the temperature compensation of the displacement sensor, there are circuit hardware compensation and software algorithm compensation. Artificial neural network (ANN) is widely used because of its self-learning function [10]. Ma [11] proposed a modified BP neural network and a new method of grouping temperature variables based on fuzzy cluster theory. Many researchers combine genetic algorithms, particle swarm algorithms, and difference algorithms to optimize BP to speed up convergence and improve robustness [12,13,14].
Dragonfly Algorithm (DA) is proposed by Mirjalili [15] in 2016.The results of DA compared with PSO and GA has been verified by Mirjalili. High exploitation assists the DA algorithm to rapidly converge towards the global optimum and exploit it accurately. Mais Yasen [16] propose the use of DA as an optimization algorithm for the weights of each connection between the ANN neurons in a model called ANN-DA, which compared with ANN-ABC, proved its high efficiency and robustness. But in this method, initialization uses empirical values and random values, which have a negative impact on the later search for the optimal value and iteration.
However, software algorithm only reduces the influence of temperature on the sensor to a certain extent, and changes of the crankshaft geometric parameters and influences of measuring machine caused by temperature changes are not considered.
This paper focuses on the temperature compensation technology for crankshaft online measurement system. In Section 1, the application background is introduced and the effect of temperature on sensors and crankshaft measurement machine is proposed. In Section 2, the overall temperature compensation framework and method to improve the measurement accuracy are put forward. In Section 3, an improved dragonfly algorithm is proposed and used to optimize the parameters. Section 4 is experimental content, showing the experimental data and experimental results. Section 5 is the conclusion.

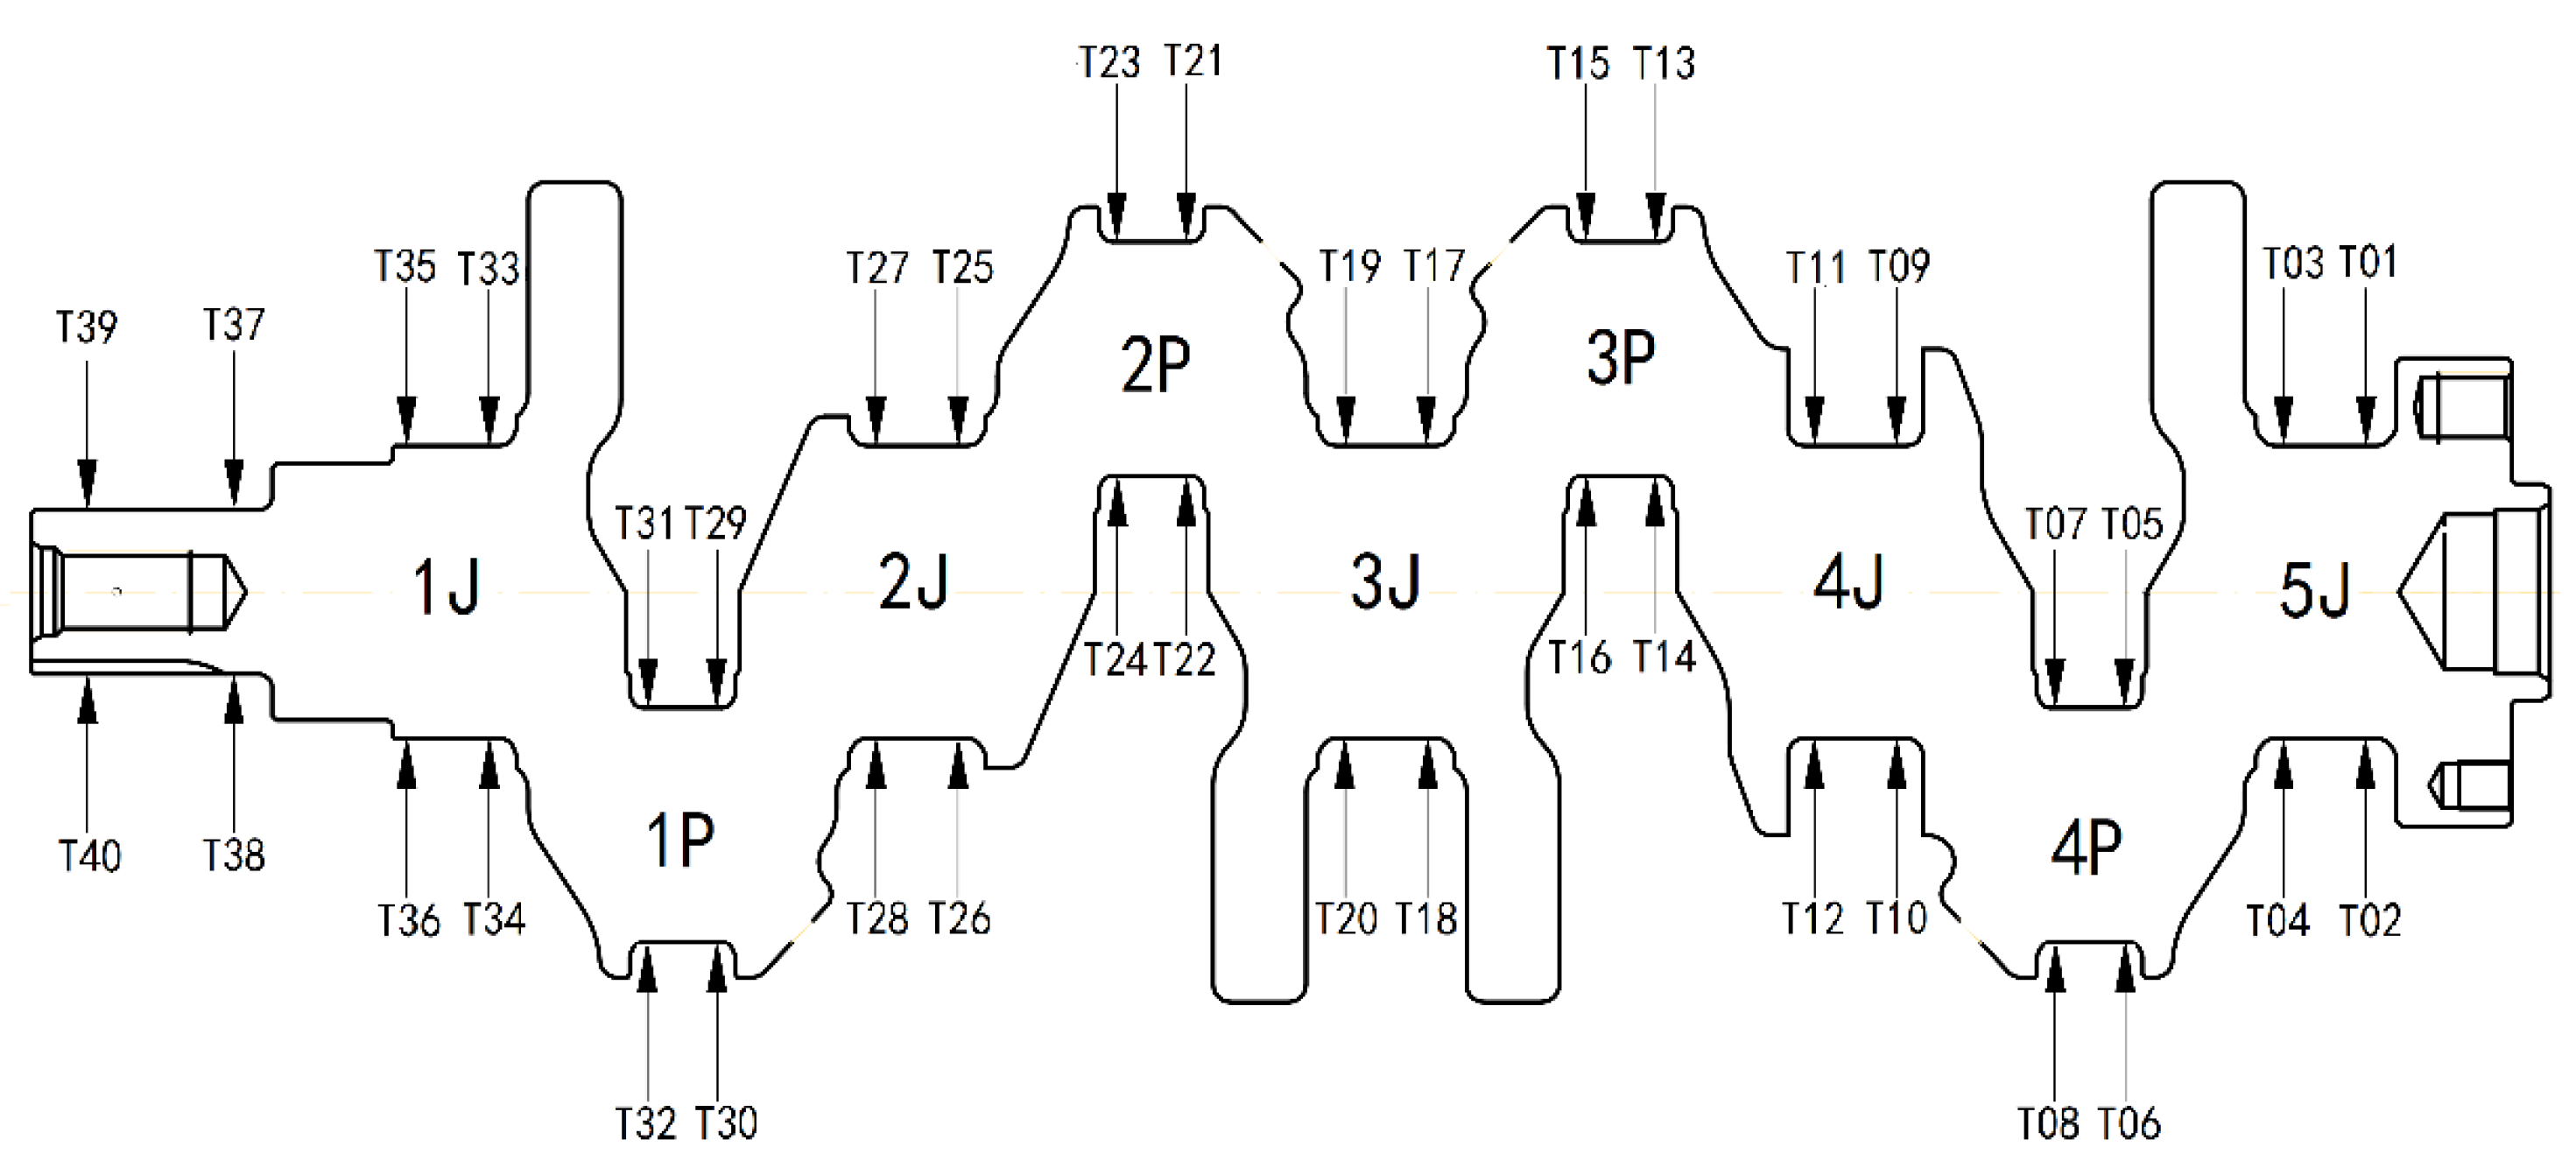
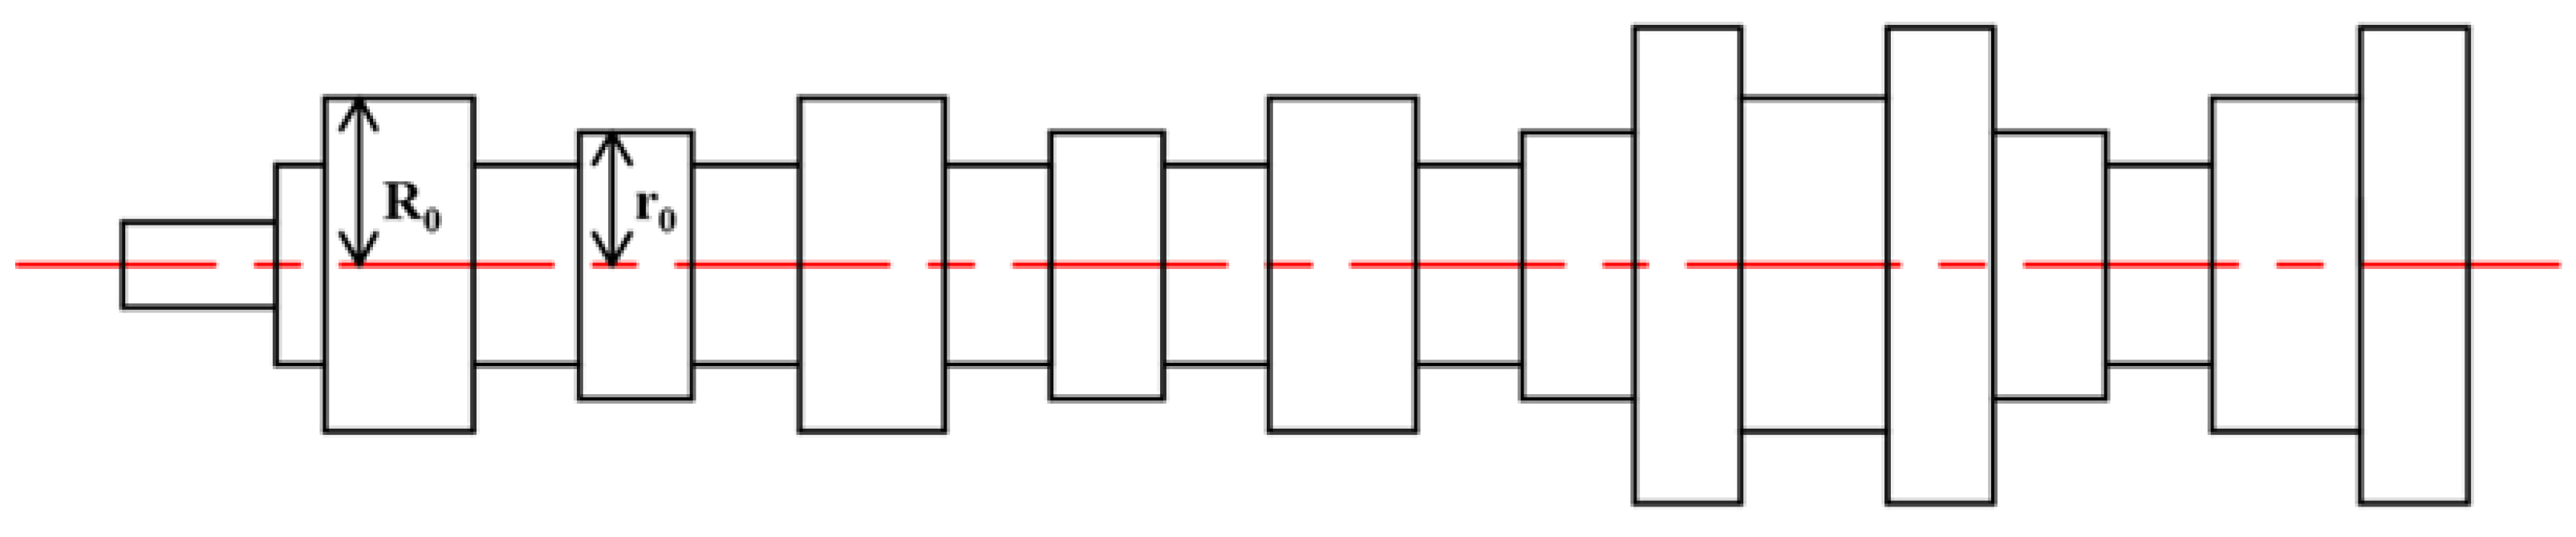
2. Temperature Compensation Method for Crankshaft Online Measurement

2.1. Overall Framework

For the high-precision measurement of crankshaft parts, the influence of environmental temperature changes on the measurement results increases the difficulty of measurement accuracy control. The temperature change includes the temperature change of the equipment, the tested part and the calibration part during the whole measurement process. How to compensate for the error caused by the environmental temperature change is a problem that needs to be solved urgently in production practice. The crankshaft online measuring machine integrated after the production process receives the crankshaft parts that have just been processed and cleaned at high temperature. The temperature is much higher than the ambient temperature. And the time to cool to room temperature generally takes more than 60 min. The high efficiency requirements of online crankshaft measurement make it impossible for the crankshaft to cool down sufficiently before the measurement. So the temperature of the measuring equipment and the temperature of the crankshaft are often inconsistent [17]. When the temperature of the crankshaft is high, its journal radially expands linearly, so the temperature difference will have an error effect on the measured value [18], which is a non-negligible error value in high-precision measurement.
The temperature compensation in the crankshaft online measurement process should be considered from the perspective of the entire measurement system. It is not enough to compensate the error caused by the LVDT sensor. Therefore, the integrated temperature compensation method is designed in this paper, and the temperature compensation block diagram is shown in Figure 1.

2.2. Temperature Compesaiton Method

Crankshafts are measured in workshop where temperature changes will not only affect the measurement accuracy of the displacement sensor itself but also cause the thermal expansion and contraction of the workpiece, and will bring great errors to measurement results. The comparison method is used for shafts parts in measurement. The radial value of main journal to be measured is calculated by using the radius value of calibration part and the displacement difference of LVDT probe. The indication value of calibration part is measured in a normal temperature environment. In the workshop environment, the sensor will be affected by temperature, which will cause measurement errors. At the same time, the measurement data of crankshaft and the calibration part will also be influnced by temperature because of the temperature characteristics of their material. The flow chart of the temperature compensation for the crankshaft measurement system is shown in Figure 2.
As shown in Figure 3, multiple LVDT sensors are arranged to measure the main journal of the crankshaft. The specific implementation steps of temperature compensation during measurement are as follows:
  • Measurement of main journal under ideal conditions
Before measurement, the calibration part needs to be calibrated to obtain the displacement zero point. The structure of the calibration part is shown in Figure 4, where the LVDT probe is directly facing the center of the main journal, and R0 is the main journal calibration radius.
Take calibration of the main journal as an example, set the original distance between LVDT probe and the center of journal in undetected state as C, set the displacement of LVDT probe when calibrating the main journal is d0, then there is
R 0 = d 0 + C
When measuring shaft part, suppose the actual displacement of LVDT probe is d, then the actual radial distance of the journal at this moment is
R = d + C
Reorganize Formulas (1) and (2), we get
R = d + R 0
2.
The deviation value of LVDT probe X supposed in Section 3
3.
Temperature compensation of calibration part and test part
The changes in radial quantity of calibration part and measured crankshaft have a linear relationship with the temperature. The measurement compensation is performed under three different temperature environments: the calibration laboratory temperature, the ambient temperature when the equipment is calibrated and the actual measurement temperature. The correction coefficient is obtained, which effectively reduces the influence of temperature changes on the test results. Three temperatures are involved in the online temperature compensation of the crankshaft main journal. Suppose the temperature of the calibration laboratory is 20 °C [19], the ambient temperature when the equipment is calibrated is T, the temperature of the crankshaft is T1, the thermal expansion coefficient of the crankshaft is α1, and the thermal expansion coefficient of the calibration part is α2. During the measurement process, it is necessary to recalibrate the zero position of the probe at regular intervals. At this time, the calibration part is at a non-calibration temperature (20 °C), and radial expansion or contraction occurs. So the compensation value is:
C = ( T 20 ) × α 2 × L
where T is ambient temperature, α2 is the thermal expansion coefficient of the calibration part, L represents original length.
The main journal of crankshaft is still at a non-standard temperature during the measurement. The value to be compensated for the journal diameter at the current temperature and the journal diameter at 20 °C is as follows:
S = ( T 1 20 ) × α 1 × L
where T1 is temperature of crankshaft, α1 is the thermal expansion coefficient of the crankshaft, L represents original length.
According to the metal properties of crankshaft material, expansion occurs at high temperatures. So the compensation value needs to be subtracted from the measurement result. During zero calibration, the initial displacement of probe will increase when the calibration part expands, which is equivalent to adding less ΔC compensation value when measuring the crankshaft. Therefore, the overall temperature compensation amount is:
= C S = ( ( T 20 ) × α 2 ( T 1 20 ) × α 1 ) × L
4.
Overall temperature compensation for crankshaft measurement
In summary, considering the influence of temperature on sensor and shaft part, when measuring the crankshaft main journal on a production line, there are
R 0 + = C + d 0 X
where R0 is the radius of calibration part, Δ is the overall temperature compensation amount, C is the original distance between probe and the journal center in detection state, d0 is the displacement of probe when crankshaft is calibrated, and ΔX is the actual deviation of LVDT probe.
Substituting Formula (7) into Formula (2), we can get
R = + X + d d 0 + R 0 = + X + d + R 0
In the above expression, the calculated R is the true radius of main journal to achieve the purpose of accurate measurement.

3. Compensation Method for LVDT Based on IDA-BP Neural Network

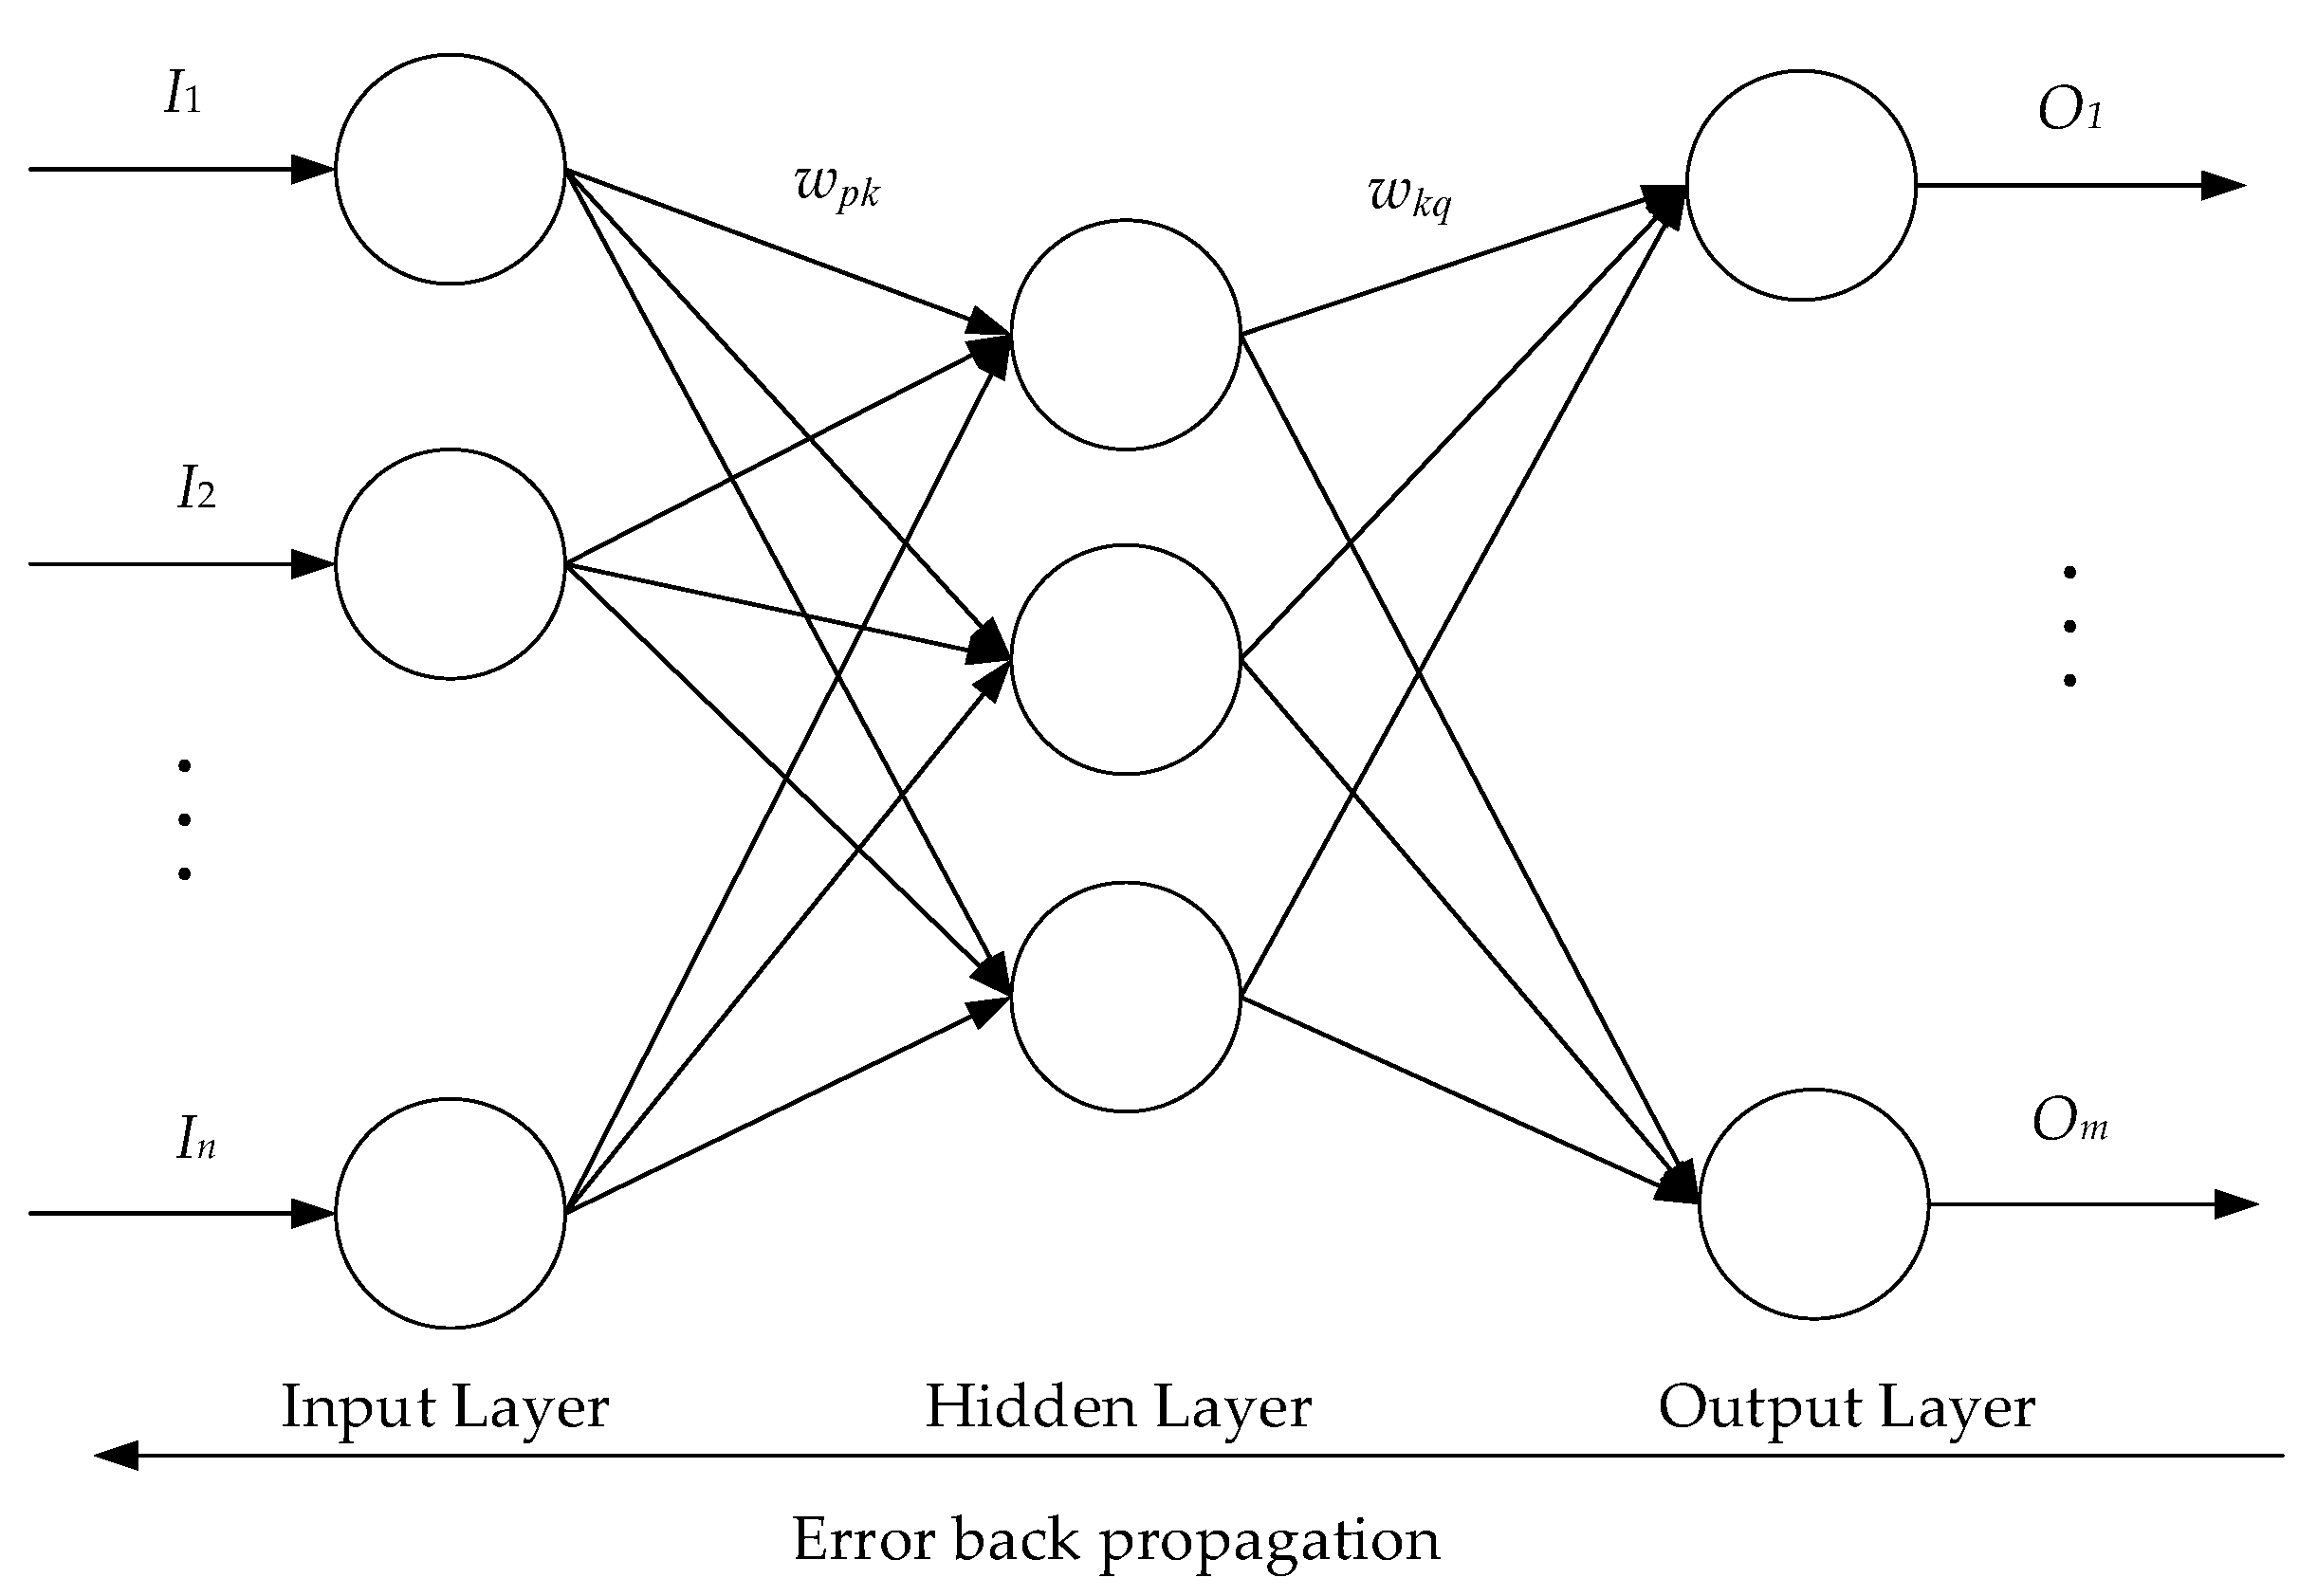
3.1. BP Neural Network

BP neural network has the characteristics of strong nonlinear mapping ability, self-adaptation and self-learning ability, strong fault tolerance, etc. It is one of the most widely used in temperature compensation.
The basic structure of the BP neural network is the input layer, hidden layer, and output layer. Input layer accepts the training data set; hidden layer maps the input data to the output layer through connection weights and activation functions; output layer linear-combine the outputs of hidden layer to computes the predicted result. Figure 5 is a representation diagram of BP neural network structure. In Figure 5, I1, I2,…, In are the input values of the BP neural network, wpk and wkq are the weight relationships of the BP neural network, and O1, O2,…, Om are the expected output values of the BP neural network.
The BP neural network designed in the article has an input layer with three nodes, a hidden layer with 7 nodes, and an output layer with one node. The input neurons of the input layer are displacement measured by the displacement sensor, the temperature measured by the temperature sensor and the output voltage of the temperature sensor. The output voltage of the displacement sensor is used as the output neuron.

3.2. Dragonfly Algorithm

3.2.1. Fundamental Theory of Dragonfly Algorithm

DA is a new type of swarm intelligence optimization algorithm proposed by Mirjalili in 2015 [15]. Then Meraihi [20] made a detailed summary of the dragonfly algorithm, including improved methods and applicable occasions. Five basic principles are utilized to model the swarm behaviors of dragonflies. In the following equations, P shows the position of the current individual, Pj represents the position j-th neighboring individual, and N is the number of neighboring individuals.
1.
Separation represents the static collision avoidance that individuals follow to avoid collision with other individuals in the neighborhood; its mathematical model is as follows:
S i = j = 1 N P P j  
2.
Alignment means the individual’s velocity matching between other neighboring individuals in the same group. The alignment is expressed as follows:
A i = j = 1 N V j N
where Vj shows the velocity of the j-th neighboring individual.
3.
Cohesion indicates the tendency of individuals toward the center of the swarms’ group. It is defined as follows:
C i = j = 1 N P j N P
4.
Attraction towards food source is calculated by:
F i = P + P
where Fi represents the food source of the i-th individual and P+ shows the position of the food source.
5.
Distraction outwards the enemies is modeled mathematically by:
E i = P + P
where Ei denotes the position of the enemy of the i-th individual and P shows the position of the enemy.
Positions of dragonflies inside the search space are updated considering the step vector ΔP and the position vector P. It is defined and updated as follows:
Δ P i t + 1 = ( s S i + a A i + c C i + f F i + e E i ) + ω Δ P i t
where s shows the separation weight, Si indicates the separation of the i-th individual, a represents the alignment weight, Ai denotes the alignment of the i-th individual, c is the cohesion weight, Ci is the cohesion of the i-th individual, f is the food factor, Fi is the food source of the i-th individual, e represents the enemy factor, Ei is the enemy position of the i-th individual, ω is the inertia weight, and t is the iteration number. Then, the position of the i-th dragonfly at t + 1 is calculated as follows:
P i t + 1 = P i t + Δ P i t + 1
Exploration is ensured by using high alignment and low cohesion weights; however, exploitation is guaranteed by using low alignment and high cohesion weights [21]. The convergence rate of DA can be controlled by adaptively adjusting the weights s, a, c, f, e, and ω. To enhance the exploration, randomness, and exploitation of the artificial dragonflies, random walk (Levy flight) is introduced when there are no neighboring solutions. Therefore, the position of the i-th dragonfly at iteration t + 1 is updated as follows:
P i t + 1 = P i t + Levy ( d ) × P i t
where d is the dimension of the position vectors. Levy flight is calculated by [22]:
Levy ( d ) = 0.01 × r 1 × σ | r 2 | 1 β
where r1, r2 are two random vectors uniformly distributed in [0,1], β is a constant, and σ is calculated as follows:
σ = ( Γ ( 1 + β ) × sin ( Π β 2 ) Γ × 2 ( β 1 2 ) × β × ( 1 + β 2 ) ) 1 β

3.2.2. Elite Strategy

For improving the structure of the algorithm and optimizing the initial population, and strengthening the optimal precision and convergence speed of this algorithm, this paper proposed an improved dragonfly algorithm.
The dragonfly population is initialized as X = (X1, X2,…,Xr). Where X is composed of r l-dimensional column vectors, and each column vector is the value of each dragonfly in different dimensions.
The first n dragonflies closest to the food (minimize the objective function) were selected to form the first generation of elite dragonflies. FX = (FX1, FX2, …, FXn).
From the first-generation elite dragonfly group and Formula (11), the boundaries of each dimension L, U.
{ L = ( L 1 , L 2 , · · · , L l ) L a = m i n ( F X i l ) U = ( U 1 , U 2 , · · · , U l ) U a = m a x ( F X i l ) a ( 1 , l ) i ( 1 , r )
According to Formula (20), the second-generation elite dragonfly group can be obtained: SX = (SX1, SX2, …, SXr).
S X i = rand · ( L + U ) X i , i ( 1 , , r )
The augmented matrix NX is obtained by Formula (21).
N X = ( S X X )
Select the best first r dragonflies in the NX group to form the third-generation elite dragonfly group as TX = (TX1, TX2, …, TXr).
Following the survival of the fittest, after the dragonfly population is optimized by the elite strategy, high-quality dragonflies are retained, and inferior dragonflies are eliminated, to maintain the goodness of the entire dragonfly population. Compared with the original algorithm, it can increase fast convergence.

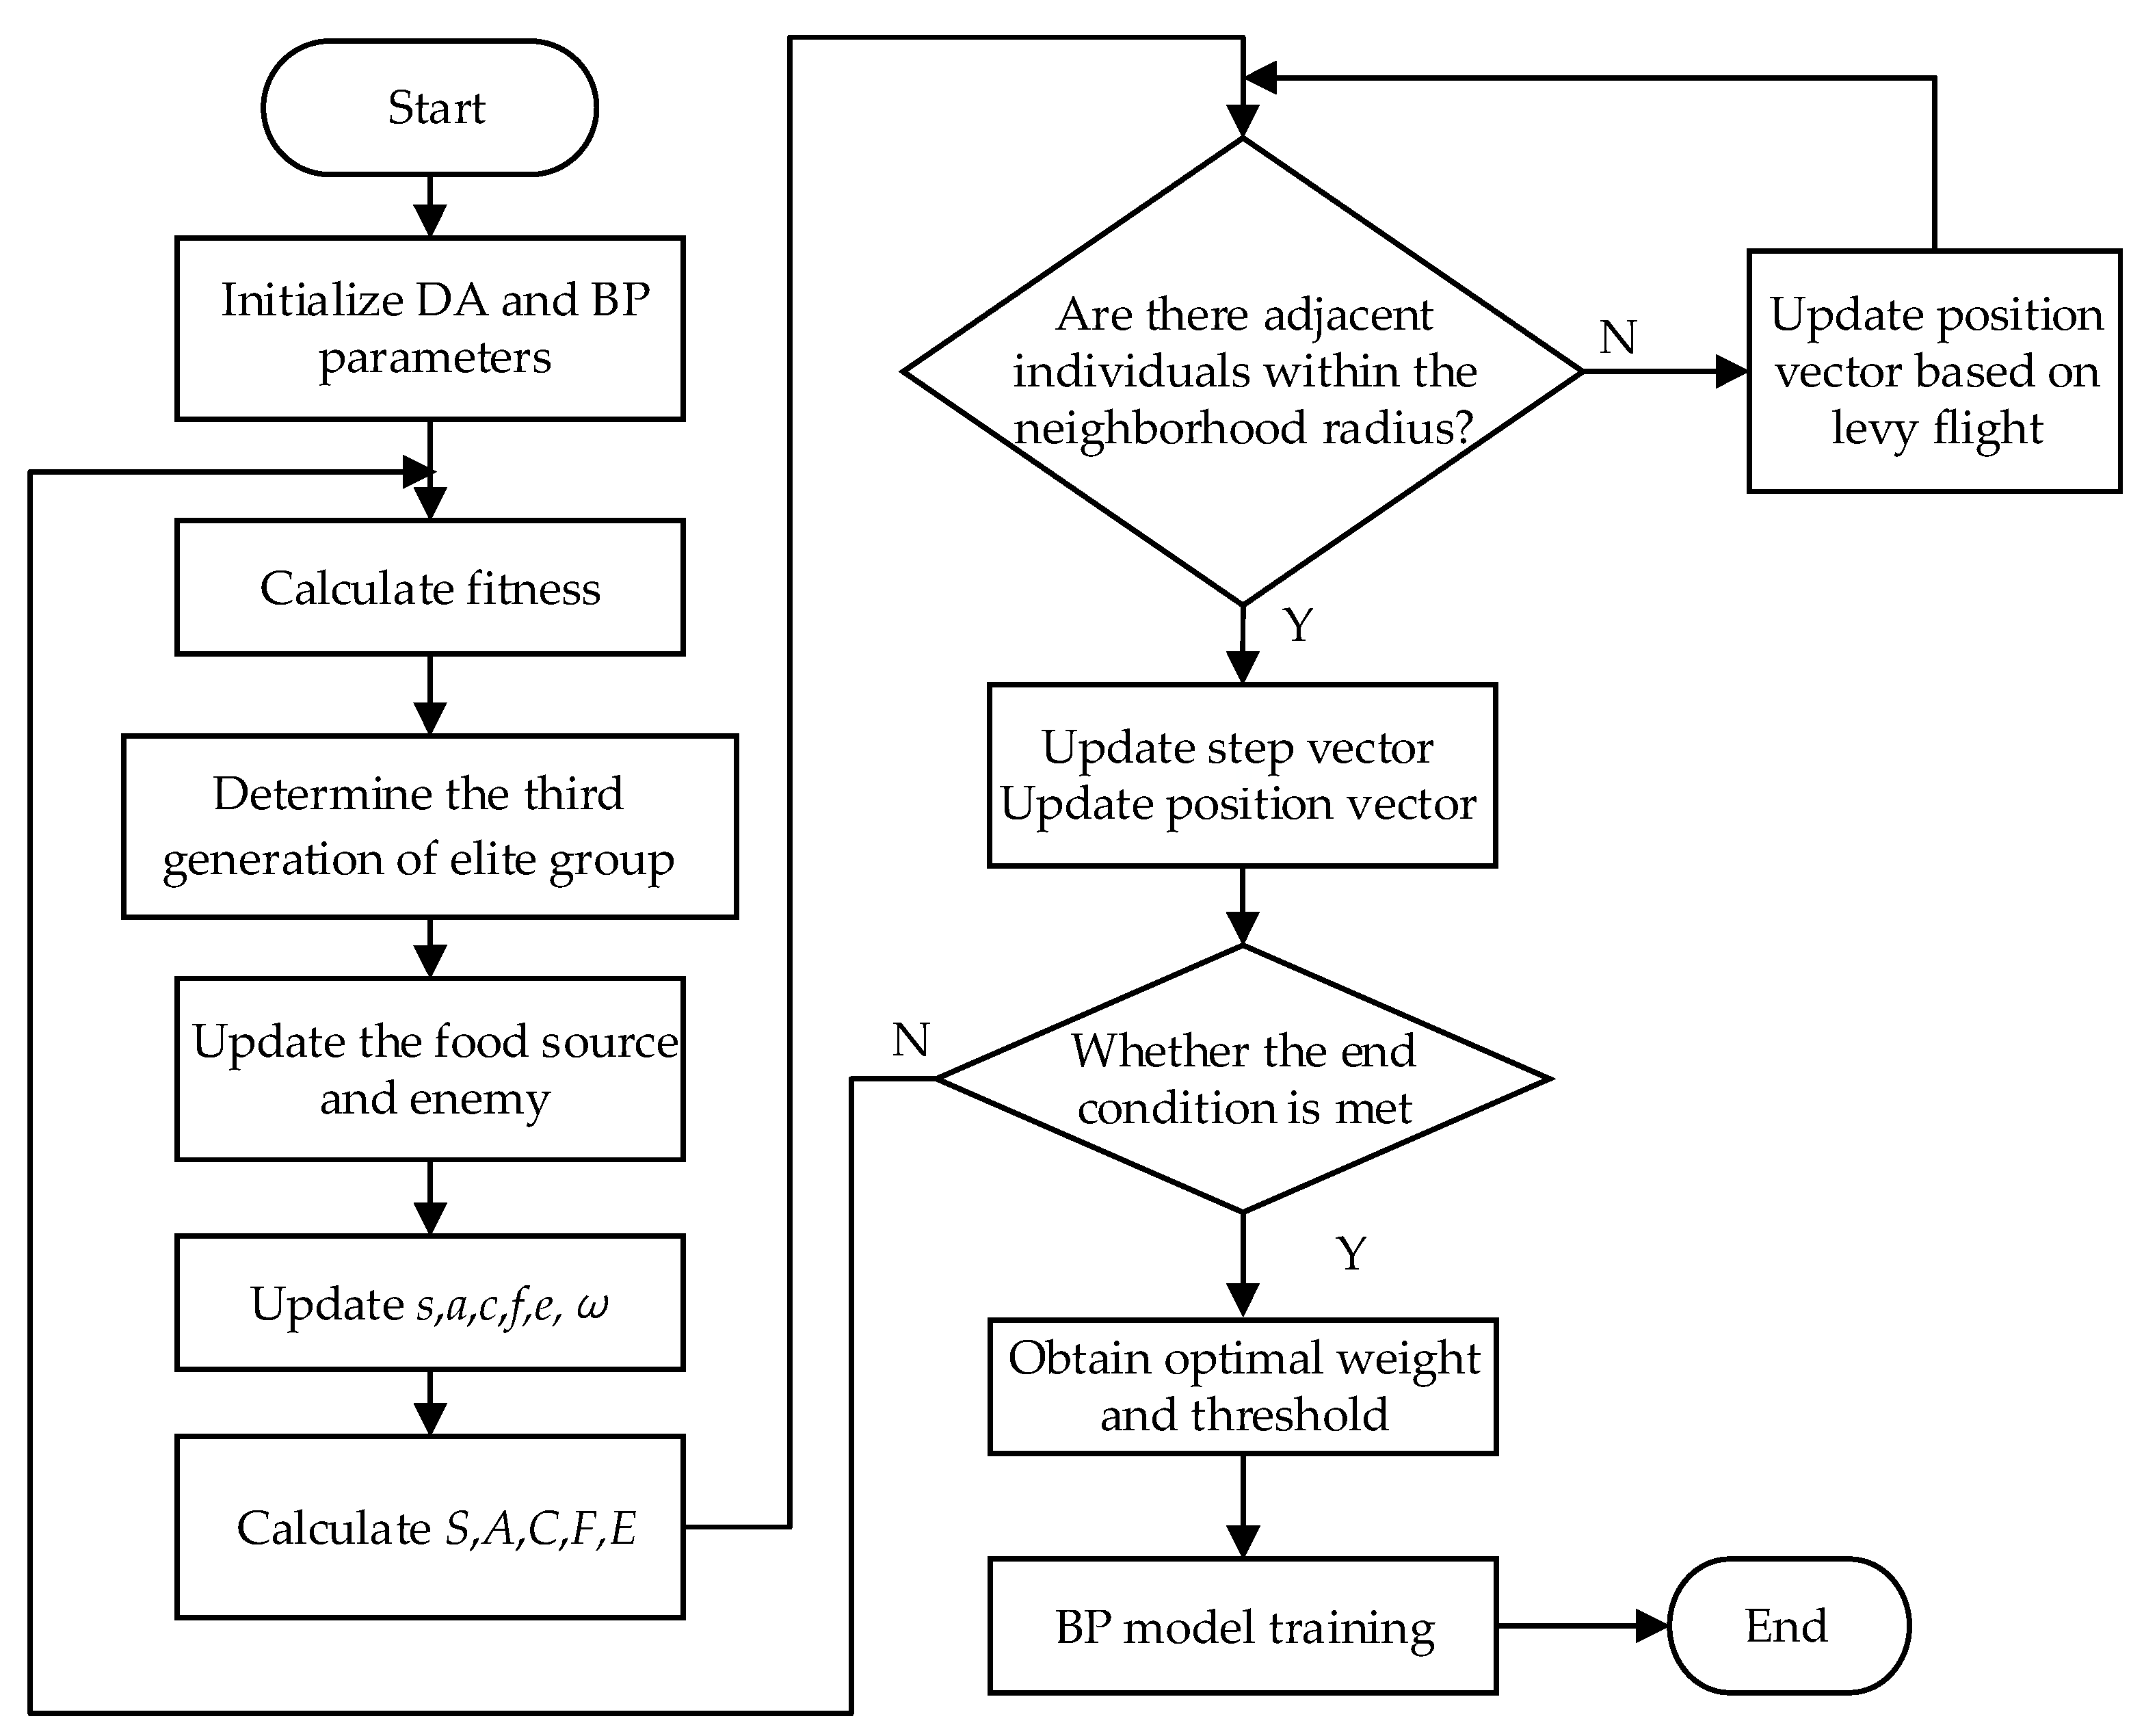
3.2.3. Improved Dragonfly Algorithm

Standard BP neural network uses gradient descent for training which indicates that the training result and accuracy are sensitive to the initial weight values and threshold. It is a feasible way to introduce DA into BP neural network. The basic idea is to use the DA to optimize the weight values, and then the optimized solution of the DA is transferred to BP neural network as its initial weight. The purpose of the IDA combination algorithm to optimize the BP neural network is to accurately find the optimal weight from the overall situation, reduce the learning sample error, and improve the performance of the BP neural network. Its specific construction process is shown in Figure 6, and the specific implementation steps are as follows:
  • Read the sample data, generate training set and test set, and perform normalization processing.
  • Initialization. Initialize BP neural network: the number of neurons in the input layer, hidden layer, and output layer, the weight w, the threshold φ. Initialize algorithm parameters: dragonfly algorithm population size N, the maximum number of iterations M, spatial dimension l, inertial weight Δω, field radius r, five behavior weights s, a, c, f, e.
  • Sort weight w and threshold φ of BP network to form a row vector (w, φ). Generate the initial position P according to the value range of weight and threshold, at the same time, initial step vector ΔP is also generated randomly.
  • Calculate the fitness of individual dragonfly when the number of iterations t is less than the maximum number of iterations. Rank dragonflies from best to worst and pick the first n to form the first generation of elite groups. Determine the boundary according to Equation (19). Use elite strategy to find the first one to determine three generations of dragonfly elite groups.
  • Through the fitness value of individual, excellent dragonfly individual of previous and current generations is obtained. Find the current best individual and worst individual. Consider the best individual as food and the worst individual as an external enemy.
  • Update the five behavior weights s, a, c, f, e, and weights ω. Use the Formulas (9)–(13) to readjust the values of S, A, C, F, and E.
  • Determine whether there are other dragonflies within the radius of the field. If there are neighboring individuals within the neighborhood radius, use the Formulas (14) and (15) to update the individual position vector P and step vector ΔP; if there is no neighbor in the current individual radius, use the Formula (16) to update the individual position vector P.
  • Determine whether the termination condition is met, and if it is satisfied, stop the operation; otherwise return to step 4 to continue the iteration.
  • The optimal individual position P of IDA is recorded, as the weight w and threshold φ of the BP neural network.
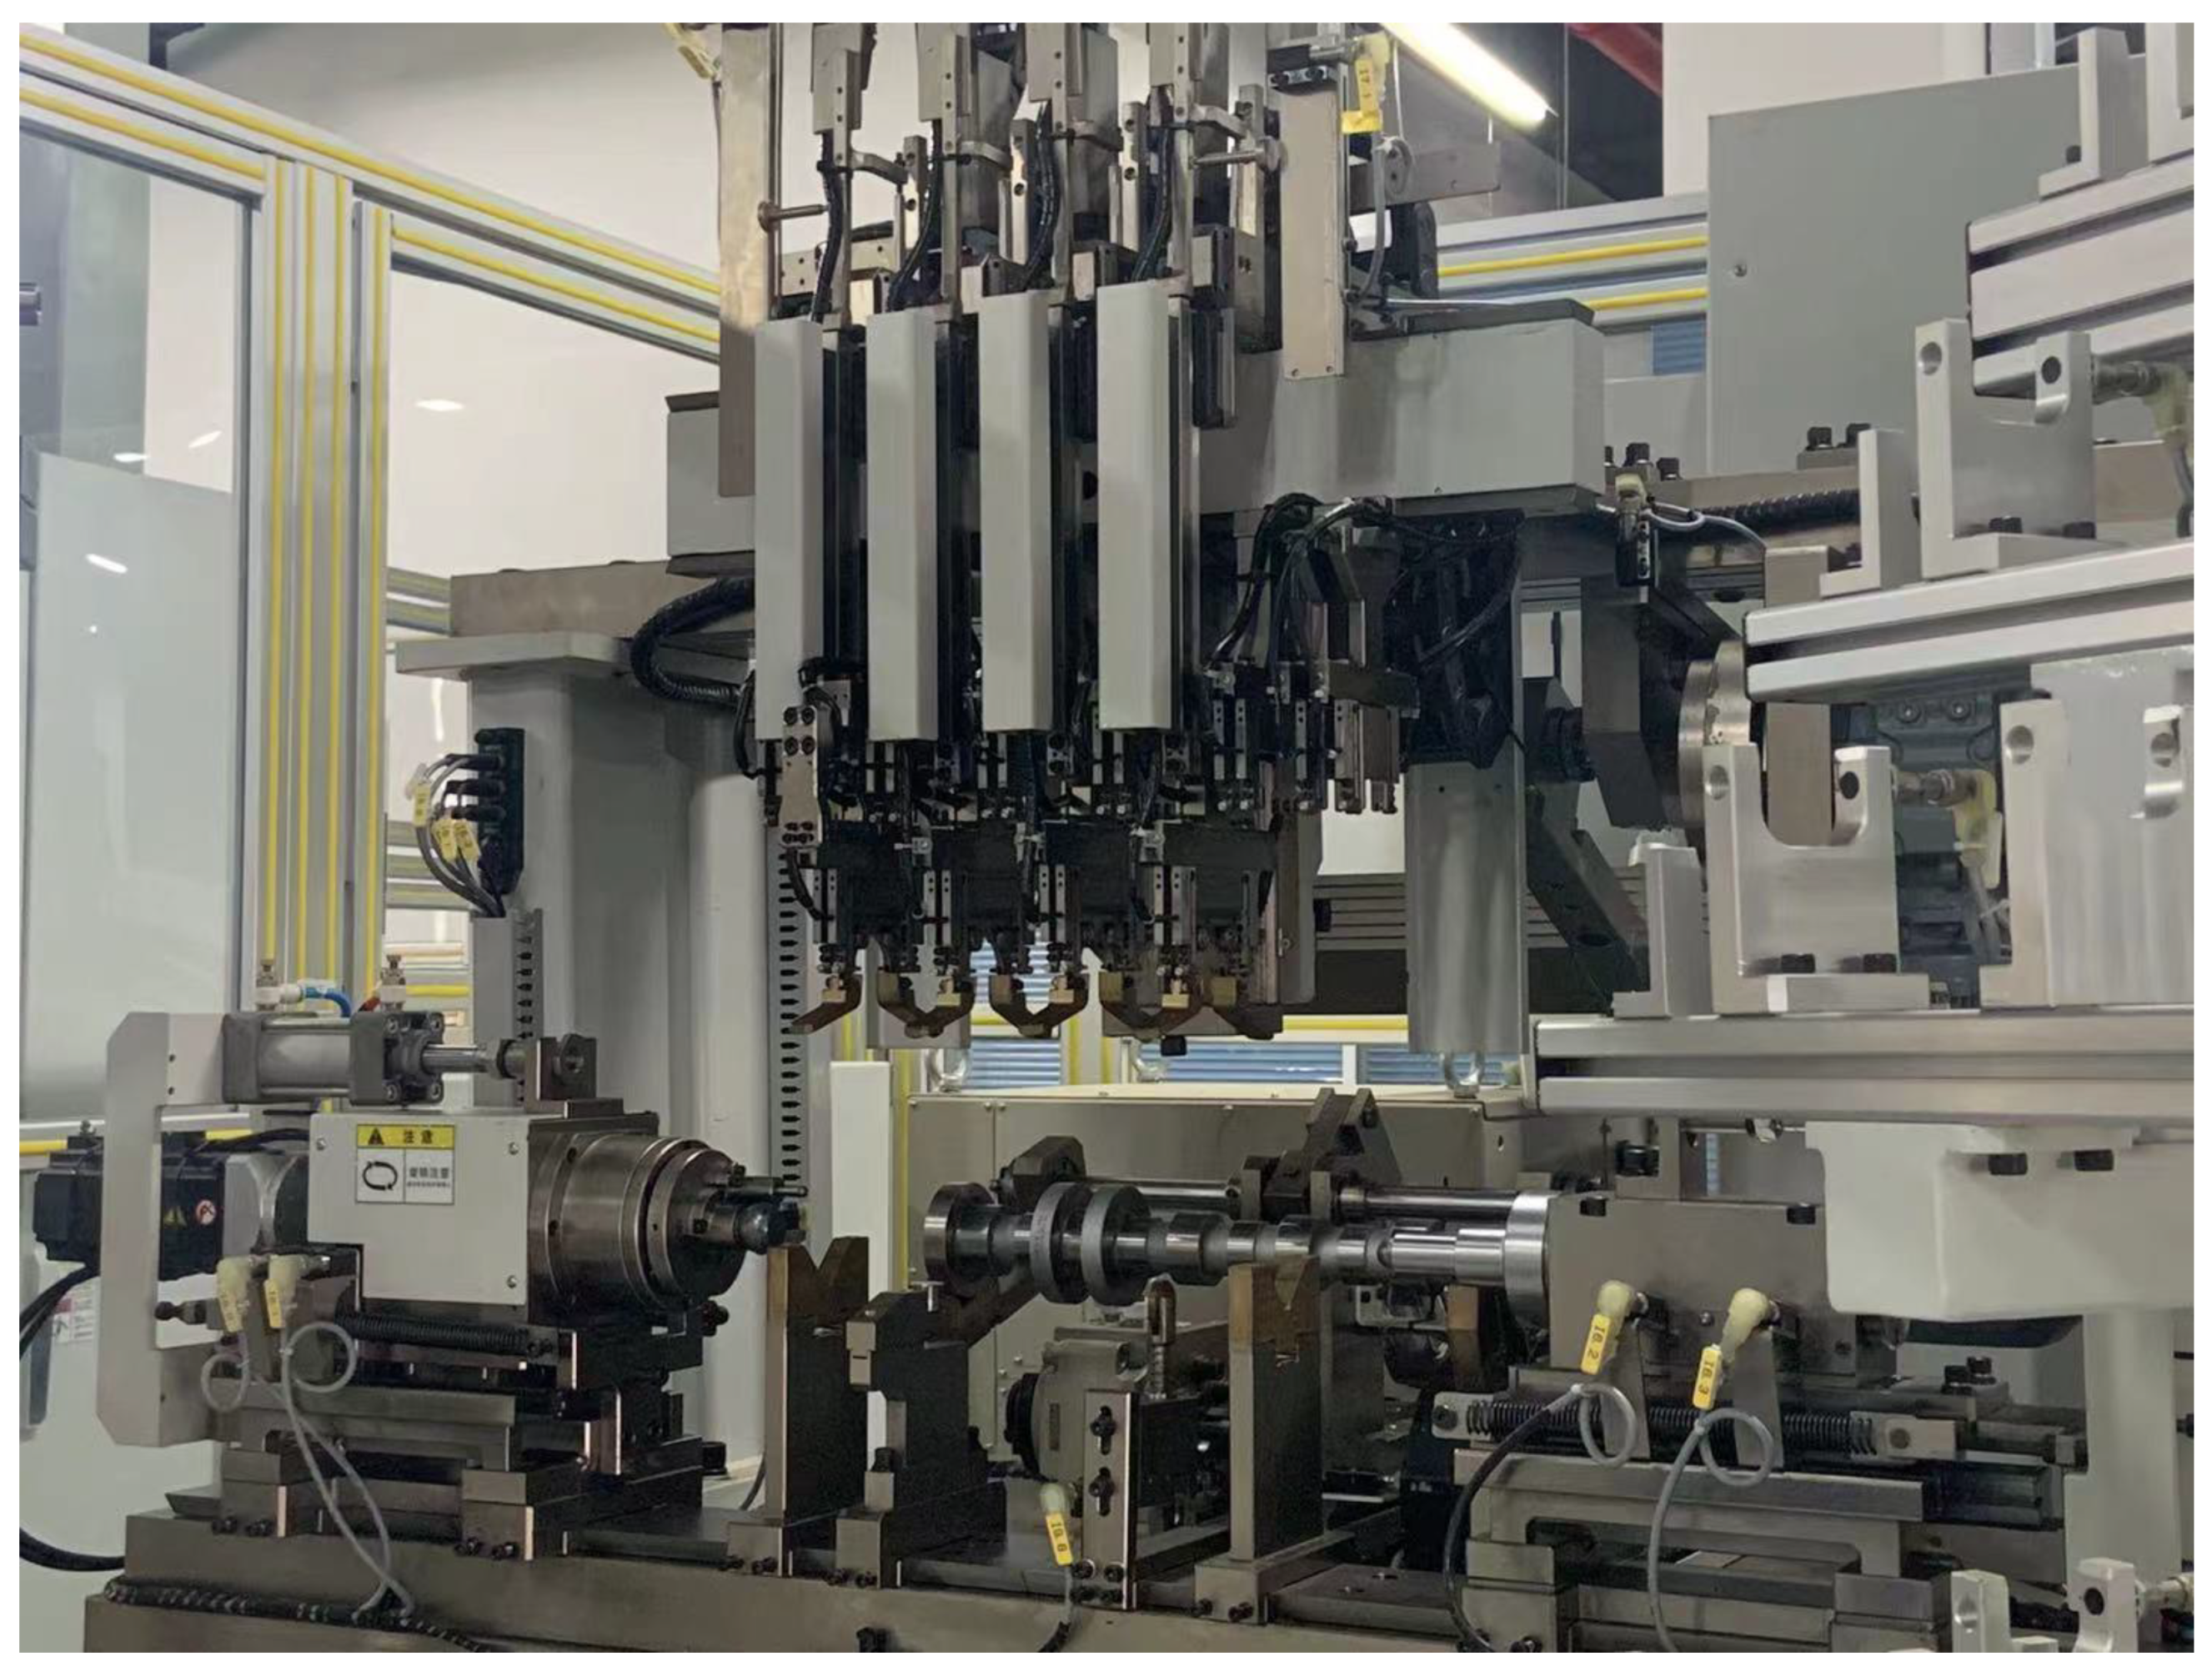
4. Experiment

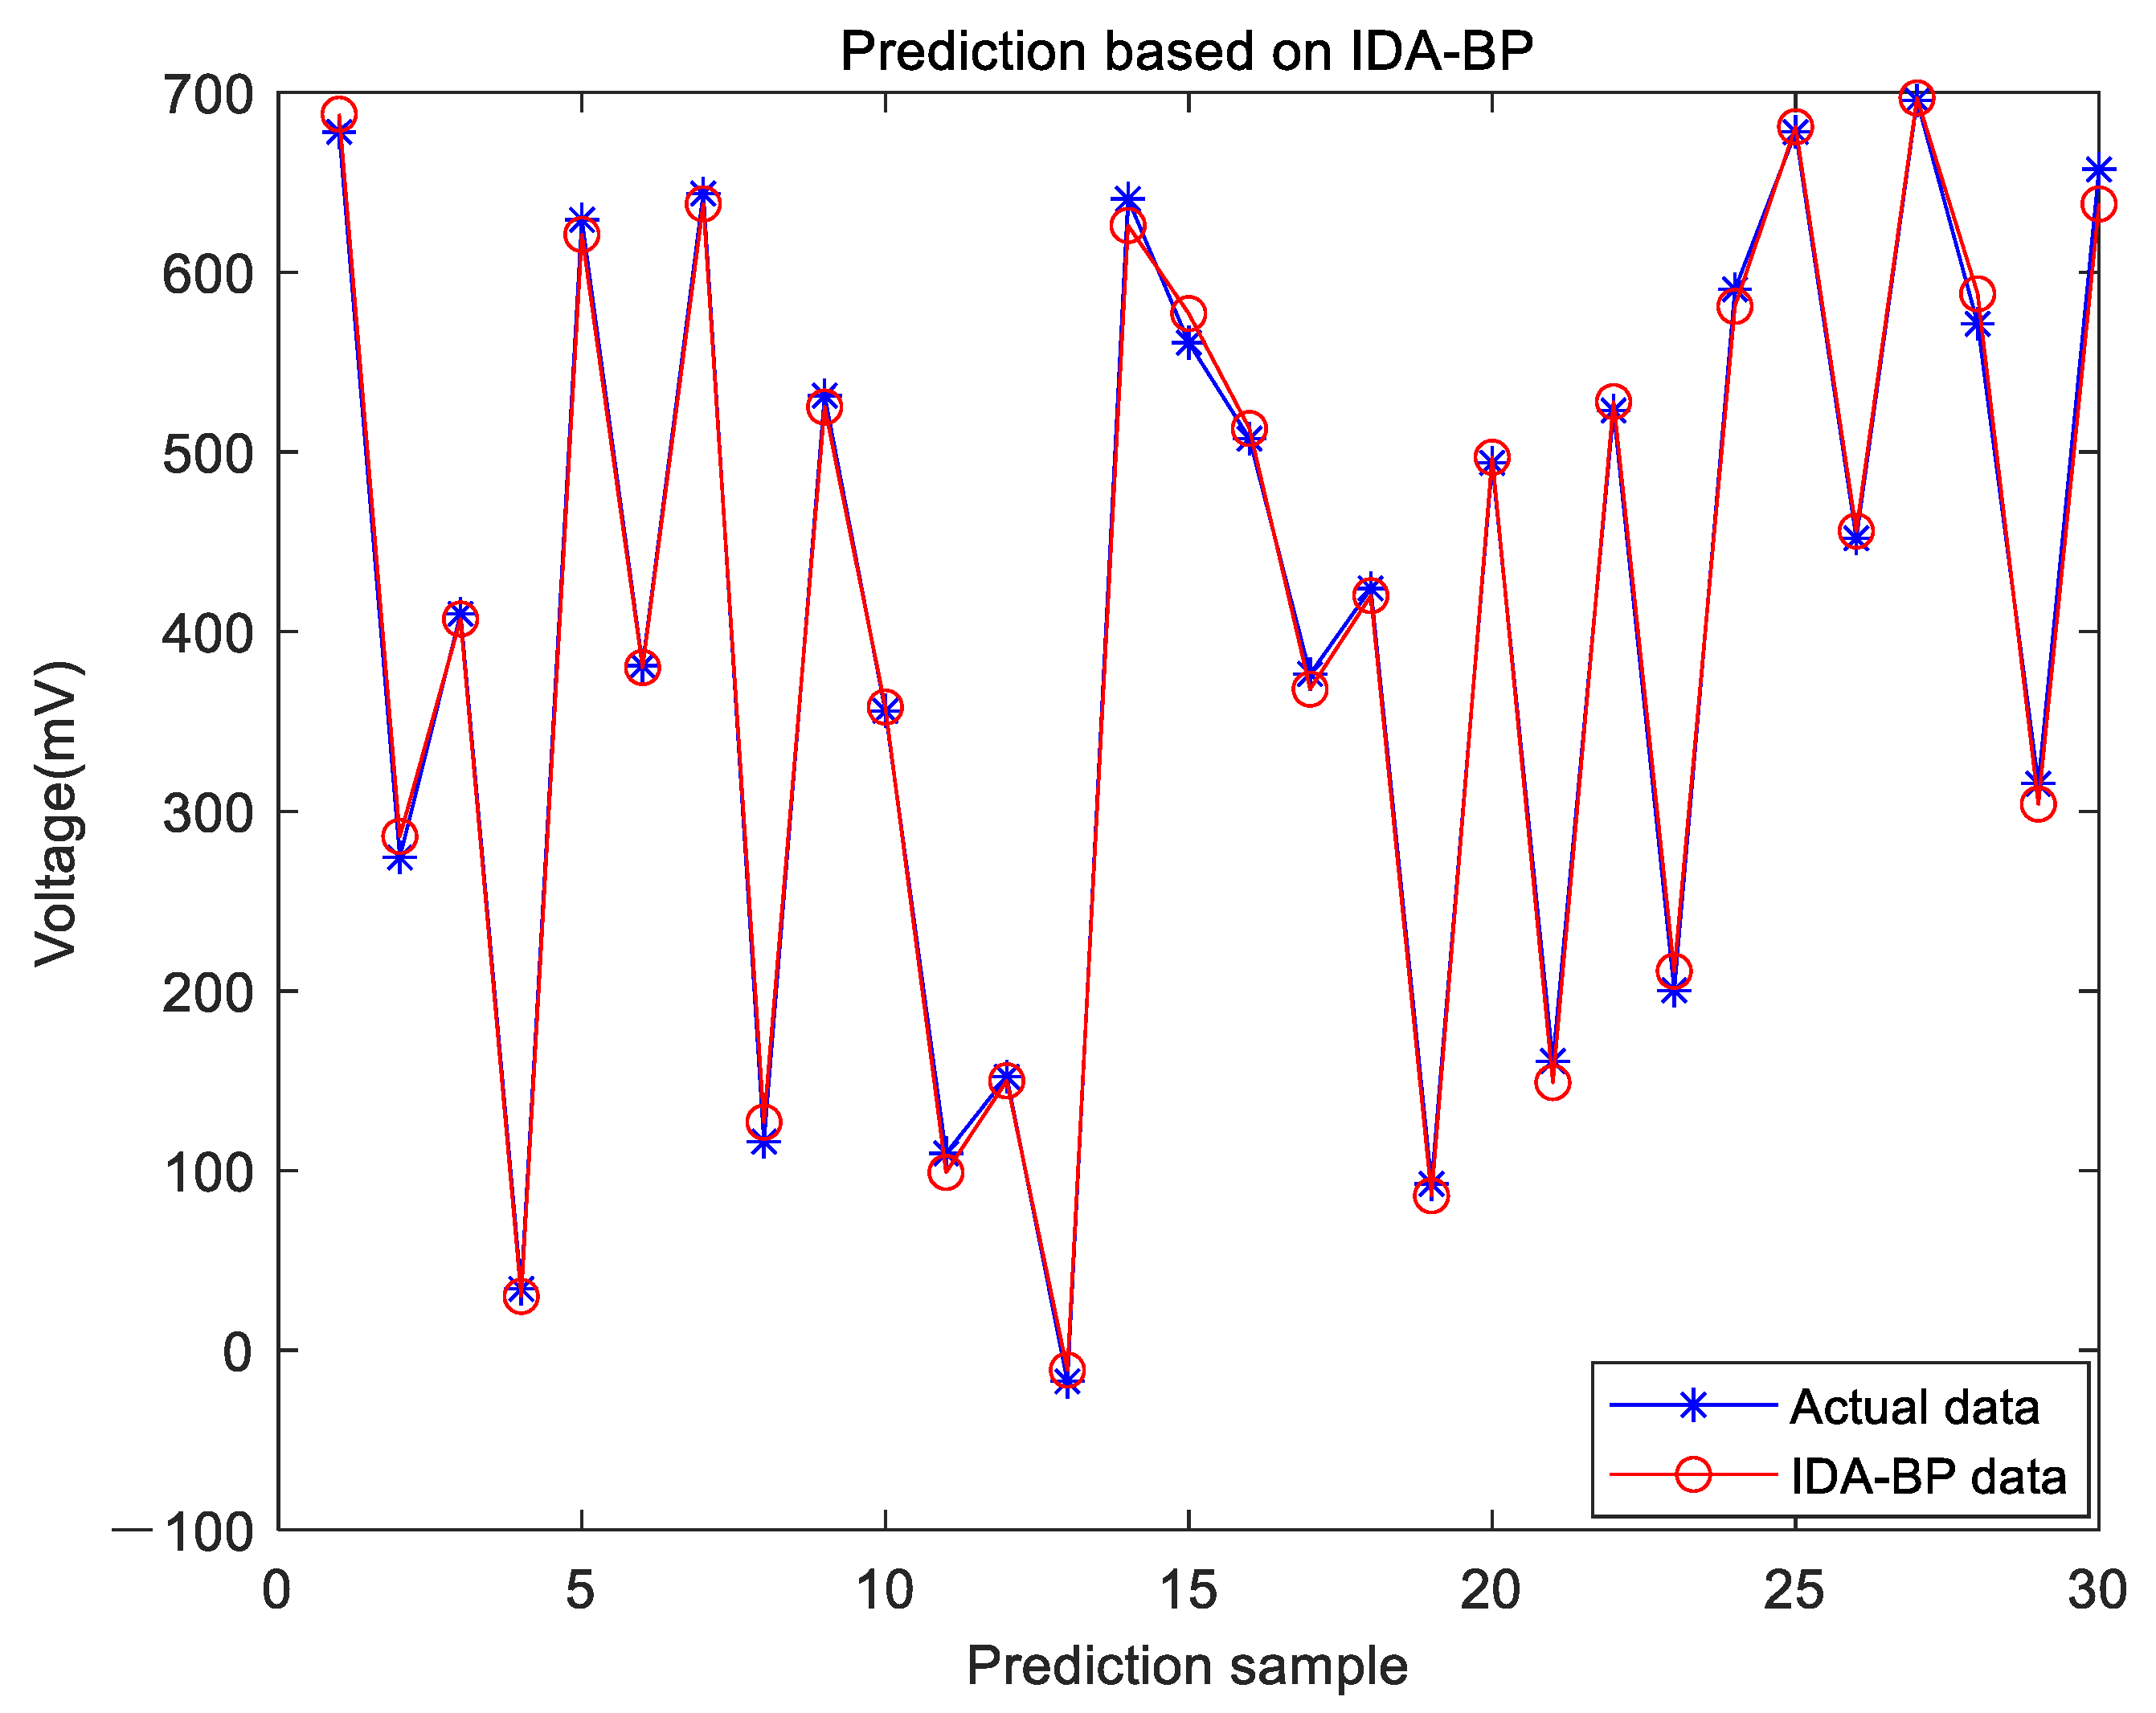
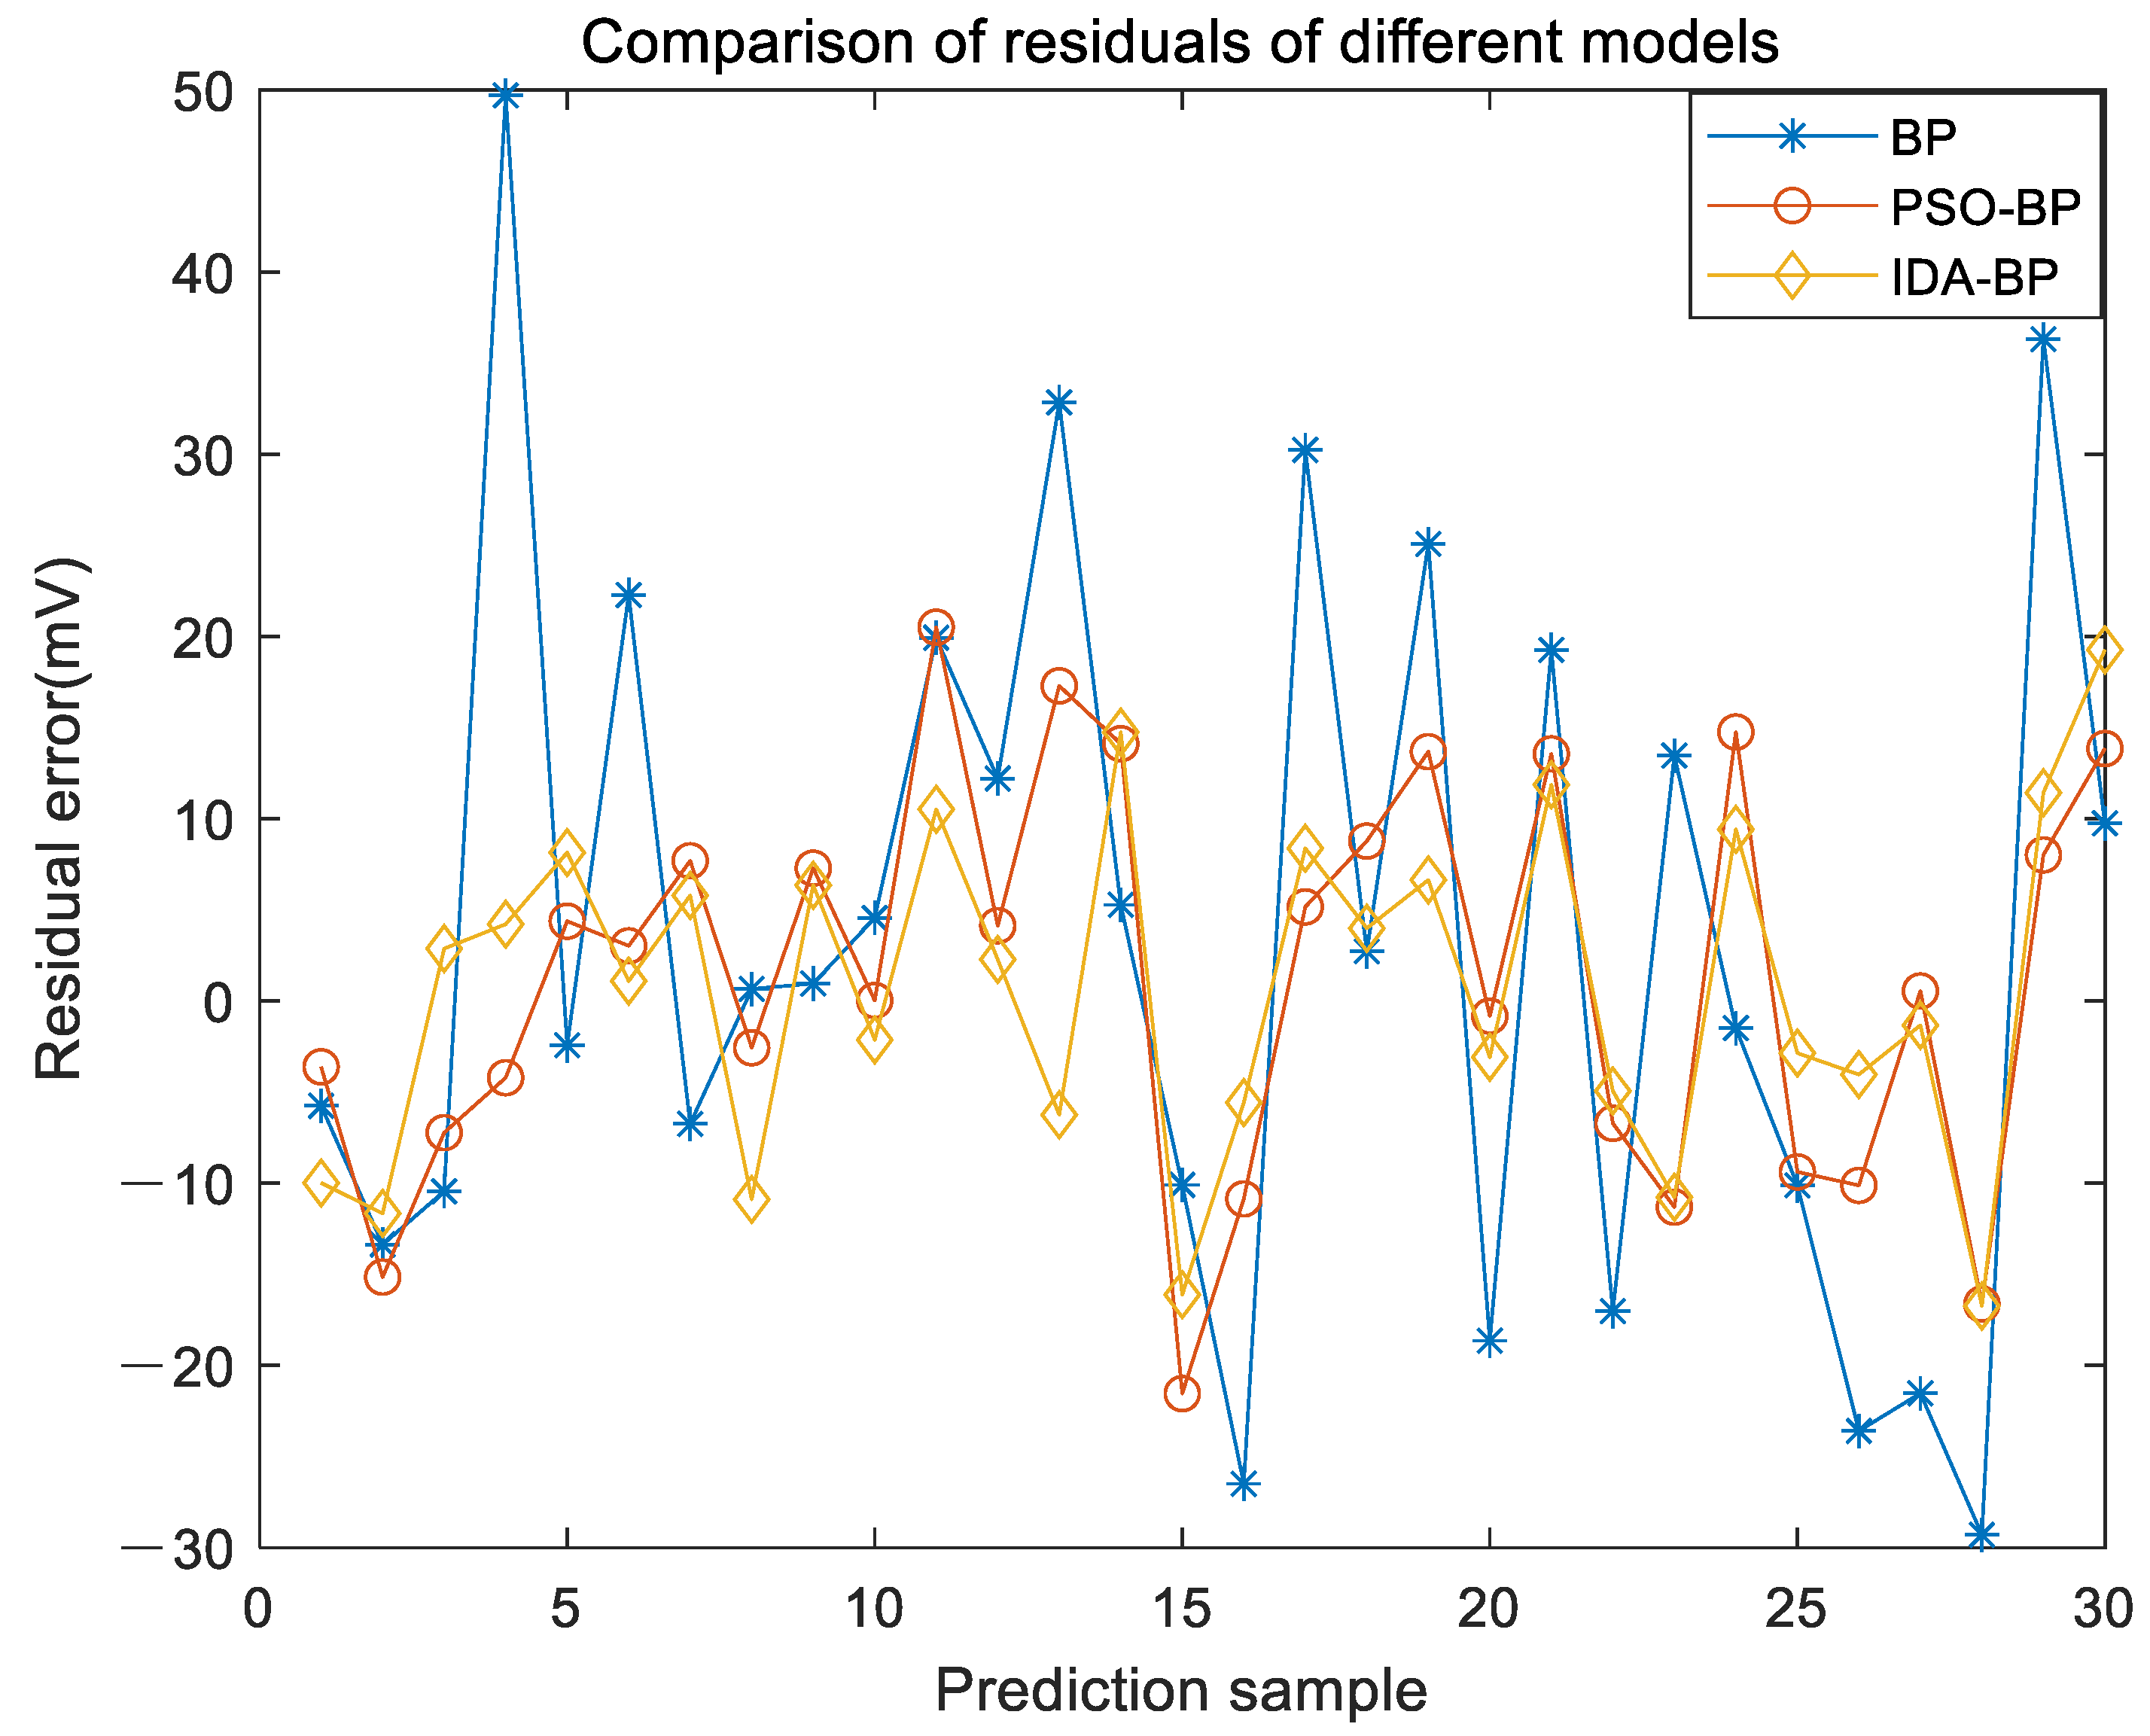
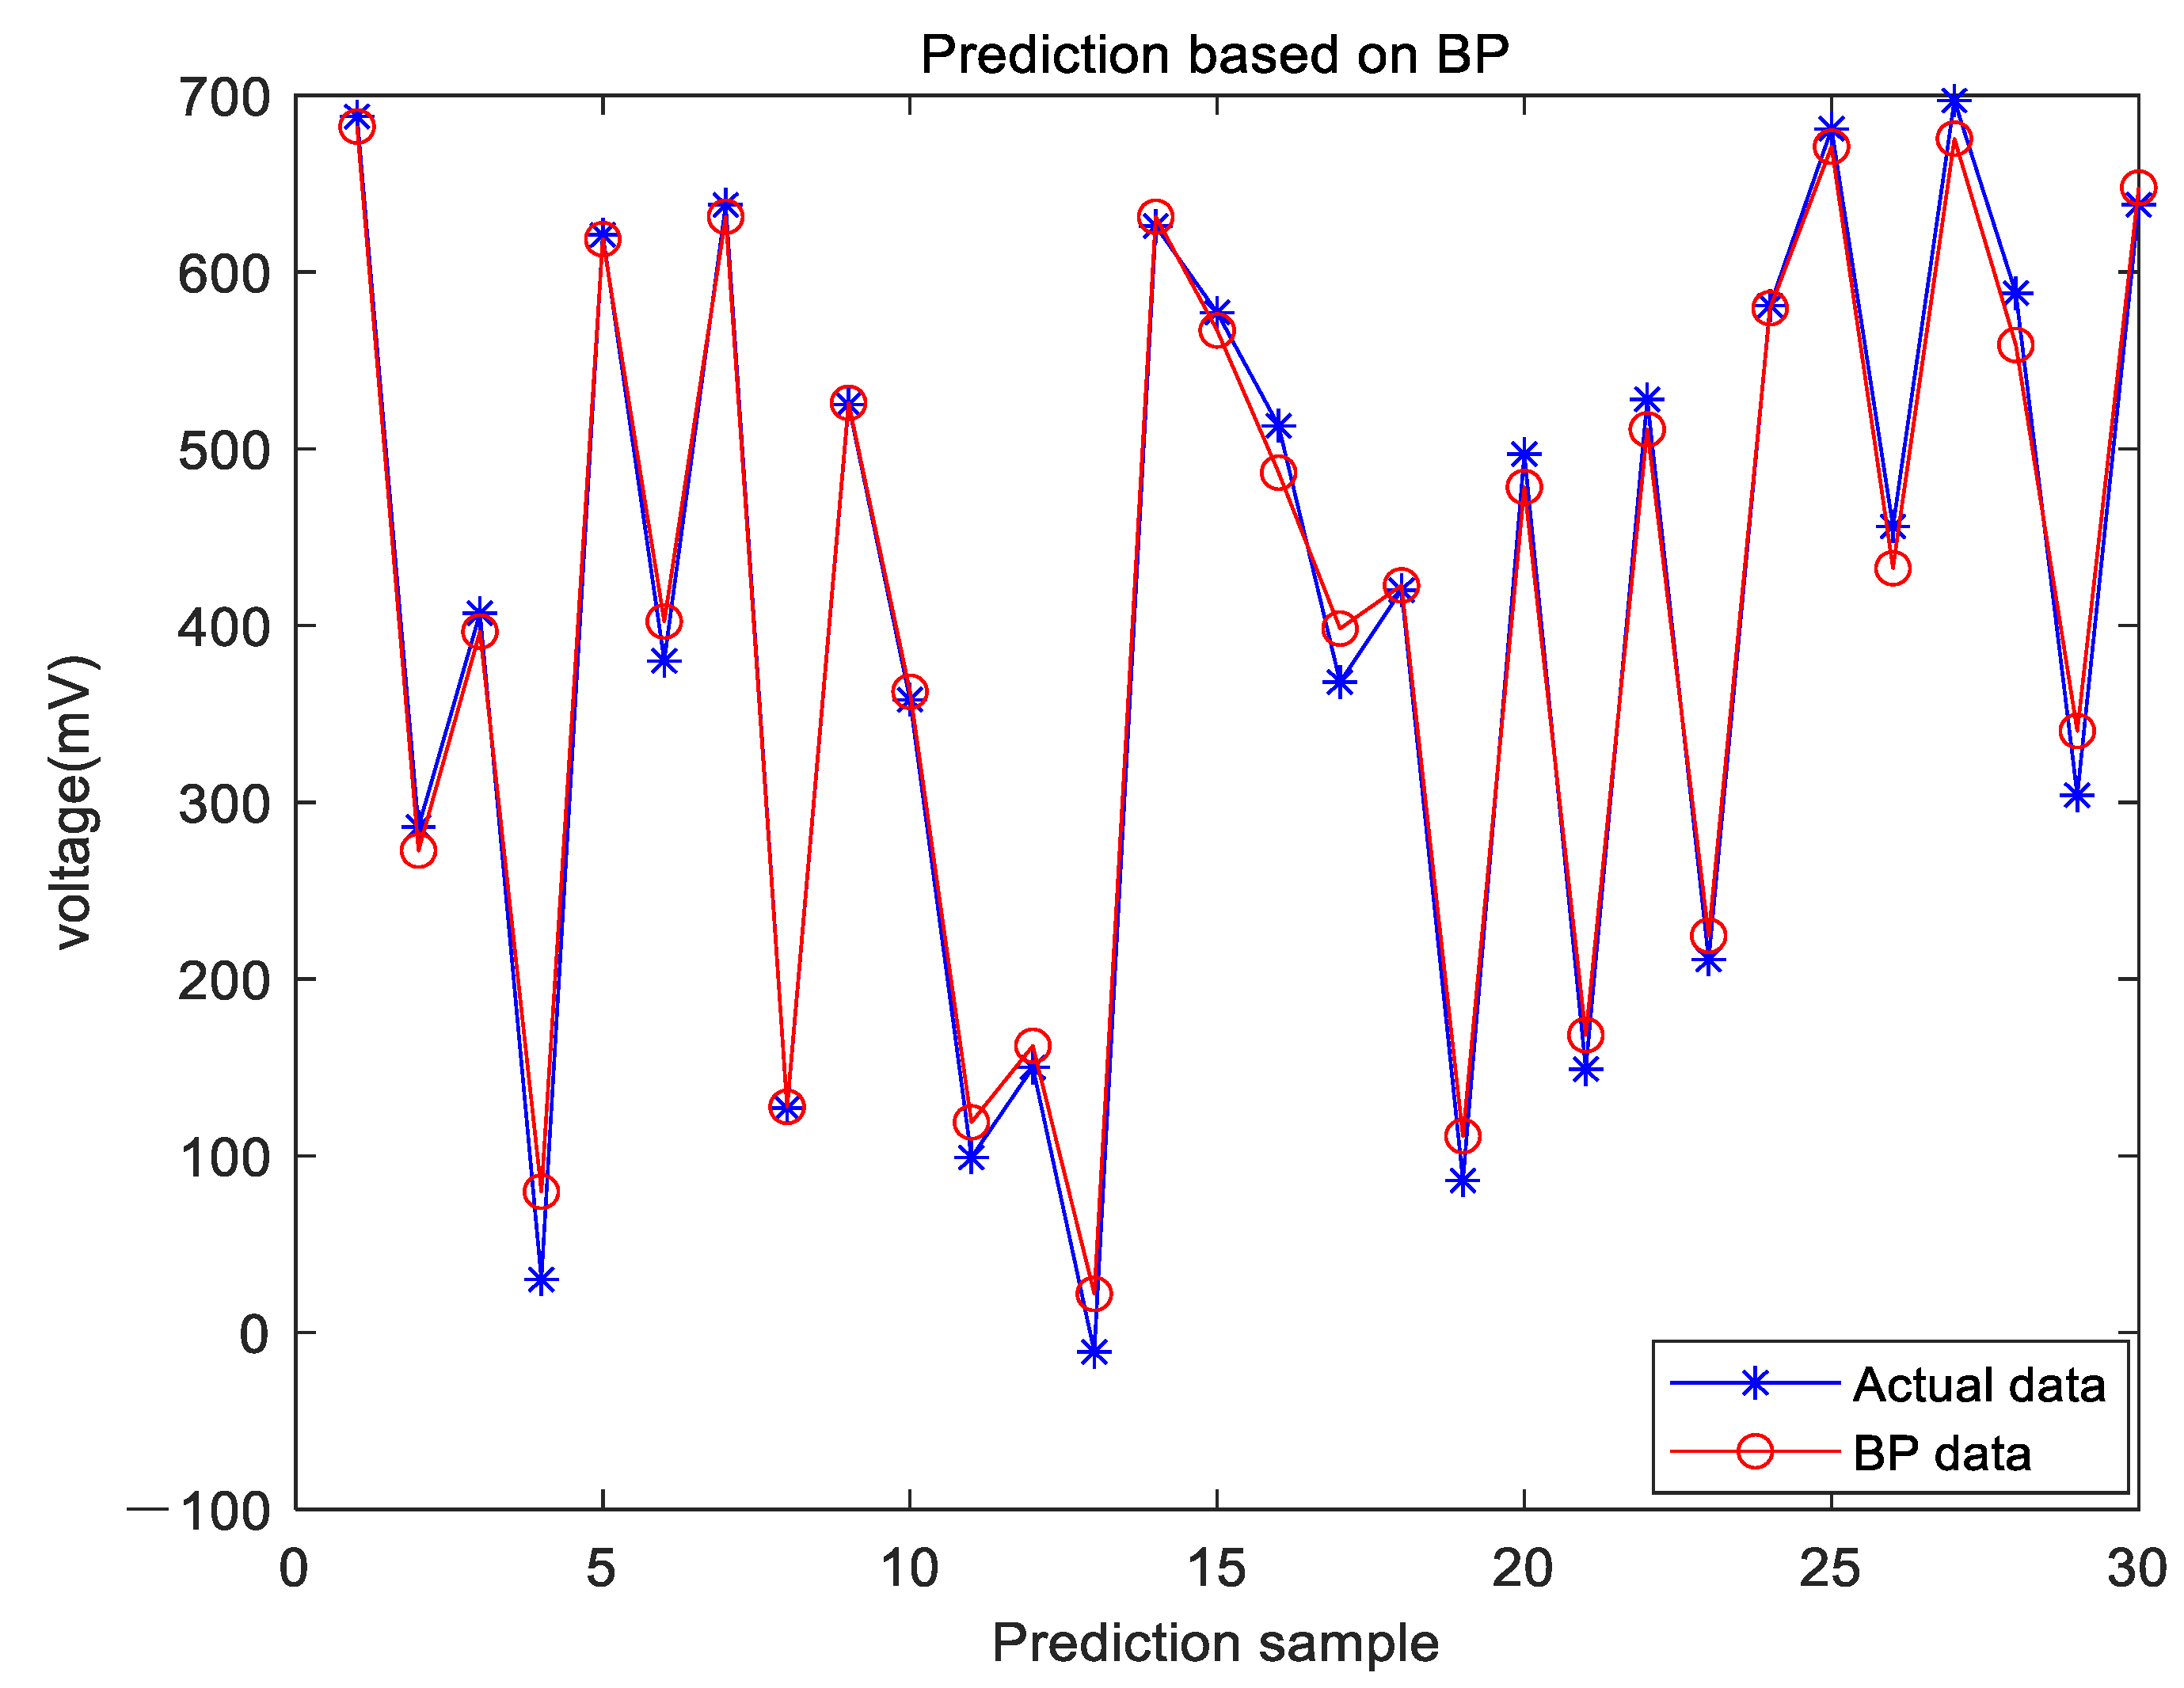
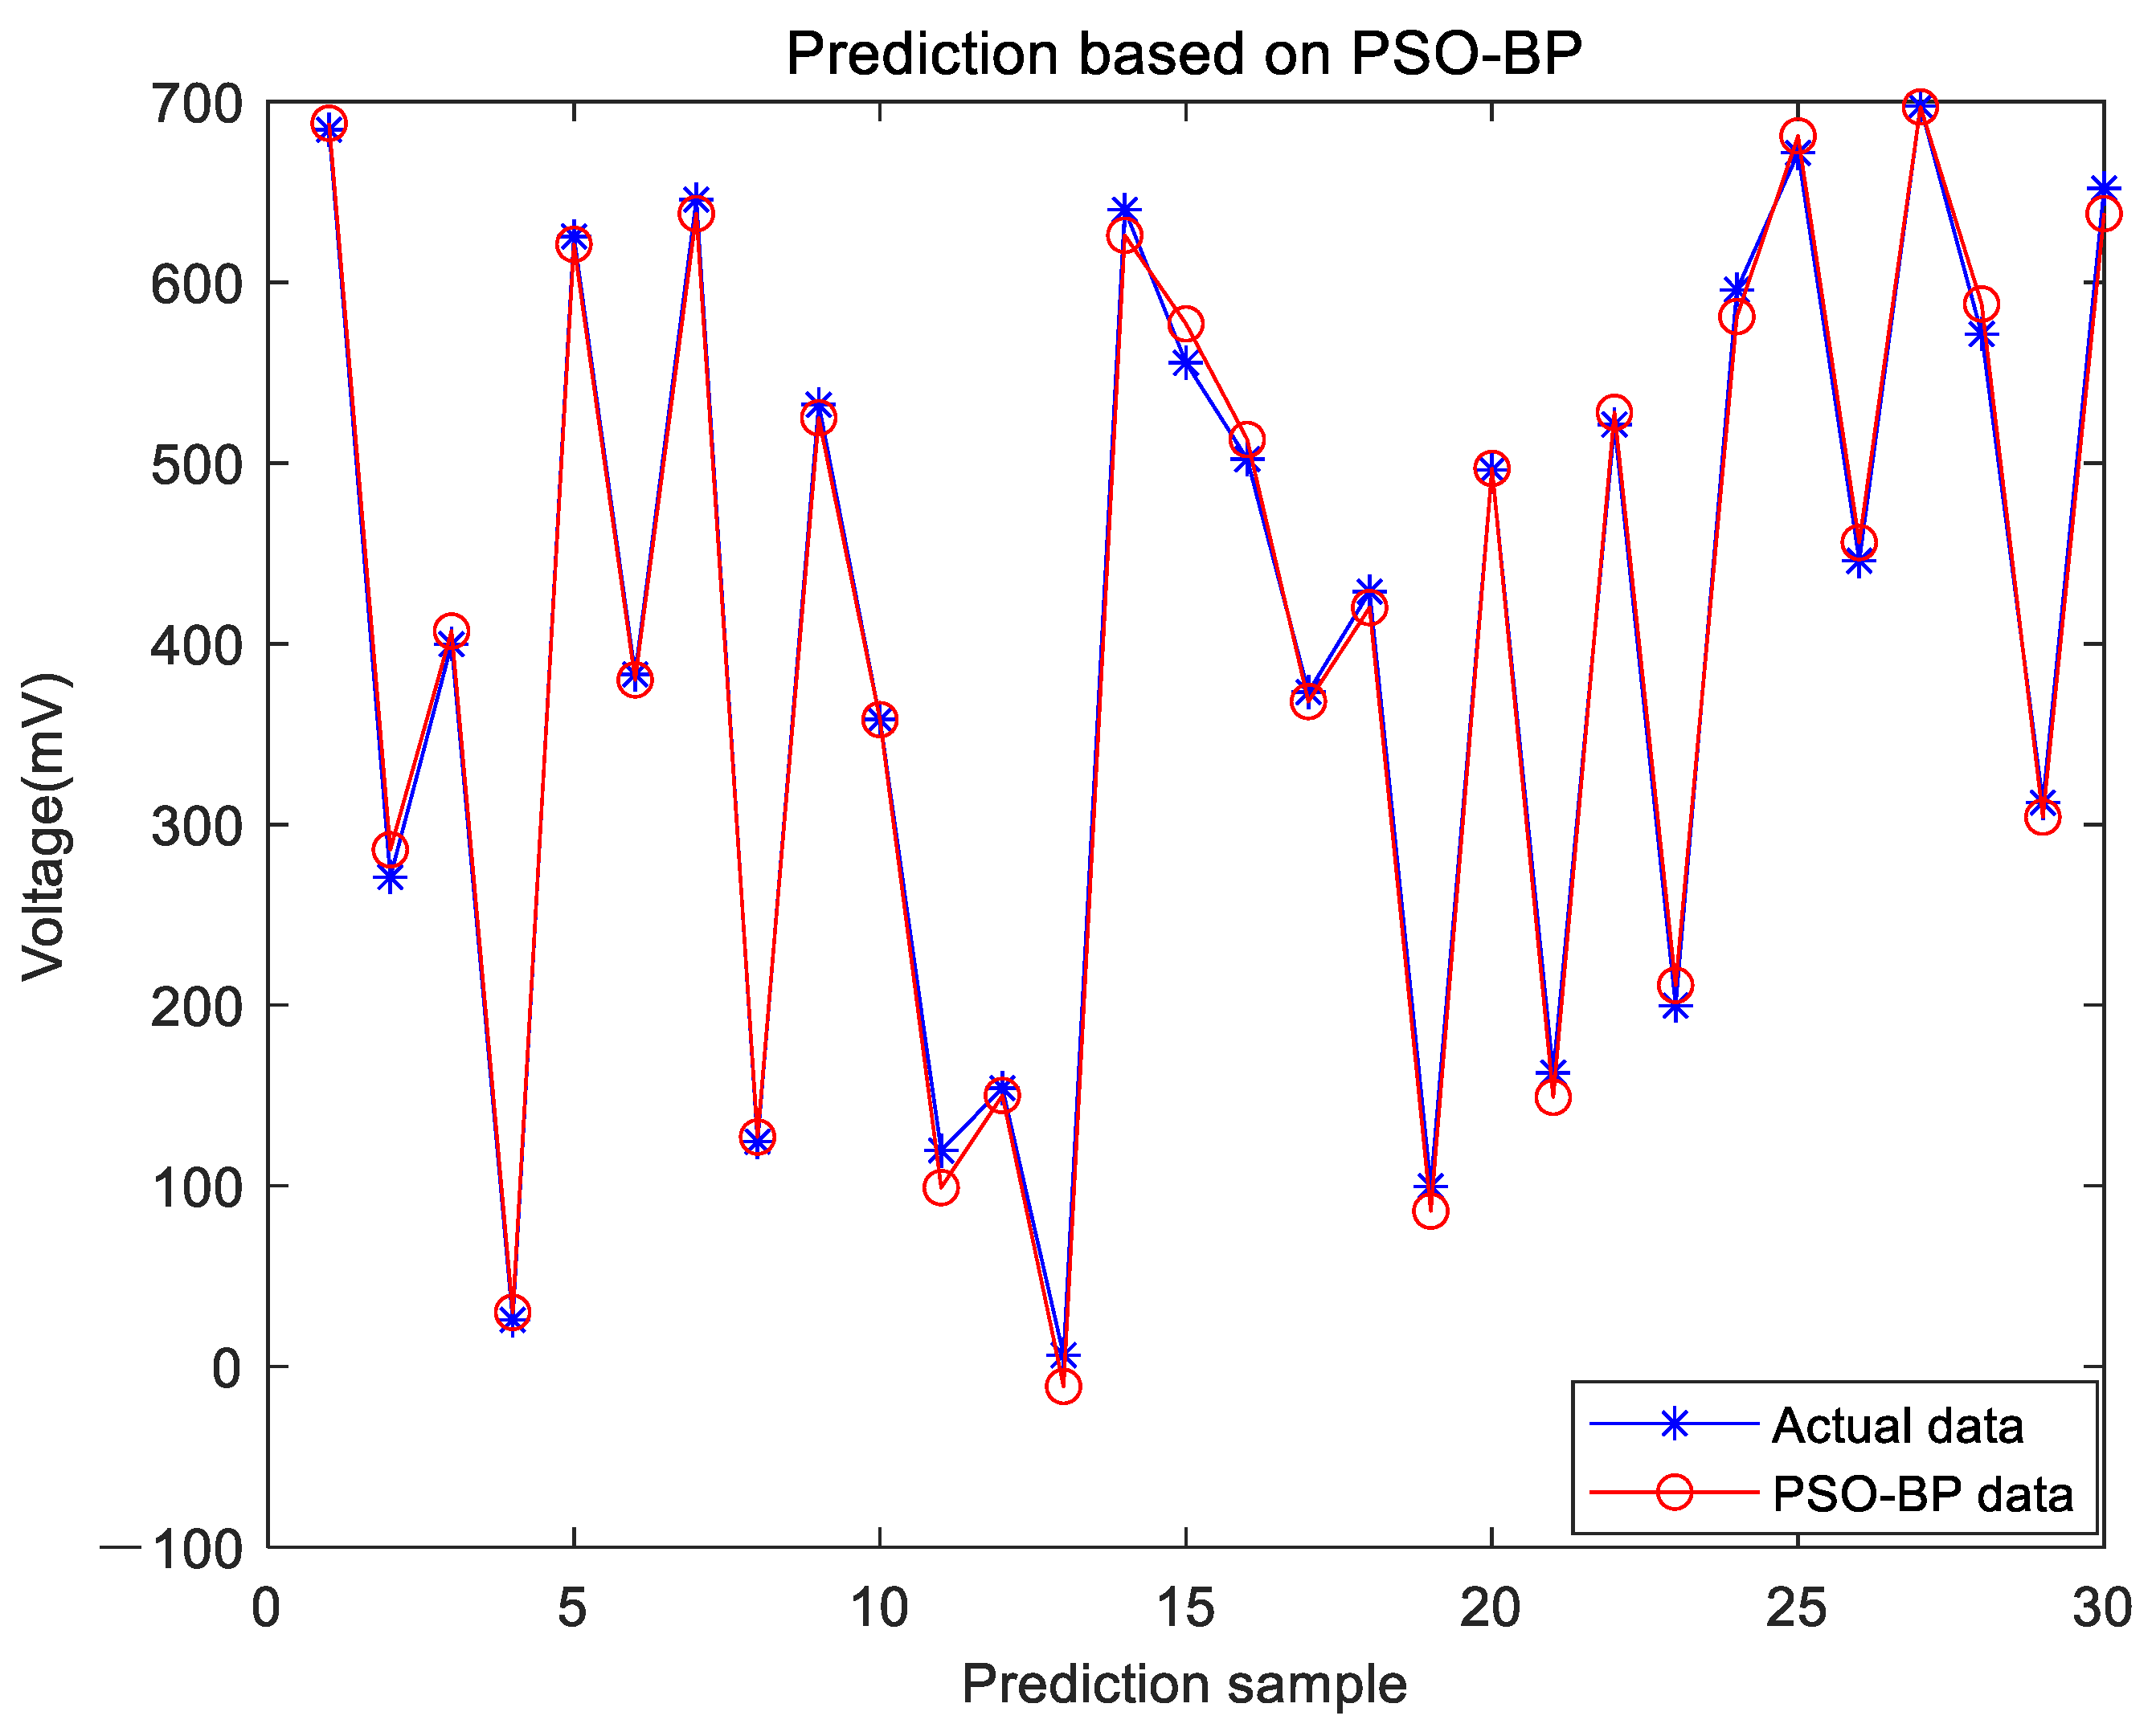
4.1. Improved DA-BP Model

Crankshaft online measurement requires fast and high-precision measurement of the journal. To adapt to the instability of the industrial field environment, it is necessary to select a sensor with high resolution, high-speed sampling, good dynamic performance and good stability. To meet the design of the journal multi-probe distribution, a small size is also required for dense arrangement. Solartron AUSB-0.25-S single-chip flexible gauge type LVDT displacement sensor was selected. The thickness of this sensor is only 6 mm, the measuring range is ±0.25 mm, the accuracy is better than 1 μm, resolution and repeatability are high.
Firstly, the calibration experiment is carried out in combination with the temperature sensor in the range of +5 °C~+60 °C. Then the displacement measured by the displacement sensor, the temperature measured by the temperature sensor and the output voltage of the temperature sensor are used as input, and the output voltage of the displacement sensor is used as the output. Finally, the IDA-BP model proposed in this paper is used to train 90 sets of measured data, and 30 sets of data are used for prediction. Temperature compensation is taken into the displacement sensor. The prediction results are shown in Figure 7.
In order to prove the advantage of this algorithm proposed in this paper, comparisons are taken with the conventional BP neural network and the PSO-BP neural network. The prediction results based on BP are shown in Figure 8 and the prediction results based on PSO-BP are shown in Figure 9.
The residual error comparison of three models is shown in Figure 10. The comparative parameters of three temperature compensation methods are shown in Table 1. The residual error of IDA-BP is 0.6930 mV, which is less than the residual error in BP and in PSO-BP. Mean Squared Error (MSE) and Root Mean Squard Error (RMSE) are also much lower than BP and PSO-BP. It proves that the search ability and training efficiency of IDA-BP neural network have been improved.

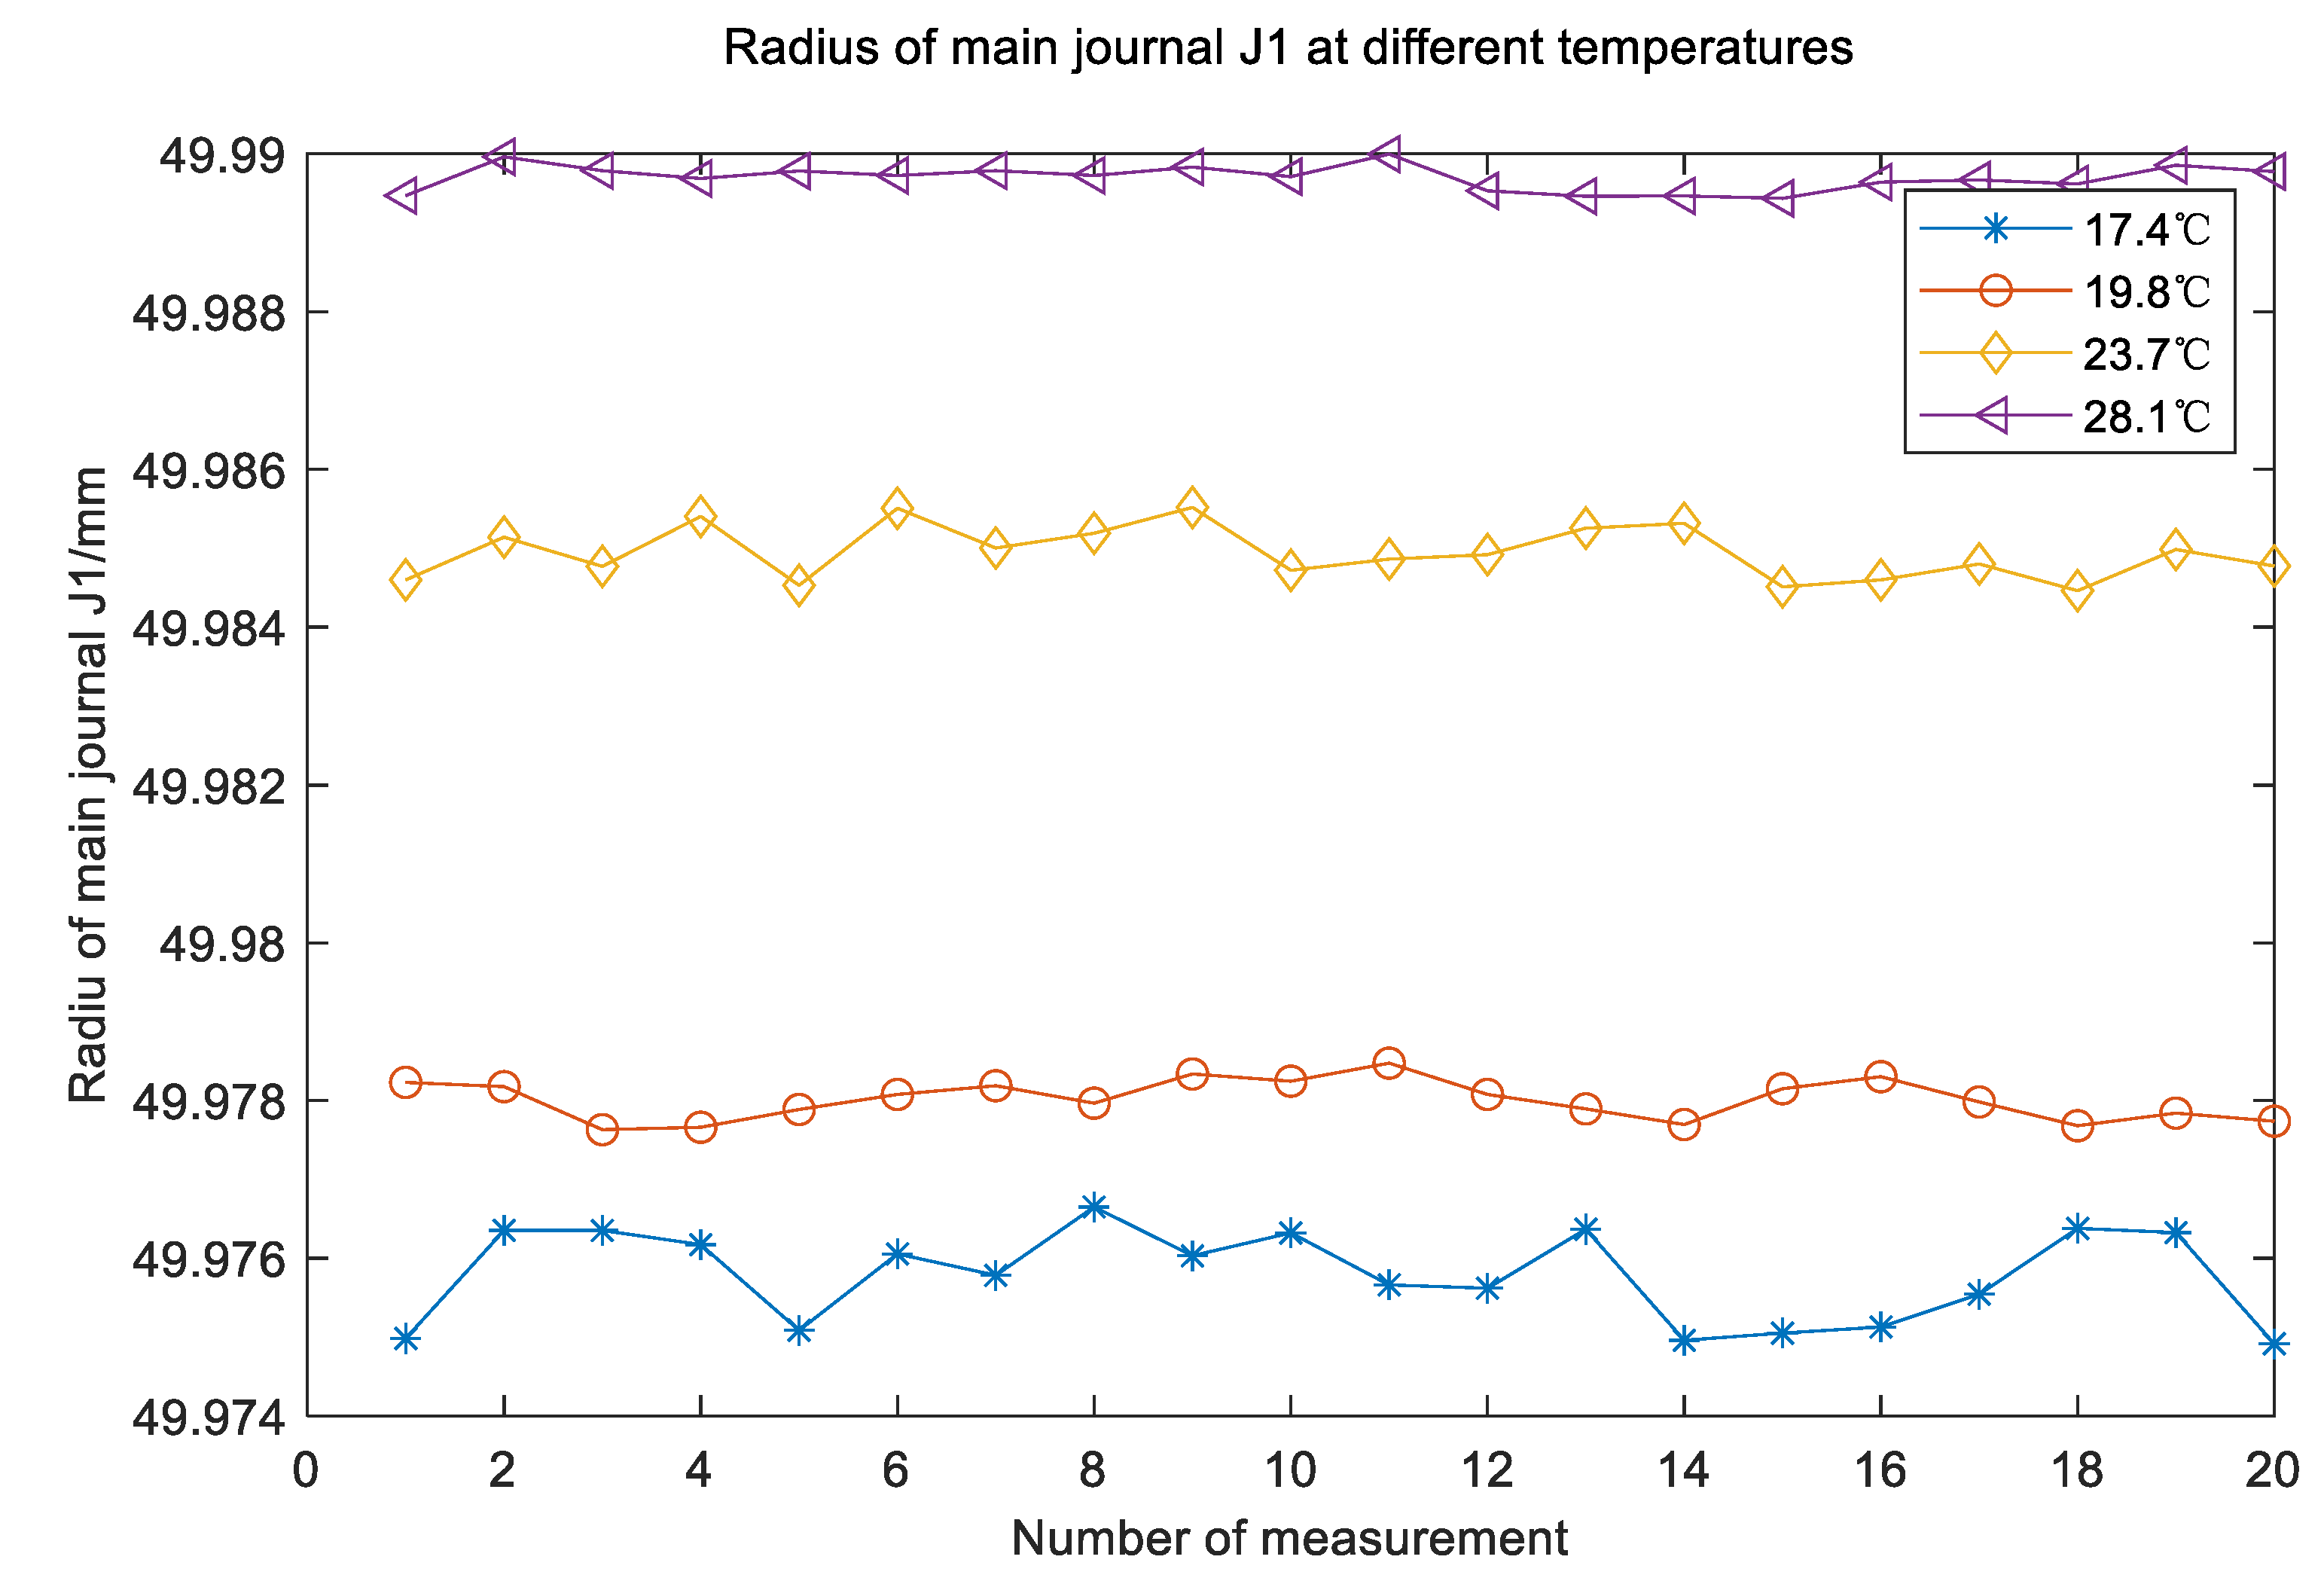
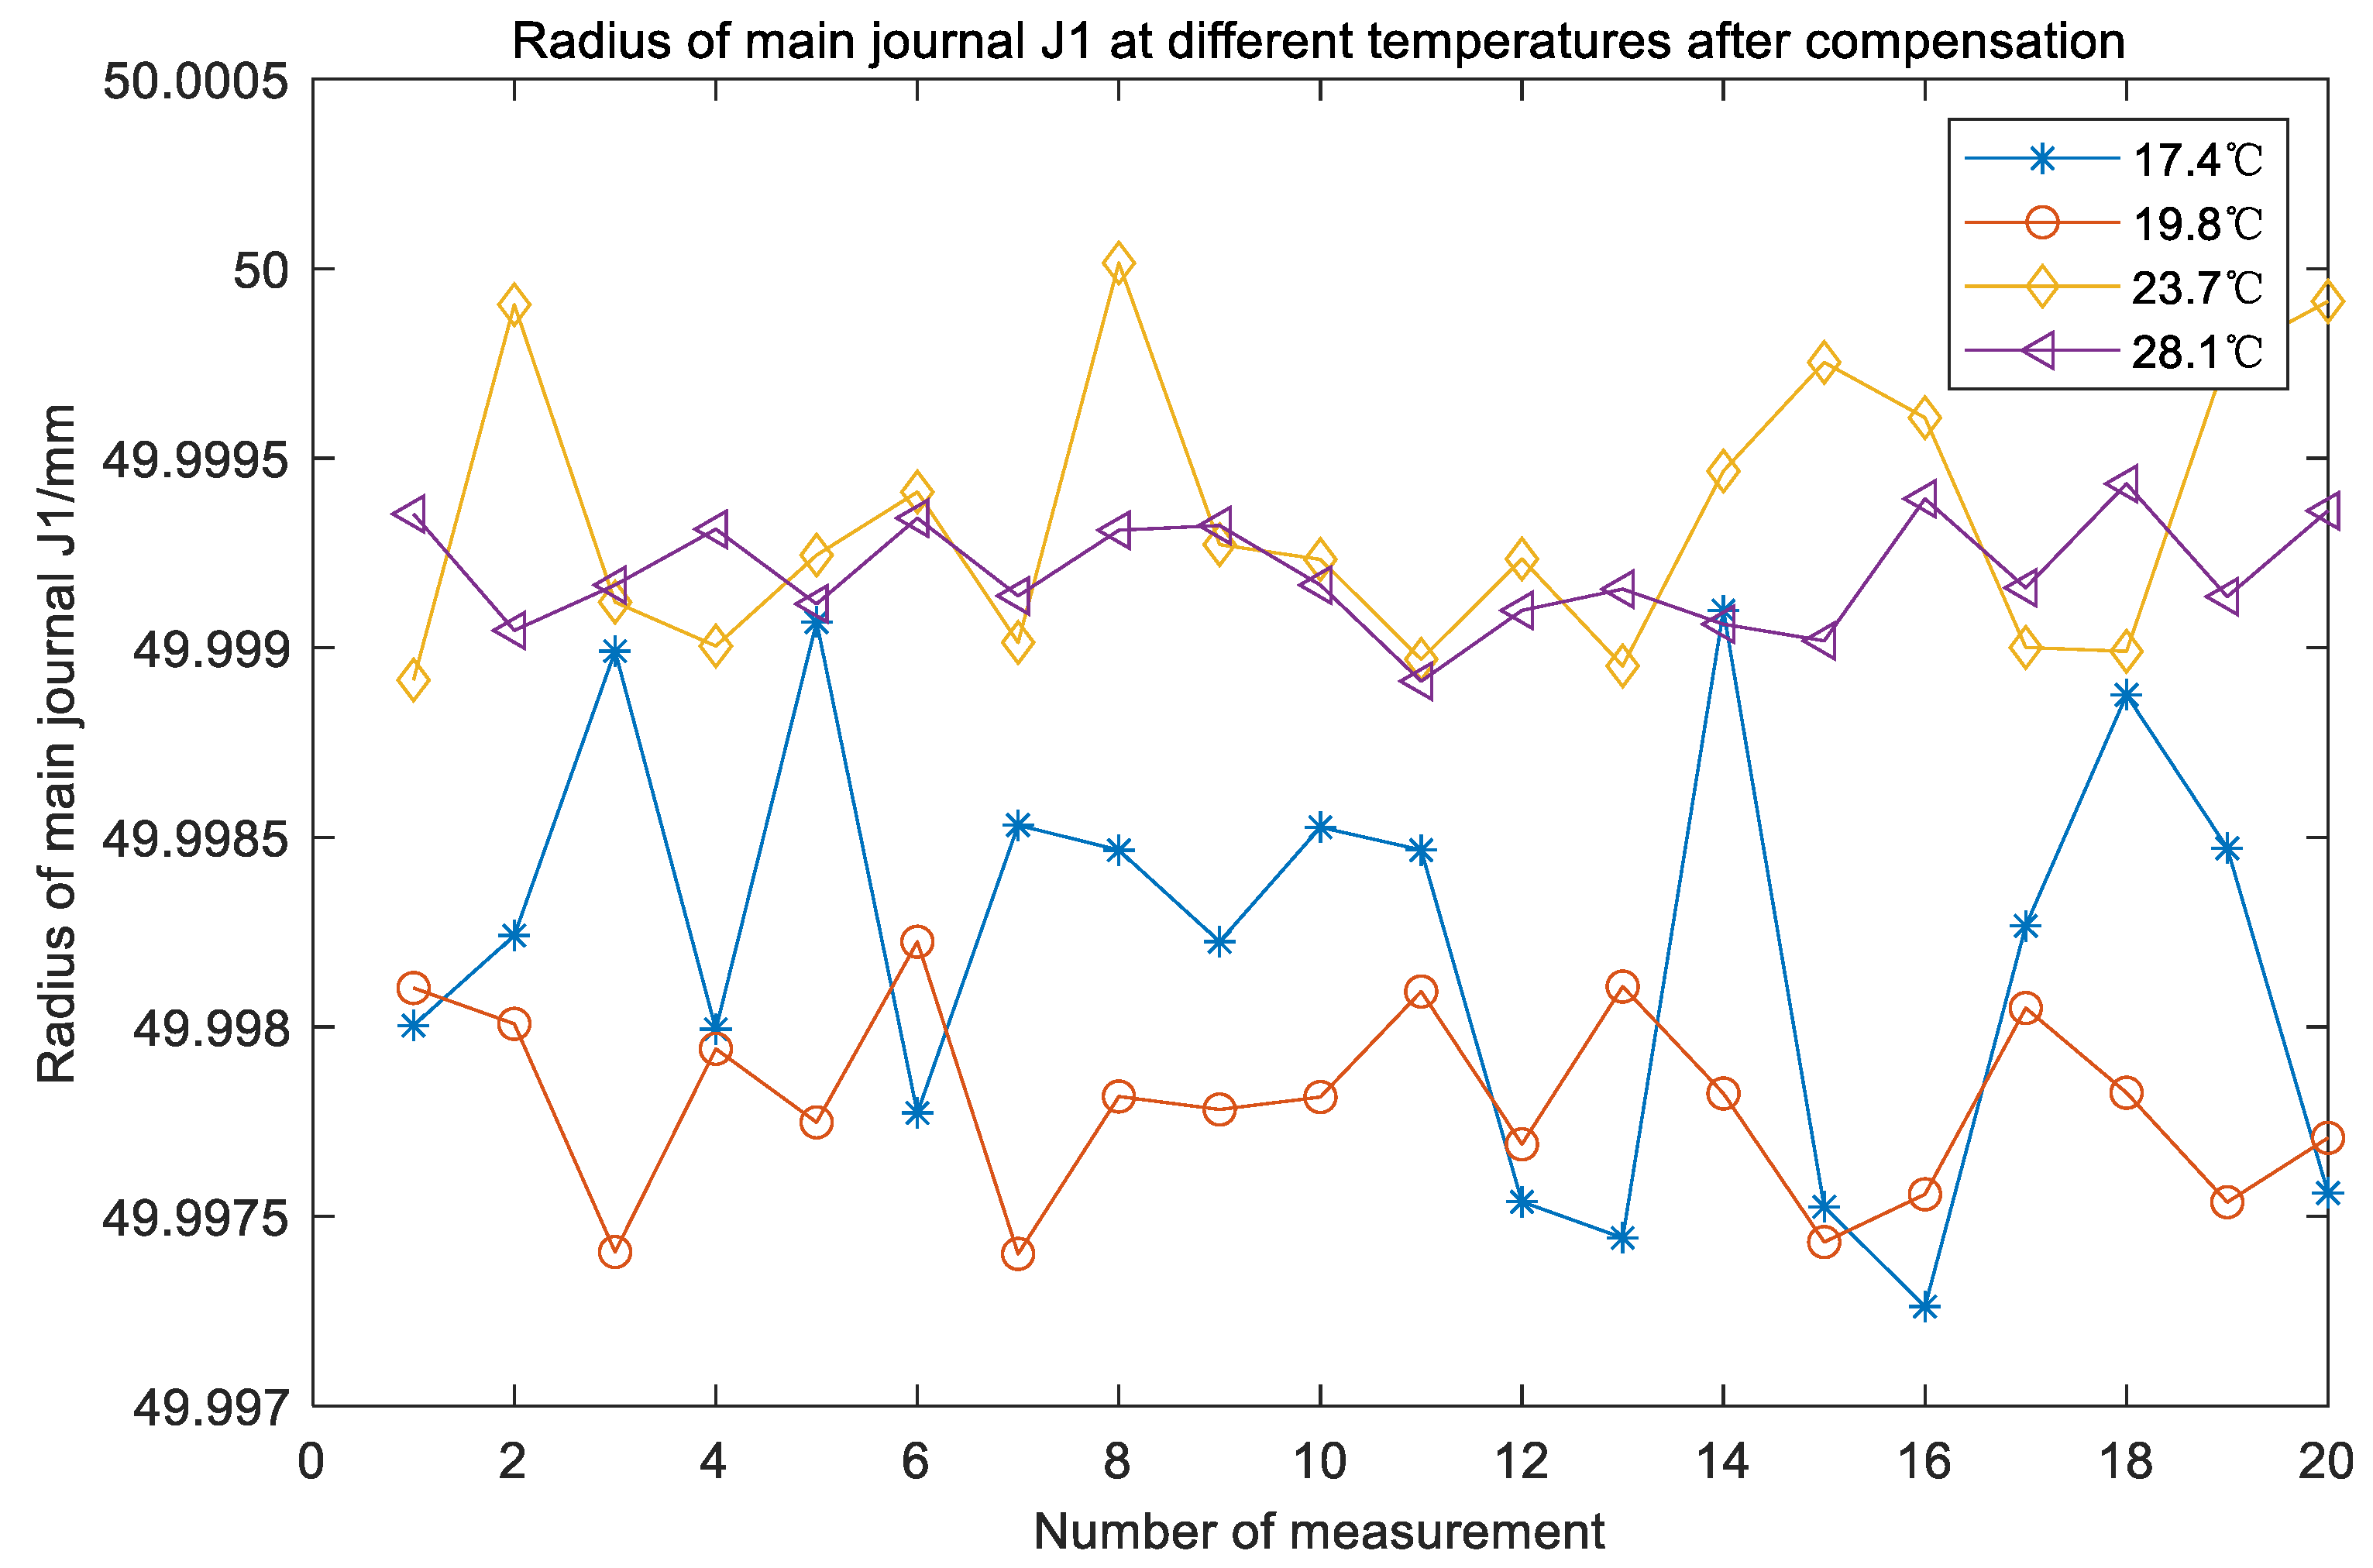
4.2. Validation of Temperature Compensation

In order to verify the feasibility of the temperature compensation of the crankshaft measuring machine proposed in this paper, the laboratory crankshaft measuring instrument RD-QZ-201890 was used for experimental testing. The experimental platform is shown in Figure 11.
An experiment was carried out according to the temperature compensation method mentioned in Section 3. To improve the accuracy of the measurement system, 20 repeated measurements at 4 different temperatures were performed on the crankshaft measuring machine. The main purpose is to get temperature compensation value of calibration part and workpiece to be measured. The materials used for the crankshaft and calibration part are all 45# steel, and the thermal expansion coefficient is 11.59 × 10⁻⁶/°C. The error Δ can be obtained according to Formula (6). In this way, the compensated part diameter can be obtained.
The same workpiece was repeatedly measured at different temperatures, and it was found that the radius of the same workpiece showed a large range of dimensional changes. Take the crankshaft main journal J1 as an example. Part of the measurement results are shown in Table 2. The measured radius before temperature compensation is shown in Figure 12. And the measured radius after temperature compensation is shown in Figure 13.
Before temperature compensation, it can be found that the radius value of the main journal J1 measured at different temperatures is different. Obviously, affected by temperature, the error range of the measured value with the same workpiece is relatively large at different temperatures. When the ambient temperature is 17.4 °C, the measured value of crankshaft main journal J1 radius is smallest, which is 49.9744 mm. When ambient temperature is 28.1 °C, the measured value of crankshaft main journal J1 radius is biggest, which is the maximum value 49.9900 mm. The error range is 0.0156 mm. After temperature compensation, measured radius value range is 49.9972 mm~50 mm. The error range is significantly reduced, that is 0.0028 mm. The measurement fluctuation is relatively small, and it is closer to the radius value of the main journal J1.
On this measuring machine, the crankshaft main journal and connecting rod journal are measured at the same time. So this temperature compensation method is applicable to all main journals and connecting rod journals of the crankshaft. The deviation values before and after temperature compensation are shown in Figure 14.
In Figure 14, the polyline with ‘*’ is the measurement value at different temperatures before temperature compensation, and the polyline with ‘o’ is the measurement result after temperature compensation. Obviously, the residual error decreased from −0.0282 mm ~ +0.0018 mm before temperature compensation to −0.0058 mm ~ −0.0008 mm after temperature compensation. Regardless of the ambient temperature, crankshaft temperature just off the production line and calibration part temperature, the measurement results are basically the same. The effectiveness of the method is proved.

5. Conclusions

The method does not require additional hardware circuit compensation, and only needs to perform temperature characteristic compensation experiments on the used displacement sensor in advance to improve the influence of temperature on the measurement performance of the displacement sensor. On this basis, this technical solution can be directly applied to the production line conditions, because the possible influence of the production environment’s temperature on the calibration parts and crankshaft has been fully considered, and the compensation formulas at different temperatures have been given. This method hardly increases the cost, and the compensation effect is also very obvious.
Aiming at the problem that the displacement sensor in the crankshaft measurement system is affected by temperature, this paper proposes an improved dragonfly algorithm optimized BP neural network to compensate for LVDT, and combines the advantages of elite decision-making and dragonfly algorithm to solve the BP neural network. The weights and thresholds are optimized globally, which reduces the system error of the BP neural network and improves the accuracy. Experiments verify the effectiveness of IDA-BP for LVDT in temperature compensation.
According to the ambient temperature of the crankshaft online measurement system, a temperature compensation method is proposed. In the actual measurement, environmental temperature and equipment temperature changes are taken into consideration. During the measurement process, it is not affected by the workshop environment to ensure measurement accuracy. After temperature compensation, the radius of the crankshaft journal is closer to the standard value. This method is also suitable for the measurement of other shaft parts.

Author Contributions

Conceive, methodology, and structure of this paper, T.G., X.Q. and P.L.; Resources, P.L.; Supervision, X.Q. and P.L.; Writing—original draft preparation, T.G.; Software, T.G.; Performance evaluation, T.G.; Writing—review and editing, T.G. and X.Q.; All authors have read and agreed to the published version of the manuscript.

Funding

This research was funded by the Key R&D Project of Jiangsu Province, under the grant number BE20160034.

Institutional Review Board Statement

Not Applicable.

Informed Consent Statement

Not Applicable.

Data Availability Statement

Not Applicable.

Conflicts of Interest

The authors declare no conflict of interest.

References

  1. Liu, Z.-W.; Zhao, S.-J.; Zhao, F.-Q. Situation Analysis and Development Strategy of China’s Automotive Parts Industry. Sci. Technol. Manag. Res. 2016, 36, 104–108, 156. [Google Scholar]
  2. Guo, H. Design and Research of Automatic Detection System for Crankshaft of Vehicle Engine; Xi’an University of Technology: Xi’an, China, 2017. [Google Scholar]
  3. Fang, J.-G.; Hu, C.-H.; Pang, C.-T. Development and Application of Precision Coordinate Measuring Technology. Aeronaut. Manuf. Technol. 2015, 7, 38–41. [Google Scholar]
  4. Dall’Aglio, C. Apparatus and Methods for Measuring the Pins Diameter of a Crankshaft at the Place of Grinding. Available online: https://patents.google.com/patent/US6931749B2/en (accessed on 14 August 2021).
  5. Marcotuli, V.; Marelli, S.; Casartelli, R.; Scaccabarozzi, D.; Saggin, B.; Tarabini, M. Compensation of Temperature Effects on an Automatic System for Diameter Measurement. In Proceedings of the 2020 IEEE International Workshop on Metrology for Industry 4.0 & IoT, Roma, Italy, 3–5 June 2020; pp. 283–287. [Google Scholar]
  6. Zhu, H.-T.; Wang, K.; Wang, Z.-Y. Temperature Effect on Rail Gauge Measurement Error and its Compensation Method When Using Track Inspection Instrument. Railw. Stand. Des. 2014, 58, 21–24. [Google Scholar]
  7. Das, S.; Das, D.P.; Behera, S.K. Enhancing the linearity of LVDT by two-stage functional link artificial neural network with high accuracy and precision. In Proceedings of the 2013 IEEE 8th Conference on Industrial Electronics and Applications (ICIEA), Melbourne, VIC, Australia, 19–21 June 2013; IEEE: Melbourne, Australia, 2013; pp. 1358–1363. [Google Scholar]
  8. Chen, G.; Zhang, B.; Liu, P.; Ding, H. An Adaptive Analog Circuit for LVDT‘s Nanometer Measurement Without Losing Sensitivity and Range. IEEE Sens. J. 2015, 15, 2248–2254. [Google Scholar] [CrossRef]
  9. Petchmaneelumka, W.; Koodtalang, W.; Riewruja, V. Simple Technique for Linear-Range Extension of Linear Variable Differential Transformer. IEEE Sens. J. 2019, 19, 5045–5052. [Google Scholar] [CrossRef]
  10. Pramanik, C.; Islam, T.; Saha, H. Temperature compensation of piezoresistive micro-machined porous silicon pressure sensor by ANN—ScienceDirect. Microelectron. Reliab. 2006, 46, 343–351. [Google Scholar] [CrossRef]
  11. Ma, C.; Zhao, L.; Mei, X.; Shi, H.; Yang, J. Thermal error compensation of high-speed spindle system based on a modified BP neural network. Int. J. Adv. Manuf. Technol. 2017, 89, 3071–3085. [Google Scholar] [CrossRef]
  12. Wu, J.; Cheng, Y.-M.; Liu, C.; Lee, I.-K.; Cha, J.-S.; Huang, W.-L. A BP Neural Network Based on Improved PSO for Increasing Current Efficiency of Copper Electrowinning. J. Electr. Eng. Technol. 2021, 16, 1297–1304. [Google Scholar] [CrossRef]
  13. Zhu, C.; Zhang, J.; Liu, Y.; Ma, D.; Li, M.; Xiang, B. Comparison of GA-BP and PSO-BP neural network models with initial BP model for rainfall-induced landslides risk assessment in regional scale: A case study in Sichuan, China. Nat. Hazards 2020, 100, 173–204. [Google Scholar] [CrossRef]
  14. Gu, P.; Zhu, C.M.; Wu, Y.Y.; Mura, A. Energy Consumption Prediction Model of SiCp/Al Composite in Grinding Based on PSO-BP Neural Network. Solid State Phenom. 2020, 305, 163–168. [Google Scholar] [CrossRef]
  15. Mirjalili, S. Dragonfly algorithm: A new meta-heuristic optimization technique for solving single-objective, discrete, and multi-objective problems. Neural Comput. Appl. 2016, 27, 1053–1073. [Google Scholar] [CrossRef]
  16. Yasen, M.; Al-Madi, N.; Obeid, N. Optimizing Neural Networks using Dragonfly Algorithm for Medical Prediction. In Proceedings of the 2018 8th International Conference on Computer Science and Information Technology (CSIT), Amman, Jordan, 11–12 July 2018; IEEE: Amman, Jordan, 2018; pp. 71–76. [Google Scholar]
  17. Zhu, Z.-D. Principle of Temperature Compensation and its Application in Detecting Appliances between Inter-working Procedure. Tool Eng. 2008, 42, 95–98. [Google Scholar]
  18. Yang, S.-X. Research on Thermal Expansion of Mechanical Parts. Ph.D. Thesis, Hefei University of Technology, Hefei, China, 2017. [Google Scholar]
  19. Rolling Bearings—Tolerances—Part 2: Measuring and Gauging Principles and Methods(ISO 1132-2:2001); International Standards Organization: Geneva, Switzerland, 2001.
  20. Meraihi, Y.; Ramdane-Cherif, A.; Acheli, D.; Mahseur, M. Dragonfly algorithm: A comprehensive review and applications. Neural Comput. Appl. 2020, 1–22. [Google Scholar] [CrossRef]
  21. Rahman, C.M.; Rashid, T.A. Dragonfly Algorithm and Its Applications in Applied Science Survey. Comput. Intell. Neurosci. 2019, 2019, 9293617. [Google Scholar] [CrossRef] [PubMed]
  22. Eberhart, R.; Kennedy, J. A new optimizer using particle swarm theory. In Proceedings of the MHS’95, Sixth International Symposium on Micro Machine and Human Science, Nagoya, Japan, 4–6 October 1995; IEEE: Nagoya, Japan, 1995; pp. 39–43. [Google Scholar]
Figure 1. Temperature compensation block diagram.
Applsci 11 07558 g001
Figure 2. Flow chart of the temperature compensation for crankshaft measurement.
Applsci 11 07558 g002
Figure 3. LVDT sensors arrangement of crankshaft.
Applsci 11 07558 g003
Figure 4. Structure of Calibration part.
Applsci 11 07558 g004
Figure 5. Structure of BP neural network.
Applsci 11 07558 g005
Figure 6. Flowchart of IDA-BP model.
Applsci 11 07558 g006
Figure 7. Prediction based on IDA-BP.
Applsci 11 07558 g007
Figure 8. Prediction based on BP.
Applsci 11 07558 g008
Figure 9. Prediction based on PSO-BP.
Applsci 11 07558 g009
Figure 10. Residual error comparison of three models.
Applsci 11 07558 g010
Figure 11. Crankshaft measuring machine.
Applsci 11 07558 g011
Figure 12. Measured radius before temperature compensation.
Applsci 11 07558 g012
Figure 13. Measured radius after temperature compensation.
Applsci 11 07558 g013
Figure 14. The deviation value measured before and after temperature compensation (* is deviation before compensation, o is deviation after compensation).
Applsci 11 07558 g014
Table 1. Comparison of the three models.
AlgorithmBPPSO-BPIDA-BP
MSE398.5531118.95483.6031
RMSE19.963810.90669.1435
Residual error/mV3.24681.39440.6930
Table 2. Part measurement data of main journal J1 at different temperatures /mm.
Temperature17.4 °C19.8 °C23.7 °C28.1 °C
149.975049.978249.984649.9895
249.976349.977649.985149.9898
349.976249.977749.984849.9897
449.975149.977949.985449.9898
549.976149.978149.984549.9897
649.975849.978349.985549.9897
749.976649.978149.985249.9896
849.976049.977949.985549.9895
949.976349.978249.984749.9895
1049.976149.978049.984949.9894
Publisher’s Note: MDPI stays neutral with regard to jurisdictional claims in published maps and institutional affiliations.

