Article

Synchrotron X-ray Irradiation of a Rat’s Head Model: Monte Carlo Study of Chromatic Gel Dosimetry

1
Department of Biotechnology Engineering, Ben Gurion University of the Negev, Beer-Sheva 84105, Israel
2
Radiotherapy Department, Institute of Oncology, Soroka University Medical Center, Beer-Sheva 84100, Israel
3
Department of Nuclear Engineering, Ben Gurion University of the Negev, Beer-Sheva 84105, Israel
*
Author to whom correspondence should be addressed.
Appl. Sci. 2021, 11(16), 7389; https://doi.org/10.3390/app11167389
Submission received: 26 July 2021 / Revised: 9 August 2021 / Accepted: 9 August 2021 / Published: 11 August 2021
(This article belongs to the Special Issue Synchrotron Radiation for Medical Applications)

Abstract

:
Accurate treatment planning in radiotherapy essentially decreases damage to healthy tissue surrounding the tumor. Due to plans to use a direct, highly collimated, narrow beam with high intensity to treat small area tumors, researchers have studied microbeam radiation therapy extensively. Using a synchrotron beam as the radiation source may help to limit damage, but treatment planning using computerized simulations and dosimetry is still necessary to achieve optimal results. For this purpose, PDA-gel dosimeters were developed and their sensitivity around a 150 keV induced synchrotron X-ray radiation beam was examined via Monte Carlo simulations using the EGS5 code system. The microbeam development is now at the animal study stage. In this study, we simulate the irradiation of a rat’s brain. The simulation results obtained spectra for two types of PDA-gel dosimeters that were compared with the spectrum obtained in a modelized brain tumor of a rat. Additionally, percentage depth dose curves were calculated for the brain tissue and the two gels. Correction equations for the dosimeters were obtained from the dose-difference plots. For further references, these equations can be used to calculate the actual dose in a brain tumor in a rat. The Monte Carlo simulations demonstrate that PDA-gel dosimeters can be used for treatment planning using synchrotron irradiations.

1. Introduction

Three-dimensional (3D) dosimetry is increasingly used in radiation therapy because it can expand our knowledge regarding the dose distribution of high-energy radiation in the human body. Such information can help improve treatment planning accuracy and decrease the damage to the healthy cells surrounding a tumor.
For this reason, scholars and practitioners are devoting increasing attention to polymer gel dosimeters, which have the unique ability to record in 3D irradiated doses in the energy range of medical treatments. Polymer gel dosimeters are based on crosslinking monomers in a gel matrix via radiation-induced polymerization, forming a polymer with different physical or chemical properties in the irradiated area, thereby recording the dose distribution in that area [1]. Various polymer gel-type dosimeters are being studied and developed, including the standard polyacrylamide-based dosimeters (PAG, or the commercially available name BANG®) [2,3]. These dosimeters consist of the co-monomers acrylamide and N,N’-methylene-bis-acrylamide (Bis) dispersed in an aqueous gelatin matrix. The main disadvantage of PAG dosimeters is the need to avoid oxygen contamination of the solution during their preparation, i.e., they cannot be prepared in normal atmospheric conditions [4]. Another disadvantage of PAG dosimeters and others is that their analysis requires MRI imaging. This has led to the development of chromatic gel dosimeters that are prepared easily and can be analyzed using optical techniques. In a previous study, a polydiacetylene-based gel dosimeter was characterized and examined as a tool for dose calculations in medical treatment planning [5]. The polydiacetylene-based gel dosimeter was examined using a 160 kV X-ray beam [5]. The colorless monomeric diacetylenes polymerize via a radiation-induced topotactic 1,4-addition mechanism to form the conjugated, linear-backbone, blue polydiacetylene (PDA), which consists of alternating triple and double bonds (yne-ene motif, –C=C–C≡C–) [6]. Polydiacetylene exists in two phases—the blue phase and the auto-fluorescent (emission peak around 650 nm) red phase that can be achieved with further stimulation such as heat, excess radiation, changes in the chemical environment, etc. A schematic drawing of the three phases of PDA is shown in Figure 1. The two absorbance peaks for the blue phase are positioned at 590 nm (vibronic) and 650 nm (excitonic), and for the red phase the peaks are positioned at 500 nm (vibronic) and 550 nm (excitonic) [7]. The intensity of the absorbance is proportional to the irradiated dose. This unique property of PDA enables analysis of the absorbed dose using absorbance and fluorescence techniques, as opposed to with other dosimeters. Diacetylenes embedded in a water-equivalent gel matrix can then show the dose distribution in 3D as an equivalent for soft-tissue materials.
Monte Carlo (MC) simulations can further verify this distribution. This technique aims to simulate the dose distribution in matter using individual interaction probabilities [8]. Radiation transport of an individual particle inside a defined medium MC simulation is based on random variables and the tracking of that particle with a large number of histories. MC methods provide knowledge about the physics and the interaction of particles (including photons) in the matter [9]. A Monte Carlo simulation code system contains four main components: (1) The cross-section data for all the processes that are being considered in the simulation, (2) the algorithm used for the transport of the particles, (3) a definition of the geometry of the problem and its physical parameters, and (4) the analysis of the output of the simulation [10]. Many user codes for beam therapy have been developed over the years, such as MCNP (Monte Carlo N-Particle transport code, the basis for neutron, photon, and electron transport code) [11], ETRAN (the electron transport code) [12], and the widely used codes EGS5 and EGSnrc (the electron gamma shower, for simulating radiation transport in accelerators and patients) [13,14]. In radiotherapy dosimetry, MC simulations are used in treatment planning to verify methods and dose distributions [15].

2. Materials and Methods

This study verified the suitability of PDA gel dosimeters for clinical references irradiated with a synchrotron using the EGS5 code system [13] for MC simulations. The simulated spectra and the percentage depth dose (PDD) curves for the PDA gel dosimeters PhytagelTM matrix and the less scattering RTV silicone rubber matrix were compared with the spectrum and PDD curve in a simulated cylindrical model of rat brain tissue.

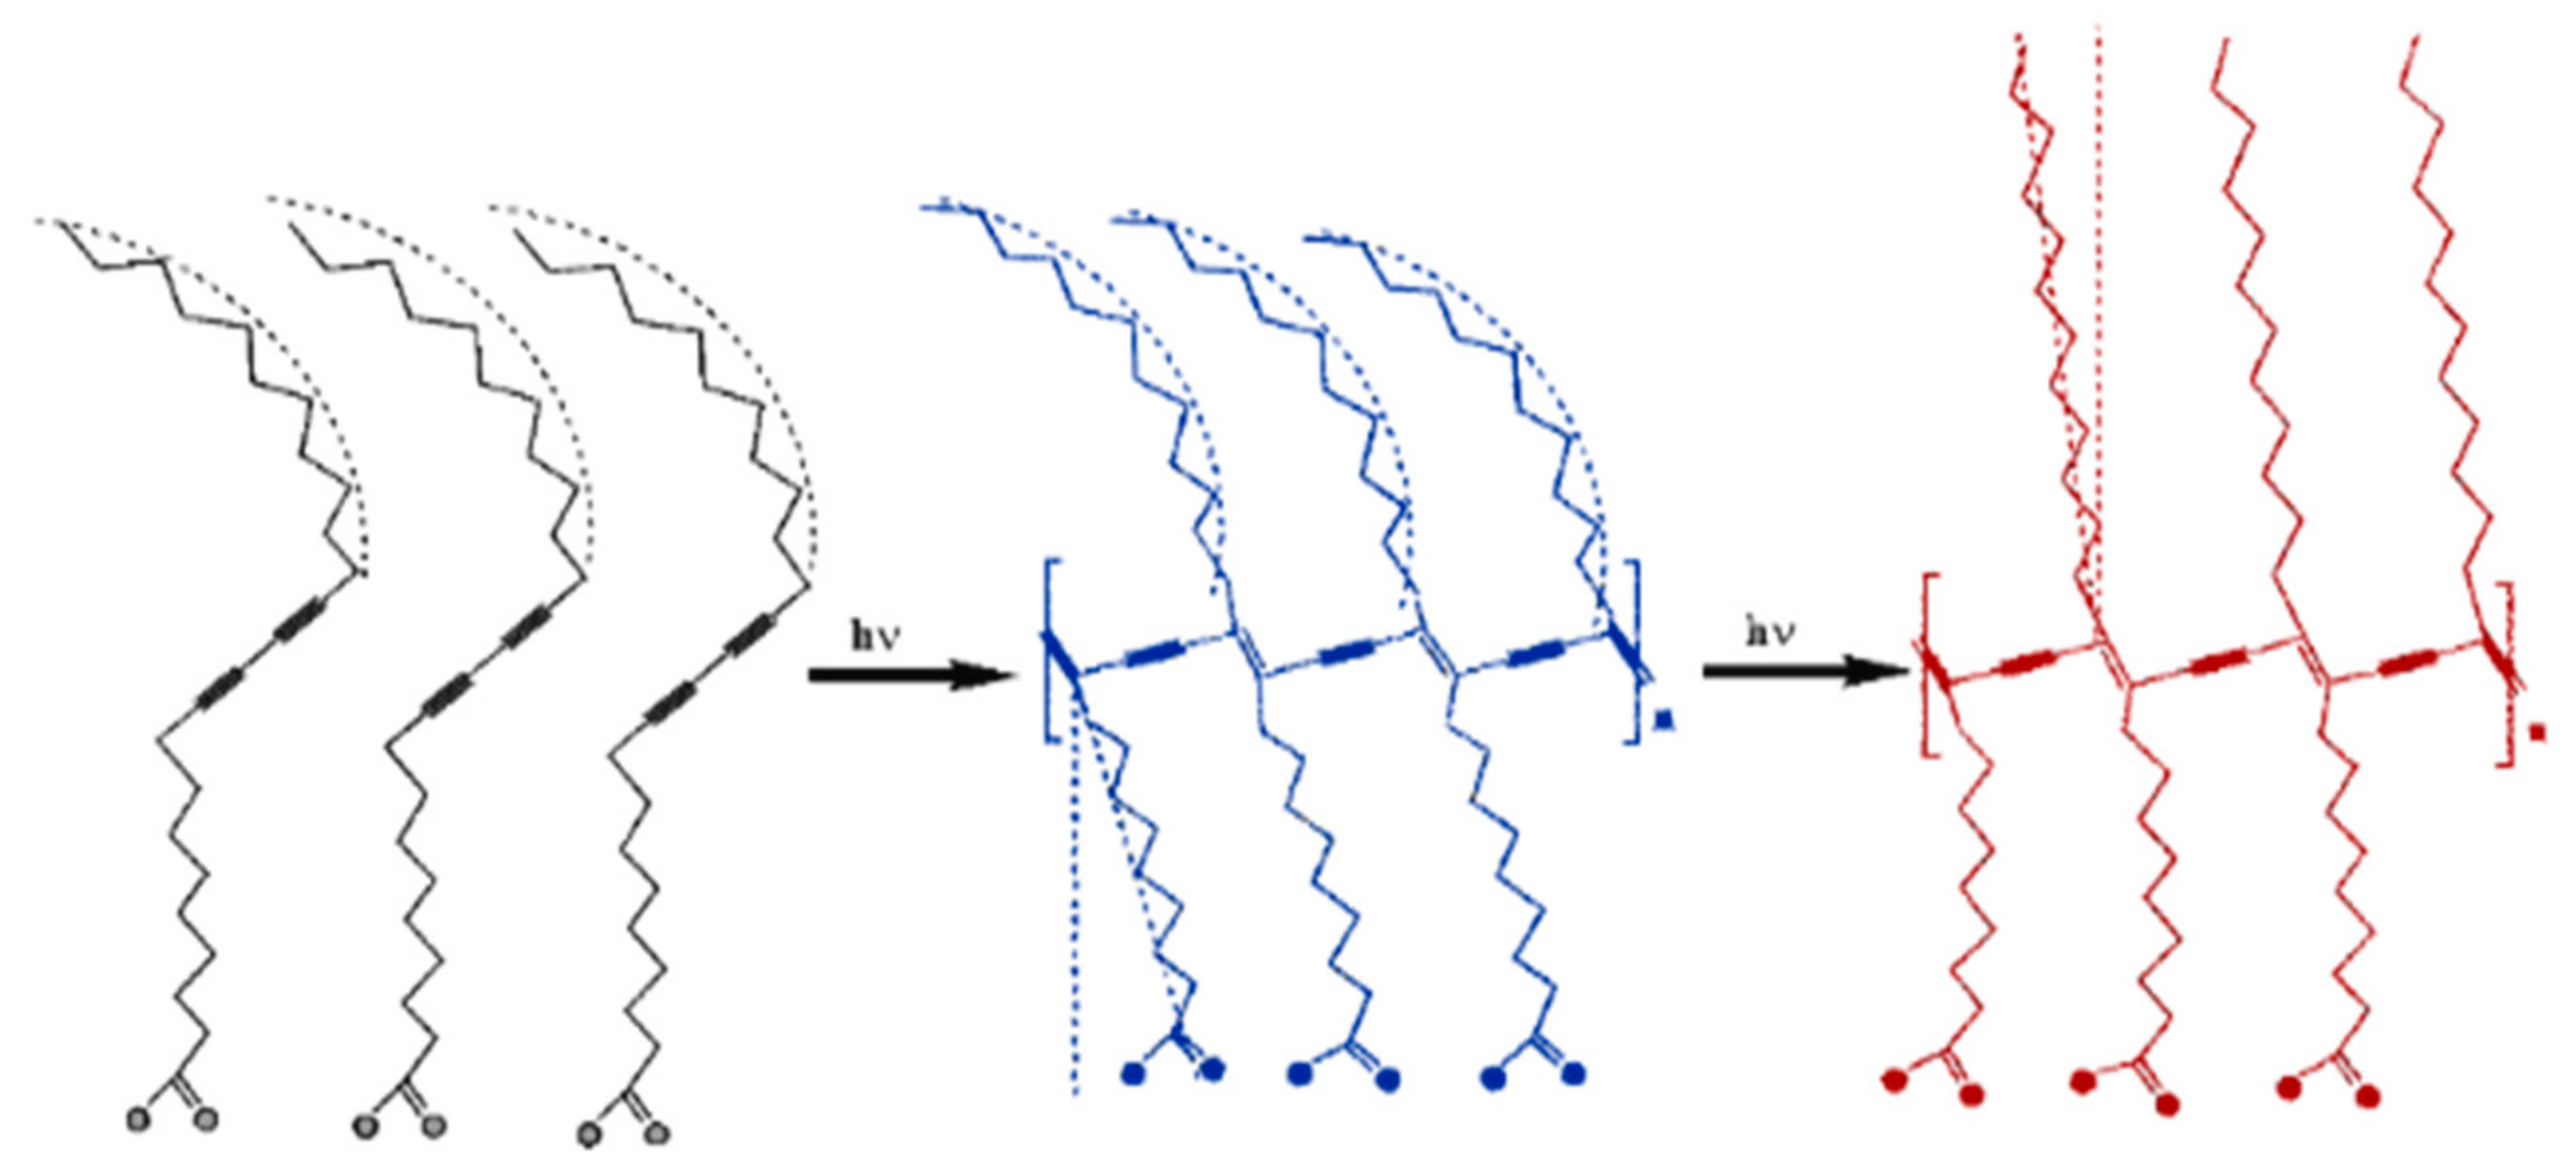
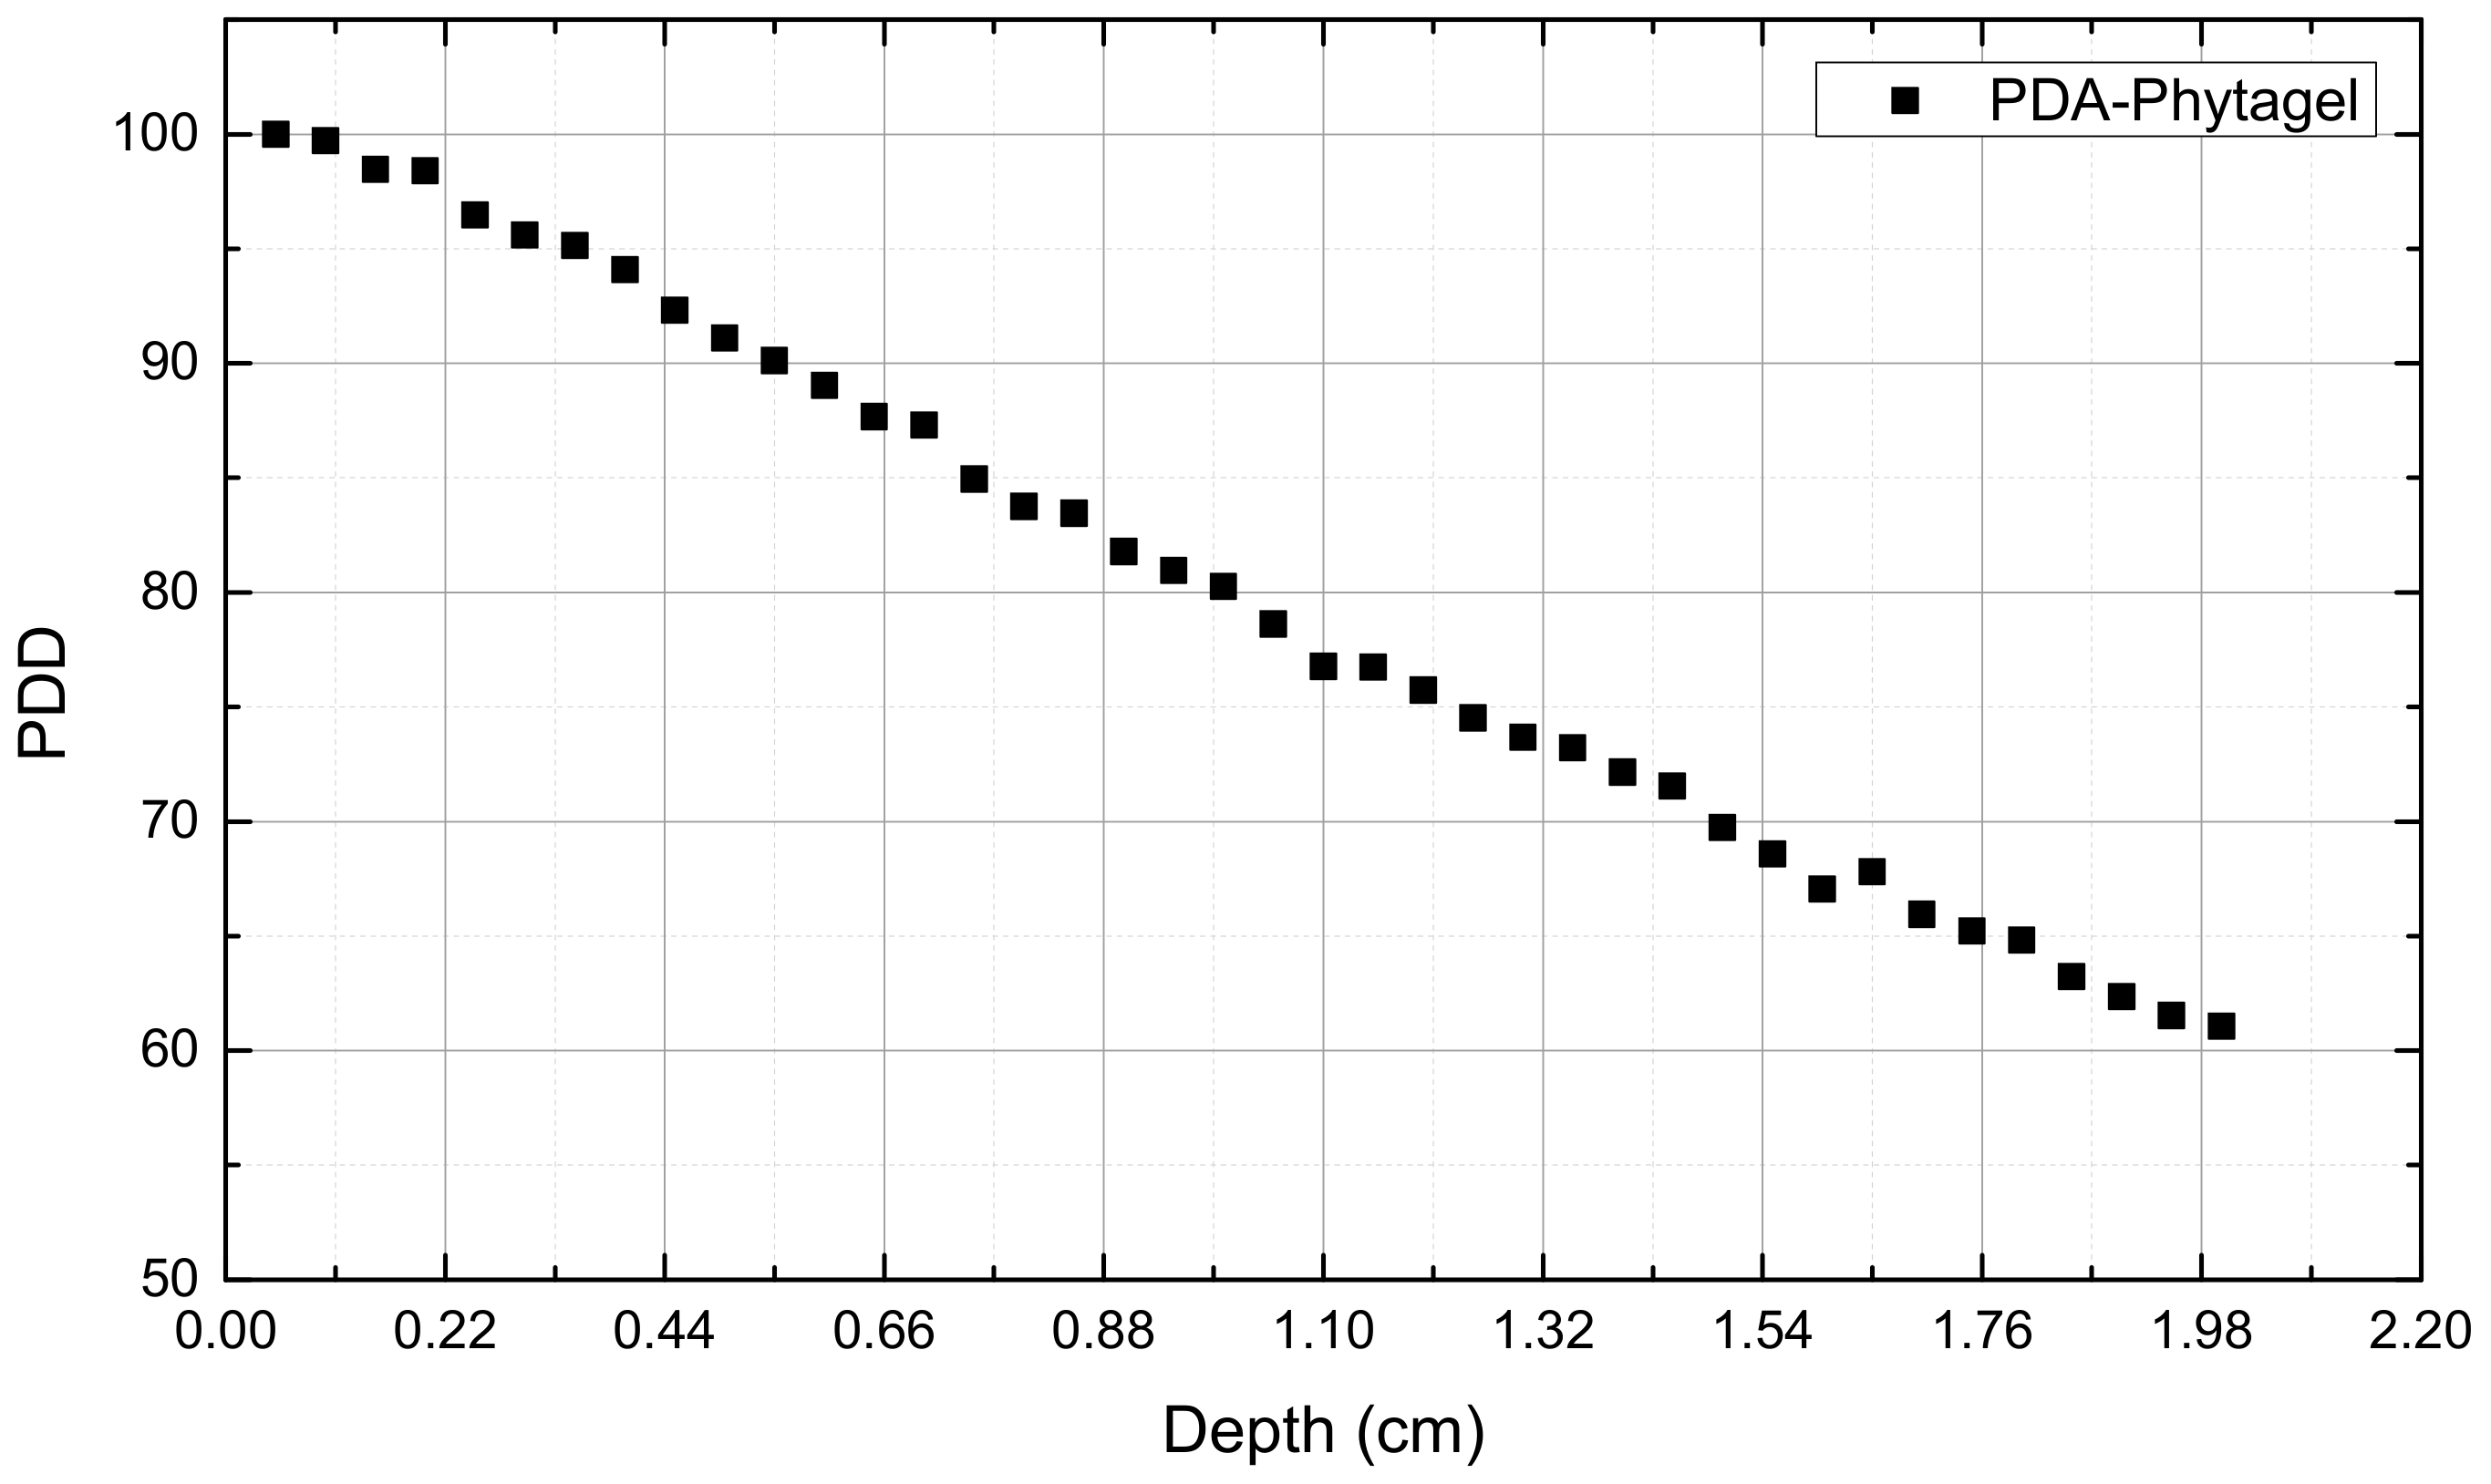
2.1. PDA-Phytagel Dosimeter Properties

PDA-Phytagel dosimeter consists of 10,12-pentacosadiynoic acid (PCDA) and 10,12-tricosadiynoic acid (TRCDA) embedded in PhytagelTM matrix (a natural polysaccharide derived from carrageenan and gellan gum). This gel matrix contains a small percentage of organic molecules and approximately 98% water, and it is therefore considered a soft-tissue equivalent material in radiology.

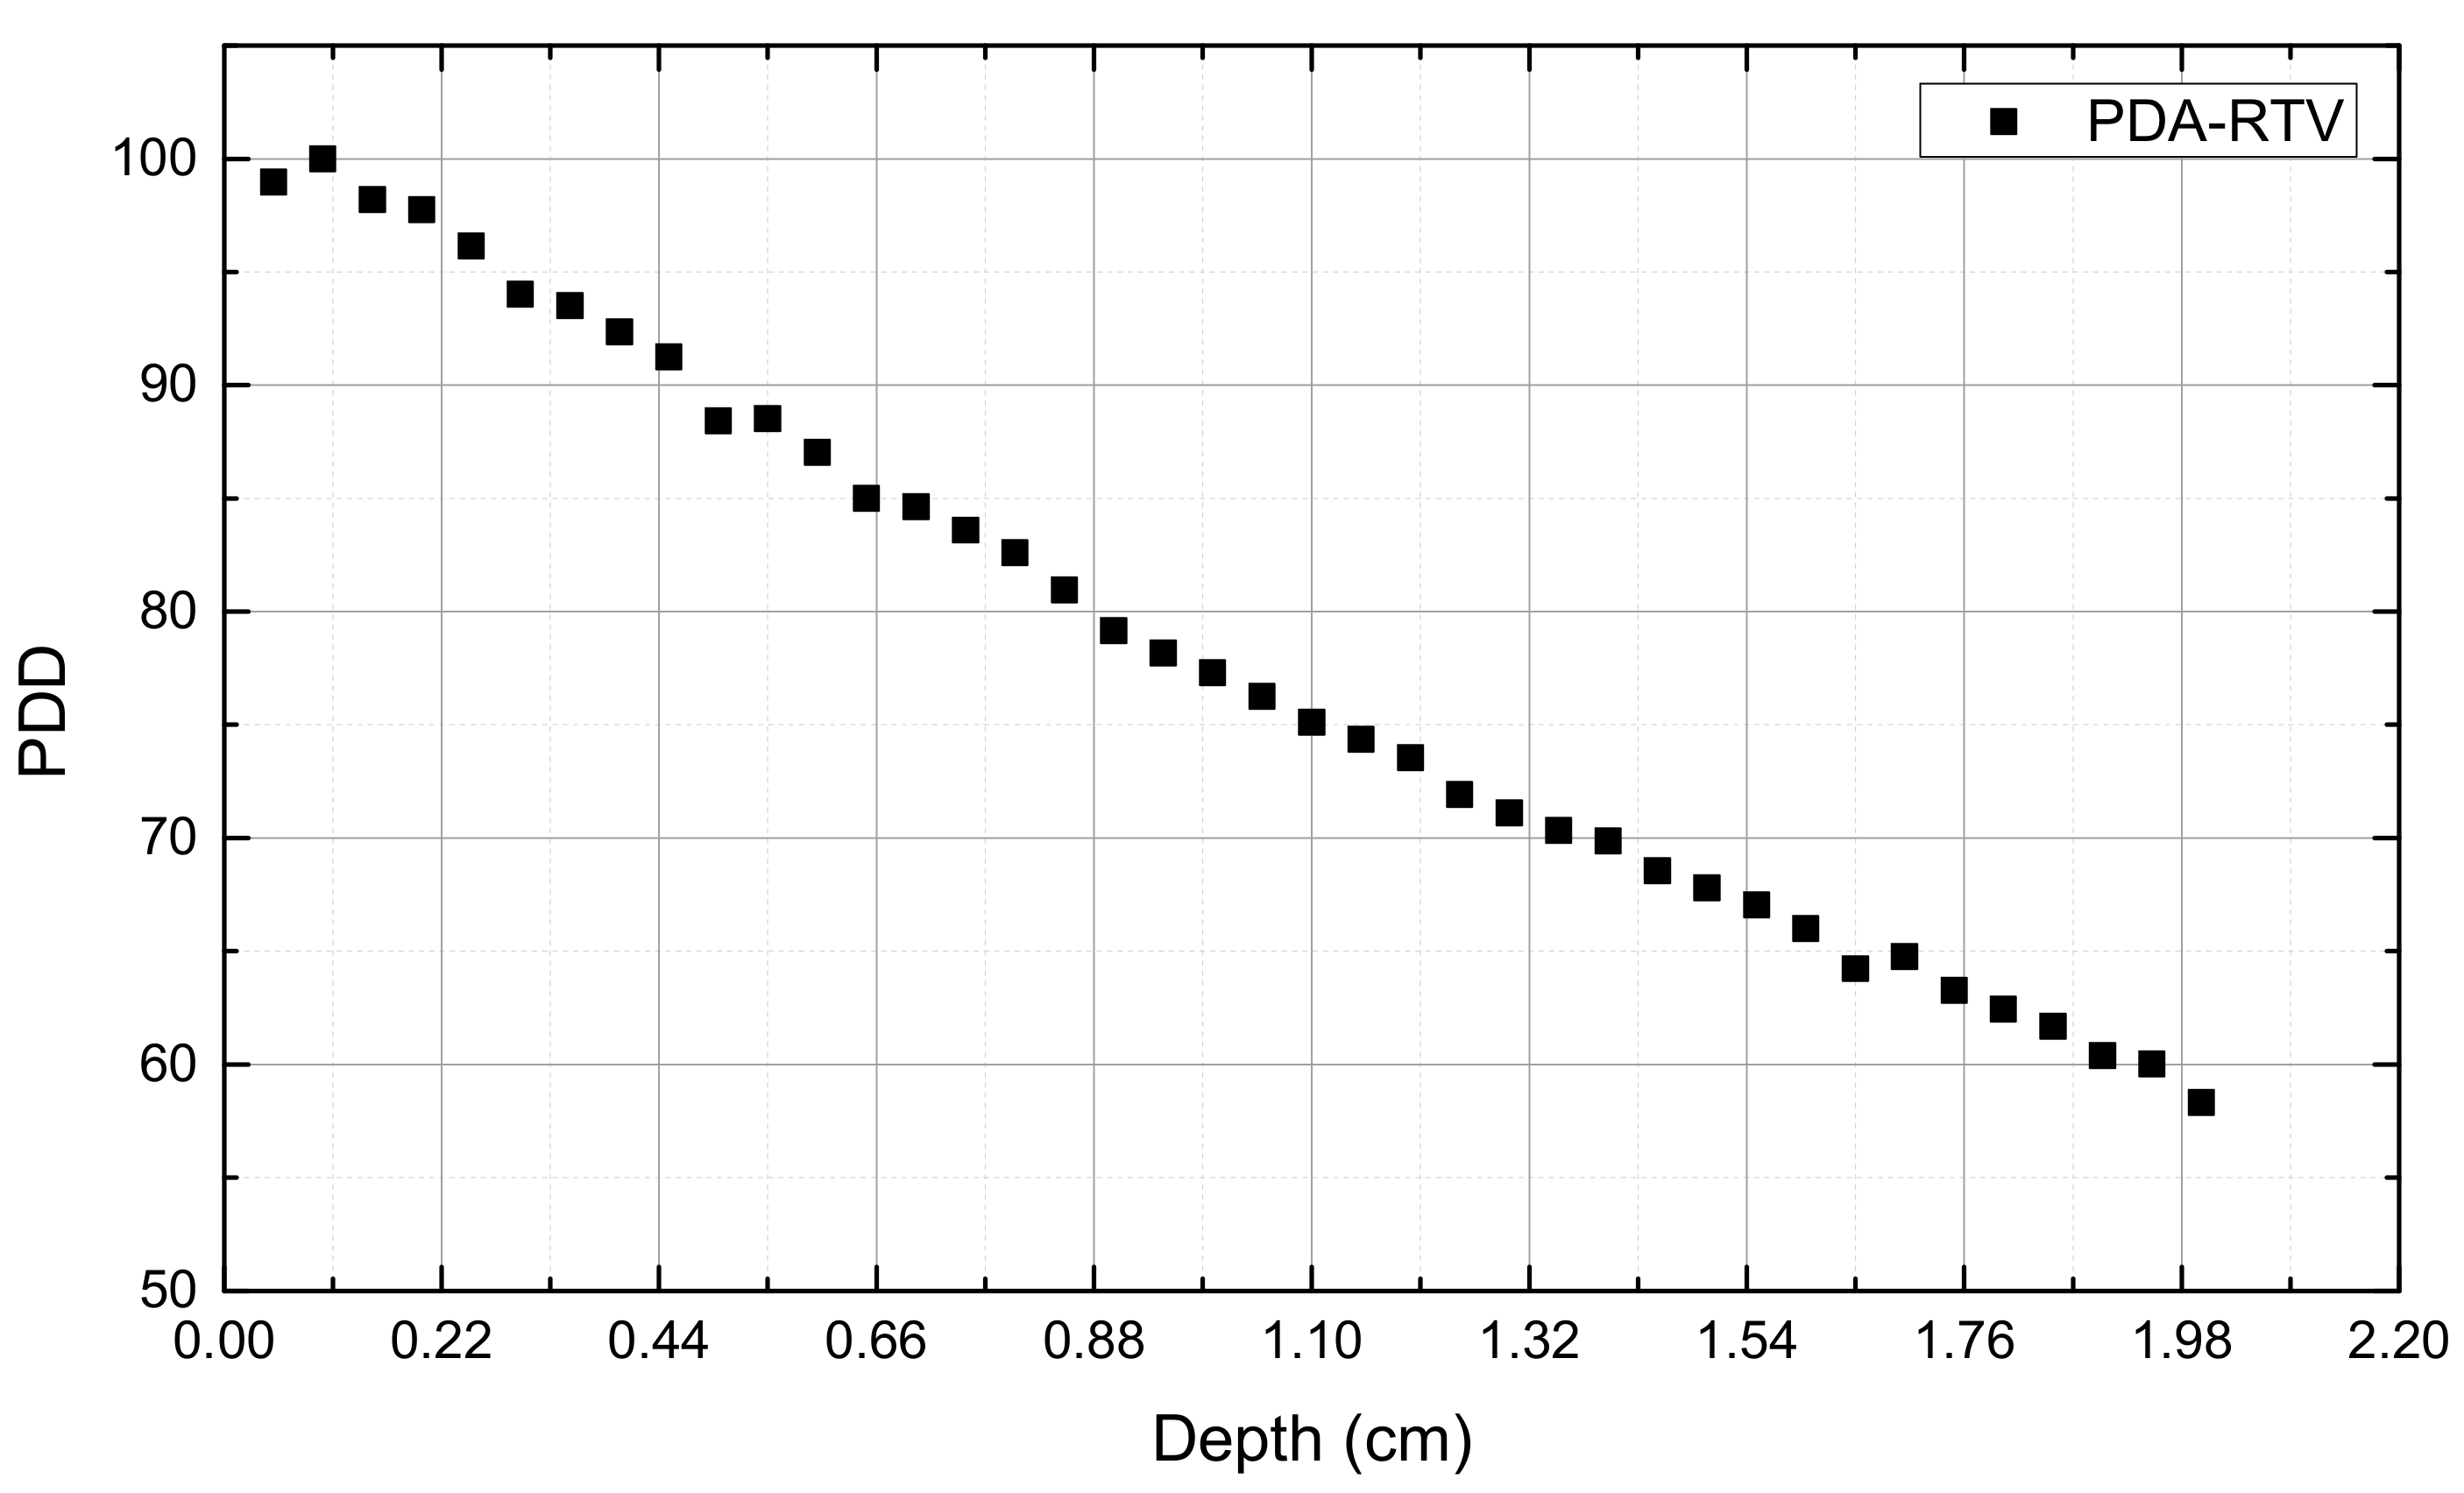
2.2. PDA-RTV Silicone Rubber Dosimeter Properties

RTV-615 silicone rubber is a two-component product that consists of elastomer and curing agent at a 9:1 ratio and is used in this study as the 3D gel matrix. PCDA and TRCDA are dispersed in the RTV matrix homogenously. Composition and densities of both PDA-Phytagel and PDA-RTV dosimeters are listed in Table 1.
Figure 2 and Figure 3 show samples of the PDA-Phytagel and PDA-RTV gel dosimeters, respectively, in the blue phase after irradiations with 6 MV X-ray, and in the red phase after the samples were heated. Irradiations were conducted at the Radiotherapy department, Soroka Medical Center, Beer Sheva, Israel, using a Varian, Clinac 2100 C/D DHX type medical LINAC (linear accelerator).

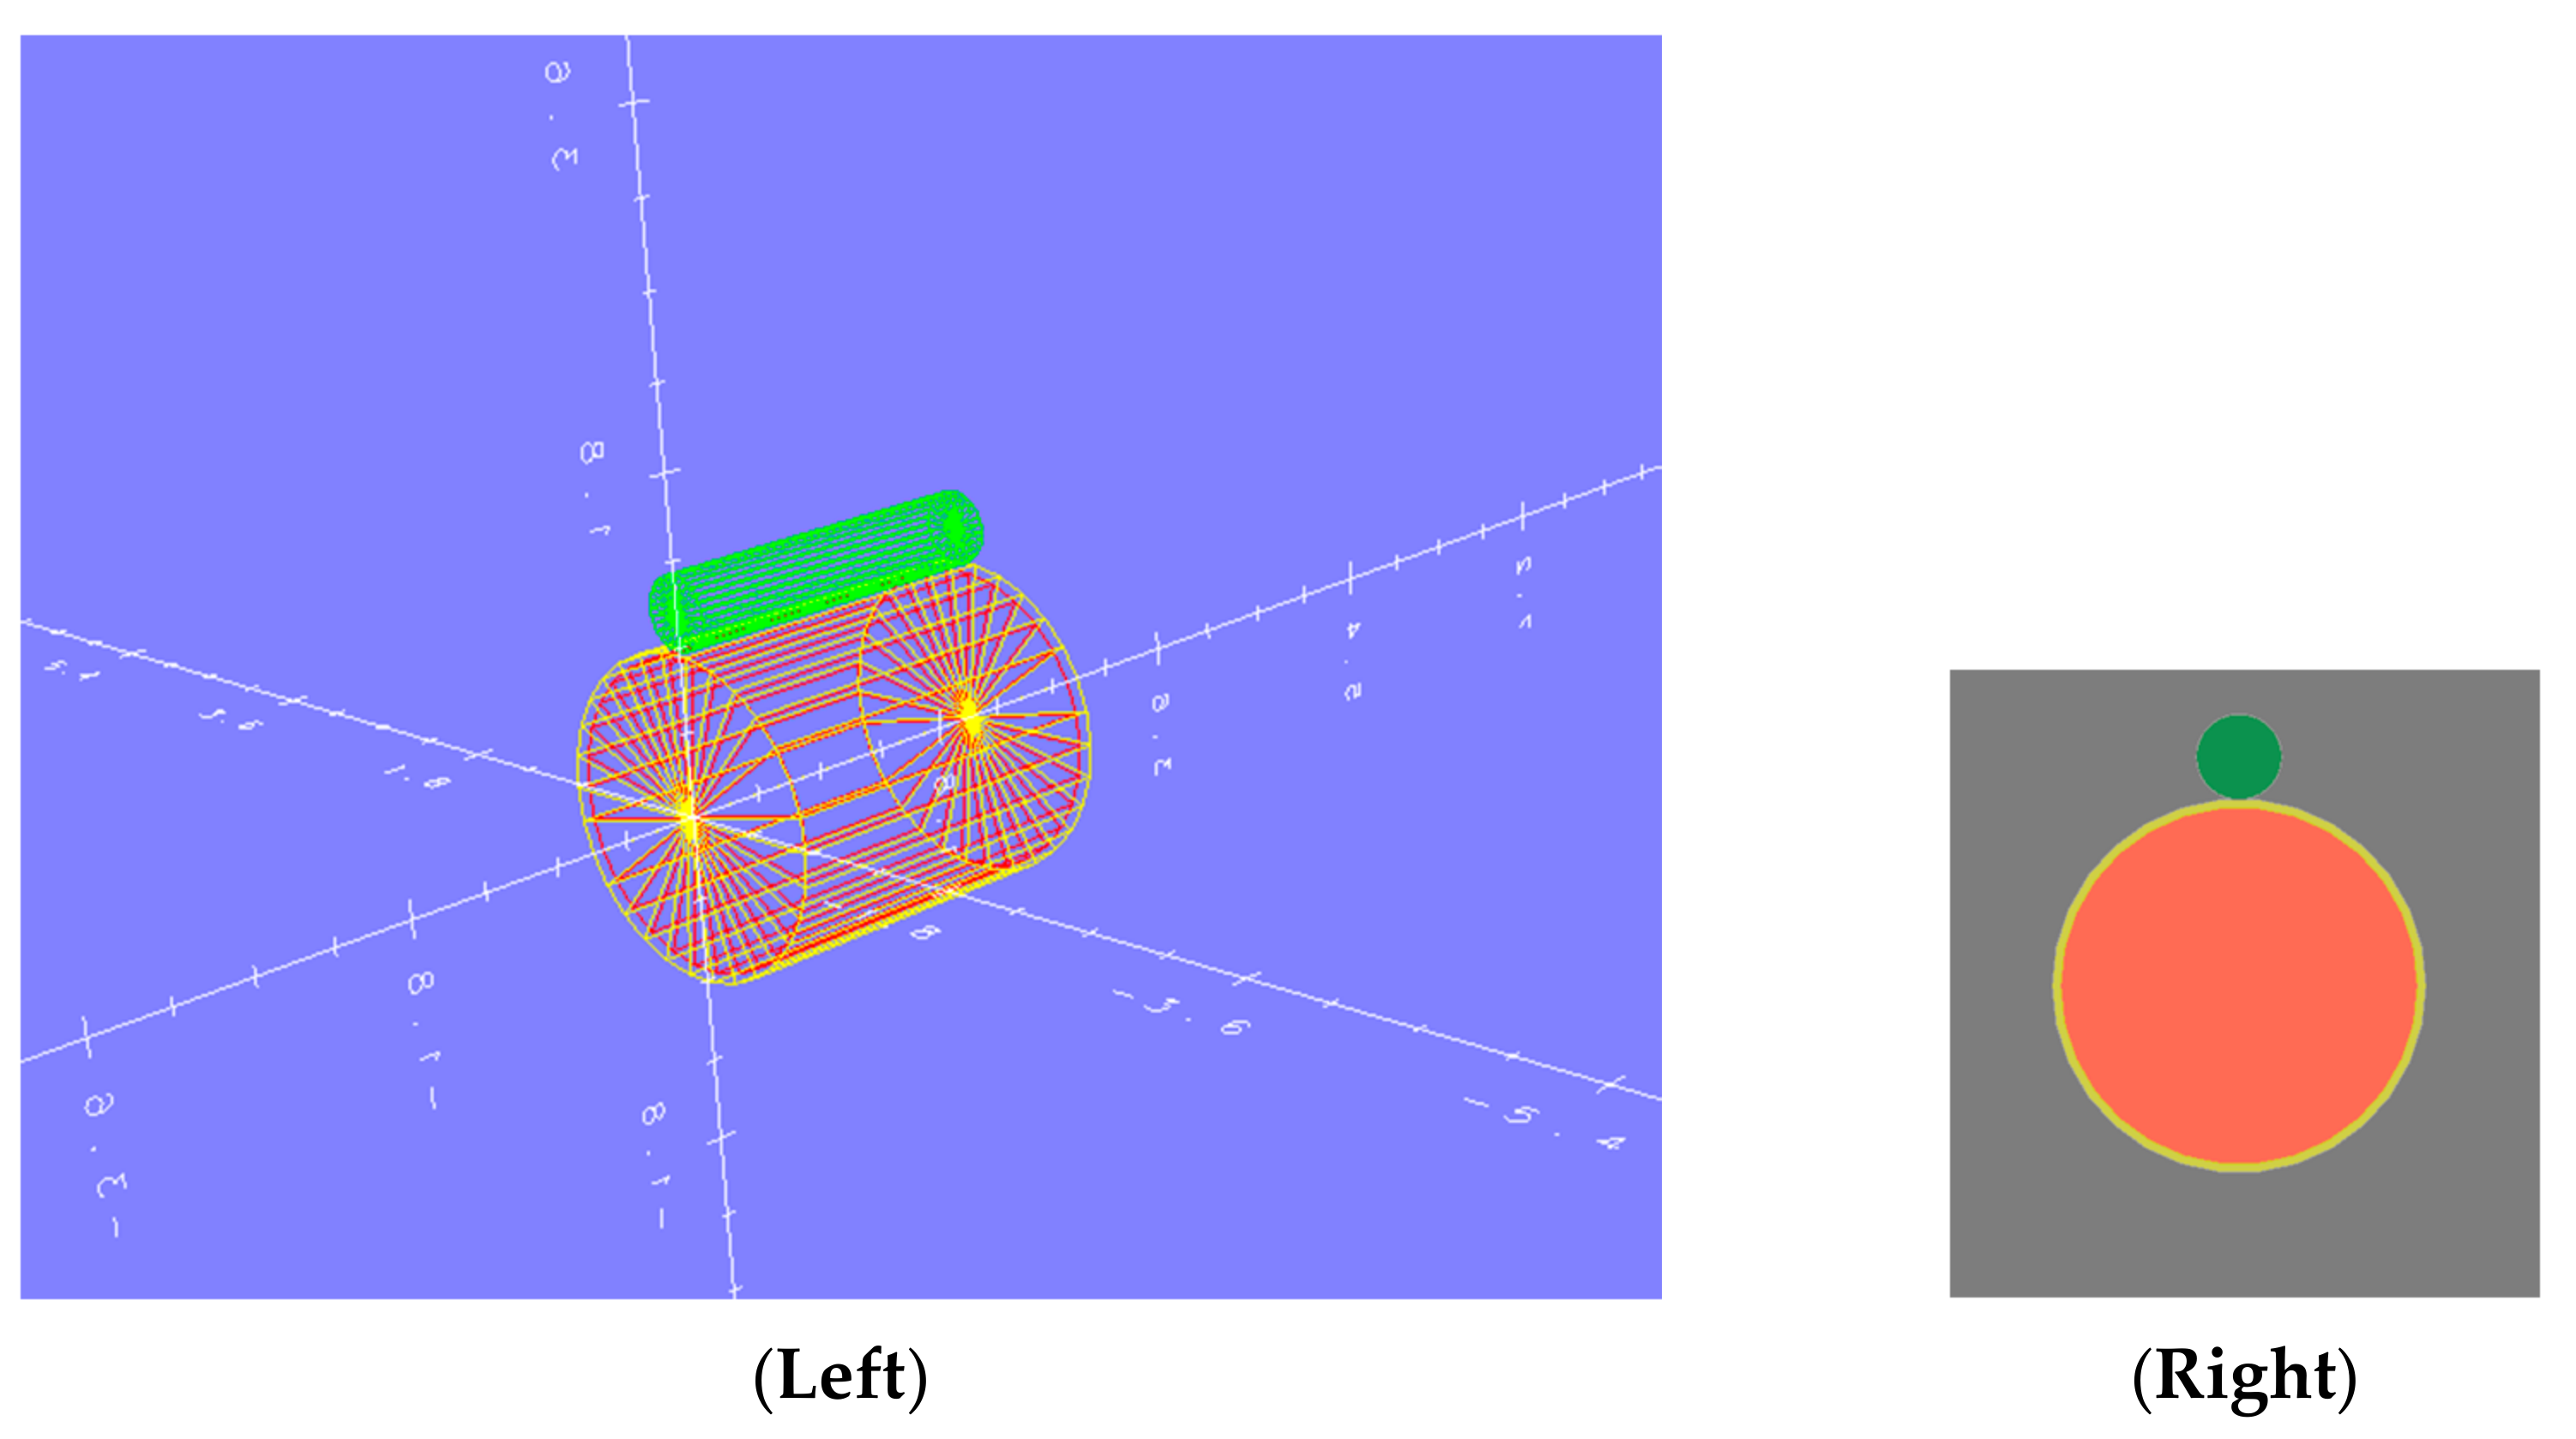
2.3. Rat’s Head Modeling and Geometry

The simulated model of a rat’s head contains three cylindrical modes: an inner cylinder of brain tissue (ρ = 1.03 gr/cm3), an outer cylinder of the skull surrounding the brain (ρ = 1.85 gr/cm3), and a cylindrical tumor/dosimeter (equivalent to the brain tissue) in contact with the skull, as depicted in Figure 4. The molecular amounts of the materials making up the brain tissue and skull were taken from previous research [16]. The dimensions of each body in the geometry are listed in Table 2 and are based on the study conducted by Gefen et al. [17]. In the simulations, the dose distribution in the tumor body was compared with the dosimeter, which was positioned at the same volume.

2.4. The Radiation Source

The X-ray beam produced at the NSLS-II synchrotron from the 27-ID-HEX beamline is the most suitable X-ray flux to treat animal tumors in research. The electron-storage-ring current energy is 3 GeV at 400 mA. The 27-ID-HEX beamline at NSLS-II synchrotron is a 4.3 Tesla wiggler line that produces very hard X-rays with critical energy of 35.91 keV and up to 200 keV photons [18]. In the simulations, random sampling of the energy distribution function was calculated based on the initial synchrotron X-ray spectrum shown in Figure 5, filtered with 0.25 mm of copper foil and 3.7 mm-thick piece of silicon. The narrow emittance of the beam was taken as parallel, with approximately 92% linear polarization [19]. The beam was directed toward the front base of the tumor body. The beam’s opening size was set at 2 mm by 2 mm. The radiation simulation cutoff was set at 1 keV for photons and 512 keV for electrons. Additionally, the simulation was set to run with 107 histories.

3. Results

The use of PDA-based gel dosimeters as a clinical reference system in synchrotron irradiations was examined using the EGS5 Monte Carlo code system. In the simulation, the percentage depth dose (PDD; the dose distribution as a function of the depth in the tissue) in a rat’s brain tumor was compared with the PDD of two types of PDA-gel dosimeters: PDA-Phytagel and PDA-RTV. For both dosimeters, the absorbed spectra demonstrated similar trends to the spectrum in the brain tumor. Figure 6 shows that the PDA-RTV dosimeter accords more closely with the brain’s spectrum relative to the PDA-Phytagel. This results from the molecular composition of the gel. The silicone atoms present in the PDA-RTV gel interact similarly to the elements present in the brain and skull tissue (i.e., sodium, magnesium, and calcium) since their elemental atomic numbers are similar. Additionally, the RTV matrix contains a larger amount of carbon than the PhytagelTM (two orders of magnitude greater than the amount of carbon in the brain). Accordingly, the molecular composition dictates the dose deposition nature of the tissue.
Furthermore, the PDD curves obtained in the simulation showed similar results. PDD curves are used by radiation physicists as a tool to improve understanding of the dose distribution in the irradiated organ prior to the radiation treatment. Thus, damage caused by the radiation is decreased. Calculating PDD curves of the dosimeters and comparing them with the PDD curve of the brain demonstrated the differences in the radiation behavior of each material. Figure 7 shows the PDD curve obtained for the rat’s brain, and the following figures, Figure 8 and Figure 9, show the PDD curves for the PDA-Phytagel and PDA-RTV dosimeters, respectively. The statistical error varies between 2 and 3% for all the PDD data. For each PDD curve, the doses were calculated for slices of 0.05 cm thickness up to 2 cm depth, using the volume of each slice, the density of the material, and the absorbed energy distribution per incident photon that was obtained via the simulation. The dose-difference plot between the brain and the PDA-Phytagel dosimeter is shown in Figure 10. The PDD curve of each dosimeter and the brain PDD curve were compared by subtraction of the two curves to obtain the dose corrections formula from the linear fit.
The dose difference linear fitting of the PDA-Phytagel-Brain is acceptable (R2 = 0.923), but it is relatively low when compared with the linear fitting dose of the PDA-RTV-Brain (R2 = 0.979), as shown in Figure 11. For both dose-difference plots, the difference between the PDD curves decreases as the depth of the material increases. This difference is due to the photoelectric effect and Compton scattering that are dominant in the energy range of the synchrotron irradiation, both of which are affected by the different atomic number of the materials comprising the Phytagel dosimeter and the brain (e.g., the difference in Z contributes to the different attenuation in each material).
Calculation of the dose in the brain from the measured dose in the gel at a certain depth using the PDA-Phytagel and PDA-RTV dosimeters can be accomplished using the linear fit equations. Calculation of the dose in the brain using the PDA-Phytagel dosimeter:
D real   =   D PDA - Phytagel   +   Δ D   =   D PDA - Phytagel 1.228   ×   10 13   ×   d depth   +   1.027   ×   10 13
The coefficients standard error is 6.7%.
Calculation of the dose in the brain using the PDA-RTV dosimeter:
D real   =   D PDA - RTV   +   Δ D   =   D PDA - RTV 5.837   ×   10 13   ×   d depth   +   2.136   ×   10 12
where D PDA - Phytagel and D PDA - RTV are the doses obtained by the dosimeters, and Δ D is the linear equation obtained in the dose-difference plots. The unit for all calculated doses is Gy per incident photons.
The coefficients standard error is 2.3%.

4. Conclusions

This study investigated the suitability of PDA-gel dosimeters for clinical references in irradiation via synchrotron beams using the EGS5 Monte Carlo user code, evaluating whether these dosimeters can be used in microbeam radiation therapy (MRT). The simulations obtained the spectra for the PDA-Phytagel and the PDA-RTV gel dosimeters, and we calculated their PDD curves. The spectra comparison ascertained the similarity of interactions between brain tissue and the PDA-RTV gel. Both PDD curves were compared with the PDD curve of a rat’s brain tissue, and the dose-difference plots were obtained. The correction equations were determined based on these plots. Using these equations, the real dose in the brain can be calculated using the PDA-gel dosimeters. Additionally, the PDA-RTV gel dosimeter was found to be more suitable for radiation treatment measurements than the PDA-Phytagel dosimeter, since it demonstrates the dose distribution and the absorbed spectrum in greater accordance with the rat’s brain tissue. Using the same simulation method to compare organs in the human body can further validate these results and ensure that PDA-gel dosimeters constitute a reliable technique in radiation treatment planning.

Author Contributions

Conceptualization, I.O.; methodology, A.B.; software, Y.P.W.; validation, I.O. and Y.K.; formal analysis, Y.P.W.; investigation, Y.P.W.; resources, I.O.; data curation, Y.P.W.; writing—original draft preparation, Y.P.W.; writing—review and editing, I.O.; visualization, Y.P.W.; supervision, I.O. and A.B. All authors have read and agreed to the published version of the manuscript.

Funding

This study is funded by the Ministry of Science and Technology of Israel.

Institutional Review Board Statement

Ethical review and approval were waived for this study, due to usage of computerize methods only.

Informed Consent Statement

Not applicable.

Acknowledgments

We thank Rebecca Wolpe for the language editing of this manuscript.

Conflicts of Interest

The authors declare no conflict of interest.

References

  1. Baldock, C.; De Deene, Y.; Doran, S.; Ibbott, G.; Jirasek, A.; Lepage, M.; McAuley, K.; Oldham, M.; Schreiner, L.J. Polymer gel dosimetry. Phys. Med. Biol. 2010, 55, R1–R63. [Google Scholar] [CrossRef] [PubMed]
  2. Maryanski, M.J.; Schulz, R.J.; Ibbott, G.S.; Gatenby, J.C.; Xie, J.; Horton, D.; Gore, J.C. Magnetic resonance imaging of radiation dose distributions using a polymer-gel dosimeter. Phys. Med. Biol. 1994, 39, 1437–1455. [Google Scholar] [CrossRef] [PubMed]
  3. Baldock, C. Review of gel dosimetry: A personal reflection. J. Phys. Conf. Ser. 2017, 777, 012029. [Google Scholar] [CrossRef]
  4. Venning, A.J.; Hill, B.; Brindha, S.; Healy, B.J.; Baldock, C. Investigation of the PAGAT polymer gel dosimeter using magnetic resonance imaging. Phys. Med. Biol. 2005, 50, 3875–3888. [Google Scholar] [CrossRef] [PubMed]
  5. Walg, Y.P.; Silveira, M.A.; Eafergan, N.; Krutman, Y.; Baffa, O.; Berman, A.; Orion, I. Characterization of novel polydiacetylene gel dosimeter for radiotherapy. Biomed. Phys. Eng. Express 2020, 6, 055017. [Google Scholar] [CrossRef] [PubMed]
  6. Lifshitz, Y.; Golan, Y.; Konovalov, O.; Berman, A. Structural transitions in polydiacetylene langmuir films. Langmuir 2009, 25, 4469–4477. [Google Scholar] [CrossRef] [PubMed]
  7. Upcher, A.; Lifshitz, Y.; Zeiri, L.; Golan, Y.; Berman, A. Effect of metal cations on polydiacetylene langmuir films. Langmuir 2012, 28, 4248–4258. [Google Scholar] [CrossRef] [PubMed]
  8. Khan, F.M.; Gibbons, J.P.; Sperduto, P.W. Khan’s Treatment Planning in Radiation Oncology, 4th ed.; Wolters Kluwer: Alfen am Rhein, The Netherlands, 2016. [Google Scholar]
  9. Chetty, I.J.; Curran, B.; Cygler, J.E.; Demarco, J.J.; Ezzell, G.; Faddegon, B.A.; Kawrakow, I.; Keall, P.J.; Liu, H.; Ma, C.-M.C.; et al. Report of the AAPM task group No. 105: Issues associated with clinical implementation of monte carlo-based photon and electron external beam treatment planning. Med. Phys. 2007, 34, 4818–4853. [Google Scholar] [CrossRef] [PubMed]
  10. Rogers, D.W.O.; Bielajew, A.F.; Kase, K.R. Monte Carlo Techniques of Electron and Photon Transport for Radiation Dosimetry; Bjarngard, B.E., Attix, F.H., Eds.; National Research Council of Canada: Ottawa, ON, Canada, 1990. [Google Scholar]
  11. Briesmeister, J.f. MCNP-A General Monte Carlo Code for Neutron and Photon Transport; Los Alamos National Laboratory: Los Alamos, NM, USA, 1993. [Google Scholar]
  12. Seltzer, S.M. Electron-photon monte carlo calculations: The ETRAN Code. Appl. Radiat. Isot. Int. J. Radiat. Appl. Instrum. Part A 1991, 42, 917–941. [Google Scholar] [CrossRef]
  13. Hirayama, H.; Namito, Y.; Nelson, W.R.; Bielajew, A.F.; Wilderman, S.J.; Michigan, U. The EGS5 Code System, in KEK Reports; United States Department of Energy: Washington, DC, USA, 2005. [Google Scholar]
  14. Chandrasekaran, S.; Shanmugasundaram, S. Optimization of variance reduction techniques used in EGSnrc monte carlo codes. J. Med. Phys. 2018, 43, 185–194. [Google Scholar] [CrossRef] [PubMed]
  15. Jabbari, K. Review of fast Monte Carlo codes for dose calculation in radiation therapy treatment planning. J. Med. Signals Sens. 2011, 1, 73–86. [Google Scholar] [CrossRef] [Green Version]
  16. Orion, I.; Rosenfeld, A.; Dilmanian, F.A.; Telang, F.; Ren, B.; Namito, Y. Monte Carlo simulation of dose distributions from a synchrotron-produced microplanar beam array using the EGS4 code system4. Phys. Med. Biol. 2000, 45, 2497–2508. [Google Scholar] [CrossRef] [PubMed] [Green Version]
  17. Gefen, A.; Gefen, N.; Zhu, Q.; Raghupathi, R.; Margulies, S.S. Age-dependent changes in material properties of the brain and braincase of the rat. J. Neurotrauma 2003, 20, 1163–1177. [Google Scholar] [CrossRef] [PubMed]
  18. Photon Sciences Division. High Energy Engineering X-ray Scattering (HEX) Facility. In Preliminary Design Report for the NSLS-II Project; National Synchrotron Light Source II (NSLS-II), Brookhaven National Laboratory: New York, NY, USA, 2018. [Google Scholar]
  19. Einfeld, D.; Stuck, D. Synchrotron radiation as an absolute standard source. Nucl. Instrum. Methods 1980, 172, 101–106. [Google Scholar] [CrossRef]
Figure 1. Schematic drawing of the 3 phases of PDA. From (left (black)): the monomeric molecules of DAs prior to irradiation; (blue): the blue phase of PDA polymerized by electromagnetic radiation; and on the (right (red)): the red phase of PDA [6].
Applsci 11 07389 g001
Figure 2. (left): PDA-Phytagel after 6 MV X-ray irradiation with absorbed dose of 20 Gy in reference conditions (field size 10 × 10 cm2, SSD 100 cm), the PDA is in its blue phase; (right): the sample after heating, the PDA turned red.
Applsci 11 07389 g002
Figure 3. PDA-RTV gel. (Left): Each well was irradiated with a 6 MV beam by different monitor unit doses; (right): the sample after heating and curing the gel to obtain transparency.
Applsci 11 07389 g003
Figure 4. (Left): The simulated model of a rat’s head containing three cylindrical bodies: an inner cylinder that represents the brain tissue (red), an outer cylinder that represents the skull surrounding the brain (yellow), and the cylindrical tumor/dosimeter (green). (Right): cross sectional view.
Applsci 11 07389 g004
Figure 5. The initial synchrotron X-ray spectrum that was used as the energy distribution function for random initial photon energy sampling.
Applsci 11 07389 g005
Figure 6. Absorbed photons spectra of the simulated brain (dashed blue line), the PDA-Phytagel dosimeter (black line), and the PDA-RTV dosimeter (red line).
Applsci 11 07389 g006
Figure 7. The simulation results for the PDD curve in the rat’s brain.
Applsci 11 07389 g007
Figure 8. The simulation results for the PDD curve of the PDA-Phytagel dosimeter.
Applsci 11 07389 g008
Figure 9. The simulation results for the PDD curve of the PDA-RTV dosimeter.
Applsci 11 07389 g009
Figure 10. Dose-difference (Gy per incident photons) plot between the brain and the PDA-Phytagel dosimeter achieved by the subtraction of both curves.
Applsci 11 07389 g010
Figure 11. Dose-difference (Gy per incident photons) plot between the brain and the PDA-RTV dosimeter achieved by the subtraction of both curves.
Applsci 11 07389 g011
Table 1. Molecular weight of the composition of PDA-Phytagel and PDA-RTV.
DosimeterComposition (%wt)Density (gr/cm3)
PDA-Phytagel H66.661.02
O33.27
C0.07
PDA-RTV H62.161.03
O5.41
C21.62
Si10.81
Table 2. Dimensions of the bodies in the geometry setup for the simulations.
Body ZoneRadius (cm)Length (cm)Thickness (cm)
Brain0.842.000.84
Skull0.882.080.04
Tumor/dosimeter0.202.000.20
Publisher’s Note: MDPI stays neutral with regard to jurisdictional claims in published maps and institutional affiliations.

