Article

Improving the Safe Operation of Platoon Lane Changing for Connected Automated Vehicles: A Novel Field-Driven Approach

1
School of Transportation, Southeast University, Nanjing 211189, China
2
Joint Institute on Internet of Mobility between SEU and UW-Madison, Southeast University, Nanjing 211189, China
3
Jiangsu Key Laboratory of Urban ITS, Southeast University, Nanjing 211189, China
*
Author to whom correspondence should be addressed.
Appl. Sci. 2021, 11(16), 7287; https://doi.org/10.3390/app11167287
Submission received: 19 July 2021 / Revised: 31 July 2021 / Accepted: 5 August 2021 / Published: 8 August 2021
(This article belongs to the Topic Intelligent Transportation Systems)

Abstract

:
Connected and automated vehicles (CAVs) platoons have been widely researched because of their efficiency advantages. However, most studies mainly focus on the stability control of platoon and there is a lack of in-depth consideration of platoon lane changing. In order to make up for this vacancy, this study focused on the dynamic gap in the platoon lane changing process. First, an intra-platoon potential field of vehicles in the platoon was established by combining the repulsive force under vehicle safety and the gravity inside the platoon, which can effectively characterize the risk distribution around vehicles. Second, the platoon lane changing process was designed and critical distances of platoon vehicles under different conflict situations were analyzed. Based on this, this study proposed a critical distance model of platoon lane changing. Furthermore, we also found that the critical distances for platoon lane changing were within an interval with upper and lower bounds, which was different from the minimum distance of non-platoon vehicles. Finally, experiments were conducted and the results showed that the proposed model could effectively represent the relationship between the distance between vehicles in the platoon and the motion state of the surrounding vehicles. Moreover, the proposed method could also be applied to the lane-changing maneuver of a self-organizing platoon at a strategic level in a CAVs system.

1. Introduction

With control and communication technology being applied to transportation systems, vehicular platoon driving has gradually become a new driving mode. Researchers generally believe that it can reduce pollutant emissions and improve transportation efficiency and safety. Compared with human driving, a connected and automated vehicles (CAVs) platoon can shorten the distance between vehicles and increase the capacity without the building of new roads [1]. In addition, platoon driving can improve efficiency by reducing their air resistance, and thereby improve energy consumption to achieve the goal of energy saving. In addition, in terms of system transportation and safety, platoon driving also has irreplaceable advantages.
The use of communication and digital development in vehicles and on the highway in the form of an intelligent vehicle/highway system is an approach that promises to realize real-time location awareness and information communication between vehicles, roadside facilities, and cloud platforms. Lane following and cruise control technologies of platoon driving were proposed. Liu et al. [2] proposed a coupling control method for path tracking and maintaining spacing based on a reference vector field. Kim [3] presented a novel approach for the longitudinal control of a truck platoon as the trucks move along a curved lane, as well as a straight line. Li et al. [4] proposed a novel platoon formation and optimization model by combining graph theory and safety potential field theory for CAVs under different vehicle distributions. However, to a certain extent, it is necessary to realize the large-scale horizontal and lane-changing maneuvers of a fully autonomous self-driving platoon [5].
The research into lane changing can be divided into the control level and the strategy level. The control level regards lane changing as a unified lateral navigation algorithm. The desired yaw rate is generated by the yaw angle tracking controller, and then the lane changing is implemented by manipulating the front wheel [6]. At the strategy level, the time and opportunity of lane changing are studied on the premise of avoiding vehicle collisions. This study mainly investigated platoon lane changing at the strategic level. Hsu [7,8] described three platoon lane changing (PLC) maneuvers for an entire platoon to change lanes with fixed spacing based on the split, lane changing, and join maneuvers. He also designed the leader and predecessor PLC maneuvers under the coordinated and noncoordinated platoon infrastructures in 2008. Keßler et al. [9] presented a control concept for the lane-changing maneuver of the complete platoon, which enables the following vehicles to track the path of their preceding vehicles based only on the relative position to the predecessor using onboard sensors. Li et al. [10] derived a safety region for the relative velocity between two platoons under four control laws, including leader law, join law, split law, and decelerate-to-change-lane law. By guaranteeing that the relative velocity between platoons remains in this region, high relative velocity impacts can be avoided. However, they studied lane changing from the perspective of a platoon as a whole without considering the feasibility of lane changing and the relationship between vehicles in the platoon.
In the research on non-platoon vehicle lane changing, the relationship between vehicles is well-considered and is worthy of reference. Schubert et al. [11] proposed a minimized lane-changing braking model and stipulated the rules for vehicles to change lanes randomly or compulsorily. Zheng [12] found that the scholars who studied lane-changing maneuvers mostly focused on lane-changing conditions and believed that is one of the necessary elements for the realization of lane changing. Wu et al. [13] employed time-variant safety margins to ensure a safe maneuver during trajectory planning. Most of the studies on lane-changing conditions are based on gap theory, which states that when the critical safety distance meets the requirements, an accident will not occur. Nilsson et al. [14] proposed a model to determine the best time to change lanes on the basis of anti-collision mechanism, speed constraints, etc. However, the safety distance in the lane-changing process is not a certain value under different circumstances and is difficult to estimate. Xu et al. [15] proposed a new dynamic ellipse minimum safe distance model based on different speeds and different driver types. Meanwhile, lane changing was classified according to the driver’s sensitivity to the safety distance. Li et al. [16] used the safety potential field model to classify the critical conditions of vehicle lane changing, and established a vehicle lane-changing model by considering vehicle speed and acceleration. With the development of the strategy of lane-changing behavior reflecting driving factors and the method of determining the appropriate lane changing trajectory, non-platoon-vehicle lane changing with different driving styles (slow and cautious or sudden and aggressive) can be simulated by changing the parameters of models.
The safety gap of non-platoon vehicles cannot be applied to that of vehicles in the platoon. In the non-platoon-vehicle lane-changing process, the distance that allows for avoiding a collision between the lane-changing vehicle and other vehicles is the minimum safe critical distance. However, the difference between platoon lane changing and non-platoon-vehicle lane changing is that the vehicles in the platoon can tolerate smaller safety distances because of their unique cooperative characteristics. Meanwhile, the distance should not be too large, which will lead to the dissolution of a platoon in the high-speed scene. Another way is to undertake platoon lane changing in dissolution. If the platoon is disbanded before or during the lane changing, the vehicles change lanes one by one according to the lane-changing gap of individual vehicles, and then all the vehicles form a platoon again. This method wastes the advantage of efficient transportation for a platoon, and the platoon cannot usually be reorganized after it is disbanded. Due to the high speed of vehicles on the highway, the state of the following vehicles and the leading vehicles will become greatly different over a short time; thus, it is difficult to realize platoon re-combination. Therefore, it is necessary to find a reasonable dynamic gap between platoon vehicles.
Many studies use the safety potential field to characterize the spatial distribution of driving risk around vehicles in complex traffic environments. The safety potential field theory is applied to the safe distance between individual traffic participants to prevent collisions [17,18,19]. Ni et al. [20,21] demonstrated the objectivity and universality of the potential field in traffic from both macro and micro perspectives and calibrated the potential field car-following model using NGSIM (next-generation simulation) data. Wang et al. [22,23] established a unified model to characterize the “driving risk field” based on the previous research, put forward the concept of a “driving risk field,” and validated the model with real vehicles. The results show that the model can provide an effective method for evaluating the driving risk in a complex traffic environment. The field theory opens up a new perspective for traffic flow modeling. In our previous research, we took safe driving as the goal and established a lane-changing model for non-platoon vehicles based on the safety potential field in combination with the characteristics of real-time perception and sharing of vehicle speed, acceleration, and other information in the CAVs system [16,24]. In this study, based on the original research, a new field model that is suitable for platoon lane changing was established. The dynamic gaps for different motion states were proposed.
The contributions of this study are as follows:
  • For the first time, a gravitational potential field was introduced to represent the traction between intra-platoon vehicles;
  • The gravitational potential field and repulsive potential field were unified into a system that is named the “intra-platoon potential field”;
  • The concept and calculation method of a dynamic gap of safety interval for platoon lane changing was proposed;
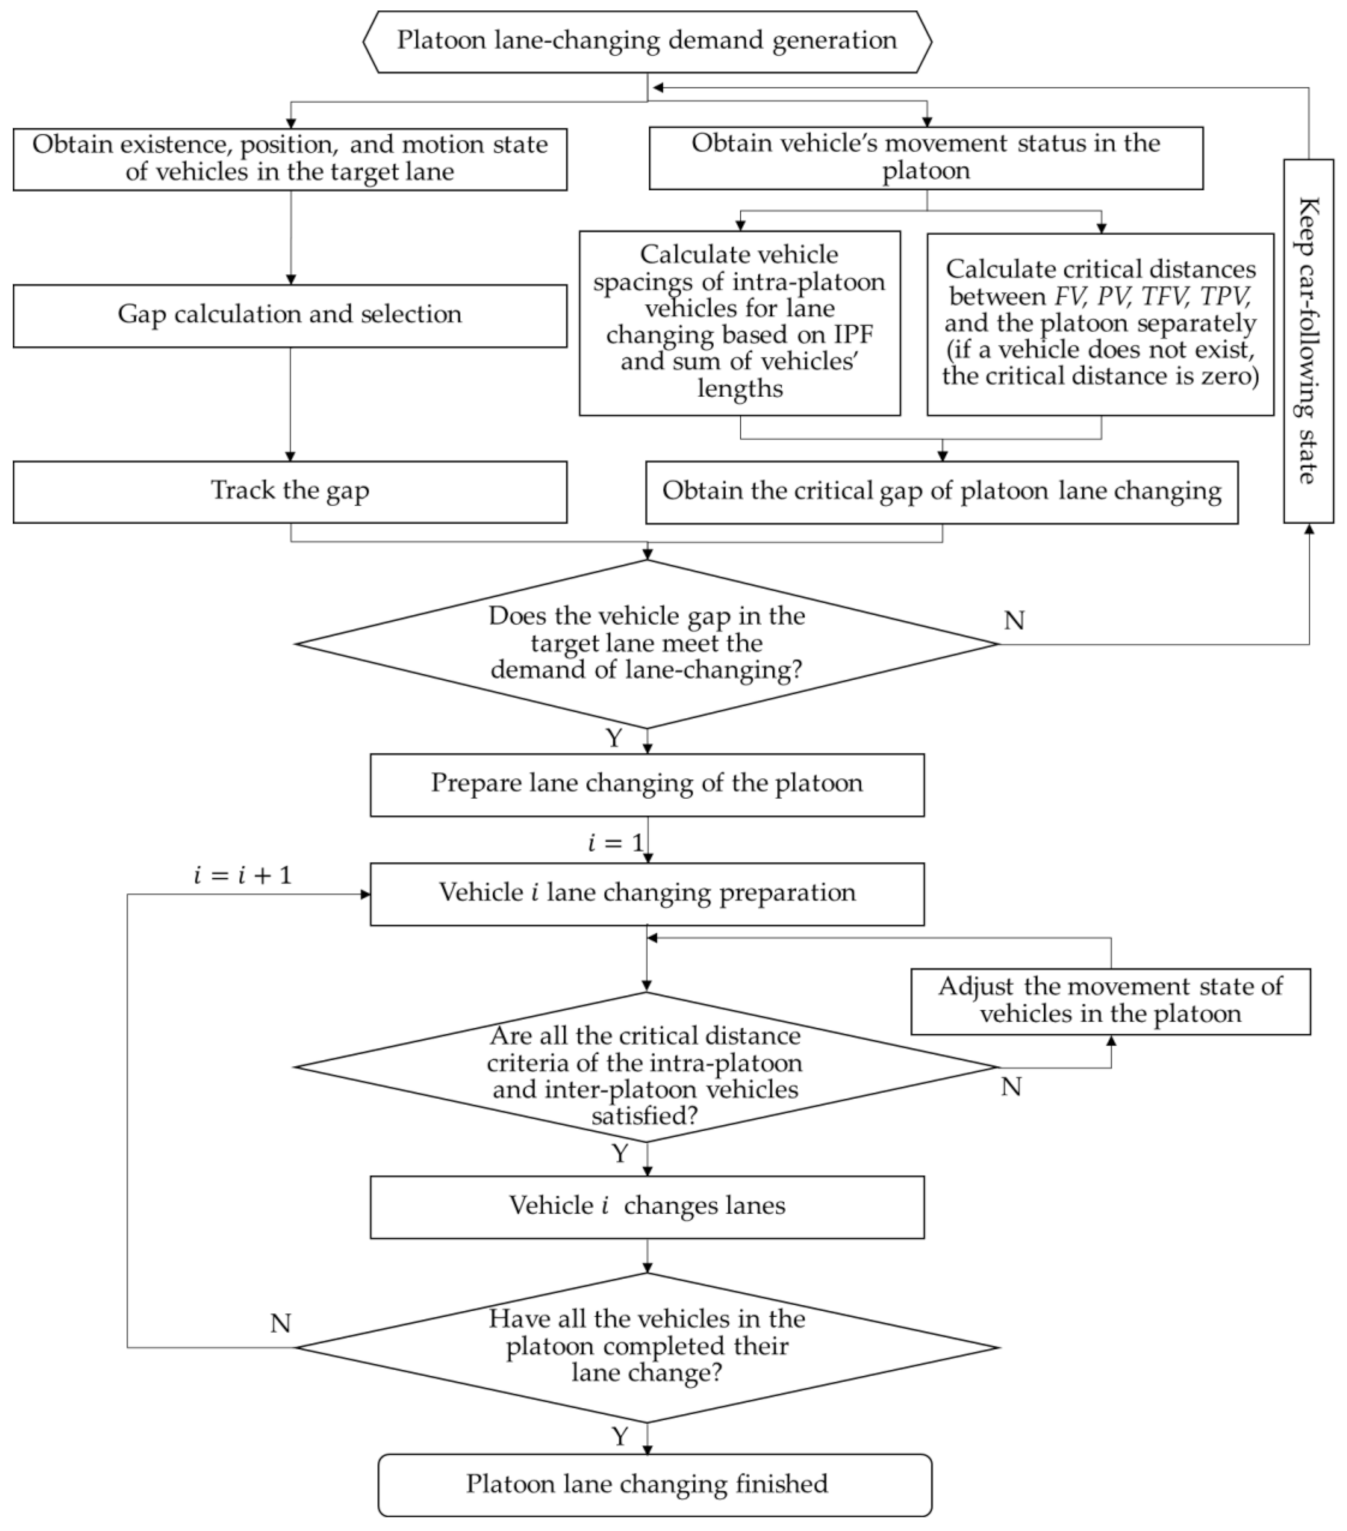
  • The method framework of entire-platoon lane changing was proposed and related experiments were carried out.
The remainder of this paper is organized as follows. First, the scenario description for platoon lane changing is defined in Section 2. Then, in Section 3, an intra-platoon potential field model is constructed and the potential field distribution of the vehicle under different motion states is analyzed in detail. According to the intra-platoon potential field model, the design of the platoon-lane-changing process and safety distance threshold model of avoiding crashes are given in Section 4. Section 5 presents the numerical simulation results and comparative verification, along with a discussion. Finally, the conclusions are summarized in Section 6.

2. Definition of Lane Changing for a Platoon

The typical lane-changing scenario of a platoon is described in this section. As shown in Figure 1, the platoon is the series of vehicles in red, L V is the leading vehicle, M V is the middle vehicle, and R V is the rear vehicle in the subject platoon. The platoon is directly related to the spatial position and motion states of vehicles in yellow, black, green, and purple. The yellow vehicle is the following vehicle in the current lane   F V , and the black vehicle is the preceding vehicle in the current lane   P V . Meanwhile, the green and purple vehicles are the following vehicle T F V and the preceding vehicle T P V in the target lane.
There are many types of crash accidents, including lateral scuffing, a side crash, and a rear-end crash. When the platoon is changing lanes, the last two crash forms are possible between platoon vehicles and T F V / T P V / P V , which is shown in Figure 2.
Based on the above analysis of the lane-changing scenario, vehicles with a great impact on the safety of a lane-changing platoon were analyzed. That is, the front and rear vehicles in the current lane and the target lane. However, the vehicle behind usually decides its actions according to the motion state of the vehicle in front; therefore, the vehicle F V has no effect on the platoon.
The platoon vehicles and non-platoon vehicles may be involved in crashes as follows. Rear-end collisions could happen between platoon vehicles L V / M V / T V with the following vehicle in the target lane T F V , as shown in Figure 2a,e; between platoon vehicles L V / M V / T V with the preceding vehicle in the same lane P V , as shown in Figure 2d,h; and between the leading vehicle L V and the preceding vehicle in the target lane T P V , as shown in Figure 2b. A side crash could happen between the leading vehicle L V and the preceding vehicle in the target lane T P V , as shown in Figure 2c. During the platoon-lane-changing process, rear collisions and side crashes may occur between vehicles in the platoon, as shown in Figure 2f,g. Many researchers have studied collisions between non-platoon vehicles. Thus, this study focused on avoiding the two kinds of conflicts in Figure 2f,g, which occur with intra-platoon vehicles.
In addition, this study only focused on the case of lane changing from the fast lane to the slow lane for analysis; the contrary lane changing is similar to this case and is omitted because of space limitation.

3. Intra-Platoon Potential Field

The intra-platoon potential field (IPF) is a physical field that denotes the spatial distribution of risk between targets in complex traffic environments. The targets refer to objects, such as vehicles, pedestrians, and cyclists, that could collide or their current status could result in significant losses.
Microscopic driving behavior in the traffic environment was mapped to potential field theory [19,24,25]. The vehicle will be affected by its environment in the process of driving. Generally speaking, no matter what kind of driving behavior the vehicle displays, its purpose is to achieve its movement purpose under the premise of ensuring driving safety. Taking lane-changing behavior as an example, during the process, the key to determining whether lane-changing behavior can be successful is to keep a safe distance between the vehicle and other vehicles around it. Although there is no substantial physical contact between the lane-changing vehicles and their surrounding vehicles, their motion state changes due to the surrounding position state. This indicates that there is a virtual force acting on the lane-changing vehicle, which causes it to change its motion state, where the virtual force is provided by the surrounding vehicles. The virtual force can be mapped to the field force because it is not determined by contact but due to the distribution of spatial positions. This shows that there is a potential field in the lane-changing scene and even in the traffic system, which represents the driving risk caused by the traffic environment.
In the traditional model of the acceptable gap theory, the field model usually only considers the repulsion field between the lane-changing vehicles and other vehicles around it to obtain the critical minimum safe distance during lane changing. However, the difference between platoon lane changing and non-platoon-vehicle lane changing is that the vehicles in the platoon can tolerate smaller safety distances because of the characteristics of the platoon and CAVs. An inappropriate safety distance may occur when there is no lane-changing model specifically for platoon vehicles. On an expressway, an inappropriate distance between vehicles in a platoon even means the dissolution of the platoon. Therefore, this study considered the design of the IPF model, which is composed of the repulsive force field between each vehicle and the gravitational potential field between vehicles in the platoon. On the premise that the platoon does not dissolve, it can complete the lane-changing maneuver of all vehicles in the platoon. Therefore, this study combined the repulsive force field to establish the IPF expression of the interaction between platoon vehicles, as follows:
E v = 1 2 E r + E g + c k k
where E v stands for the intra-platoon potential field, E r represents the repulsive potential field, E g refers to the gravitational potential field, and c is a value related to scale correction.
The repulsive potential field is a typical potential field that was widely applied in the traffic environment. In a previous study [16], the existing repulsive potential field model was established by considering the spatial position of surrounding vehicles and their motion state. The specific expression of the model is shown in the following equation:
E r = M i λ e β a i   c o s k k k
where E r is the repulsive potential field, M i is the equivalent mass of the ego vehicle i , k refers to the virtual distance to donate the relationship between the ego vehicle’s velocity v   and the potential field intensity, a i is the acceleration of the ego vehicle, and   is the clockwise angle of any point to the velocity direction of the ego vehicle, and λ and β are undetermined parameters that are related to the equivalent mass and the clockwise angle, respectively. Details of the parameters are given in Equations (4)–(6).
The gravitational potential field between vehicles in the platoon was proposed. In order to keep the consistency between the gravitational potential field and repulsive potential field and reduce the number of parameters to be calibrated, the gravitational potential field model was modified based on the repulsive potential field model. The formula for the gravitational potential field model was as follows:
E g = M i γ k e β a i   c o s k k    
where E g refers to the gravitational potential field, k is the virtual distance between the ego vehicle velocity v and the potential field intensity, represents the clockwise angle of any point to the velocity direction of the ego vehicle, a i is the acceleration of the ego vehicle, γ refers to an undetermined parameter related to the virtual distance, and β is an undetermined parameter related to the clockwise angle.
M i is the equivalent mass of the ego vehicle i and is used to characterize the influence of the vehicle’s mass and its motion state on the repulsive potential field [16]:
M i = m i 1.566 × 10 14 v i 6.687 + 0.3345    
where m i is the actual mass of the ego vehicle i and v i is the velocity of the ego vehicle. In addition, numerical values in the above equation are consistent with our previous research [16]. The artificial bee colony algorithm (ABC) was used for the specific calibration process:
k = x * x e g o τ e α v i 2 + y * y e g o τ 2    
where x * , y *   is the transfer coordinate to describe the relationship between the coordinate of the ego vehicle and the steering angle, x e g o , y e g o is the coordinate of the ego vehicle, v i is the velocity of the ego vehicle, and α and τ are undetermined parameters that are related to the velocity and the lane width.
x * y * = cos θ sin θ sin θ cos θ x x e g o y y e g o    
where θ is the steering angle of the ego vehicle and x , y is the coordinate of the subject point.
In the CAVs system, the motion state of vehicles can be transmitted and shared in real time. Therefore, the potential field distribution of every vehicle can be obtained according to real-time information. Contours are numerical expressions of the potential energy field and are closed-loop rings, according to which, the vehicle makes decisions. In previous research [16], we built a lane-changing model based on the repulsive field for a single non-platoon vehicle and calibrated the values of each parameter. As is well known, platoon lane changing occurs in a hybrid environment of single vehicles and a platoon. Meanwhile, the IPF model of platoon lane changing in this study involved the combination of a repulsive potential field and gravitational potential field between single vehicles in the same platoon. Therefore, it was necessary to make the platoon lane change model consistent with the previous individual lane change model in the base parameter values of the field. The parameter values are shown in Table 1.
On the basis of the parameter values that were calibrated using the consistency with the non-platoon vehicle lane-changing model, the remaining parameter γ was calibrated using the optimal platoon space headway. Mature research on the theoretical value of the platoon lane-changing gap is lacking at present. There are essential differences between vehicle lane changing and car following, but the critical state at the beginning and end of lane changing is the car-following state. Therefore, the desired time headway in CAVs car following could be used to calibrate the optimal distance at the beginning of lane changing. However, due to the oblique movement of vehicles in the process of lane changing, it is difficult to maintain a fixed distance, which cannot be calculated using the headway formula. The distance between the two vehicles would fluctuate up and down at the optimal distance and form a distance interval. Therefore, this optimal distance cannot be the critical minimum collision distance for car following since this would easily allow for collisions in the lane-changing process. In addition, cooperative adaptive cruise control (CACC) is a low-level CAVs system. Some research was done in this regard. Liu [26] suggested that the desired time headway of a car following in a CACC strings flow was 1.4 s with 0.2 s as the standard deviation. Meanwhile, Nowakowski [27] claimed that CACC strings can operate with 0.6 s as the minimum inter-vehicle time gap. According to the definition of the optimal distance in this study, 1.4 s was selected as the desired time headway to calibrate the optimal distance at the beginning of the lane-changing process, as shown in Equation (7). It is also worth saying that 1.4 s is just the desired headway time under a low-level CAVs system. With the improvement of the CAVs system level, a closer headway should be adopted.
D = v e · T
where D is the optimal distance at the beginning of lane changing, v e is the velocity of the ego vehicle, and T is the desired time headway, which was set to 1.4 s.
In the IPF, there is a minimum ring of the field contour. When the minimum ring of the ego vehicle is tangent to that of the front one, the distance between the two vehicles is the optimal distance in the physical sense. Therefore, this study defined the optimal distance as Equation (8):
D = k e + k f
where D is the optimal distance, k e is the distance from the minimum point in the driving direction to the centroid of the ego vehicle, and k f is the distance between the minimum point in the negative driving direction of the front vehicle and its centroid. They are derived from the IPF, whose derivative is set to zero. The formulas were as follows:
k e = λ e α v e + β a e γ · τ k f = λ e α v f + β a f γ · τ
γ was calibrated using simultaneous equations, namely, Equations (7)–(9). The results are shown in Equation (10):
γ = λ e α v e + β a e + e α v f + β a f 2 v e · T · τ 2
The model can provide dynamic feedback of the gravitational potential field distribution of the platoon vehicles in different motion states. The risk maps are generated, as shown in Figure 3. The green contour represents a horizontal curve that is formed by projecting points with the same potential field into a plane. The color from cyan to violet indicates the intensity of the potential field. When the color at a certain point is closer to purple, it indicates the greater value of the gravitational potential field, that is, the greater the gravitational penalty. In contrast, the closer the color to cyan, the smaller the gravitational penalty. As shown in Figure 3a, when the vehicle was stationary, i.e., when its velocity, acceleration, and steering angle were all zero, independent of whether vehicles in the same platoon were close to the ego vehicles at any position, there was a similar variation trend in the gravitational potential field; therefore, the gravitational potential field around the static vehicle presented a circular shape. As shown in Figure 3b,c, when the self-driving vehicle moved at a constant speed, there was a larger distance between vehicles moving at high speeds. The scope of the gravitational potential field gradually expanded and the strength of the gravitational potential field weakened at the same position around the ego vehicle. Thus, the form of the gravitational potential field was an ellipse that was compressed along the vertical axis (perpendicular to the direction of motion). When the ego vehicle was accelerating, the gravitational potential field strength exerted by the vehicle on the following vehicle was greater than that of the uniform motion, as shown in Figure 3d,e. With the increase in acceleration, the gradient of the gravitational potential field to the rear vehicle gradually increased. Similarly, if the vehicle was decelerating, the gradient of the gravitational potential field to the rear vehicle increased with the deceleration, which is shown in Figure 3g,h. When the ego vehicle was changing lanes, there was a steering angle, where the effect of the vehicle on the rear vehicle was different from the changing trend of the straight-driving vehicle. Therefore, the gravitational potential field was designed to be offset along the direction of the steering angle, as shown in Figure 3f,i.

4. Critical Safety Distance in Different Critical Conditions

In this section, the design of the flow chart of platoon lane changing and the critical safe distance modeling are discussed. As shown in Figure 2 above, there are eight types of conflicts in the platoon lane-changing process, where six of them involve conflicts between platoon vehicles and non-platoon vehicles. The minimum safe distance model of these conflicts was given in the previous research [16]. Therefore, this study focused on the two kinds of conflicts in Figure 2f,g and studied the critical safe distance model under the condition of avoiding these two kinds of conflicts.

4.1. Design of Platoon Lane Changing Process

The design of the entire platoon lane-changing process is shown in Figure 4. There is a platoon intending to change lanes, maybe because of an off-ramp or road construction. The CAVs system is an approach to realize real-time location awareness and information communication between vehicles. Therefore, the existence, motion state, and spatial positions of vehicles in the target lane and the platoon can be accessed in real-time. Based on the received information of vehicles in the target lane, the platoon determines the available gap and tracks it. In addition, the required distance for lane changing is composed of the platoon length; the distances between intra-platoon vehicles; and the distances between F V ,   P V ,   T F V ,   T P V , and the platoon. The latter two are calculated using field theory. Among them, the distances inside the platoon are determined using Equation (3), and those outside the platoon are obtained using Equation (2). It should be noted that if a non-platoon vehicle does not exist, the critical distance between it and the platoon is zero. This means that the proposed method would also be valid when F V ,   P V ,   T F V , and T P V are optional. Then, whether the tracking gap is suitable for lane changing is judged. If the answer is “N,” the platoon will keep the car-following state until it finds a suitable gap. Once the gap in the target lane meets the critical gap criteria, the platoon will prepare for lane changing with L V first. At this time, the motion information of vehicles around L V will be used as the input to calculate the safe distance thresholds between L V and other vehicles. It will be judged whether all distances between L V and the surrounding vehicles meet the critical thresholds at that moment. Only when all the thresholds are satisfied separately will L V be permitted to change lanes. If they are not satisfied, L V in the platoon will adjust its movement state to meet them. The detailed safety distance thresholds for intra-platoon vehicles are introduced in Section 4.2 and Section 4.3. After L V completes a lane change, the following vehicle will judge, adjust, and accomplish lane changing in the same way until all platoon vehicles have finished the changing lane task.

4.2. The Safety Distance Threshold for Avoiding a Rear-End Crash

As shown in Figure 2f, rear-end crashes may occur between L V and M V , M V and M V , and M V and R V . For the convenience of expression, an M V or R V that intends to change lanes is expressed as the “ego vehicle,” and an L V or M V of the vehicle in front of the target lane is expressed as the “front vehicle.” In other words, the ego vehicle may collide with the front vehicle in the target lane when changing lanes. According to the motion state of the two vehicles, the IPF distribution of the two vehicles in the lane-changing scene is shown in Figure 5, where there are two critical cases. In Figure 5a, the inner circles of the field value distribution of the two vehicles are tangent to each other, and the outer circles of the distribution of the real field values are tangent to each other in Figure 5b.
In the scene where the inner circles in Figure 5a are tangent to each other, it can be understood that in order to ensure that the ego vehicle avoids colliding with the front vehicle during and after lane changing, the minimum headway between the ego vehicle and the front vehicle should be greater than D m i n . Its formulas were as follows:
D m i n = D m i n I P F L e 2 + L f 2
D m i n I P F = L e I P F + L f I P F
L e I P F = 1 2 M i γ τ e β a e cos θ e + α v e E v 2 4 M i 2 λ γ + E v
L f I P F = 1 2 M i γ τ e β a f + α v f E v 2 4 M i 2 λ γ + E v
where D m i n is the minimum headway; L e and L f are the vehicle lengths of the ego vehicle and front vehicle, respectively; D m i n I P F is the minimum longitudinal distance between vehicle centroids; and D m i n I P F is the sum of L e I P F and L f I P F . L e I P F and L f I P F are the distances from the tangent point to the mass center of the ego vehicle and front vehicle, respectively, under the critical potential field value, which can be derived from the potential field equation (Equation (1)).
In Figure 5b, where the outer circles are tangent to each other, it can be understood that in order to ensure that the distance between the two vehicles is not too large, which would affect the stability of the platoon, the maximum distance between the ego vehicle and the front vehicle in the lane changing process should be less than D m a x ; this is shown in the following formulas:
D m a x = D m a x I P F L e 2 + L f 2
D m a x I P F = L e I P F + L f I P F
L e I P F = 1 2 M i γ τ e β a e   c o s θ e + α v e E v 2 4 M i 2 λ γ + E v
L f I P F = 1 2 M i γ τ e β a f + α v f E v 2 4 M i 2 λ γ + E v
where D m i n is the maximum headway; L e and L f are the vehicle lengths of the ego vehicle and front vehicle, respectively; D m a x I P F is the maximum longitudinal distance between the vehicle centroids; and D m a x I P F is the sum of L e I P F and L f I P F . L e I P F and L f I P F are the distances from the tangent point to the mass center of the ego vehicle and the front vehicle, respectively, under the critical potential field value. They are derived from the potential field (Equation (1)) and the formulas are shown above.
During the process of lane changing, it is assumed that the motion state of the surrounding vehicles remains unchanged. This can be expressed by the following formula; no matter what motion state the ego vehicle is in, the vehicle spacing D H at the critical moment during lane changing should be greater than the shortest distance D m i n and greater than the maximum headway D m a x .
D m i n D H D m a x
If D H < D m i n , this means that the current spacing is less than the critical minimum safety spacing; as such, the ego vehicle will adjust its movement state or wait for the next lane-changing safety clearance. If D H > D m a x , this means that the current distance is greater than the critical maximum distance and the motion state will be adjusted to reduce the distance between the two vehicles.

4.3. The Safety Distance Threshold of Avoiding Side Crashes

As shown in Figure 2g, side crashes may occur between the L V and M V , the M V and M V , and the M V and R V . For the convenience of expression, this study expresses the M V or R V of the vehicle that intends to change lanes as the “ego vehicle,” and the L V or M V of the vehicle in front of the target lane is expressed as the “front vehicle.” In other words, the ego vehicle may cause side crashes with the front vehicle in the target lane when changing lanes. This study calculated the IPF distribution of the two vehicles in the lane-changing scene according to the motion state of the two vehicles. As shown in Figure 6, there were two critical cases. In Figure 6a, the inner circles of the field value distributions of the two vehicles are tangent to each other, and in Figure 6b, the outer circles of the distributions of the real field values are tangent to each other.
In the scene where the inner circles in Figure 6a are tangent to each other, in order to ensure that the ego vehicle avoids colliding with the front vehicle during and after changing lanes, the minimum headway between the ego vehicle and the front vehicle should be greater than D m i n θ ; the relevant formulas are as follows:
D m i n θ = D m i n I P F L e 2 · c o s θ + L f ^ 2
D m i n A P F θ = L e I P F · c o s θ + L f ^ I P F
L e I P F = 1 2 M i γ τ e β a e   c o s θ e + α v e E v 2 4 M i 2 λ γ + E v
L f ^ I P F = 1 2 M i γ τ e β a f ^ + α v f ^ E v 2 4 M i 2 λ γ + E v
where D m i n θ is the minimum headway; L e and L f ^ are the vehicle lengths of the ego vehicle and front vehicle, respectively; D m i n A P F is the minimum longitudinal distance between the vehicle centroids; and D m i n I P F θ is the sum of L e I P F and L f ^ I P F . L e I P F and L f ^ I P F are the distances from the tangent point to the mass center of the ego vehicle and front vehicle, respectively, under the critical potential field value, which are derived from the potential field (Equation (1)).
In Figure 6b, where the outer circles are tangent to each other, it can be understood that in order to ensure that the distance between the two vehicles is not too large, which would affect the stability of the platoon, the maximum distance between the ego vehicle and the front vehicle in the lane changing process should be less than D m a x θ ; this is shown in the following formulas:
D m a x θ = D m a x I P F L e 2 · c o s θ + L f ^ 2
D m a x I P F θ = L e I P F · c o s θ + L f ^ I P F
L e I P F = 1 2 M i γ τ e β a e   c o s θ e + α v e E v 2 4 M i 2 λ γ + E v
L f ^ I P F = 1 2 M i γ τ e β a f ^ + α v f ^ E v 2 4 M i 2 λ γ + E v
where D m a x θ is the maximum headway; L e and L f ^ are the vehicle lengths of the ego vehicle and front vehicle, respectively; D m a x I P F is the maximum longitudinal distance between the vehicle centroids; and D m a x I P F θ is the sum of L e I P F and L f ^ I P F . L e I P F and L f ^ I P F are the distances from the tangent point to the mass center of the ego vehicle and the front vehicle, respectively, that are under the critical potential field value. They are derived from the IPF formula (Equation (1)) and the formulas are shown above.
During the lane-changing process, it is assumed that the motion states of the surrounding vehicles remain unchanged. This can be expressed using the following formula; no matter what motion state the ego vehicle is in, the vehicle spacing D H at the critical moment during lane changing should be greater than the shortest distance D m i n θ and greater than the maximum headway D m a x θ :
D m i n θ D H D m a x θ
If D H < D m i n θ , this means that the current spacing is less than the critical minimum safety spacing; as such, the ego vehicle will adjust the movement state or wait for the next lane-changing safety clearance. If D H > D m a x θ , this means the current distance is greater than the critical maximum distance and the motion state will be adjusted to reduce the distance between the two vehicles.

5. Experiments and Discussion

In the above sections, the description of the IPF model between platoon vehicles is given and analysis of the critical situation between the lane-changing vehicle and vehicles in the same platoon around was presented. The critical distance models for each of two potential conflicts in different motion states are established. Thus, the results of numerical simulation analysis of a single vehicle are presented in this section. The proposed model was verified by comparing it with the previous model, which takes no account of the gravity from the platoon. Finally, this proposed platoon lane changing method was applied to calculate the lane-changing dynamic gap of the platoon.

5.1. Numerical Simulation Analysis of Single Vehicle

The numerical simulation analysis of the critical distance was carried out for each of the lane-changing models of different conflict scenarios separately, which were avoiding a rear-end collision and avoiding a side crash between vehicles M V / R V and vehicles L V / M V . It was assumed that the two vehicles were of the same type and that the vehicle length was 4.8 m. Considering the safety and comfort of driving, the acceleration of the lane-changing vehicle should not be too high. During the simulation, this study set the acceleration value range from −2 m/s2 to 2 m/s2 and the steering angle from 2° to 5°. Four different motion states of the relevant vehicles were also taken into account, which were four different motion state combinations in terms of velocity and acceleration.

5.1.1. Safety Distance Threshold Simulation of Avoiding a Rear-End Crash

Rear-end crashes may occur between the L V and M V , the M V and M V , and the M V and R V , as shown in Figure 2f. The same as in Section 2, this study expressed the M V or R V of the vehicle that intends to change lanes as the “ego vehicle,” and the L V or M V of the vehicle in front of the target lane was expressed as the “front vehicle” for clarity. Figure 7 shows the critical distances D m a x and D m i n between the ego vehicle and the front vehicle. The velocity difference between the two vehicles was represented using the horizontal axis and the distance was represented using the vertical axis. It can be seen from each diagram that with the increase in velocity difference Δ v , the maximum distance D m a x and the minimum distance D m i n gradually increased and the feasible gap between D m a x and D m i n gradually increased too. In the same v f , a f , and   v e conditions, the maximum distance D m a x and the minimum distance D m i n gradually decreased with the acceleration a e of the ego vehicle. Meanwhile, we found that the critical distances increased when the velocity v f of the front vehicle increased or when the acceleration a f of the front vehicle decreased. This illustrates the relationship between the required critical distances and different motion states of the two vehicles.

5.1.2. Safety Distance Threshold Simulation of Avoiding a Side Crash

Side crashes may occur between the L V and M V , the M V and M V , and the M V and R V , as shown in Figure 2g. Figure 8 shows the critical distances D m a x θ and D m i n θ between the ego vehicle and the front vehicle in different motion states. The velocity difference between the two vehicles was represented using the horizontal axis and the distance was represented using the vertical axis. It can be seen from the results of the simulations that with the increase in velocity difference Δ v , the critical distance D m a x θ and D m i n θ gradually increased and the feasible gap between D m a x θ and D m i n θ gradually increased too. The string angle θ made some difference in the distance value and the trend remained the same as in the last section. The critical distances reduced with the decrease in the ego vehicle acceleration a e , the decrease in the front vehicle velocity v f , and the increase in the front vehicle acceleration a f .

5.2. Comparative Verification Analysis

To further show the effectiveness of the proposed model, a group of experiments was designed to compare the longitudinal critical distance between lane-changing vehicles and the front vehicles in the platoon. Three experiments were conducted, which were based on the safety potential field (SPF) model [16], the safety distance model of the desired time headway (DTH), and the proposed IPF. In experiments, the velocity of the ego vehicle was set to 30 m/s and the velocity of the front vehicle in the target lane was 20 m/s. The two vehicles adopted one of four acceleration strategies in the lane-changing process: the two vehicles drive at a constant speed, the ego vehicle accelerates and the front vehicle drives at a constant speed, the ego vehicle accelerates and the front vehicle decelerates, and the ego vehicle decelerates and the front vehicle accelerates. Under each strategy, the critical distances of SPF and IPF under different combinations of motion states were calculated using Equations (1) and (2), respectively, and were compared with the critical distances when the time headway was 1.4 s. The critical distances obtained using IPF was an interval with upper and lower bounds. Therefore, this study chose the optimal distance between the platoon vehicles, that is, the position where the minimum value of the IPF field of the two vehicles coincided, for comparison with the critical distance of the other two models. On this basis, the interval of the IPF critical distance was also marked. The results are shown in Figure 9.
The green broken line and the blue broken line are the critical distance of vehicles in the DTH model and the SPF model, respectively. The red broken line is the critical distance of vehicles in the IPF model. In addition, the upper end of the red broken line is the maximum distance that vehicles need to meet and the lower bound is the minimum distance. As can be seen from Figure 9, the DTH safety model could not provide feedback on the difference in the critical distance under different acceleration strategies, and the IPF proposed in this study could distinguish the critical distances of vehicle lane changing under different motion states of vehicles. When the ego vehicle and the front vehicle moved at the same velocity, the critical distances based on the IPF were consistent with the results of the DTH, which were in line with the safety requirements. Meanwhile, it was found that the SPF broken line was between the critical distance interval of IPF and it was larger than the optimal distance in the IPF. This was also consistent with the fact that the optimal distance between platoon vehicles was less than that between non-platoon vehicles. In other words, the IPF realized the virtual link between the platoon vehicles. However, when the vehicle motion state was affected by the acceleration parameters, significant differences occurred. It was found that the optimal critical distance of the IPF was less than the SPF and the DTH when the ego vehicle accelerated and the front vehicle decelerated; when the ego vehicle decelerated and the front vehicle accelerated, the optimal critical distance of the IPF was greater than the DTH but still less than the SPF. This was consistent with reality and verified the rationality of the model.

5.3. Numerical Simulation Analysis of the Platoon

A feasible calculation method to find the dynamic gap in the platoon lane-changing process is provided in the lane-changing process of Section 4.1. In this case, general analysis that covers all situations is considered, that is,   F V ,   P V ,   T F V ,   and T P V all exist. The dynamic lane-changing gap of the platoon consisted of three parts:
  • The safe distance between the front vehicle in the target lane and the L V in the platoon, which was calculated using the SPF.
  • The optimal distance between the middle vehicles in the platoon, which was calculated using the IPF.
  • The safe distance between the following vehicle and the trail vehicle in the platoon, which was also calculated using SPF.
For this section, we only considered the situation of stable driving of the platoon; therefore, the velocity and acceleration of vehicles in the platoon were consistent, while those of the front vehicle and the following vehicle were set to be consistent. Three combination strategies about velocity and acceleration of non-platoon vehicles were set, which were v f = 20   m /s, a f = 0   m /s2 ;   v f = 20   m /s, a f = 2   m/s2; and v f = 30   m /s, a f = 0   m/s2. Each strategy had two conditions where the number of vehicles of the platoon was set to three and six, respectively. The curves of the dynamic gap in the platoon lane-changing process under these six cases are shown in Figure 10.
As shown in Figure 10, in the same case, the dynamic gap in the platoon lane-changing process was larger with the higher velocity and acceleration of the platoon. However, the acceleration of the front and following vehicle in the target lane had a limited effect on the dynamic gap. This was mainly because the dynamic gap consisted of three parts. The velocity and acceleration of the non-platoon vehicles had no influence on the distances between the middle vehicles in the second part. However, the velocity and acceleration of the platoon had a conspicuous impact on the distances of all three parts. In addition, as the number of vehicles increased, the dynamic gap increased. When there were enough vehicles in the platoon, the distance of the second part had a greater influence on the dynamic gap than that of the first and third parts.

6. Conclusions

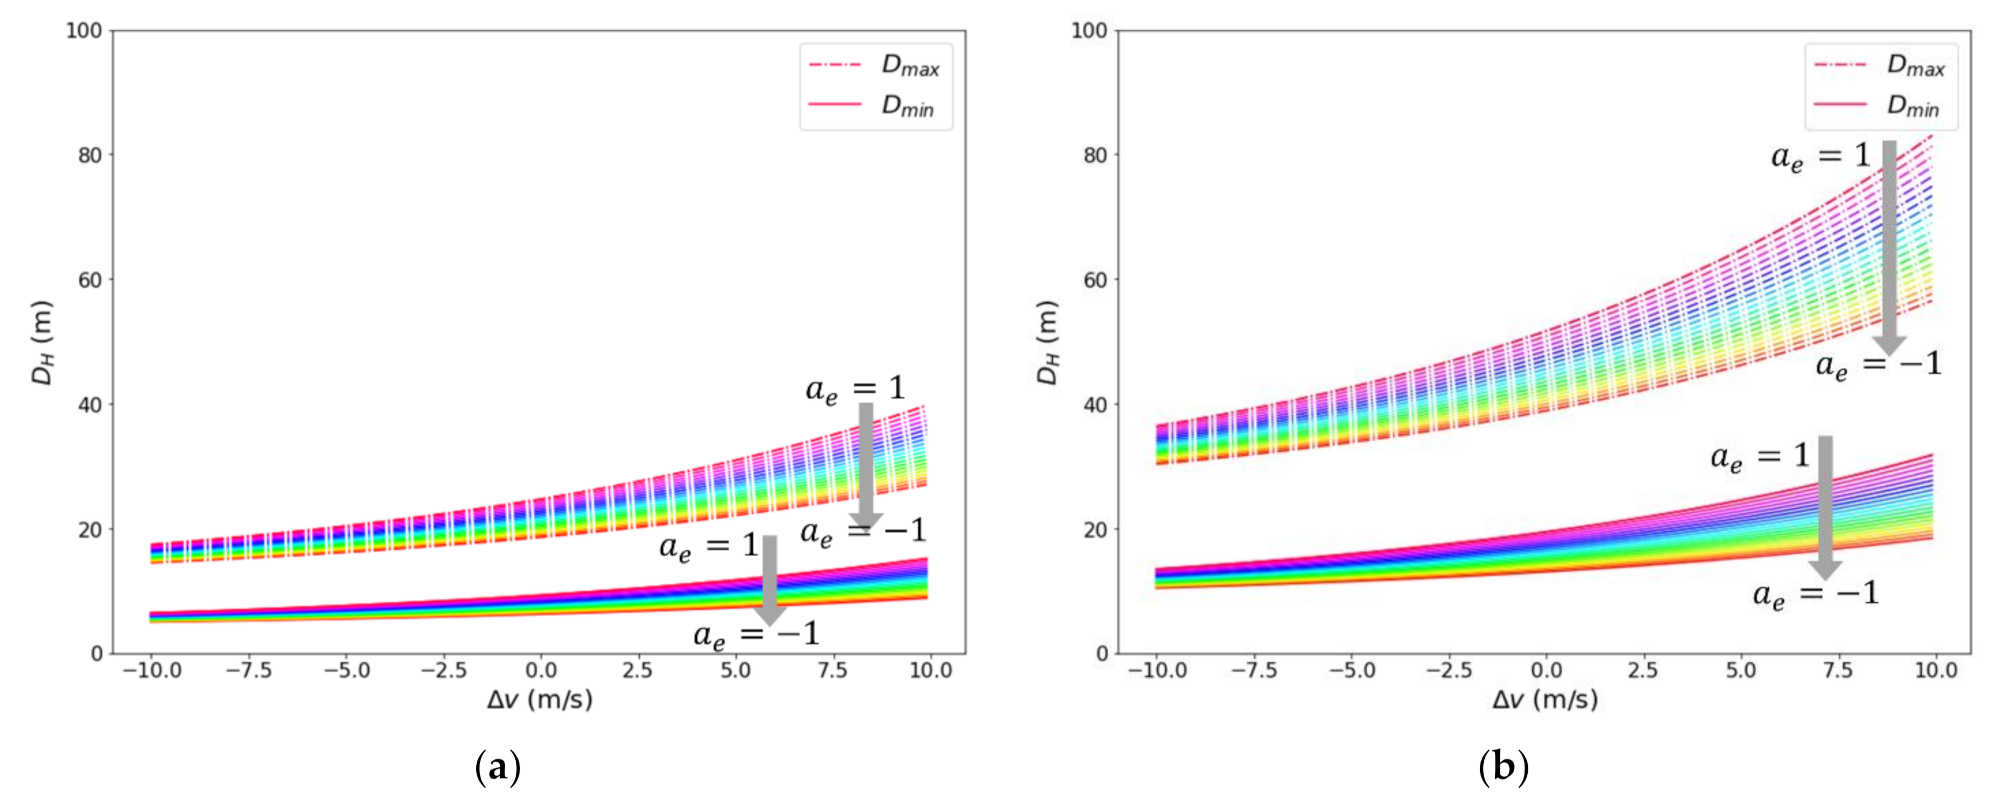
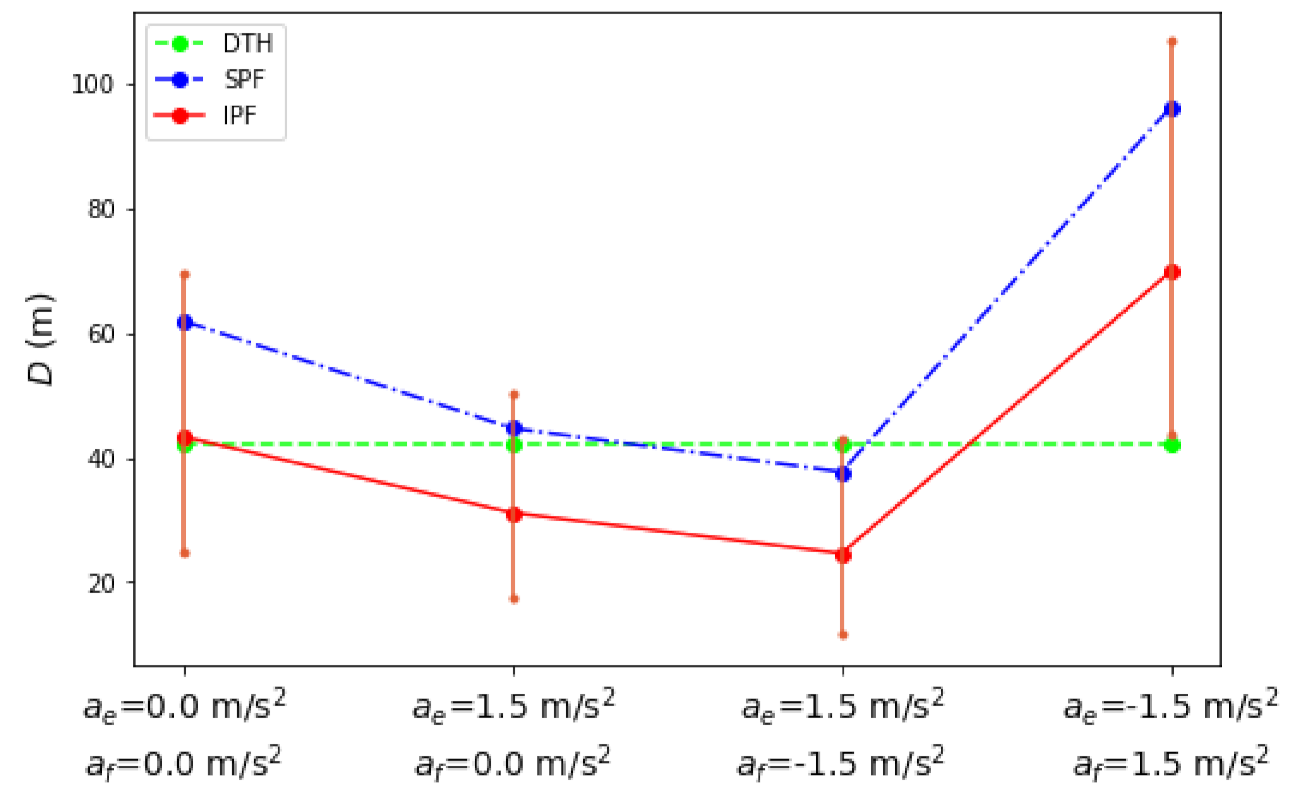
This study focused on the feasible gap in platoon lane-changing maneuvers in CAVs systems. First, conflicts that may happen in scenes of platoon lane changing were listed and the typical rear-end collision and side crash were selected as core scenarios for this study. Second, a gravitational potential field brought by the traction inside the platoon was proposed for the platoon vehicles. Combined with the repulsive potential field, the IPF method was established, which represents the risk distribution around the platoon vehicle under its current moving state. Third, a safety lane-changing process for the platoon was designed and a dynamic gap in the process was proposed, which was composed of intra-platoon and inter-platoon distances. The distance between non-platoon vehicles was studied in many pieces of research, but it is necessary to also study the gap between intra-platoon vehicles. On the basis of the IPF, this study deeply analyzed the critical distances between vehicles in different conflict scenarios, namely, rear-end collisions and side crashes. It was found that the critical distance in the platoon was an interval with an upper bound and a lower bound, which was quite different from the results in previous studies about non-platoons. Therefore, this study proposed a critical lane-changing distance model for platoon vehicles under each of the two collision scenarios. Finally, experiments were carried out, namely, numerical experiments of critical distances between intra-platoon vehicles and that of the dynamic gap in the entire platoon lane-changing process, which showed that the proposed model effectively represented the relationship between the critical distances and the motion state. Compared with other models, it was verified that the critical distance model proposed ensured the safety of a lane-changing maneuver and that it could maintain a shorter gap compared with non-platoon vehicle lane changing.
The method can be applied further in many scenarios, including up and down ramps, avoiding construction areas ahead, and even the lane-changing behavior strategy of a self-organizing platoon. Furthermore, future work intends to do further research on trajectory planning and stability control in the platoon lane-changing process under the CAVs environment.

Author Contributions

Conceptualization, R.W.; methodology, R.W.; software, L.L.; validation, L.L. and W.L.; formal analysis, R.W.; writing—original draft preparation, R.W. and L.L.; writing—review and editing, W.L. and B.R.; visualization, R.W., L.L. and W.L.; supervision, Y.R. and B.R.; project administration, Y.R. and B.R.; funding acquisition, Y.R. All authors have read and agreed to the published version of the manuscript.

Funding

This research was supported by the Key Research and Development Program of Shandong Province (grant no. 2020CXGC010118), the National Natural Science Foundation of China (grant no. 41971342), the Fundamental Research Funds for the Central Universities (grant no. 2242021k30055), and the Postgraduate Research and Practice Innovation Program of Jiangsu Province (grant no. KYCX21_0140).

Institutional Review Board Statement

Not applicable.

Informed Consent Statement

Not applicable.

Data Availability Statement

Data sharing is not applicable. No new data were created or analyzed in this study.

Acknowledgments

We would like to thank the anonymous reviewers whose insightful comments have helped to significantly improve the quality of the analysis and presentation of this study.

Conflicts of Interest

The authors declare no conflict of interest.

References

  1. Papadimitratos, P.; De La Fortelle, A.; Evenssen, K.; Brignolo, R.; Cosenza, S. Vehicular communication systems: Enabling technologies, applications, and future outlook on intelligent transportation. IEEE Commun. Mag. 2009, 47, 84–95. [Google Scholar] [CrossRef] [Green Version]
  2. Liu, Y.; Zhang, D.; Gordon, T.; Li, G.; Zong, C. Approach of coordinated control method for over-actuated vehicle platoon based on reference vector field. Appl. Sci. 2019, 9, 297. [Google Scholar] [CrossRef] [Green Version]
  3. Kim, J. Truck platoon control considering heterogeneous vehicles. Appl. Sci. 2020, 10, 5067. [Google Scholar] [CrossRef]
  4. Li, L.; Gan, J.; Qu, X.; Mao, P.; Yi, Z.; Ran, B. A novel graph and safety potential field theory-based vehicle platoon formation and optimization method. Appl. Sci. 2021, 11, 958. [Google Scholar]
  5. Axelsson, J. Safety in vehicle platooning: A systematic literature review. IEEE Trans. Intell. Transp. Syst. 2016, 18, 1033–1045. [Google Scholar] [CrossRef] [Green Version]
  6. Desai, J.P.; Ostrowski, J.P.; Kumar, V. Modeling and control of formations of non-holonomic mobile robots. IEEE Trans. Robot. Autom. 2001, 17, 905–908. [Google Scholar] [CrossRef] [Green Version]
  7. Hsu, H.C.-H.; Liu, A. Platoon Lane Change Maneuvers for Automated Highway Systems. In Proceedings of the IEEE Conference on Robotics, Automation and Mechatronics, Singapore, 1–3 December 2004; Volume 2, pp. 780–785. [Google Scholar]
  8. Hsu, H.C.-H.; Liu, A. Kinematic design for platoon-lane-change maneuvers. IEEE Trans. Intell. Transp. Syst. 2008, 9, 185–190. [Google Scholar] [CrossRef]
  9. Keßler, G.C.; Maschuw, J.P.; Abel, D. Lane change of heavy-duty vehicle platoons without lateral position information. IFAC Proc. Vol. 2007, 40, 455–462. [Google Scholar] [CrossRef]
  10. Li, P.; Alvarez, L.; Horowitz, R. AHS safe control laws for platoon leaders. IEEE Trans. Control Syst. Technol. 1997, 5, 614–628. [Google Scholar] [CrossRef]
  11. Schubert, R.; Schulze, K.; Wanielik, G. Situation assessment for automatic lane-change maneuvers. IEEE Trans. Intell. Transp. Syst. 2010, 11, 607–616. [Google Scholar] [CrossRef]
  12. Zheng, Z. Recent developments and research needs in modeling lane changing. Trans. Res. Part B 2014, 60, 16–32. [Google Scholar] [CrossRef] [Green Version]
  13. Wu, X.; Qiao, B.; Su, C. Trajectory planning with time-variant safety margin for autonomous vehicle lane change. Appl. Sci. 2020, 10, 1626. [Google Scholar] [CrossRef] [Green Version]
  14. Nilsson, J.; Brannstrom, M.; Fredriksson, J.; Coelingh, E. Longitudinal and lateral control for automated yielding maneuvers. IEEE Trans. Intell. Transp. Syst. 2016, 17, 1404–1414. [Google Scholar] [CrossRef]
  15. Xu, L.H.; Hu, S.G.; Luo, Q.; Zhou, Y. Lane-changing model based on different types of drivers. J. South China Univ. Technol. 2014, 42, 104–111. [Google Scholar]
  16. Li, L.; Gan, J.; Zhou, K.; Qu, X.; Ran, B. A novel lane-changing model of connected and automated vehicles: Using the safety potential field theory. Phys. A Stat. Mech. Appl. 2020, 559, 125039. [Google Scholar] [CrossRef]
  17. Matsumi, R.; Raksincharoensak, P.; Nagai, M. Autonomous braking control system for pedestrian collision avoidance by using potential field. IFAC Proc. Vol. 2013, 46, 328–334. [Google Scholar] [CrossRef]
  18. Raksincharoensak, P.; Akamatsu, Y.; Moro, K.; Nagai, M. Predictive braking assistance system for intersection safety based on risk potential. IFAC Proc. Vol. 2013, 46, 335–340. [Google Scholar] [CrossRef]
  19. Zheng, X.; Zhang, D.; Gao, H.; Zhao, Z.; Huang, H.; Wang, J. A novel framework for road traffic risk assessment with HMM-based prediction model. Sensors 2018, 18, 4313. [Google Scholar] [CrossRef] [PubMed] [Green Version]
  20. Ni, D. A unified perspective on traffic flow theory. Part I: The field theory. Appl. Math. Sci. 2013, 7, 1929–1946. [Google Scholar] [CrossRef]
  21. Ni, D.; Wang, H. A unified perspective on traffic flow theory. Part III: Validation and benchmarking. Appl. Math. Sci. 2013, 7, 1965–1982. [Google Scholar] [CrossRef] [Green Version]
  22. Wang, J.; Wu, J.; Zheng, X.; Ni, D.; Li, K. Driving safety field theory modeling and its application in pre-collision warning system. Transp. Res. Part C Emerg. Technol. 2016, 72, 306–324. [Google Scholar] [CrossRef]
  23. Wang, J.; Wu, J.; Li, Y. The driving safety field based on driver-vehicle-road interactions. IEEE Trans. Intell. Transp. Syst. 2015, 16, 2203–2214. [Google Scholar] [CrossRef]
  24. Li, L.H.; Gan, J.; Qu, X.; Mao, P.; Ran, B. Car-following model based on safety potential field theory under connected and automated vehicles environment. China J. Highw. Transp. 2019, 32, 76–87. [Google Scholar]
  25. Wu, R.; Zheng, X.; Xu, Y.; Wu, W.; Li, G.; Xu, Q.; Nie, Z. Modified driving safety field based on trajectory prediction model for pedestrian–vehicle collision. Sustainability 2019, 11, 6254. [Google Scholar] [CrossRef] [Green Version]
  26. Liu, H.; Kan, X.; Shladover, S.E.; Lu, X.-Y.; Ferlis, R.E. Modeling impacts of cooperative adaptive cruise control on mixed traffic flow in multi-lane freeway facilities. Transp. Res. Part C Emerg. Technol. 2018, 95, 261–279. [Google Scholar] [CrossRef]
  27. Nowakowski, C.; O’Connell, J.; Shladover, S.E.; Cody, D. Cooperative adaptive cruise control: Driver acceptance of following gap settings less than one second. Hum. Factors Ergon. Soc. Ann. Meet. Proc. 2010, 3, 2033–2037. [Google Scholar] [CrossRef]
Figure 1. The typical lane-changing scenario of the platoon.
Applsci 11 07287 g001
Figure 2. Eight types of crash accidents in the platoon-lane-changing scenario.
Applsci 11 07287 g002
Figure 3. The gravitational potential field distribution map: (a) v = 0 m/s , a = 0 m/s2 , θ = 0 ° ; (b) v = 5 m/s , a = 0 m/s2 , θ = 0 ° ; (c) v = 10 m/s , a = 0 m/s2 , θ = 0 ° ; (d) v = 10 m/s , a = 1.5 m/s2 , θ = 0 ° ; (e) v = 10 m/s ,   a = 2 m/s2 , θ = 0 ° ; (f) v = 10 m/s , a = 1.5 m/s2 , θ = 15 ° ; (g) v = 10 m/s , a = 1.5 m/s2 ,   θ = 0 ° ; (h) v = 10 m/s , a = 2 m/s2 , θ = 0 ° ; (i) v = 10 m/s , a = 1.5 m/s2 , θ = 15 ° .
Applsci 11 07287 g003
Figure 4. Flow chart of the platoon lane-changing process.
Applsci 11 07287 g004
Figure 5. The critical situations of rear-end collisions: (a) the inner circles of the fields are tangent to each other and (b) the outer circles of the fields are tangent to each other.
Applsci 11 07287 g005
Figure 6. The critical situation for side collisions: (a) the inner circles of the fields are tangent to each other and (b) the outer circles of the fields are tangent to each other.
Applsci 11 07287 g006
Figure 7. Critical distances D m a x and D m i n in a rear-end crash: (a) v f = 10   m/s, a f = 0   m/s2; (b) v f = 20   m/s, a f = 0   m/s2; (c) v f = 20   m/s, a f = 2   m/s2; (d) v f = 20   m/s, a f = 2   m/s2.
Applsci 11 07287 g007aApplsci 11 07287 g007b
Figure 8. Critical distances D m a x and D m i n in a side crash: (a) v f = 10   m/s, a f = 0   m/s2, θ = 5 °; (b) v f = 20   m/s, a f = 0   m/s2, θ = 5 °; (c) v f = 20   m/s, a f = 2   m/s2, θ = 5 ° ; (d) v f = 20   m/s, a f = 2   m/s2, θ = 5 °.
Applsci 11 07287 g008aApplsci 11 07287 g008b
Figure 9. The comparison of the critical distance in DTH, SPF, and IPF.
Applsci 11 07287 g009
Figure 10. The curves of the dynamic gap in the platoon lane changing process under the six cases: (a) v f = 20   m /s, a f = 0   m/s2, n = 3 ; (b) v f = 20   m/s, a f = 2   m/s2, n = 3 ; (c) v f = 30   m/s, a f = 0   m/s2, n = 3 ; (d) v f = 20 m/s, a f = 0   m/s2, n = 6 ; (e) v f = 20   m/s, a f = 2   m/s2, n = 6 ; (f) v f = 30   m/s, a f = 0   m/s2, n = 6 .
Applsci 11 07287 g010
Table 1. The results of parameter calibration.
Parameter λ α β τ c
Value0.06410.07380.23312.69900.2
Publisher’s Note: MDPI stays neutral with regard to jurisdictional claims in published maps and institutional affiliations.

