Article

Variations in Wedge Earthquake Distribution along the Strike Underlain by Thermally Controlled Hydrated Megathrusts

1
State Key Laboratory of Tibetan Plateau Earth System, Resources and Environment (TPESRE), Institute of Tibetan Plateau Research, Chinese Academy of Sciences, Beijing 100101, China
2
College of Earth and Planetary Sciences, University of Chinese Academy of Sciences, Beijing 100049, China
3
Department of Geophysics, Yunnan University, Kunming 650091, China
*
Authors to whom correspondence should be addressed.
Appl. Sci. 2021, 11(16), 7268; https://doi.org/10.3390/app11167268
Submission received: 16 July 2021 / Revised: 5 August 2021 / Accepted: 5 August 2021 / Published: 6 August 2021
(This article belongs to the Special Issue Advances in Applied Geophysics)

Abstract

:

Featured Application

Resource and environmental effects.

Abstract

Accretionary wedge earthquakes usually occur in the overriding crust close to the trench or above the cold nose of the mantle wedge. However, the mechanism and temperature properties related to the slab dip angle remain poorly understood. Based on 3D thermal models to estimate the subduction wedge plate temperature and structure, we investigate the distribution of wedge earthquakes in Alaska, which has a varying slab dip angle along the trench. The horizontal distance of wedge-earthquake hypocenters significantly increases from the Aleutian Islands to south–central Alaska due to a transition from steep subduction to flat subduction. Slab dehydration inside the subducted Pacific plate indicates a simultaneous change in the distances between the intraslab metamorphic fronts and the Alaskan Trench at various depths, which is associated with the flattening of the Pacific plate eastward along the strike. The across-arc width of the wedge-earthquake source zone is consistent with the across-arc width of the surface high topography above the fully dehydrated megathrust, and the fluid upwelling spontaneously influences wedge seismotectonics and orogenesis.

1. Introduction

Subduction zone earthquakes are often detected in continental accretionary wedges close to trenches or in and around cold mantle wedges, while the distribution properties of continental/mantle wedge earthquakes (hereafter referred to as wedge earthquakes) related to slab dip variations remain poorly understood. The infiltration of fluids or melts derived from the subducted slab facilitates the generation of arc magma and earthquakes, including the Mélange diapirs that are physically mixed by sediments, fluids, and the mantle above the subducted slab [1]. Seismic scattering obstacles in the shallow mantle wedge of the subduction zone are reported to be delegated to the mélange diapirs or ascending melts or slab material directly associated with magma generation [1]. Plume generation is driven by the subduction of buoyant crustal rocks and the expulsion of aqueous slab fluids that cause the hydration and partial melting of the mantle wedge [2].
Instrumentally recorded arrival times to estimate an epicentral area centered at (−151.0°, 57.4°) offshore of Kodiak Island in Alaska suggest that active faults within the accretionary wedge may host various earthquakes [3]. The incoming deforming Pacific plate contacts an actively faulted overlying accretionary wedge, with megathrusts being capable of Mw > 9 earthquakes [3]. Plume development is enhanced by the hydration of the mantle wedge by volatiles released from the subducted slab, with the upward propagating hydration front that forms within the mantle wedge being a consequence of slab dehydration [4]. Tomographic results also show that low-velocity zones exist within the mantle wedge, with dimensional dynamic processes occurring in the mantle wedge, such as convection-controlled heterogeneous thermal structures and the nonuniform generation and migration of magmas [5].
According to observations, the distances of wedge-earthquake hypocenters from the trench are significantly different between the Aleutian Islands and south–central Alaska [6]. The Aleutian Islands are characterized by steep subduction, while south–central Alaska features quasi-flat subduction due to the presence of the Yakutat Block [7]. Slab dehydration occurring inside the incoming plate usually exhibits a variation in intraslab metamorphic front depths and loci separated from the convergent trench, as other subduction zones show and are commonly acknowledged [8]. Associated with the late flattening of the Pacific from west to east, the change in the slab dip angle and clustered zones of wedge earthquakes is noticeable, while the details are still elusive. It seems that the underlying thermally controlled hydrated Pacific plate plays a key role in determining the distribution of wedge earthquakes. However, the hydrothermal state of the megathrusts underlying the accretionary/mantle wedge itself is enigmatic. This becomes a primary issue to clarify.
Among various subduction zones, Alaska is typical because of its notably increasing dip angles along the trench, which present a good chance to study the variation in the subducted plate thermal state and distribution of wedge earthquakes along the trench. The contrasting topographies of the Pacific plate beneath south–central and southwest Alaska depend on the effects of variable factors, including potential fluid upwelling [6]. Therefore, in this paper, we use a 3D modeling method to investigate the distributed wedge-earthquake distribution underlain by particular hydrothermal state variables along the strike beneath trenchward Alaska.

2. Materials and Methods

In this study, our models were originally developed from stag3d [9]. An anelastic liquid approximation and the equations of conservation of mass, momentum, and energy [10] are used based on finite difference method. Based on the plate age and motion field mimicked for subducted curved plates [10,11], we construct three-dimensional (3-D) thermomechanical models to estimate the thermal state-based distribution of wedge earthquakes in Alaska. Subducted oceanic plate geometry was incorporated into the model using Slab2 [12]. The intraslab subduction velocity field used MORVEL [13,14] and interpolated the entire domain for the Pacific slab. The ocean seafloor ages of EarthByte [15] are used as an input of trenchward boundary conditions based on the plate cooling model [16,17] (Figure 1). The thickness of the marine lithosphere was specified according to oceanic lithosphere age [18]. We prescribe the subduction time to be 20 Myr to ensure that the oceanic lithosphere thrusts to reach a steady thermal state. The modeling results are constrained by the observations of surface heat flow from the global heat flow database [19] and the estimate from Curry depth [20] along the parallel profiles across the arc. The thermal model is prescribed with a size of 1600 × 800 × 400 km (width × length × depth); the model grids are 80 × 80 × 100. The model includes the updated 3D geometry [12] and subduction velocity of the Pacific plate underlying the North American plate. The mechanical boundary conditions are as follows: the top boundary is rigid (dirichlet) and the bottom boundary is permeable (neumann) in the vertical direction; lateral boundaries are also permeable (neumann) except for the lateral boundaries, which have prescribed a time-dependent subduction velocity. Viscous decoupling is not included on the megathrust since the frictional heating is not robustly identified from the observation of surface heat flow. The evolving thermal structure of the subducting lithosphere is obtained from the calculated result of thermal modeling, which depends on the properties of the slab geometry, the age of the subduction plate, and the history of the subduction zone.
Based on Omori et al. [21] and Hacker et al. [22], we use a P-T-wt %-facies database to estimate the fluid upwelling sources on Alaskan megathrusts. The pressure (GPa) at every grid point is obtained by converting its depths (km) through preliminary reference earth model (PREM) parameters. Using the temperature and pressure provided by the numerical simulation, we estimate each rock facies (the mid-ocean ridge basalt and ultramafic rock) domain and the corresponding water content (wt %) at every grid. Through the interpolation method, we obtain the intraslab water content distribution (wt %) at various depths. The water content value difference between two neighboring points divided by interval distance reflecting slab dehydration (wt %/km) is obtained at each point.
In this study, we focus on specific observations of wedge earthquakes and their underlying thermal and hydrous states in the Alaskan tectonic complex. To investigate the way the subduction regime controls or affects the distribution of continental wedge earthquakes, we focus on how the dip and slab geometry influence wedge quake distribution. The wedge earthquakes detected from 1 January 2000 to 31 December 2010 are employed in this study. The historical M > 7 earthquakes are also included.

3. Results

3.1. Constrained Thermal Regime Beneath the Alaskan Continental Wedge

Two-dimensional thermal models have been constructed with nonlinear mantle rheology to study 17 global subduction zones, including the Alaskan subduction zone [23]. The models incorporate slab mantle (or interplate) decoupling, which has been suggested to apply to NE Japan [24,25] based on the hypothesis that the observed surface heat flow above the cold forearc mantle is low in contrast to the hot arc and backarc mantle [23,26]. However, this slab-mantle (or interplate) decoupling hypothesis relies on limited observations in NE Japan and Cascadia. The new development of surface heat flow measurements has included bottom-simulating reflectors [27,28], terrestrial boreholes and marine heat probes [29,30], and Hi-net boreholes [31], which are not used in Furukawa [24] but indicate the presence of forearc medium-high heat flow values (50–140 or 150 mW/m2) located in NE Japan and Cascadia (Figure 2), which implies a much warmer forearc mantle than previously thought. Therefore, plate decoupling in thermal modeling, which significantly affects the subduction thermal regime, is still controversial. The thermal results are shown in Figure 3c,d. We found that the thermal models without plate decoupling result in a subduction regime via calculation, which better fits the observation of surface heat flow and seismicity distribution. Therefore, we suggest constraining the modeled thermal regime primarily by the integrated and updated observations for surface heat flow, which include the observations from bottom-simulating reflectors [27,28], terrestrial boreholes and marine heat probes [29,30], Hi-net boreholes [31], and Currie depths [20]. The Currie depth estimation [20] data cover global subduction zones and are a good reference for calculating the thermal regime on the shallow megathrusts.
Compared with the result of temperature variation along the profile crossing the Augustine volcano (Figure 3) [23] in Alaska, we found that the slab geometry updated in Alaska by Slab2.0 [12] provides a high-resolution slab topography involving a slab depth of 100-–115 km beneath the Augustine volcano, while the slab geometry [32] obtained by using seismic reflection and refraction data and earthquake distribution suggests a slab depth beneath Augustine volcano of approximately 85 km, as adopted by Wada and Wang [23] (Figure 3). This geometric difference greatly affects the calculated subduction thermal regime. In addition, the interplate temperature predicted by our models gradually rises from 300 to 800 °C with increasing depth, while the plate decoupling mode artificially creates an abrupt slab surface temperature increase from 400–600 °C to 800–1100 °C beneath the hot arc [23]. The abrupt increase in slab surface temperature makes it difficult to interpret the observation of forearc medium-high surface heat flow and the occurrence of subarc interplate earthquakes.
Furthermore, the intraslab temperature contours are quite different between the plate decoupling and plate-coupling models. The oval edge of the intraslab geotherm (Figure 3d) is usually observed in warm or plate coupling subduction zones, whereas the parallel layered intraslab thermal structure is often exhibited in cold or plate decoupling subduction zones (e.g., in [23]), which implies a very weak forearc mantle thermal effect on the slab due to the presence of a prescribed slab–mantle decoupling layer (Figure 3). The parallel layered intraslab thermal structure leads to slab dehydration over a wide range of depths (e.g., [23,33,34]), which in turn needs to focus the slab-produced fluid flow toward a subarc mantle at a depth of 100 km [35]. For example, compaction pressure gradients can be introduced to enhance the upslope flow within high-permeability layers in the slab [35]. However, the oval edge of the intraslab geotherm naturally leads to focused slab dehydration and fluid production at a narrower range of depths without having to modify the subarc upslab fluid migration pathways (e.g., Figure 3); i.e., the thermal front could focus the slab-derived fluids at a narrow range of depths without having to modify the subarc upslab fluid migration pathways.
In addition, the global range of subduction zone thermal structures from exhumed blueschists and eclogites is identified to be commonly hotter than the models in Syracuse et al. [36] and updated van Keken (pers. comm. by Penniston-Dorland, 2014 [37]) by more than 200 °C when Pmax < 2 GPa [37]. The reason is that the control of the slab-mantle decoupling setting in the aforementioned modeling is unrealistic, which decreases the forearc slab surface temperature by 100–300 °C. In contrast, the thermal models without plate decoupling predict the slab temperatures and better fit the observed temperature of exhumed blueschist and eclogite rocks recorded.
On the other hand, 3D models are further jointly constrained by a variety of morphologically controlling factors, such as along-strike plate motion and toroidal mantle flow variation, which are not included in 2D thermal models. The observed toroidal mantle flow in the case of oblique subduction changes the slab surface temperature at a scale of >0–20 °C, as we find in the comparison between the results of the 2D and 3D models.
Consequently, the 3D thermal regime constrained by the various observations of surface heat flow, including Currie depth estimations and the prescribed plate coupling setting, is better at predicting the thermal state of the underlain subducted megathrust beneath the wedge.

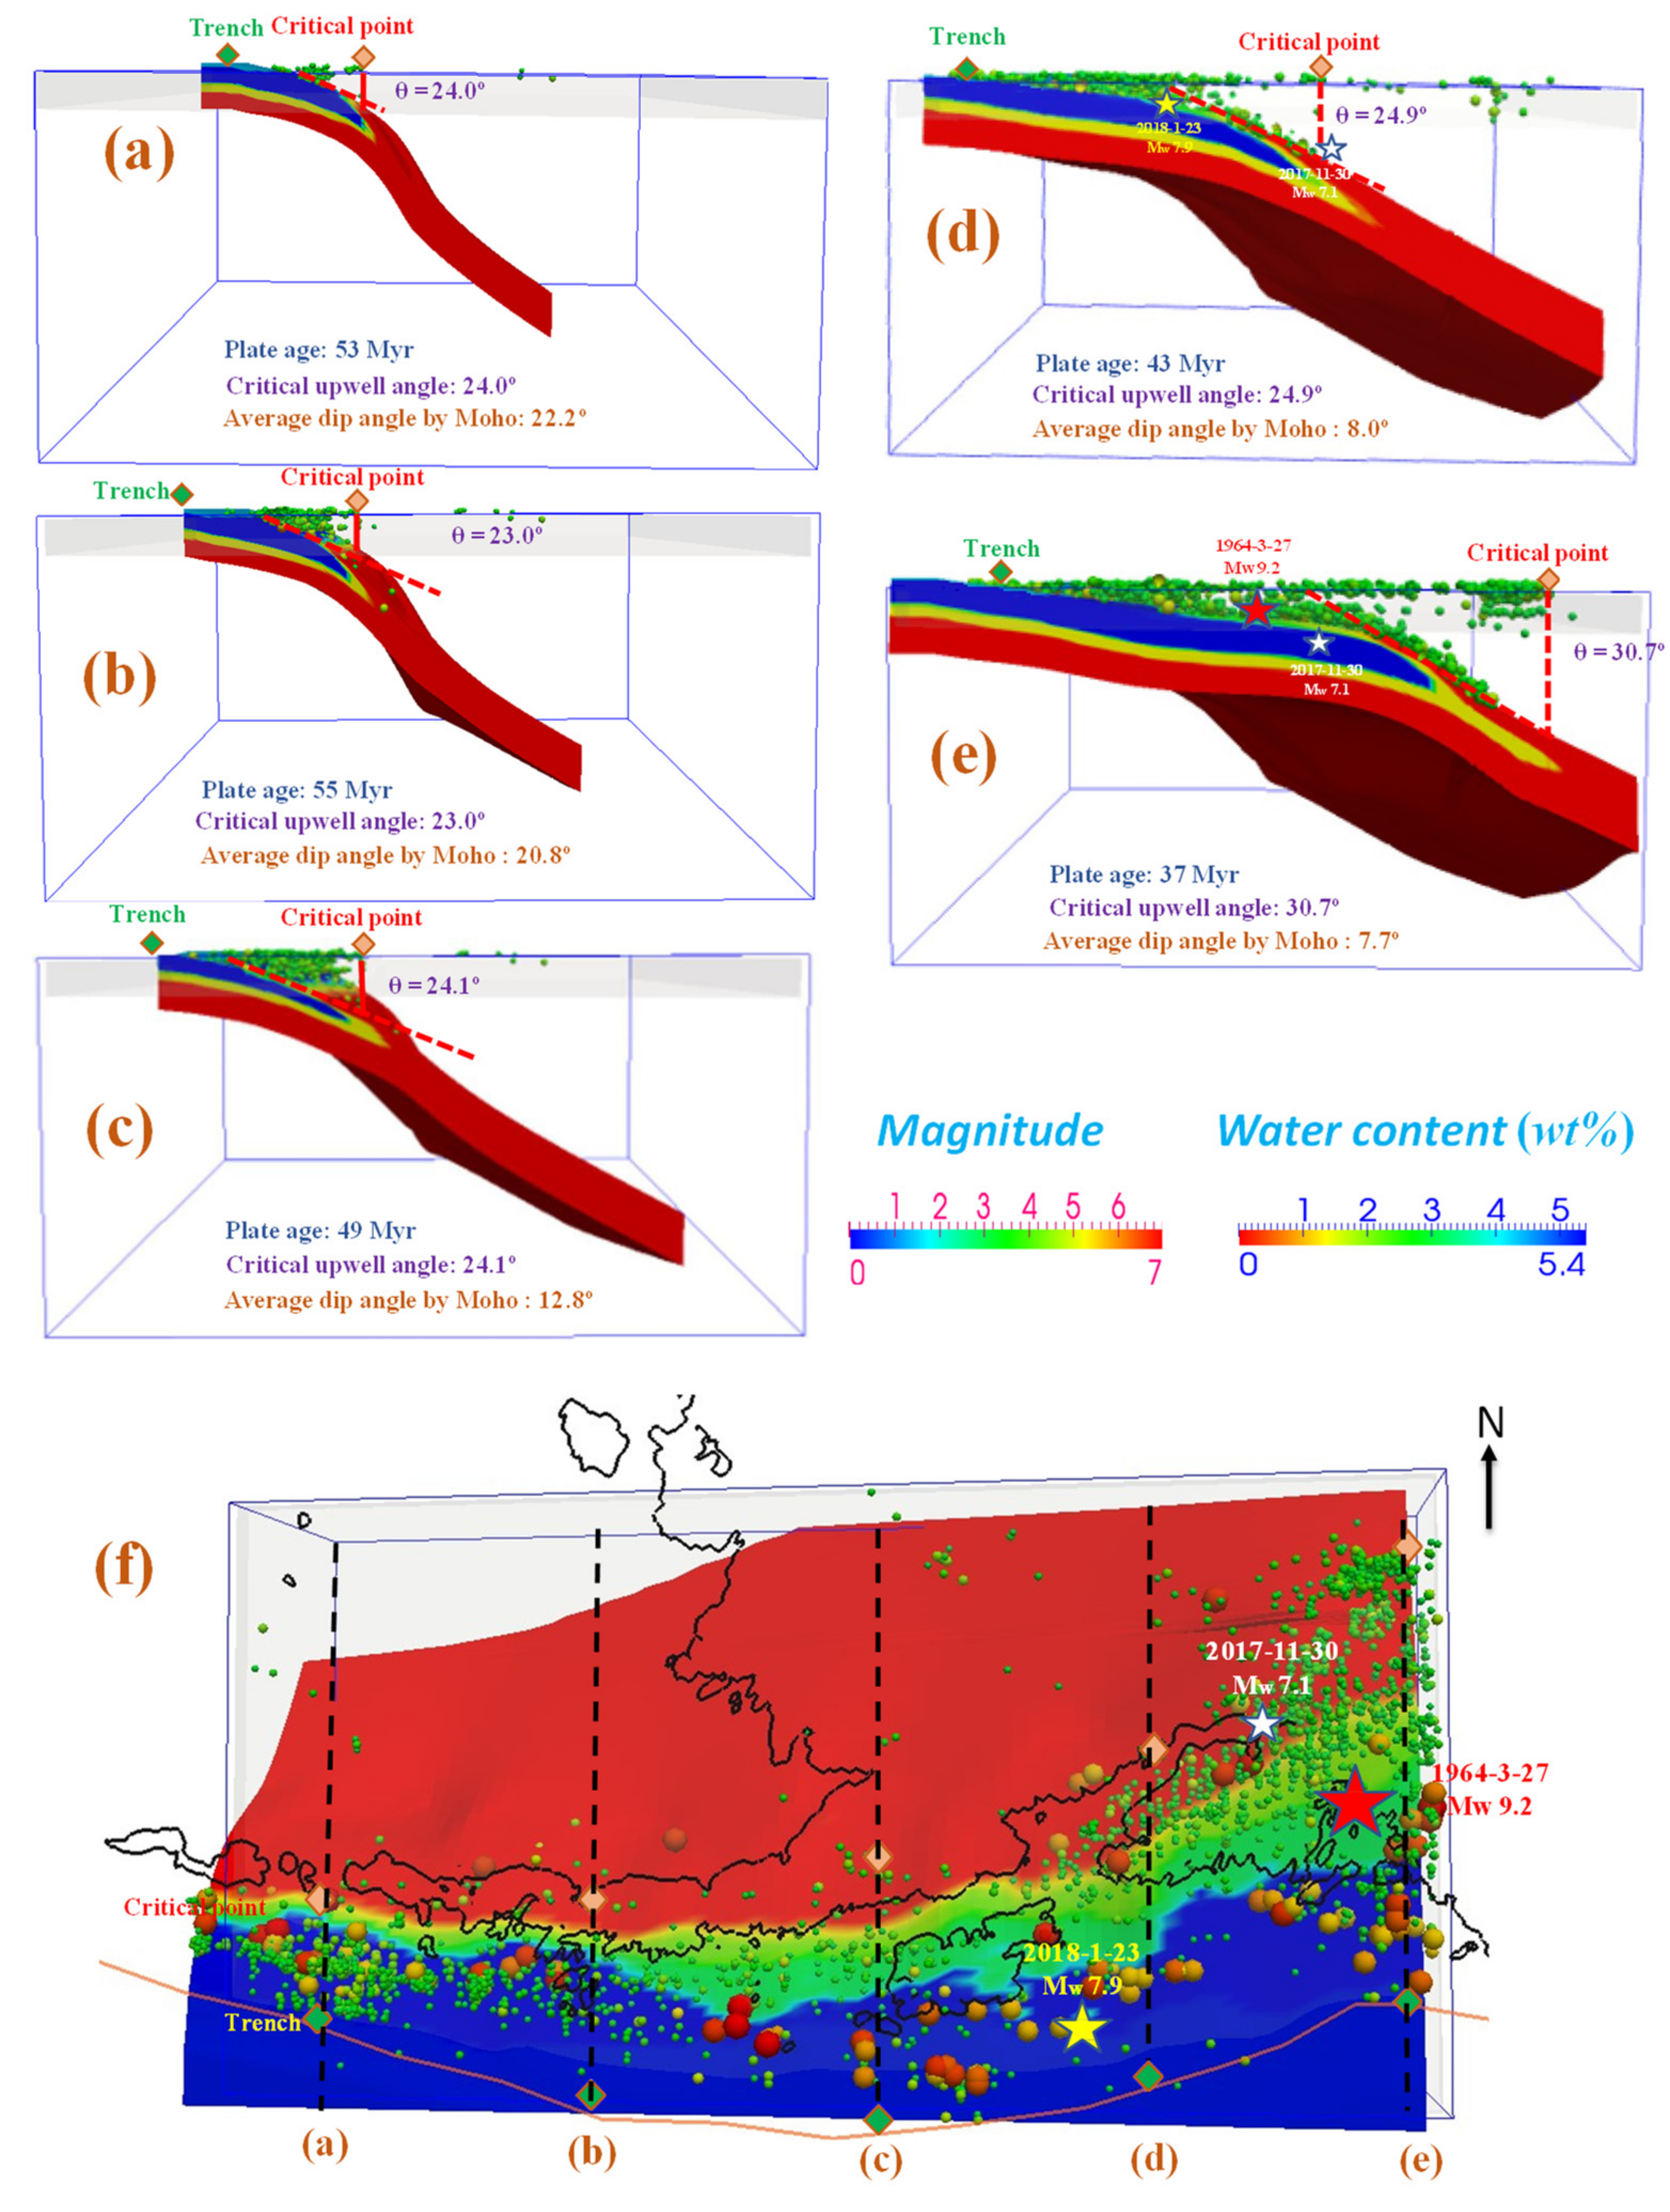
3.2. Variations in Wedge-Earthquake Distribution along the Strike

Based on the 3D thermal regime and subsequently calculated water content of the subducted Pacific plate beneath Alaska (Figure 4), we investigate how the slab dip change influences wedge quake distribution. The facies of MORB and ultramafic rocks represented by colors are shown in the figure. A comparison between the two wedge seismic events reveals a characteristic distribution: the wedge earthquakes are located primarily coinciding with the Pacific plate interface depth of <60–100 km (Figure 4). In the western part of the model, the Alaska Peninsula, the furthest wedge-earthquake hypocenter from the continental margin, is approximately atop the 60 km-deep Pacific plate surface, while that in the eastern part, southern Alaska, is above the 100 km-deep plate surface, although the clustered far inland crustal earthquakes there are partly (<60%) due to the aftershocks of some large earthquakes. Therefore, the difference between the western and eastern parts is attributable to the subduction angle decreasing eastward along the strike, and the distance of the slab dehydration front from the trench in the dipping direction increases gradually eastward. By modeling the mantle wedge in Alaska, the thermal structure calculated by other studies indicates that the mantle wedge near the subduction plate is widely hydrated (e.g., [38]), which is consistent with our estimation of the hydrated megathrust in Figure 4. Therefore, the dehydration of the subducted plate from the water-saturated updip portions on megathrust (blue zones in Figure 4 to lower water content downdip interface portions (yellow to red zones)) will certainly release water-rich fluids, which may in turn hydrate the mantle wedge and trigger the melting of the mantle wedge above the dehydrated megathrust. Then, the water-rich fluids carried away are transported to the surface by upwelling [39]. Accordingly, the wedge-earthquake distribution in Alaska may indicate a pathway for flux melt or fluid upwelling from the subduction channel, although the diapirs formed in accretionary wedges are complicated, and the infiltration of fluids or melts in Mélange diapirs are physically mixed by various components, such as sediments, fluids, altered oceanic crust, and mantle materials [1]. In particular, the upwelling angle is suggested to be primarily controlled by the oceanic plate subduction angle and then further affected by the inclination of the diapirs and faults inside the wedge, as we have demonstrated through detailed investigation of the distribution of wedge earthquakes in Alaska (Figure 4).

4. Discussion

Wedge earthquakes are also related to subduction-related surface topography formation (e.g., [41]) because plume/melt upwelling affects seismotectonics and orogenesis spontaneously. According to a numerical modeling study of a subduction zone, Horton [40] proposed that subduction at a shallow angle facilitates the uplift of a continental plateau, while subduction at a large angle contributes to the formation of a mountain or island. Previous studies also widely support that small angle subduction prefers the formation of a wide continental high topography, as a small portion of the continental crust closest to the margin possibly partitions due to the shallow subduction dip (e.g., [42]). In Alaska, shallow subduction in south–central Alaska results in fluid/molten upwelling landward, where the Alaska range uplifts and evolves landward. The steep subduction in the Alaska Peninsula causes mineral upwells limited in a narrow cross-strike width, which results in the formation of island arcs such as the Alaska Peninsula and the Aleutian Islands.
Small dip angle subduction of the cold lithosphere facilitates the fluid/melt rising in the continental wedge compared with the large dip angle oceanic plate. In addition, plate collision and subsequent upward extruding force both contribute to the formation of magma chambers or transcrustal magmatic that originates from melt processing in the deep crust [43], which facilitates the construction of an uplifted continental plateau. A broad forearc high, such as a large mountain system or continental plateau, an accretionary prism, and a shallow trench, is evidenced by south–central Alaska. On the other hand, when the slab dip angle increases to 20°–30°, mountains or island arcs are generated due to a limited cross-arc width for slab metamorphism and exhumation to the surface close to the trench, such as the Aleutian and Alaska Peninsulas. The frictional strength of the sediments and serpentinized peridotite exert a large control on the dip angle of the subduction interface at seismogenic depths [44]. In the high friction case, the subduction interface is steep, the trench is deeper, and the accretionary prism, forearc high, and basin are all absent [44]. In Alaska, the dip angle is greatly determined by the plate age (via the temperature and density comparison between two coupled plates), as shown in Figure 5. The reason that a broad forearc high is constructed by a shallow dip angle may be attributed to the extrusion effect brought by the incoming oceanic plate and the subsequent upwelling controlled by the dip angle. The Alaska Peninsula and the Fox Islands in the Aleutian Islands characterize an older oceanic plate age of approximately 50 Myr and a larger dip angle (12°–27°) at Moho depth compared with the Alaska range uplift in south-central Alaska, caused by a younger plate (approximately 40 Myr) and a smaller dip angle (7.7°).
Consequently, wedge earthquakes in Alaska are characterized by a distance to the trench transitioning from small (steep subduction) to large (flat subduction), which is likely determined by the slab surface depth of 60–100 km, where the slab is fully dehydrated and subsequently hydrates the above mantle wedge and crust, generating clustered wedge earthquakes in Alaska. Slab dehydration induces plume upwelling, which not only facilitates wedge seismic events but also alters the surface topography over a geological time scale. The farthermost point of the hypocenter of wedge earthquakes from the trench is determined by the slab dip angle and the slab surface depth of 60 km. Thus, the fluid upwelling pathway is decided by the inclination angle of faults and diapirs, contributing to fluid migration in the wedge, which facilitates fault slip and elevates in situ potential seismic risks. Therefore, the across-arc width of the wedge-earthquake source zone is consistent with the across-arc width of the surface high topography above the entirely dehydrated plate interface, because plume upwelling spontaneously influences forearc seismotectonics and orogenesis. The shallow slab dip facilitates the formation of a high forearc plateau, and wedge earthquakes widely span from the trench to the farthermost inland (with an interface depth of 100 km), which supports that wedge earthquakes are likely the by-product (energic and material circulating product) of the tectonic formation process of the forearc region of active plate subduction zones, which is evidenced by the observations in subduction zones.

5. Conclusions

Through modeling the thermal state of subducted Alaskan megathrusts and 3D comparison with the wedge earthquakes distribution, we concluded the following:
(1)
The subduction thermal regime constrained by the observations of surface heat flow, including Currie depth estimations without plate decoupling, well interprets the thermal state of the underlain subducted plate beneath the wedge wherein earthquakes occurred.
(2)
The distribution of wedge-earthquake variations in Alaska features a transition from steep subduction to flat subduction associated with different subduction hydrothermal states and fluids released. The farthermost point of the hypocenter of wedge earthquakes from the trench is determined by the slab dip angle and the slab surface depth of 60 km.
(3)
The across-arc width of the wedge-earthquake source zone is consistent with the across-arc width of the surface high topography above the entirely dehydrated plate interface, and the fluid upwelling spontaneously influences forearc seismotectonics and orogenesis.

Author Contributions

Conceptualization, methodology, software, validation, resources, data curation, Y.J.; formal analysis, investigation, R.Q., W.Z.; writing-original draft preparation, R.Q.; writing-review and editing, visualization, supervision, project administration, and funding acquisition, Y.J. All authors have read and agreed to the published version of the manuscript.

Funding

This research was funded by financial support from the Second Tibetan Plateau Scientific Expedition and Research Program (2019QZKK0708) and the CAS Pioneer Hundred Talents Program.

Institutional Review Board Statement

Not applicable.

Informed Consent Statement

Not applicable.

Acknowledgments

We are grateful to P. Tackley for sharing the original code of stag3d developed in this study. We also thank IRIS for the earthquake catalog.

Conflicts of Interest

The authors declare no conflict of interest.

References

  1. Lin, C.-H.; Shih, M.-H.; Lai, Y.-C. Mantle wedge diapirs detected by a dense seismic array in Northern Taiwan. Sci. Rep. 2021, 11, 1–12. [Google Scholar]
  2. Gerya, T.V.; Connolly, J.A.; Yuen, D.A.; Gorczyk, W.; Capel, A.M. Seismic implications of mantle wedge plumes. Phys. Earth Planet. Inter. 2006, 156, 59–74. [Google Scholar] [CrossRef]
  3. Tape, C.; Sykes, L.; Lomax, A. The 1900 M w 7.6–8.0 Earthquake Offshore of Kodiak Island, Alaska. Bull. Seismol. Soc. Am. 2021, 111, 1080–1109. [Google Scholar]
  4. Gerya, T.V.; Stöckhert, B.; Perchuk, A.L. Exhumation of high-pressure metamorphic rocks in a subduction channel: A numerical simulation. Tectonics 2002, 21, 6-1–6-19. [Google Scholar] [CrossRef] [Green Version]
  5. Tamura, Y.; Tatsumi, Y.; Zhao, D.; Kido, Y.; Shukuno, H. Hot fingers in the mantle wedge: New insights into magma genesis in subduction zones. Earth Planet. Sci. Lett. 2002, 197, 105–116. [Google Scholar] [CrossRef]
  6. Martin-Short, R.; Allen, R.; Bastow, I.D.; Porritt, R.W.; Miller, M.S. Seismic imaging of the Alaska subduction zone: Implications for slab geometry and volcanism. Geochem. Geophys. Geosyst. 2018, 19, 4541–4560. [Google Scholar] [CrossRef]
  7. Worthington, L.L.; Van Avendonk, H.J.; Gulick, S.P.; Christeson, G.L.; Pavlis, T.L. Crustal structure of the Yakutat terrane and the evolution of subduction and collision in southern Alaska. J. Geophys. Res. Solid Earth 2012, 117. [Google Scholar] [CrossRef]
  8. Arcay, D.; Tric, E.; Doin, M.-P. Numerical simulations of subduction zones: Effect of slab dehydration on the mantle wedge dynamics. Phys. Earth Planet. Inter. 2005, 149, 133–153. [Google Scholar] [CrossRef]
  9. Tackley, P.J.; Xie, S. STAG3D: A code for modeling thermo-chemical multiphase convection in Earth’s mantle. In Computational Fluid and Solid Mechanics; Elsevier Science Ltd.: Amsterdam, The Netherlands, 2003; pp. 1524–1527. [Google Scholar]
  10. Ji, Y.; Yoshioka, S.; Matsumoto, T. Three-dimensional numerical modeling of temperature and mantle flow fields associated with subduction of the Philippine Sea plate, southwest Japan. J. Geophys. Res. Solid Earth 2016, 121, 4458–4482. [Google Scholar] [CrossRef]
  11. Ji, Y.; Yoshioka, S.; Manea, V.C.; Manea, M.; Matsumoto, T. Three-dimensional numerical modeling of thermal regime and slab dehydration beneath Kanto and Tohoku, Japan. J. Geophys. Res. Solid Earth 2017, 122, 332–353. [Google Scholar] [CrossRef] [Green Version]
  12. Hayes, G.P.; Moore, G.L.; Portner, D.E.; Hearne, M.; Flamme, H.; Furtney, M.; Smoczyk, G.M. Slab2, a comprehensive subduction zone geometry model. Science 2018, 362, 58–61. [Google Scholar] [CrossRef]
  13. DeMets, C.; Gordon, R.G.; Argus, D.; Stein, S. Current plate motions. Geophys. J. Int. 1990, 101, 425–478. [Google Scholar] [CrossRef] [Green Version]
  14. DeMets, C.; Dixon, T.H. New kinematic models for Pacific-North America motion from 3 Ma to present, I: Evidence for steady motion and biases in the NUVEL-1A model. Geophys. Res. Lett. 1999, 26, 1921–1924. [Google Scholar] [CrossRef] [Green Version]
  15. Müller, R.D.; Sdrolias, M.; Gaina, C.; Roest, W.R. Age, spreading rates, and spreading asymmetry of the world’s ocean crust. Geochem. Geophys. Geosyst. 2008, 9. [Google Scholar] [CrossRef]
  16. Stein, C.A.; Stein, S. A model for the global variation in oceanic depth and heat flow with lithospheric age. Nature 1992, 359, 123–129. [Google Scholar] [CrossRef]
  17. Grose, C.J.; Afonso, J.C. Comprehensive plate models for the thermal evolution of oceanic lithosphere. Geochem. Geophys. Geosyst. 2013, 14, 3751–3778. [Google Scholar] [CrossRef]
  18. Yoshii, T. Regionality of group velocities of Rayleigh waves in the Pacific and thickening of the plate. Earth Planet. Sci. Lett. 1975, 25, 305–312. [Google Scholar] [CrossRef]
  19. Pollack, H.N.; Hurter, S.J.; Johnson, J.R. Heat flow from the Earth’s interior: Analysis of the global data set. Rev. Geophys. 1993, 31, 267–280. [Google Scholar] [CrossRef]
  20. Li, C.-F.; Lu, Y.; Wang, J. A global reference model of Curie-point depths based on EMAG2. Sci. Rep. 2017, 7, 1–9. [Google Scholar] [CrossRef]
  21. Omori, S.; Kita, S.; Maruyama, S.; Santosh, M. Pressure–temperature conditions of ongoing regional metamorphism beneath the Japanese Islands. Gondwana Res. 2009, 16, 458–469. [Google Scholar] [CrossRef]
  22. Hacker, B.R.; Abers, G.A.; Peacock, S.M. Subduction factory 1. Theoretical mineralogy, densities, seismic wave speeds, and H2O contents. J. Geophys. Res. Solid Earth 2003, 108. [Google Scholar] [CrossRef]
  23. Wada, I.; Wang, K. Common depth of slab-mantle decoupling: Reconciling diversity and uniformity of subduction zones. Geochem. Geophys. Geosyst. 2009, 10. [Google Scholar] [CrossRef]
  24. Furukawa, Y. Depth of the decoupling plate interface and thermal structure under arcs. J. Geophys. Res. Solid Earth 1993, 98, 20005–20013. [Google Scholar] [CrossRef]
  25. Peacock, S.M.; Wang, K. Seismic consequences of warm versus cool subduction metamorphism: Examples from southwest and northeast Japan. Science 1999, 286, 937–939. [Google Scholar] [CrossRef] [Green Version]
  26. Wada, I.; Wang, K.; He, J.; Hyndman, R.D. Weakening of the subduction interface and its effects on surface heat flow, slab dehydration, and mantle wedge serpentinization. J. Geophys. Res. Solid Earth 2008, 113. [Google Scholar] [CrossRef]
  27. Ashi, J.; Tokuyama, H.; Ujiie, Y.; Taira, A. Heat flow estimation from gas hydrate BSRs in the Nankai Trough: Implications for thermal structures of the Shikoku Basin. EOS Trans. AGU 1999, 80, F929–F930. [Google Scholar]
  28. Ashi, J.; Tokuyama, H.; Taira, A. Distribution of methane hydrate BSRs and its implication for the prism growth in the Nankai Trough. Mar. Geol. 2002, 187, 177–191. [Google Scholar] [CrossRef]
  29. Tanaka, A. Geothermal gradient and heat flow data in and around Japan (II) Crustal thermal structure and its relationship to seismogenic layer. Earth Planets Space 2004, 56, 1195–1199. [Google Scholar] [CrossRef] [Green Version]
  30. Tanaka, A.; Yamano, M.; Yano, Y.; Sasada, M. Geothermal gradient and heat flow data in and around Japan (I): Appraisal of heat flow from geothermal gradient data. Earth Planets Space 2004, 56, 1191–1194. [Google Scholar] [CrossRef] [Green Version]
  31. Matsumoto, T. Terrestrial heat flow distribution in Japan area based on the temperature logging in the borehole of NIED Hi-net. In Proceedings of the AGU Fall Meeting Abstracts, San Francisco, CA, USA, 10–14 December 2007. Abstract ID T23A-1217. [Google Scholar]
  32. Oleskevich, D.; Hyndman, R.; Wang, K. The updip and downdip limits to great subduction earthquakes: Thermal and structural models of Cascadia, south Alaska, SW Japan, and Chile. J. Geophys. Res. Solid Earth 1999, 104, 14965–14991. [Google Scholar] [CrossRef]
  33. Van Keken, P.E.; Kiefer, B.; Peacock, S.M. High-resolution models of subduction zones: Implications for mineral dehydration reactions and the transport of water into the deep mantle. Geochem. Geophys. Geosyst. 2002, 3, 1–20. [Google Scholar] [CrossRef]
  34. Van Keken, P.E.; Wada, I.; Abers, G.A.; Hacker, B.R.; Wang, K. Mafic high-pressure rocks are preferentially exhumed from warm subduction settings. Geochem. Geophys. Geosyst. 2018, 19, 2934–2961. [Google Scholar] [CrossRef] [Green Version]
  35. Wilson, C.R.; Spiegelman, M.; van Keken, P.E.; Hacker, B.R. Fluid flow in subduction zones: The role of solid rheology and compaction pressure. Earth Planet. Sci. Lett. 2014, 401, 261–274. [Google Scholar] [CrossRef]
  36. Syracuse, E.M.; van Keken, P.E.; Abers, G.A. The global range of subduction zone thermal models. Phys. Earth Planet. Inter. 2010, 183, 73–90. [Google Scholar] [CrossRef]
  37. Penniston-Dorland, S.C.; Kohn, M.J.; Manning, C.E. The global range of subduction zone thermal structures from exhumed blueschists and eclogites: Rocks are hotter than models. Earth Planet. Sci. Lett. 2015, 428, 243–254. [Google Scholar] [CrossRef] [Green Version]
  38. Ponko, S.C.; Peacock, S.M. Thermal modeling of the southern Alaska subduction zone: Insight into the petrology of the subducting slab and overlying mantle wedge. J. Geophys. Res. Solid Earth 1995, 100, 22117–22128. [Google Scholar] [CrossRef]
  39. Zhao, D.; Yu, S.; Liu, X. Seismic anisotropy tomography: New insight into subduction dynamics. Gondwana Res. 2016, 33, 24–43. [Google Scholar] [CrossRef] [Green Version]
  40. Siebert, L.; Simkin, T.; Kimberly, P. Volcanoes of the World; University of California Press: Berkeley, CA, USA, 2010. [Google Scholar]
  41. Horton, B.K. Tectonic regimes of the central and southern Andes: Responses to variations in plate coupling during subduction. Tectonics 2018, 37, 402–429. [Google Scholar] [CrossRef]
  42. Schütt, J.M.; Whipp, D.M. Controls on continental strain partitioning above an oblique subduction zone, Northern Andes. Tectonics 2020, 39, e2019TC005886. [Google Scholar] [CrossRef] [Green Version]
  43. Cashman, K.V.; Sparks, R.S.J.; Blundy, J.D. Vertically extensive and unstable magmatic systems: A unified view of igneous processes. Science 2017, 355, eaag3055. [Google Scholar] [CrossRef] [Green Version]
  44. Tan, E.; Lavier, L.L.; Van Avendonk, H.J.; Heuret, A. The role of frictional strength on plate coupling at the subduction interface. Geochem. Geophys. Geosyst. 2012, 13. [Google Scholar] [CrossRef]
Figure 1. Study region in Alaska. Seafloor age and surface heat flow observations in Alaska are included. The colored solid circles represent the observed surface heat flow obtained from the global heat flow database [19]. The ocean seafloor age and its distribution are provided by EarthByte [15]. The light blue dotted line indicates the model boundary. The red (inside the model region) and purple (outside the model region) curves represent iso-depth contours of the upper surface of the subducted oceanic plate, with two adjacent lines separated by 20 km (Slab2) [12].
Applsci 11 07268 g001
Figure 2. Integrated heat flow observations were based on the Global Heat Flow Database [19] and further combined with bottom-simulating reflectors [27,28], terrestrial boreholes, marine heat probes [29,30], and Hi-net boreholes [31]. The integrated observation of surface heat flow in NE Japan shows gradually changing values from the cold trench to the hot arc and then to the medium backarc. However, we found a forearc medium heat flow region (50–140/150 mW/m2) in NE Japan and Cascadia, indicating that plate coupling occurs at a forearc depth of 40–80 km. The plate decoupling hypothesis is not robustly constrained by heat flow observations. (a) Northeast Japan. (b) Cascadia.
Applsci 11 07268 g002
Figure 3. Comparison between our model result and Wada and Wang [23]. Black curves and symbols are from Wada and Wang [23], while yellow curves (slab surface) and red curves (intraslab thermal contours) are from this study. (a) The profile used to estimate the cross-section thermal structure in Alaska by 2-D model [23]. (b) Obtained the same profile from our 3-D model. (c) Cross-section thermal structure along the same profile in this study. (d) Slab geometry difference and modeled thermal result difference between Wada and Wang [23] and this study.
Applsci 11 07268 g003
Figure 4. Wedge earthquakes in Alaska. Slab color indicates water content (wt %) distribution. The colored spheres indicate all M > 3 earthquakes (IRIS) in the North American plate from 1 January 2000 to December 2010 and all M > 5.5 earthquakes from 1 January 1900 to December 2000 (Centennial Database). The black curve on the surface represents the coast. Red cones indicate active arc volcanoes [40]. Yellow ellipses indicate clustered continental wedge earthquakes. (a) View of the 3D model from the west. (b) View of the 3D model from the east.
Applsci 11 07268 g004
Figure 5. Wedge-earthquake distribution along five profiles (ae) perpendicular to the margin from west to east. Slab color indicates the water content (wt %) distribution, which are the same with Figure 4. (ae) Cross-section of wedge-earthquake distribution along a profile. (f) Distribution of profiles (ae). The black dashed lines indicate the a–e profiles. Dimension scale and orientations of profiles are exhibited in (f).
Applsci 11 07268 g005
Publisher’s Note: MDPI stays neutral with regard to jurisdictional claims in published maps and institutional affiliations.

