Abstract
Faults represent important analytical targets for the identification of perceptual ground motions and associated seismic hazards. In particular, during oil production, important data such as the path and flow rate of fluid flows can be obtained from information on fault location and their connectivity. Seismic attributes are conventional methods used for fault detection, whereby information obtained from seismic data are analyzed using various property processing methods. The analyzed data eventually provide information on fault properties and imaging of fault surfaces. In this study, we propose an efficient workflow for fault detection and extraction of requisite information to construct a fault surface model using 3D seismic cubes. This workflow not only improves the ability to detect faults but also distinguishes the edges of a fault more clearly, even with the application of fewer attributes compared to conventional workflows. Thus, the computing time of attribute processing is reduced, and fault surface cubes are generated more rapidly. In addition, the reduction in input variables reduces the effect of the interpreter’s subjective intervention on the results. Furthermore, the clustering method can be applied to the azimuth and dip of the fault to be extracted from the complexly intertwined fault faces and subsequently imaged. The application of the proposed workflow to field data obtained from the Vincentian oil field in Australia resulted in a significant reduction in noise compared to conventional methods. It also led to clearer and continuous edge detection and extraction.
1. Introduction
Fractures are formed when the magnitude of stress exceeds the strength of a rock, thereby causing the rock to diverge in a particular direction. A fracture refers to a fault in which the relative rock displacement is parallel to the fracture direction and/or a joint in which there is negligible relative rock displacement [1]. In particular, faults are important analytical targets for the identification of perceptual ground motion and associated seismic hazards [2,3,4,5]. It is also important to understand the sub-surface destructive connectivity in fluid flow path analysis [6,7,8]. The interpretation of the fault system is performed using structural and seismic attributes (including similarity, semblance, maximum curvature, and amplitude volumes) that can emphasize differences in seismic properties (amplitude, frequency, and phase) [9]. Seismic attributes are one of the most widely used means of detecting faults [10,11]. They provide analytical and quantitative measurements of data using 3D visualization [12] or machine learning techniques [13], thereby improving the analysis of information obtained from seismic data.
However, the process of detecting and characterizing faults from seismic amplitude data is time-consuming [14,15]. In general, several manual tasks are performed by interpreters to draw faults over raw seismic images. In addition, there are problems associated with significant variation in interpretation according to the interpreter’s experience [16,17,18,19,20]. Therefore, several technologies and tools have been developed to reduce the time taken for data processing of raw seismic data and minimize the impact of the interpreters [21].
The coherence measurement method used for geometric and hierarchical discontinuous surface analysis was proposed by Bahorich and Farmer [14]. Subsequently, several such studies were performed based on different parameters such as semblance [22], eigenstructure [23,24], gradient structure tensor [25], similarity [10,26], variance [27], automated fault extraction [28], and directional structure–tensor coherence [29]. However, these methods are typically vulnerable to noisy data, which is problematic.
Image processing is the task of improving and extracting useful information from a given source. In seismic studies, amplitude images are primarily used, which are applied to fault detection through various attributes. Edge detection has been put forward to effectively locate discontinuities using differences between seismic traces [30]. Attributes such as ant tracking [31] and Hough transform [32] have been proposed for edge detection and enhancement.
A conventional fault-detection workflow using the aforementioned techniques is shown in Figure 1. A widely used method based on seismic attributes consists of the following parts: conditioning, edge detection, and edge enhancement. However, each part has several types of seismic characteristic parameters, whose selection depends on the researcher’s subjective experience. As a result, differences in results are inevitable. Furthermore, obtaining a clear fault extraction output is difficult owing to noisy data. In addition, the extraction of individual faults from the cube requires intense manual work and might lead to human errors.
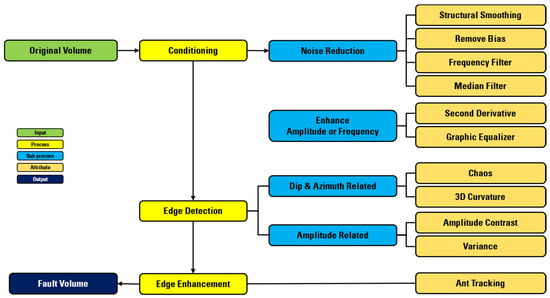
Figure 1.
The conventional workflow for fault detection consists of conditioning, edge detection, and edge enhancement. It is set up to perform a significant number of sub-processes within each attribute.
In this study, we propose an effective workflow for fault detection and extraction to construct a fault surface model. This approach improves the workflow, enables faster and clearer fault detection, and leads to enhancement of the edges. In addition, individual fault surfaces can be extracted more easily by applying a clustering method to fault cubes. Furthermore, we demonstrate the applicability of the proposed workflow to field data.
2. Improved Workflow for Fault Detection
The workflow proposed in this paper consists of directional edge detection and edge enhancement. A flowchart of the improved workflow is shown in Figure 2, and the associated steps are summarized as follows:
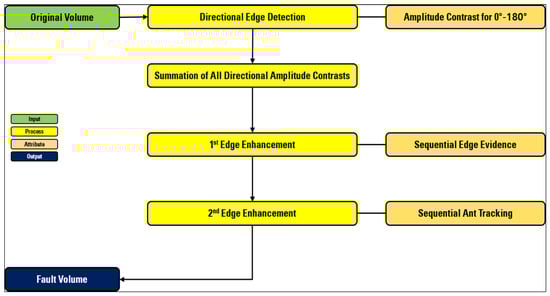
Figure 2.
Workflow proposed in this study for fault detection consists of directional edge detection, summation, and edge enhancement. The workflow is significantly simplified, and the computational time is also reduced due to the application of reduced attributes.
- (1)
- The amplitude contrast attribute was applied on the basis of the direction in which the edges are to be detected within the cube. This provides information about the major directions and edges of the fault to be investigated.
- (2)
- Summations were performed by selecting cubes with high fault connectivity on the basis of the previously acquired amplitude contrast attribute. This reduces noise and improves connectivity between edges.
- (3)
- The first edge enhancement was conducted using edge evidence. This attribute was applied sequentially to every direction to significantly reduce the noise and make the edges clearer.
- (4)
- The second edge enhancement was performed by ant tracking. A combination of passive and aggressive modes was used to enhance the edges of major or detailed faults.
Upon comparing our method to the conventional workflow shown in Figure 1, it can be seen that the conditioning step is omitted in the studied method. This reduces the time required to process multiple processes, thereby rapidly providing the final results. Furthermore, a reduction in the processing step implies that the use of subjective input variable values is also reduced, which generates more objective results.
3. Seismic Attributes and Application
3.1. Field Data in Vincent
We validated the proposed workflow by applying it to field data obtained from an offshore Vincent oil field adjacent to Western Australia, Australia. The Vincent field is a southern rift basin in the Canavon Basin, located in the Exmouth sub-basin with deposits including Jurassic to early Cretaceous sediments [33,34]. The formation structure of the basin was confirmed in the form of a three-way dip fault closure of Mooderong Shale.
3.2. Directional Edge Detection
In general, faults possess various directions (azimuth). However, a field or basin has few major directions depending on the geo-mechanical settings caused by their tectonic regime. Aqrawi et al. [35] proposed a technique for directional edge detection that takes into consideration of the major direction of the fault using amplitude contrast methods.
Amplitude contrast is a Sobel-based attribute computation of the amplitude derivatives between neighboring seismic traces, where nondiagonal neighbors are assigned double weights. The calculated differences were normalized, and the final value was calculated using three gradient calculations, where Sx, Sy, and Sz are the weighting operators in the corresponding dimensions. Figure 3 shows the amplitude contrast cubes when the azimuth direction increases from 0° to 170° in steps of 10°. It is evinced from the figure that the clarity of discontinuity varies with the azimuth.
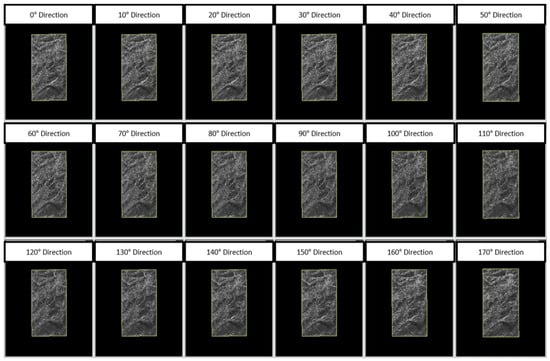
Figure 3.
Amplitude contrast for specific azimuth direction. A change in amplitude contrast is shown when the azimuth direction increases from 0° to 170° at 10° intervals.
After calculating all directions, the cubes that display good continuity for faults were selected, and then the selected cubes were summed. Owing to this summation step, we can expect noise reduction of the background and enhancement of the edge (or fault) signal. This step is similar to the stacking process of seismic processing. The results of the directional edge detection and summation using the amplitude contrast are shown in Figure 4. It is evinced that, even with simple amplitude contrast attributes, the discontinuity of the formation is more prominent than that of the original cube section. Furthermore, it was observed that noise reduction after the application of both directional edge detection and summation improves the connectivity between discontinuities.
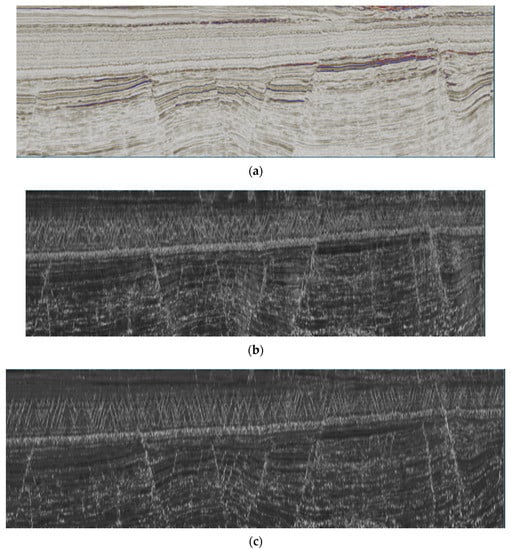
Figure 4.
(a) Original cube section and the results of edge detection using amplitude contrast attribute with (b) nondirectional and (c) directional and summation steps.
3.3. First Edge Enhancement
Even though the direction amplitude contrast cube showed good fault continuity, it was not sufficient to extract faults automatically. To enhance the continuity of faults, edge evidence of seismic attributes was applied to the directional amplitude contrast. Edge evidence uses integrals to detect faults in the image, which allows the delineation of the more enhanced fault edges from the results of amplitude contrast. This attribute retrieves lines with significantly different values in all directions, and it provides an estimate of the best line that passes the main point.
In this study, the multiple edge evidence attribute was applied. As a result, noise was attenuated, owing to which the location of the discontinuity could be distinguished more clearly. It can be applied in both horizontal and vertical directions or along the direction of line orientation. A combination of these characteristics in sequence is expected to have a higher effect. Figure 5 shows the results of the sequential application of edge evidence considering the horizontal and vertical combinations. The results of horizontal application show that, although edge enhancements were generated, the overall noise remained strong. However, after the subsequent application of edge evidence in the vertical direction, most of the noise disappeared, and the discontinuity became more prominent.
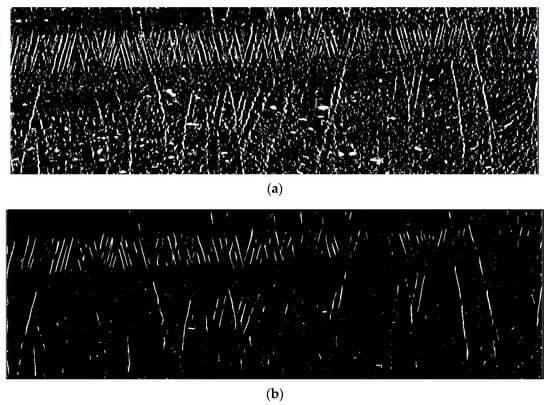
Figure 5.
First edge enhancement with sequential edge evidence. When first applied along the (a) horizontal direction, the edges were sharper, and, when it was subsequently applied along the (b) vertical direction, the discontinuity was enhanced.
3.4. Second Edge Enhancement
The second method, which follows edge evaluation, was applied to further enhance the discontinuity, and an ant tracking seismic attribute was used. Ant tracking is a patented technology by Schlumberger that performs edge enhancement to identify faults within the seismic data volume [36]. This method is based on the concept of swarm intelligence and is used to introduce a large number of agents (ants) in data volumes and evaluate swarm collective behavior. The analogy of the habit of ants to follow the shortest route for transporting food to their nests is applied to edge enhancement.
One of the issues in using ant tracking is that there are six parameters. Therefore, 720 variable combinations are possible, which indicates that different results can be obtained depending on the variable, even when applied to the same data. Another issue is that changing one of these values is difficult and requires a long computation time. Sequential ant tracking was used to avoid these issues. In ant tracking, there are two ant modes: passive and aggressive. Passive ant tracking is a common method for signals to move in a stronger direction and is effective in the identification of the overall trend of faults in large areas. The aggressive mode is more effective for detecting small faults in greater detail compared to the previous mode. In this study, these two modes were applied crosswise rather than individually to the cube to solve the abovementioned problems; the results are shown in Figure 6. The results were compared after cross-applying the passive–aggressive–passive and aggressive–passive–aggressive modes using the ant tracking method in the edge evidence cube. The difference between the two methods did not appear to be significant for this field data. However, the edges of the small faults were found to be slightly more enhanced in the aggressive–passive–aggressive sequence than in the passive–aggressive–passive sequence. In a multiple ant tracking experiment, most features of the first mode were found in the final cross-analysis result.
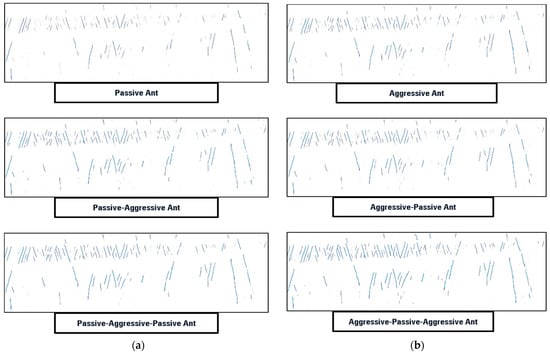
Figure 6.
Second edge enhancement with cross-applying using the ant tracking attributes. In the (a) aggressive–passive–aggressive sequence, the edges of the small faults are more enhanced, and, in the (b) passive–aggressive–passive sequence, the edges of the major faults are enhanced.
The results of fault detection using the conventional workflow and the proposed workflow are shown in Figure 7. The overall pattern of the fault was similar on both sides; however, the conventional workflow generated significantly poor continuity of the fault. On the other hand, the results using the proposed workflow significantly eliminated noise from the cube, and the fault edges appeared sharper and more continuous. Therefore, we demonstrate that the proposed workflow is applicable to field data, and it has the capacity to further improve fault detection.
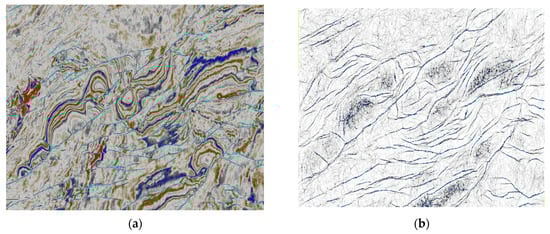
Figure 7.
Fault detection using the (a) proposed and (b) conventional workflow. The proposed workflow generates clearer and simpler fault edges than conventional results.
4. Clustering and Fault Surface Extraction
The proposed workflow can be used to effectively detect faults, and it requires the processes of extracting and imaging fault surfaces from 3D cubes. The process of manual extraction of fault surfaces is influenced by the interpreter and requires an enormous amount of time. On the other hand, the automatic error extraction methods are quite complex and require several follow-up tasks with considerable computation time. In this workflow, we used orientation clustering to extract fault surfaces more easily.
To perform clustering, the fault surfaces were first converted to points, as shown in Figure 8a. At this point, it is important to transform the information of the direction of the surface using a sufficient number of points for effective description. In addition, information of the azimuth and dip at each point position was extracted at the time of conversion, as shown in Figure 8b,c, respectively.
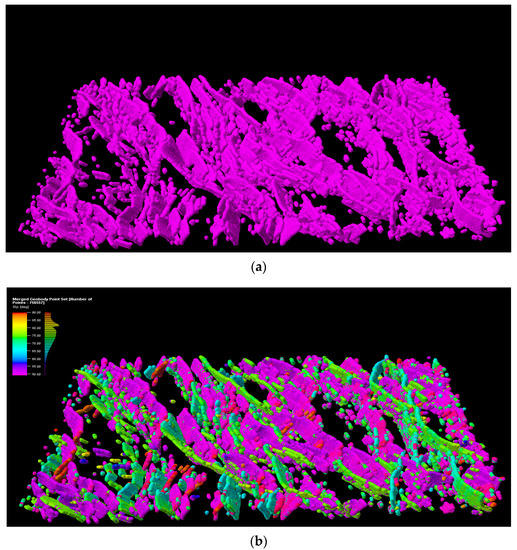
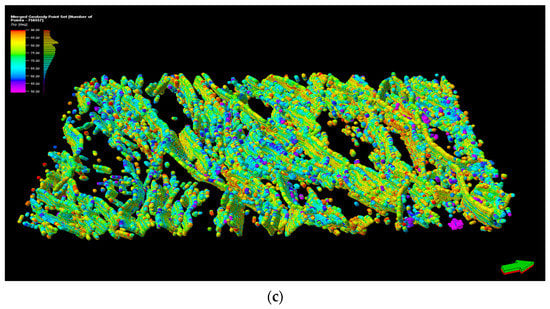
Figure 8.
Extracted fault surfaces as (a) point type. To perform orientation clustering, (b) azimuth and (c) dip information for each point position was also extracted.
Clustering is an effective method to distinguish and extract similar groups by considering the characteristics of the data. The azimuth and dip information stored at each point was clustered using the density-based spatial clustering of applications with noise (DBSCAN) method [37,38]; subsequently, the fault was extracted separately. The DBSCAN algorithm expands clusters by finding data that are close to the initial data. The input parameters were the number of neighbors required to define the dense region (MinPts) and the distance representing the neighborhood (ε). Using these parameters, the data were classified into three types. If the number of points within a neighborhood with distance ε exceeded the minimum, then such a point was designated as a core point. After a core point was located, data within its neighborhood were defined as connected points or as other core points. If the data point was not connected to a neighbor, it was designated as a border point. Lastly, data in clusters that were neither core nor border points were designated as noise. Therefore, DBSCAN performs density-based clustering, and, unlike K-means, the number of final clusters is not required as an input parameter, which is an advantage. Figure 9 shows clustered fault point sets. Since DBSCAN was used, complexly intertwined faults could be identified individually according to the orientation, and the density-based attributes allowed the extraction of the connectivity of the fault surface. Furthermore, parts that lacked the number of points to be defined as a fault were considered outliers and removed.
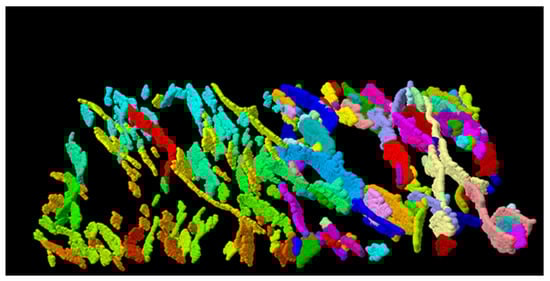
Figure 9.
Fault point groups extracted individually by DBSCAN clustering from original point group data shown in Figure 8a.
Figure 10 shows the results of extracting the fault model from the original fault cube using the conventional automatic method and the proposed clustering method. The automated method showed significantly lower connectivity of the fault, and it seemed difficult to implement an accurate model because individual separation of the fault was not well generated at the intersection site of several intersections. On the other hand, using the proposed method, the generated model extracted individual fault surfaces with high connectivity. In addition, unnecessary outliers could be eliminated to obtain simpler and more visible images.
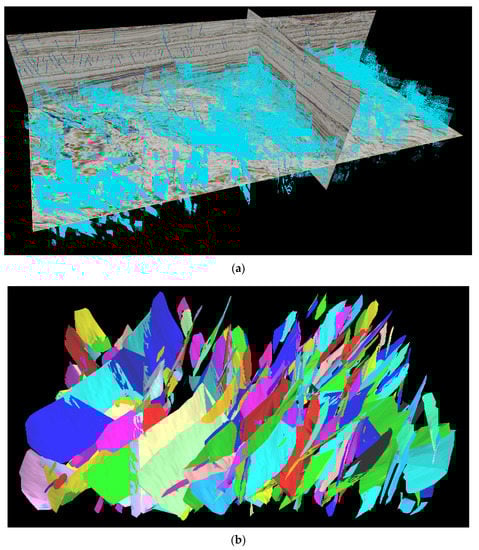
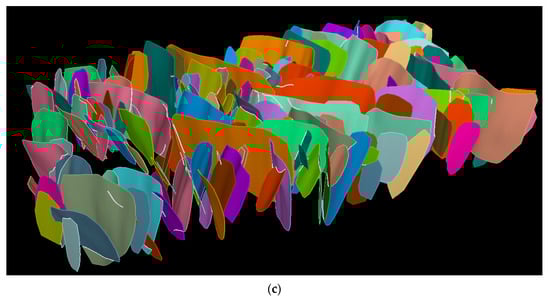
Figure 10.
Results of fault modelling using (a) original fault cube, (b) conventional (automatic) approach, and (c) clustering (the proposed method). Automatic fault extraction methods show low connectivity between fault models; however, the proposed method shows high connectivity with the possibility of individual fault extraction through clustering.
Comparing the time spent on the extracting method, it took at least two days to combine the calculation and editing processes when modeling faults using the automatic extraction method. If done manually, this would take several weeks or more. However, by applying the clustering method, the fault extraction could be completed within 4–5 h. Therefore, we demonstrate that the proposed method can obtain an effective fault model in a significantly shorter time than the conventional methods.
5. Conclusions
We proposed an improved fault detection workflow consisting of directional edge detection, summation, and edge enhancement. Compared to the conventional fault detection workflow using seismic attributes, the proposed method is less cumbersome for controlling the parameters and does not require the selection of seismic attributes based on individual case. It mainly controls the results on the basis of a sequence of seismic attributes and displays consistent results regardless of the cases. In addition, the attributes used are smaller than those of the conventional method, and the proposed workflow requires lesser process time. Overall, we found that clustering effectively enables the extraction of individual fault surfaces.
In this method, the fault surface extracted from the edge detection cube was converted to a sufficient number of points to describe the orientation of the fault layer. Subsequently, clustering was performed on the azimuth and dip using DBSCAN, and individual fault surfaces with high continuity could be extracted from complex entangled fault structures.
The proposed workflow was applied to field data obtained from the Vincent oil field in Australia. The results showed that sharper and continuous edges could be detected with significant noise reduction compared to the conventional methods. Thus, we demonstrate that the proposed model is applicable to field data and is more effective for fault detection. The proposed workflow reduces the overall cycle of fault analysis and human-induced errors. This also reduces the effort and time spent during the manual interpretation of faults and allows the interpreter to further invest time in quality control of the extracted faults.
Author Contributions
Conceptualization, M.K. and N.-K.K.; methodology, J.Y. and N.-K.K.; investigation, B.-Y.K.; data curation, J.Y. and M.K.; writing—original draft preparation, J.Y. and B.-Y.K. All authors read and agreed to the published version of the manuscript.
Funding
This research was funded by the Korea Institute of Geoscience and Mineral Resources, grant number GP2020–023.
Institutional Review Board Statement
Not applicable.
Informed Consent Statement
Not applicable.
Data Availability Statement
Not applicable.
Acknowledgments
We wish to thank Joongmoo Byun and Rise Lab of Hanyang University for their support.
Conflicts of Interest
The authors declare no conflict of interest.
References
- Mitcham, T.W. Fractures, joints, faults, and fissures. Econ. Geol. 1963, 58, 1157–1158. [Google Scholar] [CrossRef]
- Bouchon, M.; Aki, K. Strain, tilt, and rotation associated with strong ground motion in the vicinity of earthquake faults. Bull. Seismol. Soc. Am. 1982, 72, 1717–1738. [Google Scholar] [CrossRef]
- Passone, L.; Mai, P.M. Kinematic earthquake ground-motion simulations on listric normal FaultsKinematic earthquake ground-motion simulations on listric normal faults. Bull. Seismol. Soc. Am. 2017, 107, 2980–2993. [Google Scholar] [CrossRef]
- Roberts, G.P.; Cowie, P.; Papanikolaou, I.; Michetti, A.M. Fault scaling relationships, deformation rates and seismic hazards: An example from the Lazio–Abruzzo Apennines, central Italy. J. Struct. Geol. 2004, 26, 377–398. [Google Scholar] [CrossRef]
- Watkinson, I.M.; Hall, R. Fault systems of the eastern Indonesian triple junction: Evaluation of Quaternary activity and implications for seismic hazards. Geol. Soc. 2017, 441, 71–120. [Google Scholar] [CrossRef]
- Raven, K.G.; Gale, J.E. Water flow in a natural rock fracture as a function of stress and sample size. Int. J. Rock Mech. Min. Sci. Geomech. Abstr. 1985, 22, 251–261. [Google Scholar] [CrossRef]
- Kwicklis, E.M.; Healy, R.W. Numerical investigation of steady liquid water flow in a variably saturated fracture network. Water Resour. Res. 1993, 29, 4091–4102. [Google Scholar] [CrossRef]
- Mayer, J.R.; Sharp, J.M. Fracture control of regional ground-water flow in a carbonate aquifer in a semi-arid region. Geol. Soc. Am. Bull. 1998, 110, 269–283. [Google Scholar] [CrossRef]
- Carrasco, J.; Garcia, R. 3D seismic interpretation techniques for detecting oilfield exploration locations. In SPE Latin America and Caribbean Petroleum Engineering Conference; Society of Petroleum Engineers: Maracaibo, Venezuela, 2014; SPE-169452-MS. [Google Scholar]
- Chopra, S.; Marfurt, K.J. Seismic Attributes for Prospect Identification and Reservoir Characterization; Society of Exploration Geophysicists: Tulsa, OK, USA, 2007. [Google Scholar]
- Neves, F.A.; Zahrani, M.S.; Bremkamp, S.W. Detection of potential fractures and small faults using seismic attributes. Lead. Edge 2004, 23, 903–906. [Google Scholar] [CrossRef]
- Chopra, S.; Marfurt, K.J. Emerging and future trends in seismic attributes. Lead. Edge 2008, 27, 298–318. [Google Scholar] [CrossRef]
- Huang, L.; Dong, X.; Clee, T.E. A scalable deep learning platform for identifying geologic features from seismic attributes. Lead. Edge 2017, 36, 249–256. [Google Scholar] [CrossRef]
- Bahorich, M.; Farmer, S. 3-D seismic discontinuity for faults and stratigraphic features: The coherence cube. Lead. Edge 1995, 14, 1053–1058. [Google Scholar] [CrossRef]
- Qi, J.; Zhang, B.; Zhou, H.; Marfurt, K. Attribute expression of fault-controlled karst—Fort Worth Basin, Texas: A tutorial. Interpretation 2014, 2, SF91–SF110. [Google Scholar] [CrossRef]
- Tversky, A.; Kahneman, D. Judgment under uncertainty: Heuristics and biases. Science 1974, 185, 1124–1131. [Google Scholar] [CrossRef] [PubMed]
- Schaaf, A.; Bond, C.E. Quantification of uncertainty in 3-D seismic interpretation: Implications for deterministic and stochastic geomodeling and machine learning. Solid Earth 2019, 10, 1049–1061. [Google Scholar] [CrossRef]
- Tannert, C.; Elvers, H.-D.; Jandrig, B. The ethics of uncertainty: In the light of possible dangers, research becomes a moral duty. EMBO Rep. 2007, 8, 892–896. [Google Scholar] [CrossRef] [PubMed]
- Bond, C.E. Uncertainty in structural interpretation: Lessons to be learnt. J. Struct. Geol. 2015, 74, 185–200. [Google Scholar] [CrossRef]
- Alcalde, J.; Bond, C.E.; Johnson, G.; Ellis, J.F.; Butler, R.W. Impact of seismic image quality on fault interpretation uncertainty. GSA Today 2017, 27, 4–10. [Google Scholar] [CrossRef]
- Chahine, C.; Truelove, L.; Volcan, M.H. Enhanced delineation of reservoir compartmentalization from advanced preand post-stack seismic attribute analysis. First Break 2014, 32, 75–84. [Google Scholar] [CrossRef]
- Marfurt, K.J.; Kirlin, R.L.; Farmer, S.L.; Bahorich, M.S. 3-D seismic attributes using a semblance-based coherency algorithm. Geophysics 1998, 63, 1150–1165. [Google Scholar] [CrossRef]
- Kirlin, R.L. The relationship between semblance and eigenstructure velocity estimators. Geophysics 1992, 57, 1027–1033. [Google Scholar] [CrossRef]
- Gersztenkorn, A.; Sharp, J.; Marfurt, K. Delineation of tectonic features offshore Trinidad using 3-D seismic coherence. Lead. Edge 1999, 18, 1000–1008. [Google Scholar] [CrossRef]
- Bakker, P. Image structure Analysis for Seismic Interpretation. Ph.D. Thesis, Delft TU: Delft University of Technology, Delft, The Netherlands, 2012. [Google Scholar]
- Tingdahl, K.M.; De Groot, P.; Heggland, R.; Ligtenberg, H. Semi-automated object detection in 3D seismic data. In Proceedings of the 2001 SEG Annual Meeting, San Antonio, TX, USA, 9–14 September 2001. [Google Scholar]
- Van Bemmel, P.; Pepper, R. Seismic Signal Processing Method and Apparatus for Generating a Cube of Variance Values. U.S. Patent US6151555 A, 21 November 2000. [Google Scholar]
- Dorn, G.A.; Kadlec, B.; Murtha, P. Imaging faults in 3D seismic volumes. In SEG Technical Program Expanded Abstracts 2012; Society of Exploration Geophysicists: Tulsa, OK, USA, 2012; pp. 1–5. [Google Scholar]
- Wu, X. Directional structure-tensor-based coherence to detect seismic faults and channels. Geophysics 2017, 82, A-13. [Google Scholar] [CrossRef]
- Luo, Y.; Higgs, W.G.; Kowalik, W.S. Edge detection and stratigraphic analysis using 3D seismic data. In SEG Technical Program Expanded Abstracts 1996; Society of Exploration Geophysicists: Tulsa, OK, USA, 1996; pp. 324–327. [Google Scholar]
- Silva, C.C.; Marcolino, C.S.; Lima, F.D. Automatic fault extraction using ant tracking algorithm in the Marlim South Field, Campos Basin. In SEG Technical Program Expanded Abstracts 2005; Society of Exploration Geophysicists: Tulsa, OK, USA, 2005; pp. 857–860. [Google Scholar]
- Wang, Z.; AlRegib, G. Automatic fault surface detection by using 3D Hough transform. In SEG Technical Program Expanded Abstracts 2014; Society of Exploration Geophysicists: Tulsa, OK, USA, 2014; pp. 1439–1444. [Google Scholar]
- Loro, R.; Hill, R.; Jackson, M.; Slate, T. Technologies that have transformed the Exmouth into Australia’s premier oil producing basin. APPEA J. 2015, 55, 233–246. [Google Scholar] [CrossRef][Green Version]
- Choi, J.; Kim, S.; Kim, B.; Byun, J. Probabilistic reservoir characterisation using 3D pdf of stochastic forward modelling results in Vincent oil field. Explor. Geophys. 2020, 51, 341–354. [Google Scholar] [CrossRef]
- Aqrawi, A.; Weinzierl, W.A.; Daber, R.; Boe, T.H. Directional guided seismic attributes and their use in assisting structural, stratigraphic and lithological interpretation. In SEG Technical Program Expanded Abstracts 2012; Society of Exploration Geophysicists: Tulsa, OK, USA, 2012; pp. 1–5. [Google Scholar]
- Pedersen, S.I.; Randen, T.; Sonneland, L.; Steen, Ø. Automatic fault extraction using artificial ants. In SEG Technical Program Expanded Abstracts 2002; Society of Exploration Geophysicists: Tulsa, OK, USA, 2002; pp. 512–515. [Google Scholar]
- Ester, M.; Kriegel, H.P.; Sander, J.; Xu, X. A density-based algorithm for discovering clusters in large spatial databases with noise. Knowl. Discov. Data Min. 1996, 96, 226–231. [Google Scholar]
- Yu, J.; Byun, J.; Seol, S.J. Imaging discrete fracture networks using the location and moment tensors of microseismic events. Explor. Geophys. 2021, 52, 42–53. [Google Scholar] [CrossRef]
Publisher’s Note: MDPI stays neutral with regard to jurisdictional claims in published maps and institutional affiliations. |
© 2021 by the authors. Licensee MDPI, Basel, Switzerland. This article is an open access article distributed under the terms and conditions of the Creative Commons Attribution (CC BY) license (https://creativecommons.org/licenses/by/4.0/).