1. Introduction
Research scientists and technicians who work with laboratory animals are exposed to complex mixtures containing both allergens and bacterial endotoxins from animals, bedding and feed [
1,
2]. Animals constantly shed proteins via the urine, secretions and desquamation of skin, and these allergens can be released in the air or deposited on surfaces and equipment, so making the animal facility a risky environment for the development of allergies [
3]. Endotoxins, lipopolysaccharide components of the cell-wall of Gram-negative bacteria with high biological potency in respiratory systems, may also exist in the air of animal units due to the presence of organic material, causing an additional risk for personnel working there. Fecal bacteria in soiled bedding may produce increased concentration of endotoxins, compared to other settings, and this may be an occupational health concern [
4].
Workers involved in the direct care of laboratory animals have been shown to be at the highest risk for developing allergies or asthma, likely due to the magnitude of their workplace exposures [
5]. Laboratory animal workers (LAWs) have a high risk of developing laboratory animal allergies as a consequence of inhaling animal proteins at work; this occurrence has serious consequences for their health and future employment. Exposure to animal allergen remains to be the greatest risk factor although the dose relation is complex, with saturation at high allergen exposure.
Laboratory animal allergy (LAA), especially from mice and rats, is well recognized as causing sensitization and subsequent ocular, nasal, upper and lower respiratory symptoms [
6,
7]. The rate of workers that can develop an allergy has been reported with great variability, between 4 and 44% [
7,
8,
9,
10,
11,
12,
13,
14]. This variability can also be due to different methodologies used for evaluation. Recent data reported a decrease of LAA (25.6% in 2001–2004 to 8.2% in 2013–2016) probably attributable to preventive programs [
15].
In addition to allergens, bacterial toxins also play a role in the allergic process. Inhalation of endotoxins induces health effects mainly on the respiratory system, including decline in lung function and increased prevalence of chronic bronchitis and asthma-like syndrome [
16,
17].
Airborne endotoxin has been identified as a major risk factor for nasal, chest and skin symptoms when working with mice in a subgroup of non-mouse sensitized researchers. These findings support an important role for endotoxin as well as mouse allergen in the risk of symptoms and sensitization in the laboratory animal workplace [
2].
Rat and mouse allergens (Rat n 1 and Mus m 1) are aeroallergens mainly represented in animal facilities and research laboratories. These allergens were detected on particles of >5–10 µm aerodynamic diameter, even if some authors showed the presence of Rat n 1 antigen on particles < 5 µm [
18,
19]. Airborne Mus m 1 was detected on particles 3.3–10 µm in diameter in high density mouse rooms [
20]. The particle size distribution for endotoxin is unknown, but because endotoxin and mouse allergen have different sizes and charges [
21], they may not be associated with the same size particles. However, because both emanate from animal droppings, endotoxin and mouse allergen are likely to be detected together [
22].
Other allergens, such as Can f 1, Fel d 1 and Equ c 4, even if they are not related to activity in the animal facility under investigation, may be present in these environments due to the passive transport from life to occupational settings. In fact, a critical issue is the spread of endotoxin and allergens between different environments and tasks characterizing animal facilities and between work and life [
23,
24,
25,
26]. As a consequence, environmental monitoring can be useful to distinguish the animal allergens, deriving from the species in the animal facilities, from the domestic species [
27].
Monitoring occupational exposure to these biological risk agents in animal enclosures is complex as animal caretaker personnel are not limited to a single activity during a shift but instead perform a variety of tasks which contribute at different levels to the total occupational exposure. For example, animal technicians and caretakers had elevated rat and mouse urinary allergen exposure compared to scientific staff and supervisors. For both allergens, cleaning cages and moving animals to new cages were associated with the highest personal exposures; lower exposures were seen with feeding and handling animals. Washing cages was the lowest-exposure task [
28].
Moreover, significantly higher concentrations of mouse allergens in the breathing zone were found in mouse handlers than in those not handling mice [
13]; a strong correlation between time spent moving cages was also evidenced [
28], and differences in the rate of exposure in areas classified as low risk (changing workers’ rooms, corridors, offices) and high risk (holding rooms, procedure rooms, cage-washing) were also reported [
29].
Typical rat and mouse allergen concentrations in laboratory animal environments range from 10 to 200 ng/m
3. Usually, average endotoxin exposures are considered very low when they range from 0.02 to 1.5 ng/m
3. Average exposure in the range 60–1000 ng/m
3 can be found in grain handlers, hog confinement workers and poultry farmers [
30,
31,
32].
A study conducted in a conventional laboratory rabbit room reports a higher concentration of endotoxins in the stationary and personal air samples during specific working activities (cage/tray changing, animal handling, control of food and water and room cleaning) with a typical range of 0.4–1.3 ng/m
3 and 0.7–3.6 ng/m
3, respectively, in static position and personal air sampling. This study clearly demonstrates that the previously listed tasks cause a release of airborne endotoxins [
4].
The main objective of this paper was to characterize the complex exposures of workers employed in animal facilities to endotoxin and animal allergens, through samples of air in the breathing zone of the staff during daily working activity, in order to identify the work categories at highest risk of exposure. Since exposure to allergens and endotoxins induces important respiratory effects, personal monitoring represents an important tool aimed at improving prevention and control strategies. Based on our knowledge, few observational studies on the levels of airborne allergens and endotoxins among laboratory animal workers have been carried out in Europe, with scarce data collected in Italy. We believe that this work adds useful information in the context of risk management from biological agents.
This study provides a more detailed analysis than that of a previous study [
24] whose main objective was to determine which factors (working tasks, changing cages frequency and animal strains) were associated with the greatest level of exposure to biological agents of the personnel working with rodents through environmental monitoring in animal rooms and washing and storage areas. In relation to working tasks, our data showed that (1) changing cages is a determinant factor in increasing the concentration of the airborne bio-contaminants, (2) the preparation of bedding and distribution of feed is another critical working task in terms of exposure to endotoxins, (3) the dirty washing area presents the highest concentration of Mus m 1 allergen.
2. Materials and Methods
2.1. Animal Facility
This study was conducted in a biomedical research institute located in Central Italy where the animal care facility includes 14 animal holding rooms, housing mice and rats, rooms for animal quarantine, a dirty and a clean cage wash area and a storage area.
Animal holding rooms are locations where the rodents are housed, typically 2/3 animals per cage for rats and 5/6 for mice (no ventilated cages). The main activity carried out in the animal rooms consists of changing cages. During this activity, dirty racks are replaced with clean ones, animal sand accessories are moved to new cages and dirty cages are moved to the washing area.
Within the cage wash areas, the dirty location is where the contents of used cages (including fecal matter) are emptied and washed in an industrial washer. In the “clean washing area” the cages are dried and restacked for future use.
Finally, in the “storage area” clean and dried cages are filled with wood chip litter (Lignocel, Premium Hygienic Animal Bedding, J. Rettenmaier & Sohne GMBH + CO.KG, Rosembreg, Germany) and food. These activities are performed only in the afternoon.
The staff is composed of researchers, who are engaged in several experimental procedures such as collecting blood and urine specimens, surgery, sacrifice and office activities; animal attendants, who change cages and bedding, feed animals, clean rooms and wash cages; and technicians, who are engaged in several activities in the laboratory, office and enclosure.
Personal protective equipment is required for all personnel working in the facility and includes surgical cap, mask, gloves, shoe covers and disposable coat.
2.2. Sampling Strategy
Personal air samplings were performed during a two-month period. Based on the activities carried out, four categories of workers were individuated and enrolled twice with the following sampling strategy:
(1) Researcher engaged in laboratory, animal enclosure and office (n = 16)
(2) Researcher only engaged in office (n = 10)
(3) Laboratory animal attendant (n = 14)
(4) Technician (n = 2)
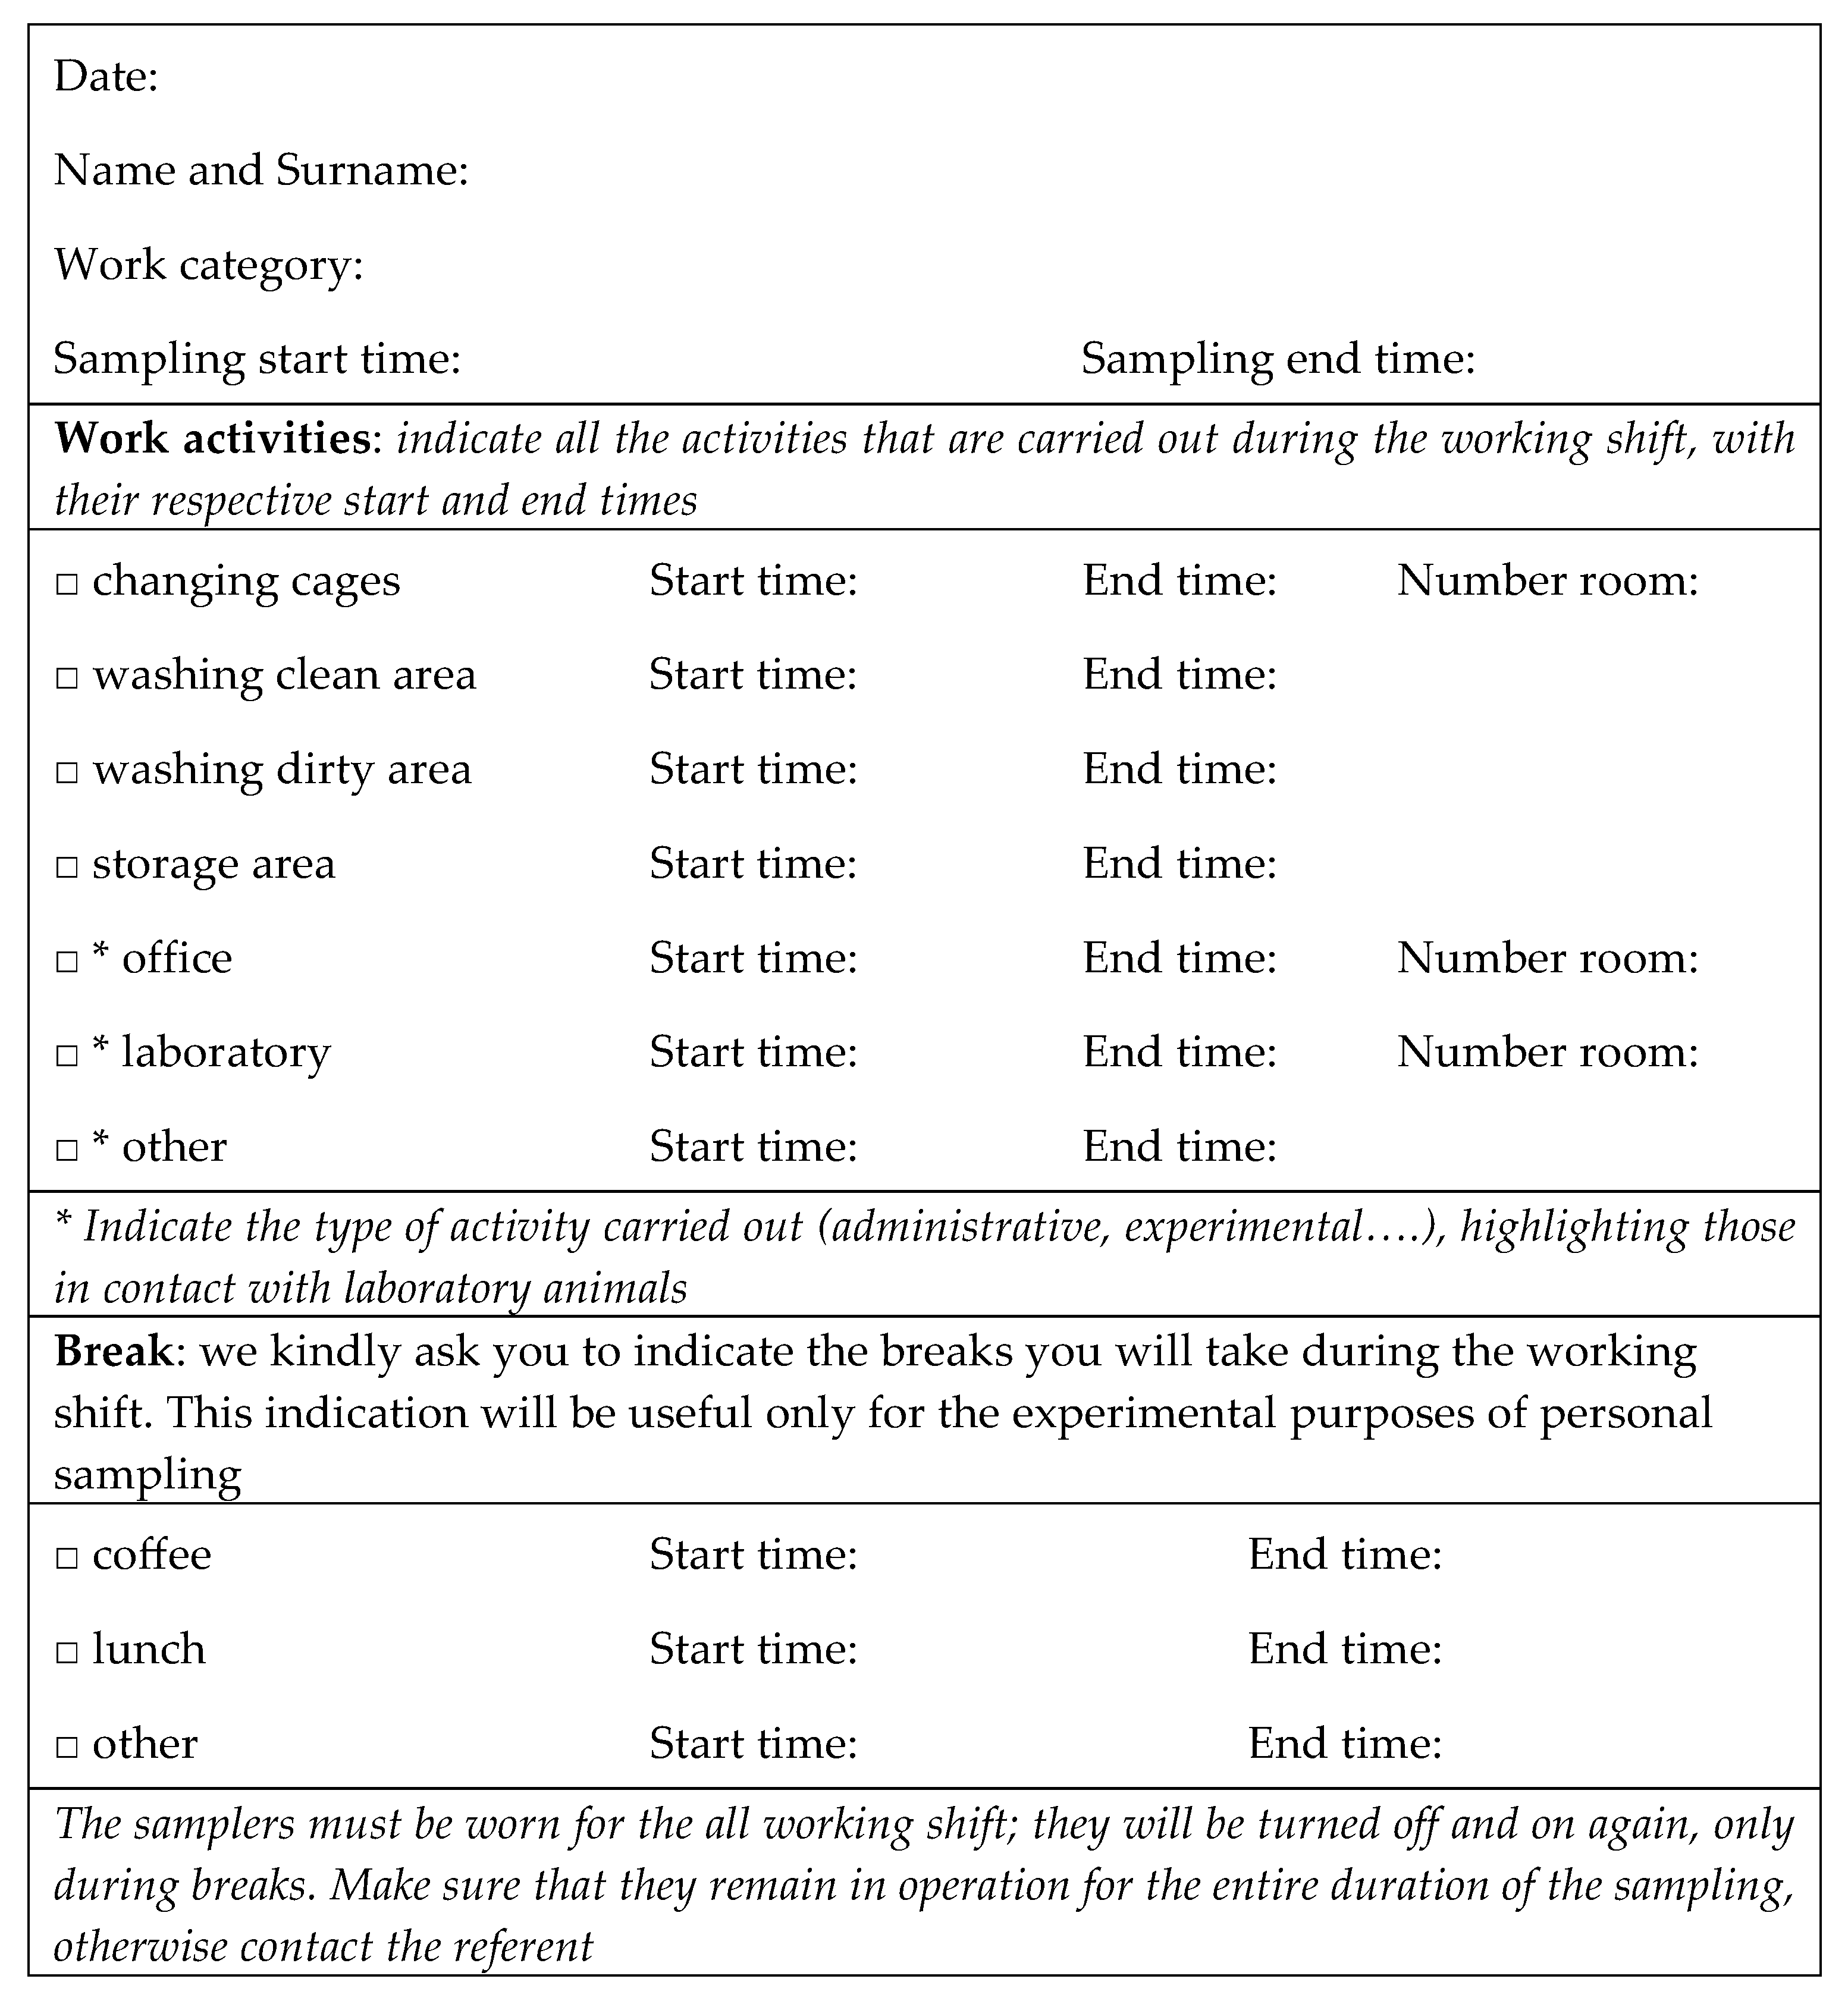
All workers were informed of the aim of the study and their participation was voluntary. After the sampling, information about qualifications and working tasks performed during the working shift were collected on a work record sheet. Any breaks at work were also recorded (
Figure 1).
2.3. Personal Inhalable Dust Sampling of Endotoxin and Allergens
Inhalable dust samples were collected using airChek2000 pumps (SKC, Inc., EightyFour, PA, USA), set a flow rate of 2 L min−1, equipped with an IOM sampler and fiber glass filter (GF/A, diameter 25 mm, 1.6 μm porosity) (SKC, Inc., Eighty Four, PA, USA) for endotoxin analysis, while for allergen sampling, a closed-face cassette with support pad and mixed cellulose ester (MCE, diameter 25 mm, 0.8 μm porosity) at a flow rate of 2.5 L min−1 were used. The filters were placed in the breathing zone of the employees.
Airflow was calibrated before and after field sampling with an air flow calibrator (Drycal, Bios International Corporation, Butler, NJ, USA). A 5% change of flow rate was accepted between the two measurements. The volume of air sampled was calculated based on the flow rate and the duration of sampling. Two field blanks were processed for each sampling day and handled in the same way as the experimental samples, except no air was drawn through the filter. On sampling days, workers were asked to wear sampling devices for the duration of their work shifts.
2.4. Analysis of Endotoxin and Allergens
After sampling, all samples were kept in a cold box, transported to the laboratory within the same day and filters were stored at −20 °C for 1–3 months to await measurement.
GF filters were extracted in 5 mL of PFW plus Tween-20 (0.05% v/v) via shaking for 1 h at room temperature on a reciprocating shaker (Promax 1020, Heidolph Instruments GMBH & CO KG, Schwabach, Germany). The extracts were centrifuged for 10 min at 1000× g (2094 r.p.m.). Undiluted and serial dilutions were analyzed using Kinetic-QCL LAL assay (Lonza Walkersville, MD USA) and interpreted against a 5-point (concentration range 0.005–50 EU mL−1) standard curve of Escherichia coli (CSE). All procedures were carried out using pyrogen-free reagents and all glassware was baked at 180 °C for 4 h to remove endotoxin. To obtain information about possible enhancement or inhibition reactions of the LAL assay, a replicate of each sample was spiked with an endotoxin standard (CSE, 50 EU/mL) (5 EU/mL final activity). The recovery of spiked samples was in the range of 50 to 200%; otherwise, the measurement was not included or repeated. The limit of detection (LOD) was 0.005 EU/mL−1. The concentrations are given as ng/m3.
MCE filters were extracted via submerging in 1 mL phosphate saline buffer (PBS plus 0.01% Tween 20) in a 15 mL centrifuge tube, vortexing at room temperature and shaking for 2 h. The eluate was collected by compressing the filter in a plastic syringe; 1% of human serum albumin was added for protein stabilization and it was stored at −20 °C until assay. ELISA kits for Mus m 1, Rat n 1, Can f 1, Fel d 1 and Equ c 4 were used following the protocols of analysis provided by the manufacturer (Indoor Biotechnologies Ltd., Manchester, UK) with reading of the plates at 405 nm optical density. Results are expressed in ng/m3.
Limits of detection (LOD) were 0.097 and 0.024 ng/filter for rat allergen and mouse allergen, respectively. A concentration equal to half the LOD was attributed to samples below this limit, while two samples with very high concentrations (>25 ng/filter) were attributed a value of 25 ng/filter for statistical analysis.
2.5. Statistical Analysis
All the statistical analyses were performed by means of the IBM SPSS Statistics 25 software.
On the basis of the different tasks the different work categories were identified. In order to attribute the doses of the bio-contaminants to the different work categories, the strategy described in the following was applied.
The concentration of endotoxins and animal allergens per unit time was calculated per each j-th worker so that the rate of dose,
, was calculated (conc/min) relative to the i-th bio-contaminant. The average concentration/min was calculated relative to each category
, and the average exposure time of each group was also calculated
. The average dose of each group relative to the i-th bio-contaminant was calculated as the product between the average conc/min and the average time.
The maximum error was attributed with the error propagation Formula (2).
The statistical significance of the comparison between the exposure to the considered bio-contaminants associated to the different job tasks was also studied.
As the measures of the different bio-contaminant were performed on the same subject and, consequently, were not independent, a repeated ANOVA was used to test the dose difference in the different working groups. All the bio-contaminants were simultaneously considered. A factorial model was used in which the explaining variables are the factor “work category” and the total exposure time.
Single ANOVA models were also studied in which each single bio-contaminant concentration was considered as an outcome variable, the exposure time and the work category being the explanatory variables.
3. Results
3.1. Worker Groups and Average Doses
In this study a total of 42 personal inhalable dust samples was performed. Sampling times ranged from 120 min up to 425 min based on the duration of the work shift.
From the information provided by personnel on work record sheets, it was possible to calculate the average time dedicated by each worker category to specific activities. Laboratory animal attendants worked for about 167 min (average time) of their shift in animal rooms, where they were mostly changing cages; the remaining time they spent in the wash and storage areas.
Researchers dedicated most of their work shift to laboratory (average time 164 min) and office activities (average time 83 min), while technicians carried out different activities equally distributed between the animal rooms, laboratory and office.
Following the strategy described in the statistical method paragraph, an average dose for each bio-contaminant and an average exposure time were attributed to the four work categories. The results are summarized in
Table 1.
As regards the individual dose, endotoxin concentrations exceeding the recommended occupational exposure limit proposed by the Dutch Expert Committee on Occupational Safety (DECOS) [
33] of 9 ng/m
3 were found in two cases in the animal attendant category. This occurrence deserves great attention and prevention measures for risk containment.
No exposure to Can f 1 and Equ c 4 allergens was found.
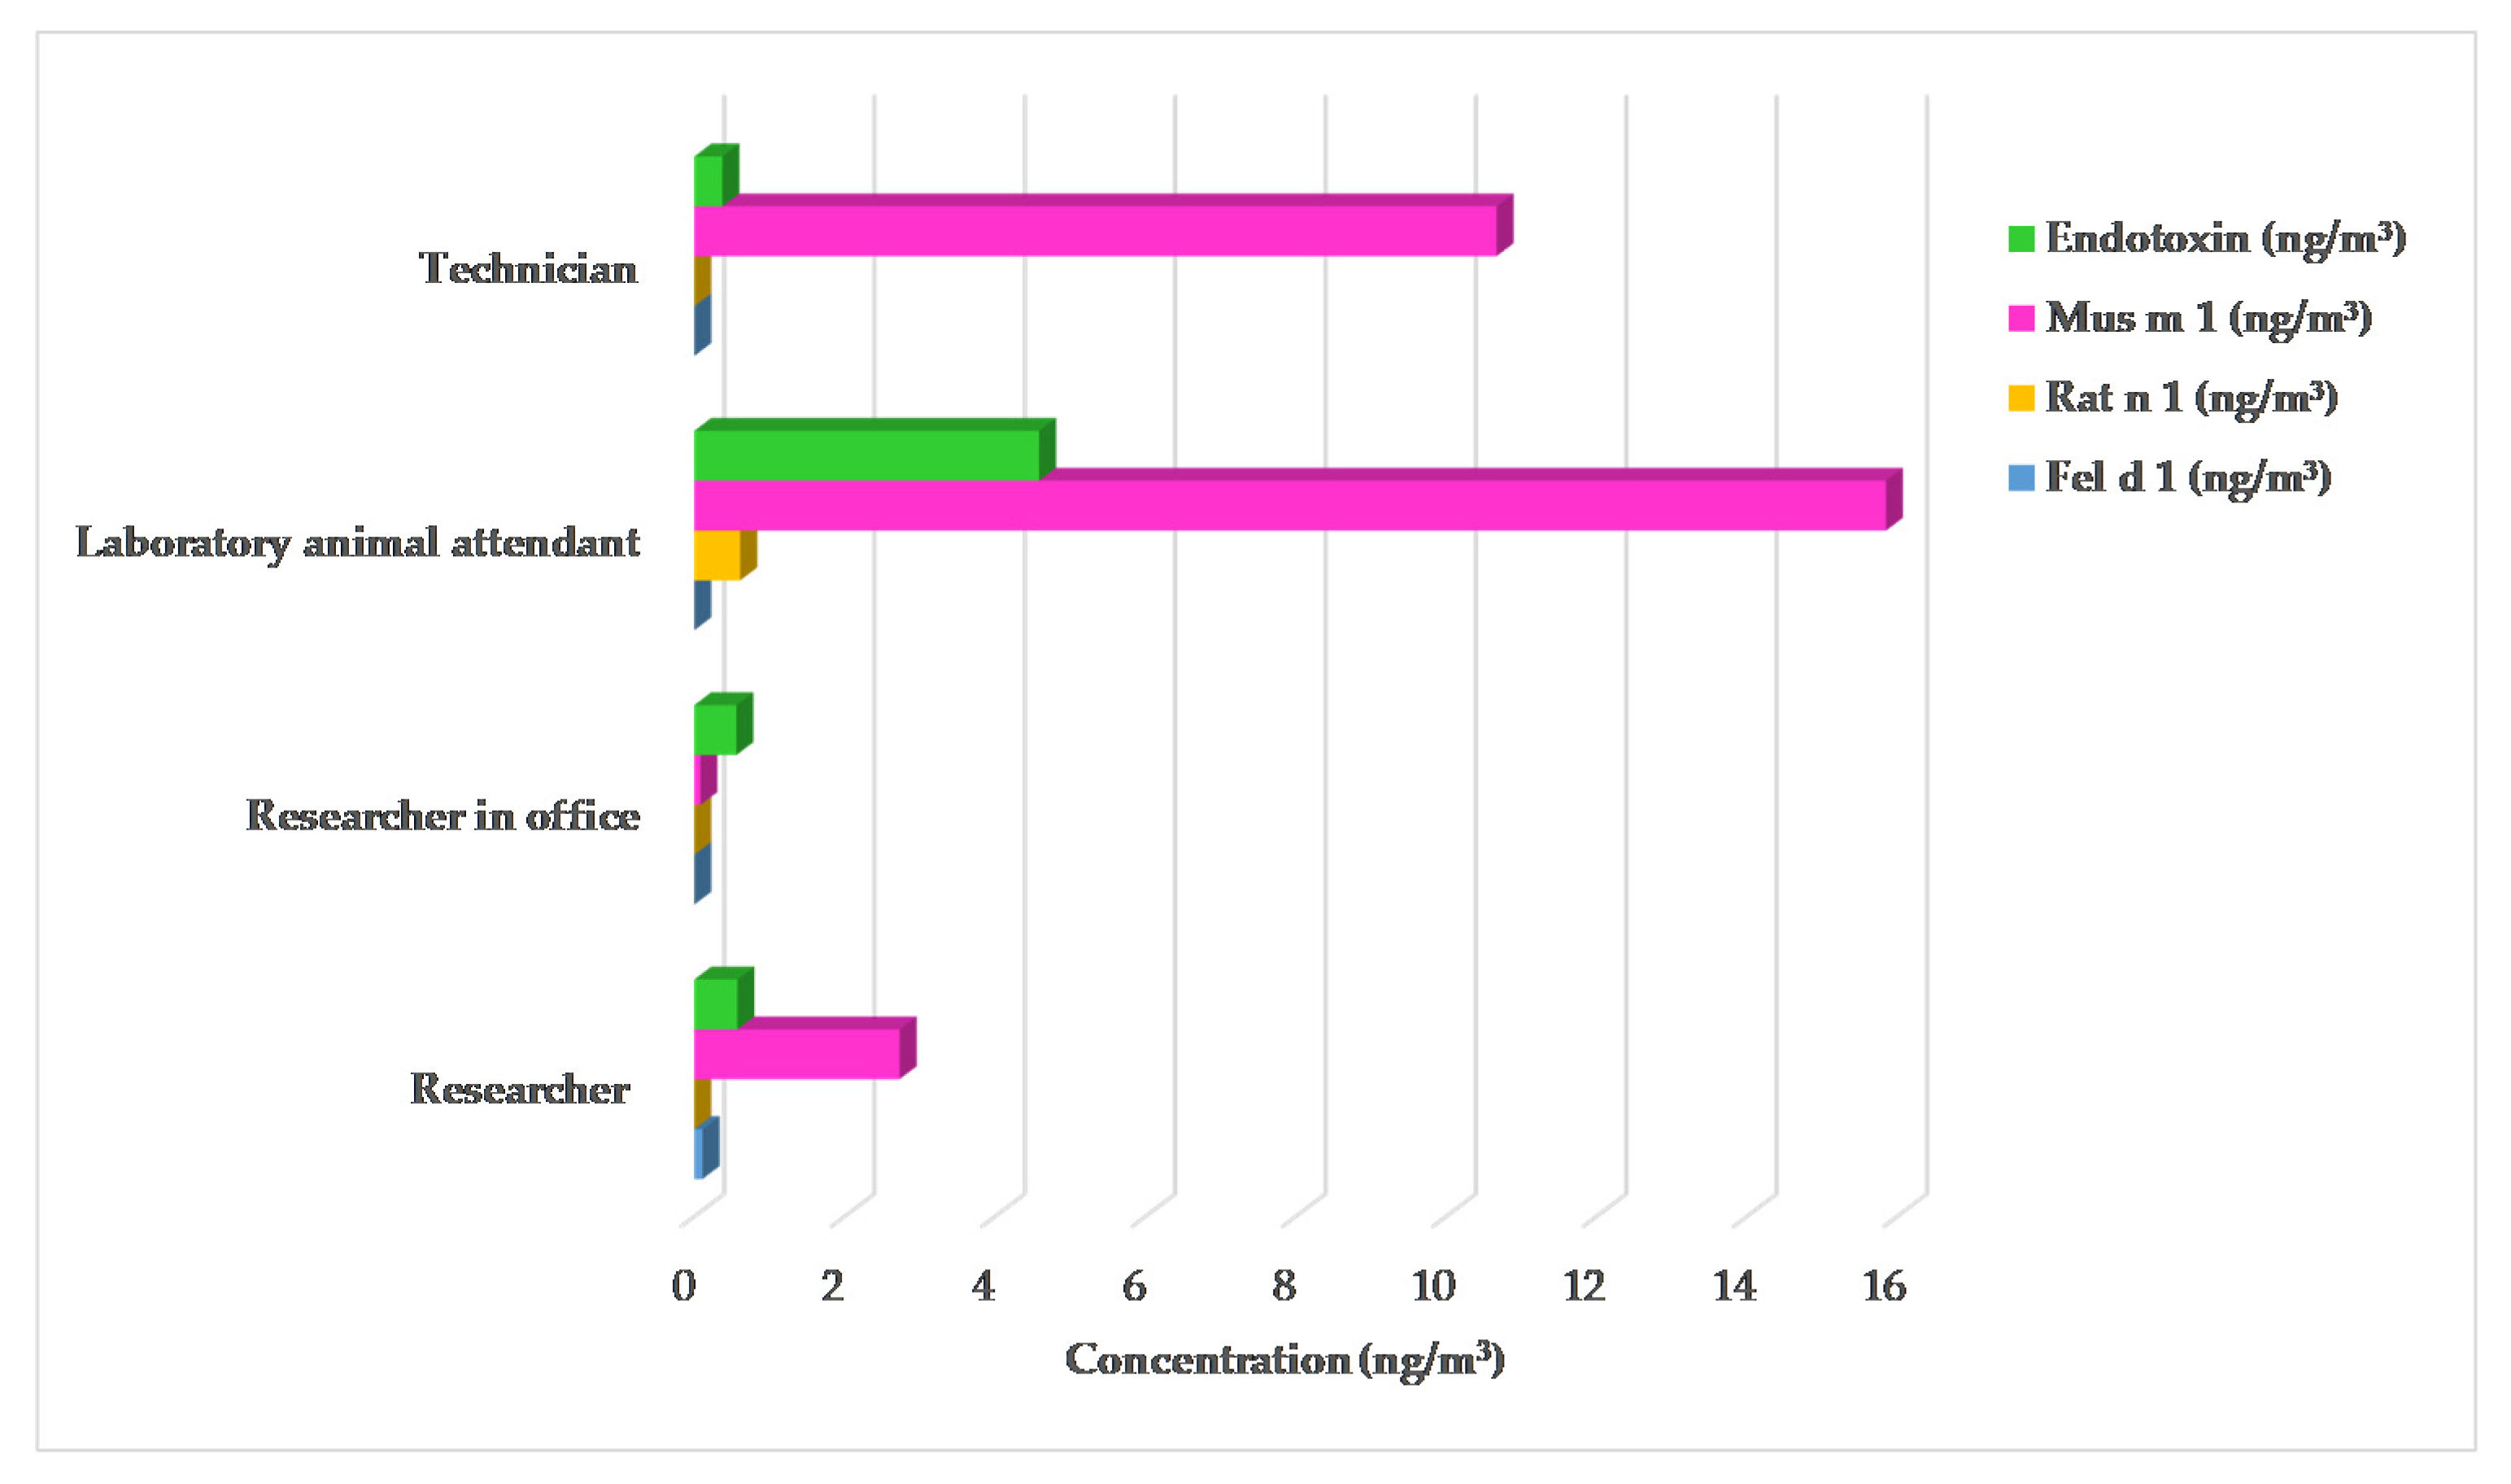
As it can be appreciated by
Table 1, the laboratory animal attendants are largely more exposed to endotoxins and allergens than the other categories. Furthermore, technicians have higher levels of mouse allergens than researchers. This fact can be visually evaluated by looking at
Figure 2. Fel d 1 was detected in three researchers (average concentration: 0.11 ng/m
3).
3.2. Comparison between the Different Groups
The statistical significance of the comparison between the different working tasks was also studied and the results are presented in
Table 2.
The factor “work category” was statistically significant in explaining the differences (p = 0.018) in the dose of the bio-contaminants.
3.3. Single Bio-Contaminant ANOVA
The single bio-contaminant ANOVA models gave significant results in the case of endotoxins (p = 0.006) and mouse allergens (p = 0.005).
A post hoc analysis with Bonferroni multiple comparison correction was also performed with the aim of comparing the mean of the different groups. As regards the endotoxin, a statistically significant result was found in the case of the comparison between the laboratory animal attendants and the researchers (p = 0.004) and the laboratory animal attendants and the office workers (p = 0.007).
In the case of the Mus m1 allergen, the laboratory animal attendants are exposed to doses larger than those the researchers (p = 0.001) and the office workers (p < 0.001) are exposed to.
As regards the Mus m 1 allergen, a statistically significant difference was also found between the technicians and the office workers (p = 0.038), the technicians’ dose being larger than that of the office workers, as would be expected.
4. Discussion
Personal exposure to airborne animal allergens and endotoxins was studied in a conventional animal facility. Laboratory animal attendants are the worker category at higher risk of exposure to endotoxins Mus m 1 and Rat n 1 than other personnel. This finding is largely expected and confirms the result of our previous study in which different activities were compared. Within that study, it was shown that changing cages, performed in animal rooms, and preparation of bedding and distribution of feed, performed in the storage area, are determinant factors in increasing the concentration of the airborne bio-contaminants [
24]. In particular, peaks of endotoxin (21.7 ng/m
3) were found in the storage area, while the highest concentration of the Mus m 1 allergen (61.5 ng/m
3) was detected in the dirty washing area. The results of personal air monitoring are in agreement with the fact that the animal attendants carried out most of their working tasks in the previously cited environments.
Considering the average concentration of the bio-contaminants under investigation by work category (
Table 1), the animal attendants showed the highest value of endotoxin (4.59 ng/m
3) with respect to researchers (0.57 ng/m
3), researchers who work only in an office (0.56 ng/m
3) and technicians (0.37 ng/m
3). This could be due to the fact that, among the various activities carried out by the animal attendants, there are those performed in the storage area, which was found by the authors to be the environment most contaminated by this bio-contaminant. Bedding material, in fact, could be a significant source of accumulation and release of bacterial endotoxins [
4,
24,
34]. Even if average doses are below the health-based recommended occupational exposure limit proposed by the Dutch Expert Committee on Occupational Safety (DECOS, 90 EU/m
3 corresponding to about 9 ng/m
3), two values above the limit were measured for two animal attendants (16.29 ng/m
3 and 9.12 ng/m
3), confirming that this work category has the highest risk of exposure to these bio-contaminants.
Exceeding the recommended limit value is known to be associated with adverse respiratory effects, but also low-dose (<10 ng/m
3) long term effects cannot be ruled out as scientific evidence for this is provided by several studies [
35].
Lay et al. (2017), studying the effect of environmental microbial exposures on the human microbiome in animal care workers, found average endotoxin levels much lower (median: from undetectable to 0.1 ng/m
3) than the levels found in this study; the discrepancy with the data presented in this study could be explained by the different position of personal samplers (stationary, one meter from the worker) or, more likely, by the use of ventilated cages in the facility analyzed by Lay and co-authors [
5].
Regarding rat and mouse allergens, our results showed higher levels for mouse than for rat allergens and confirm the animal attendants as the worker category at higher risk of exposure (15.85 ng/m
3), followed by technicians (10.67 ng/m
3), researchers (2.73 ng/m
3) and researchers in an office (0.08 ng/m
3). It is worth noticing that the presence of Fel d1 allergen (0.11 ng/m
3) in researchers suggests a passive diffusion between the different environments inside the animal facilities (as previously reported in Marcelloni et al., 2019) and between life and work settings [
23,
25,
29]. The discrepancies found between our study and studies conducted in other animal facilities can be explained by different housing of the animals [
29,
36,
37].
5. Conclusions
Allergens and endotoxin exposure is a critical issue mainly affecting workers employed in indoor animal care. Starting from the environmental monitoring of these bio-contaminants with conventional analytical methods, effort should be made to improve some aspects of these methodologies. The monitoring conducted during the whole working shift with personal sampling techniques gives precise results in terms of personal exposure levels, but at the same time, more detailed information is lacking. In particular, the personal integrated monitoring strategy, conducted during the entire working shift, only permits a cumulative level evaluation, not distinguishing the hours of higher exposure. In the present study, personal monitoring was introduced in addition to environmental monitoring in a static position with the aim of assessing both the individual risk and the risk associated with different workplaces and job tasks.
Average endotoxin concentrations were found below the exposure limits proposed by the Dutch Expert Committee on Occupational Safety but individual data exceeding these limits were also found, suggesting the urgency of improving prevention strategies inside the animal facilities. More integrated analysis, including individual sensitization, and the role of co-factors and co-exposures, should be promoted, aimed at improving the biological risk management and the preventive measures both in work and living environments.


