1. Introduction
The compaction of hot mix asphalt (HMA) is the last and most critical process during asphalt layer construction, which is critical for the safety and durability of an asphalt pavement. Improper compaction can cause a negative effect on the road surface performance of HMA [
1]. The compacted layer usually has a high percentage of air voids if under-compaction. This may cause the pavement to be more vulnerable to oxidation and moisture infiltration [
2]. Conversely, over-compaction will lead to a low percentage of air voids, which is the main cause of asphalt bleeding in high-temperature weather [
3]. Therefore, quality control during compaction is a must for long-term performance assurance of asphalt pavement [
4]. Currently, the most reliable method of measuring pavement density is to evaluate air voids of the extraction gained by field cores at limited locations. This test method is time-consuming, costly, destructive, and not indicative of the overall pavement quality [
5]. Alternative ways to obtain the density of HMA layers in the field include nuclear density gauges and non-nuclear density gauges. However, these methods provide only point-wise measurements of density and cannot reflect the overall quality of the HMA layer in real time during compaction.
To solve these issues, the intelligent compaction (IC) technique has been evolved for more than 20 years to evaluate real-time compaction quality in the process of construction. So far, several IC measurement values (ICMVs) are proposed to indicate the compaction quality, such as some harmonic-based indicators including Compaction Meter Value (CMV), Compaction Control Value (CCV), Vibrating Compaction Value (VCV), and some mechanical-based indicators including vibration modulus (E
vib) and soil stiffness (Ks) [
6,
7,
8,
9,
10]. Among them, the CMV is calculated by the first and fundamental harmonic content, which is widely used for quality evaluation in the compaction of roadbed materials. At present, most research and application of these IC technologies have been conducted in highway and railway subgrades and earth dams [
11,
12,
13,
14,
15]. However, some variability such as operational parameters of the compactor, characteristics of subgrade materials, and mix properties, make the above-mentioned IC measurement values difficult to accurately predict compaction quality, and thus not yet widely recognized [
16]. In particular, since the strong nonlinear interaction between the roller drum and the pavement layer, and the complexity and flexibility of various factors as mentioned above, few studies on IC of asphalt layers are reported [
17,
18,
19].
In recent years, a novel IC system based on the artificial neural network (ANN), named the IC analyzer (ICA), was proposed. It provides another way to estimate the stiffness of subgrade in real-time and forms an extension for estimating the quality of asphalt pavement during construction [
16,
20,
21,
22]. To verify the validity of the neural network-based IC method, a case study of the vibrating compaction process for the asphalt layer was conducted in this paper. The vibration patterns of the drum were identified and classified by using an ANN classifier. A field experiment of HMA compaction was designed. The field experiment was performed in a construction site to collect the vibration signals, while the degree of compaction was measured. The collected vibration signals were processed and the frequency features of vibration patterns were extracted. The processed signals were tagged with their corresponding compaction level to form the sample dataset for training the ANN model. At last, the predictions made by ANN were compared with the measuring results from a non-nuclear density gauge (NNDG) to test the performance of the ANN classifier.
2. Experimental Program and Signal Processing
A coupled system is assumed to be composed of the vibratory roller and the pavement underneath during the compaction. The response of the coupled system is influenced by the varying degree of compaction, causing the different vibration patterns of the drum. A mapping relationship should exist between vibration pattern and degree of compaction. The vibration signals and the degree of compaction were measured in a field compaction experiment. Then, the mapping relationship could be obtained by the ANN.
2.1. Experimental Program
In this study, a field test was performed in a construction site of Ning-Liang expressway project located in Shandong Province, China.
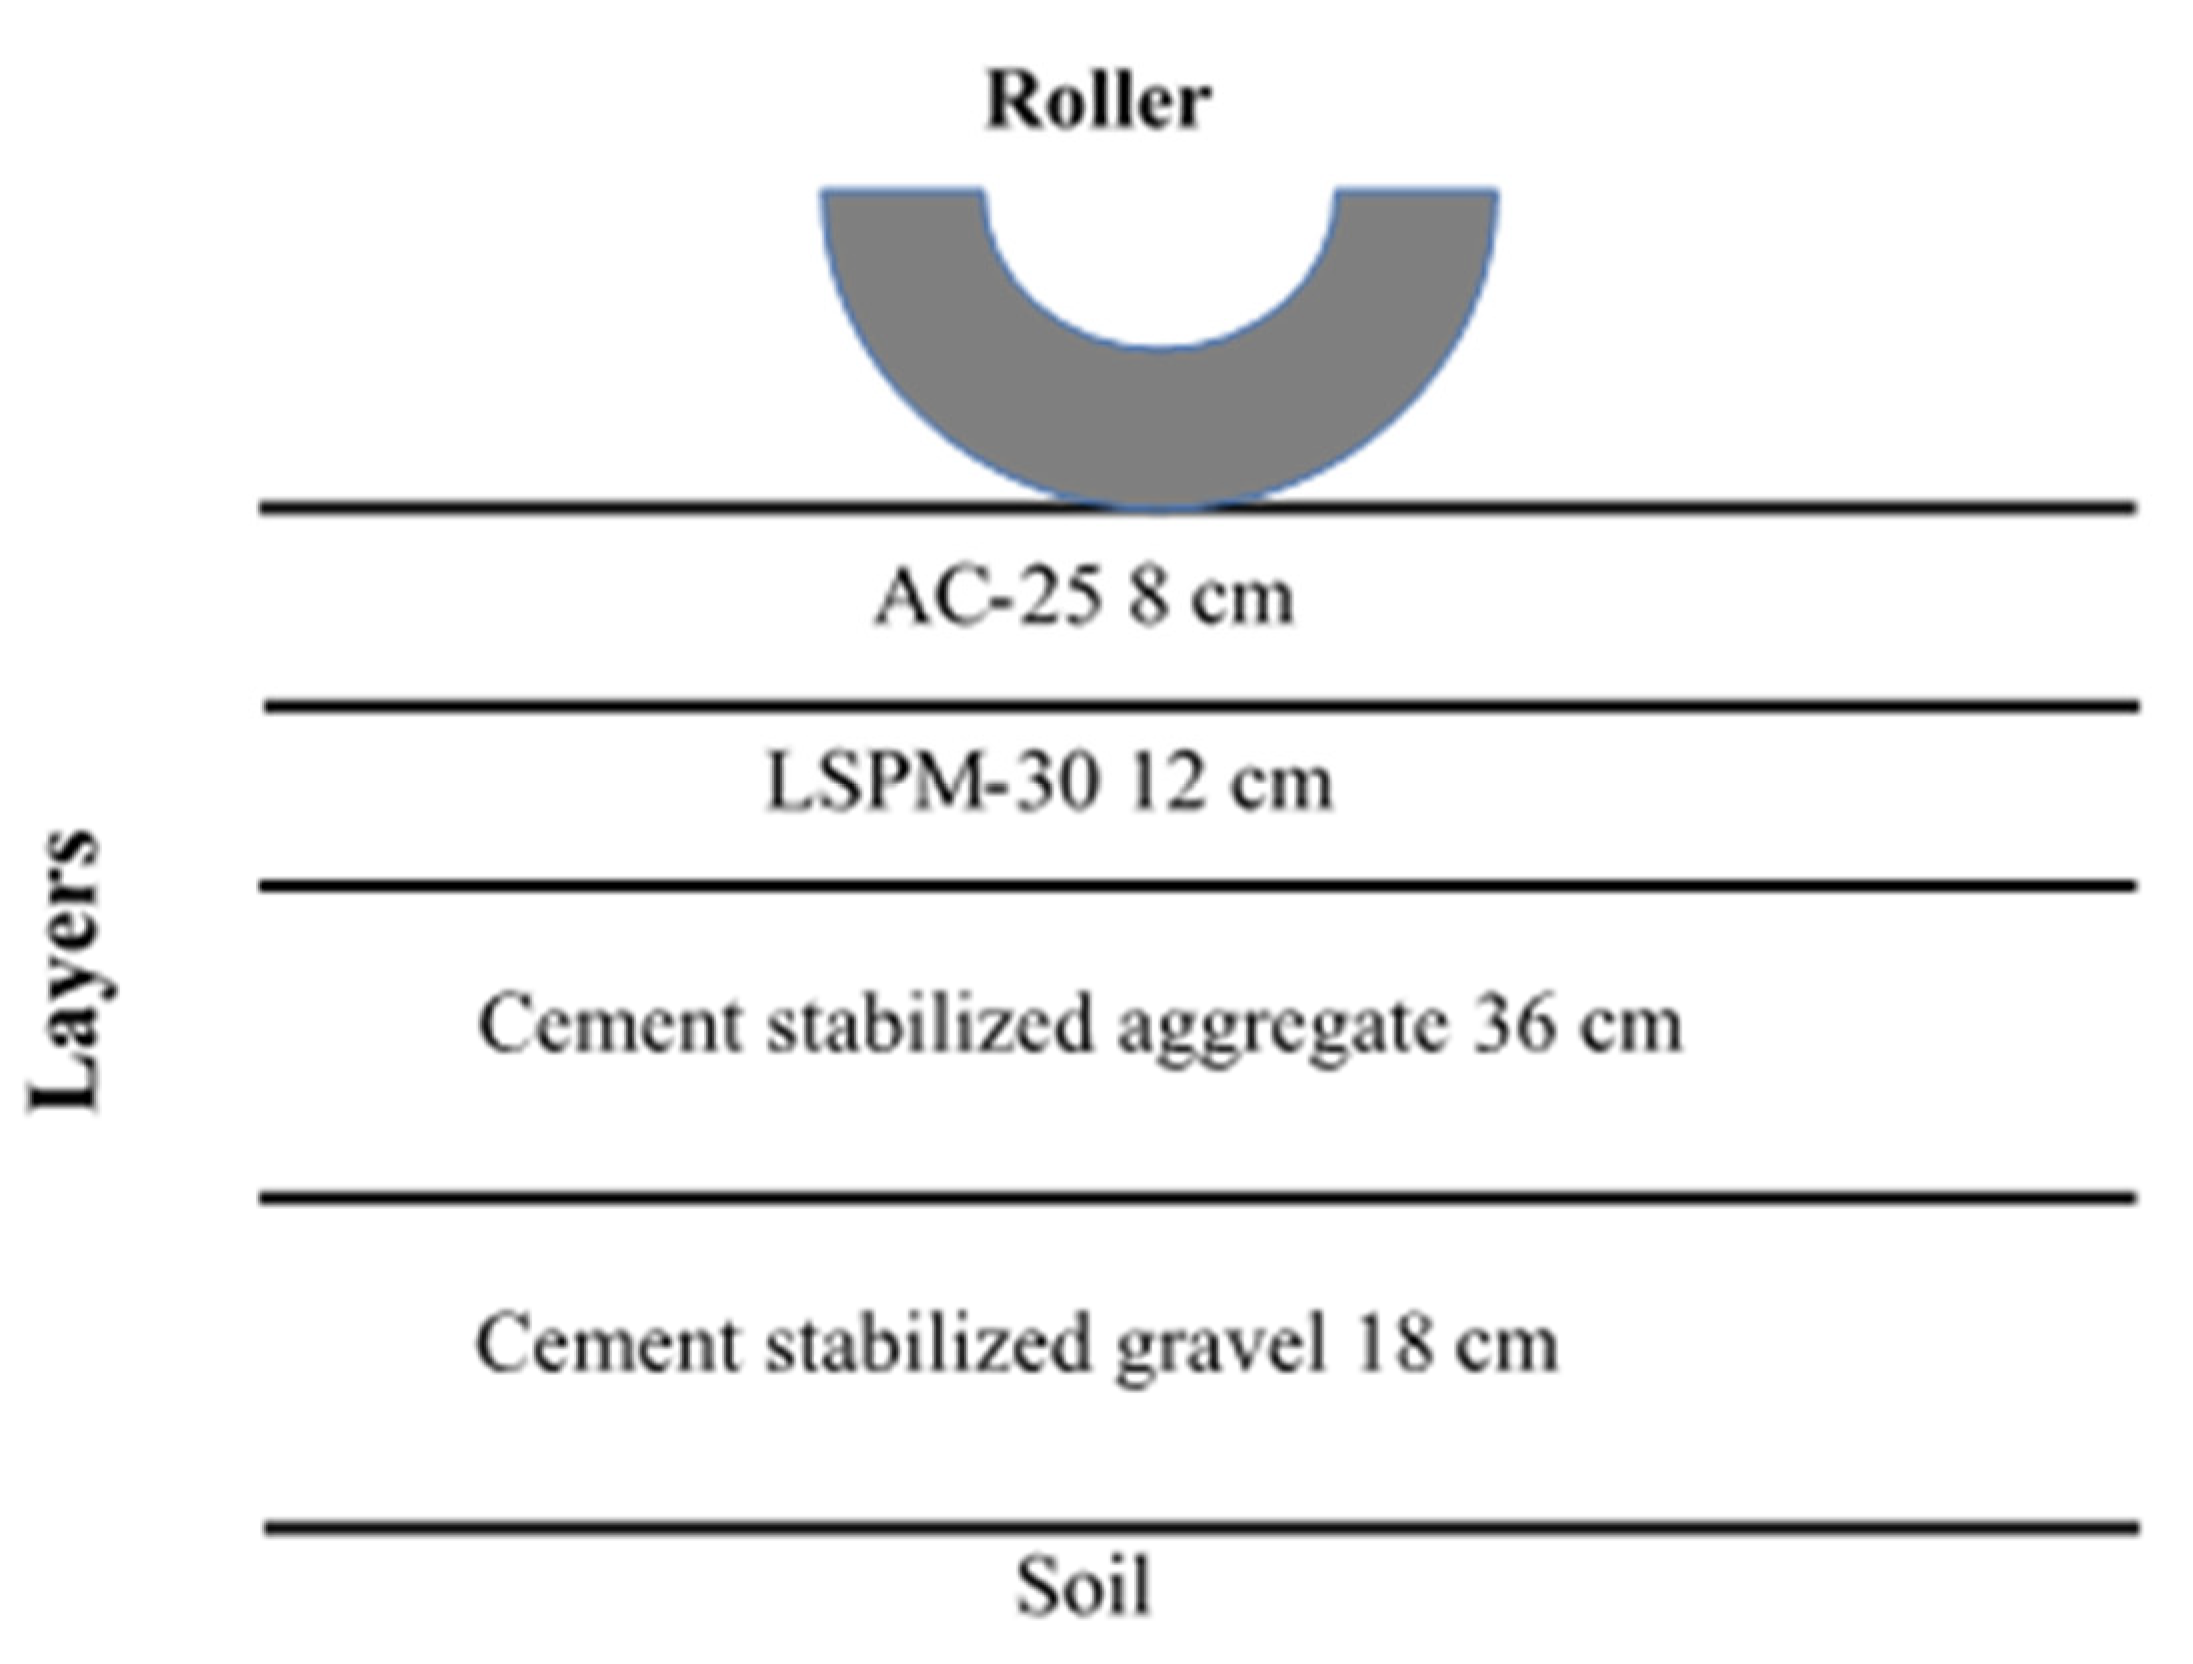
Table 1 shows the pavement structure in the project, including the subgrade, one subbase layer, two semi-rigid base layers, one flexible base layer, and three hot-mix asphalt (HMA) surface layers. The compaction test was performed at the AC-25 layer with a thickness of 8 cm, as is shown in
Figure 1. A Bomag roller with a single drum was used in this test. The weight of the drum is 13,000 kg, exerting a vertical force to the pavement. Other main operating parameters, such as speed and frequency, were selected by the paving crew based on their experience. The roller was operated at a speed of about 1 m/s, a frequency of 50 Hz, and an amplitude of approximately 0.35 mm in the vibrating compaction process.
Two accelerometers were used to collect the vertical vibration acceleration signals: one was carefully mounted on the drum frame and another one was mounted on the floor of the cab, as shown in
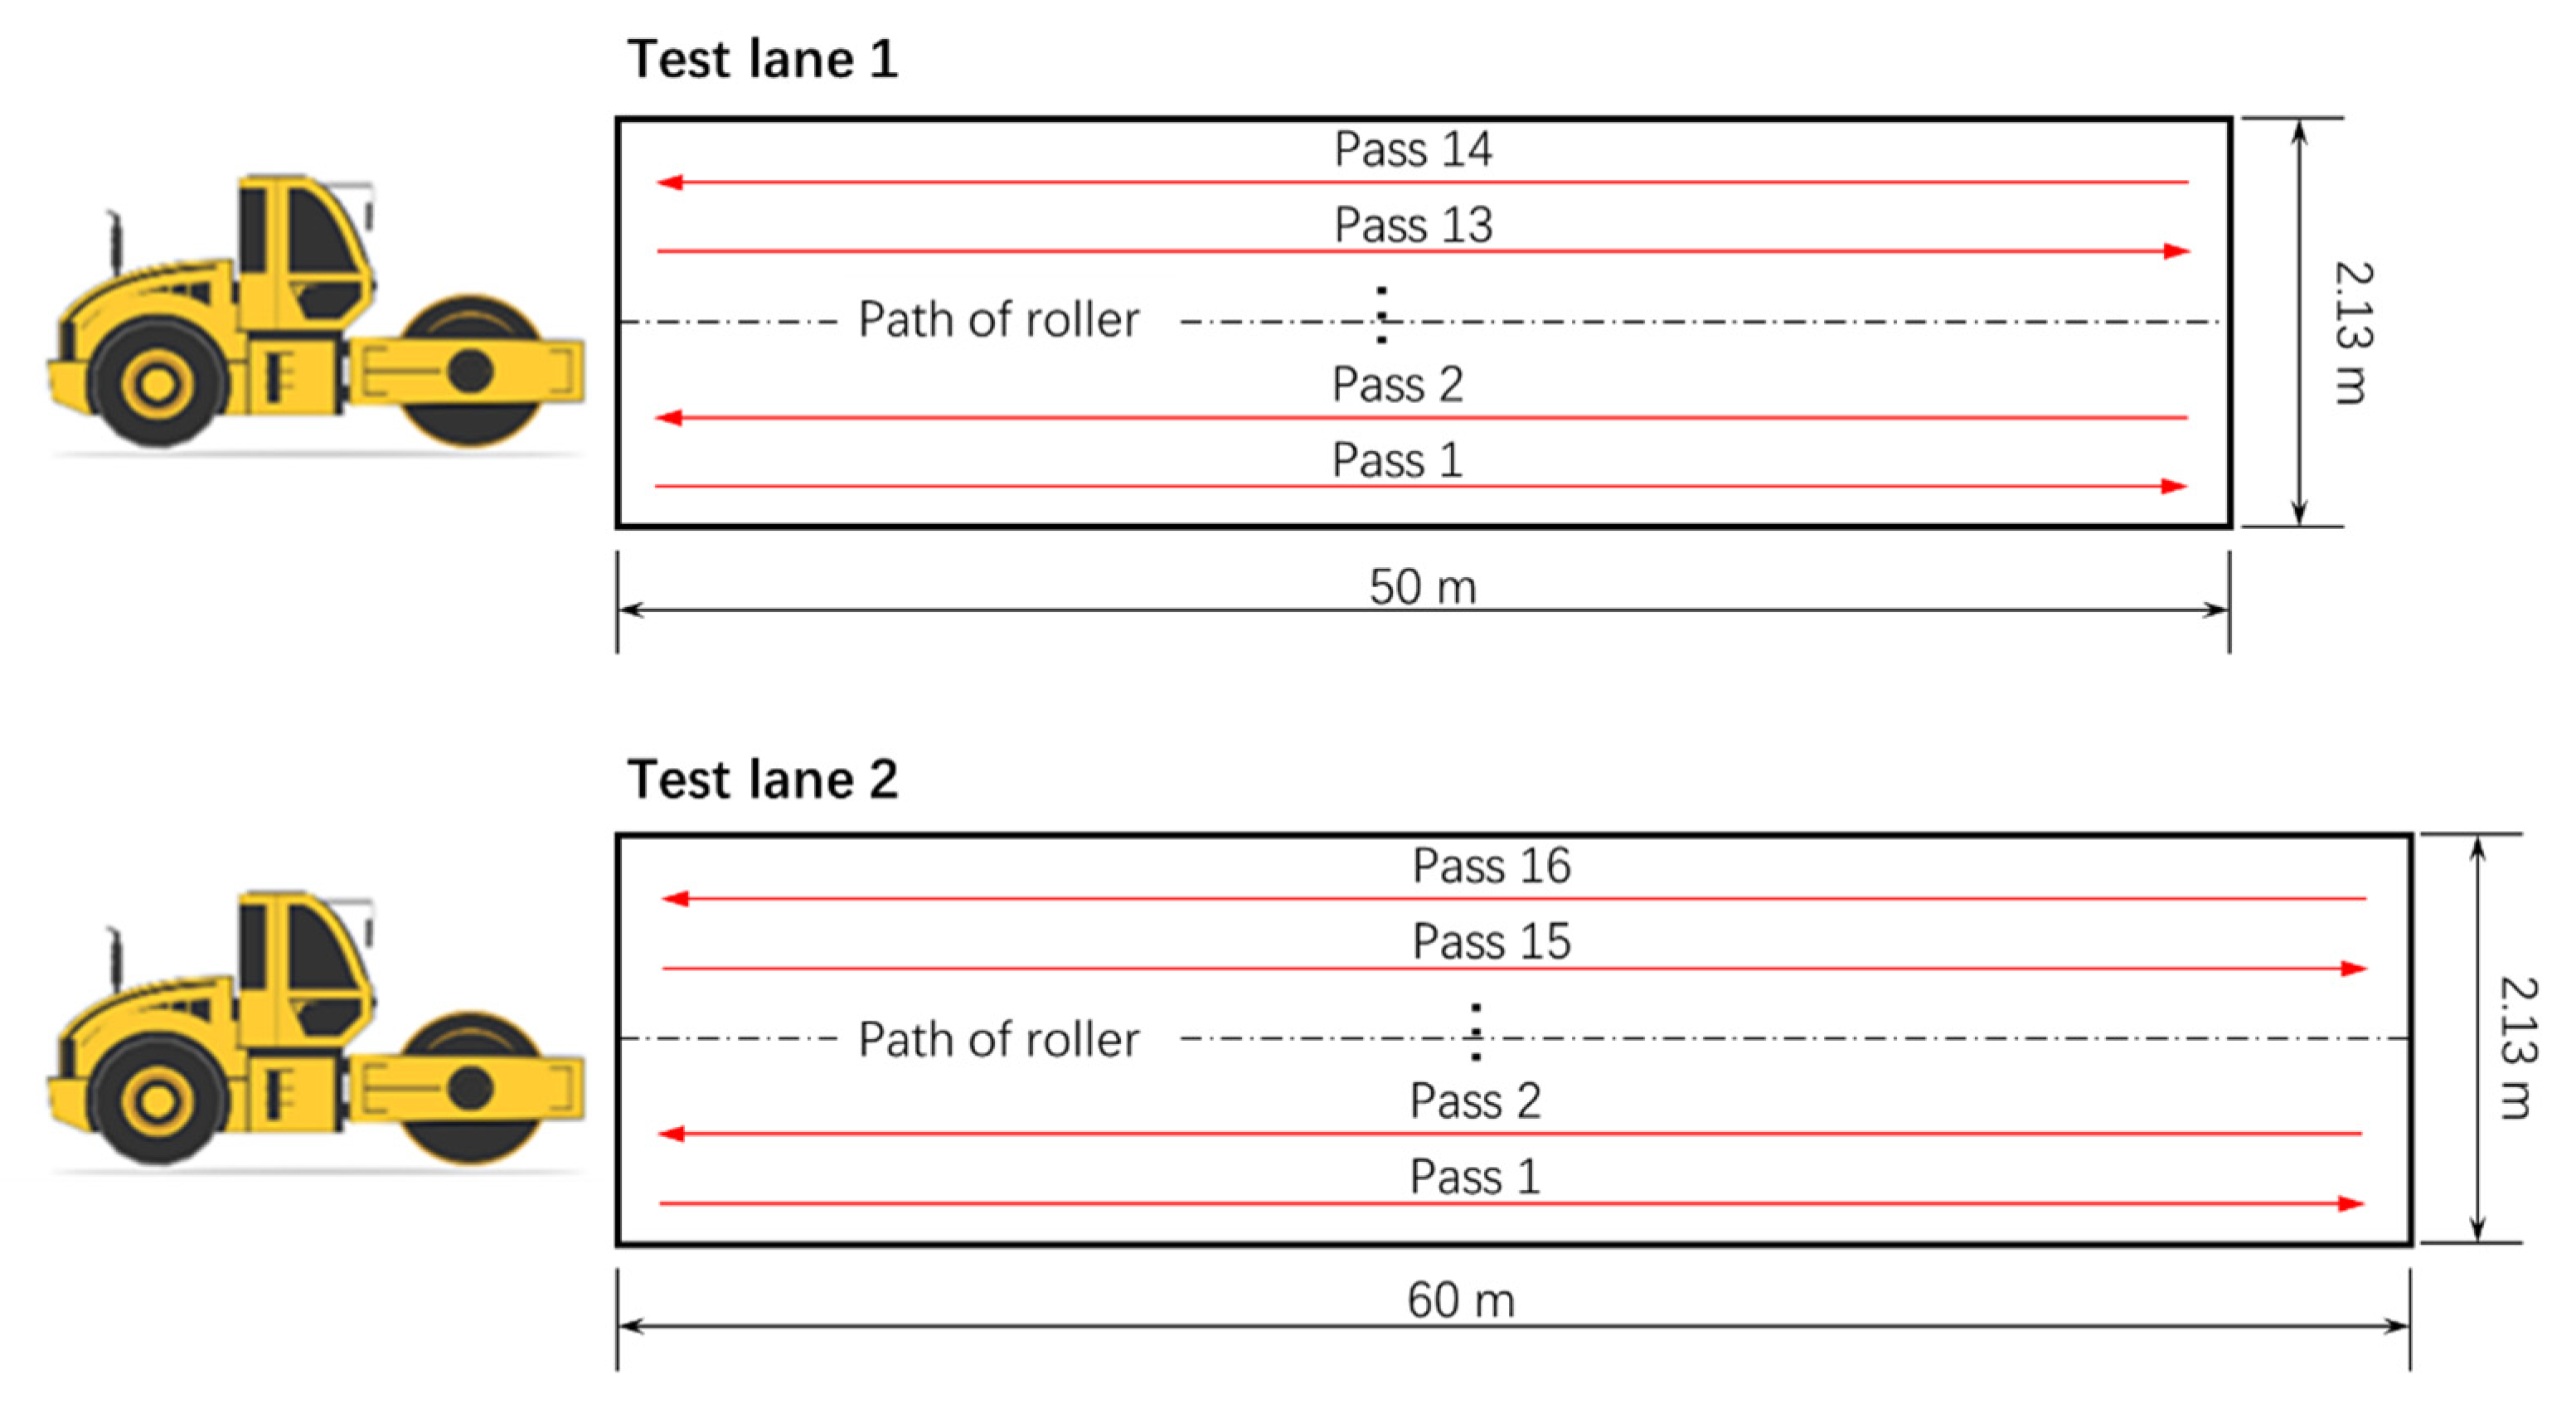
Figure 2. The compaction was performed on two test lanes. The lengths of “test lane 1” and “test lane 2” were 50 m and 60 m, respectively. The width of the test lane was 2.13 m. The roller pass trajectory on each test lane is shown in
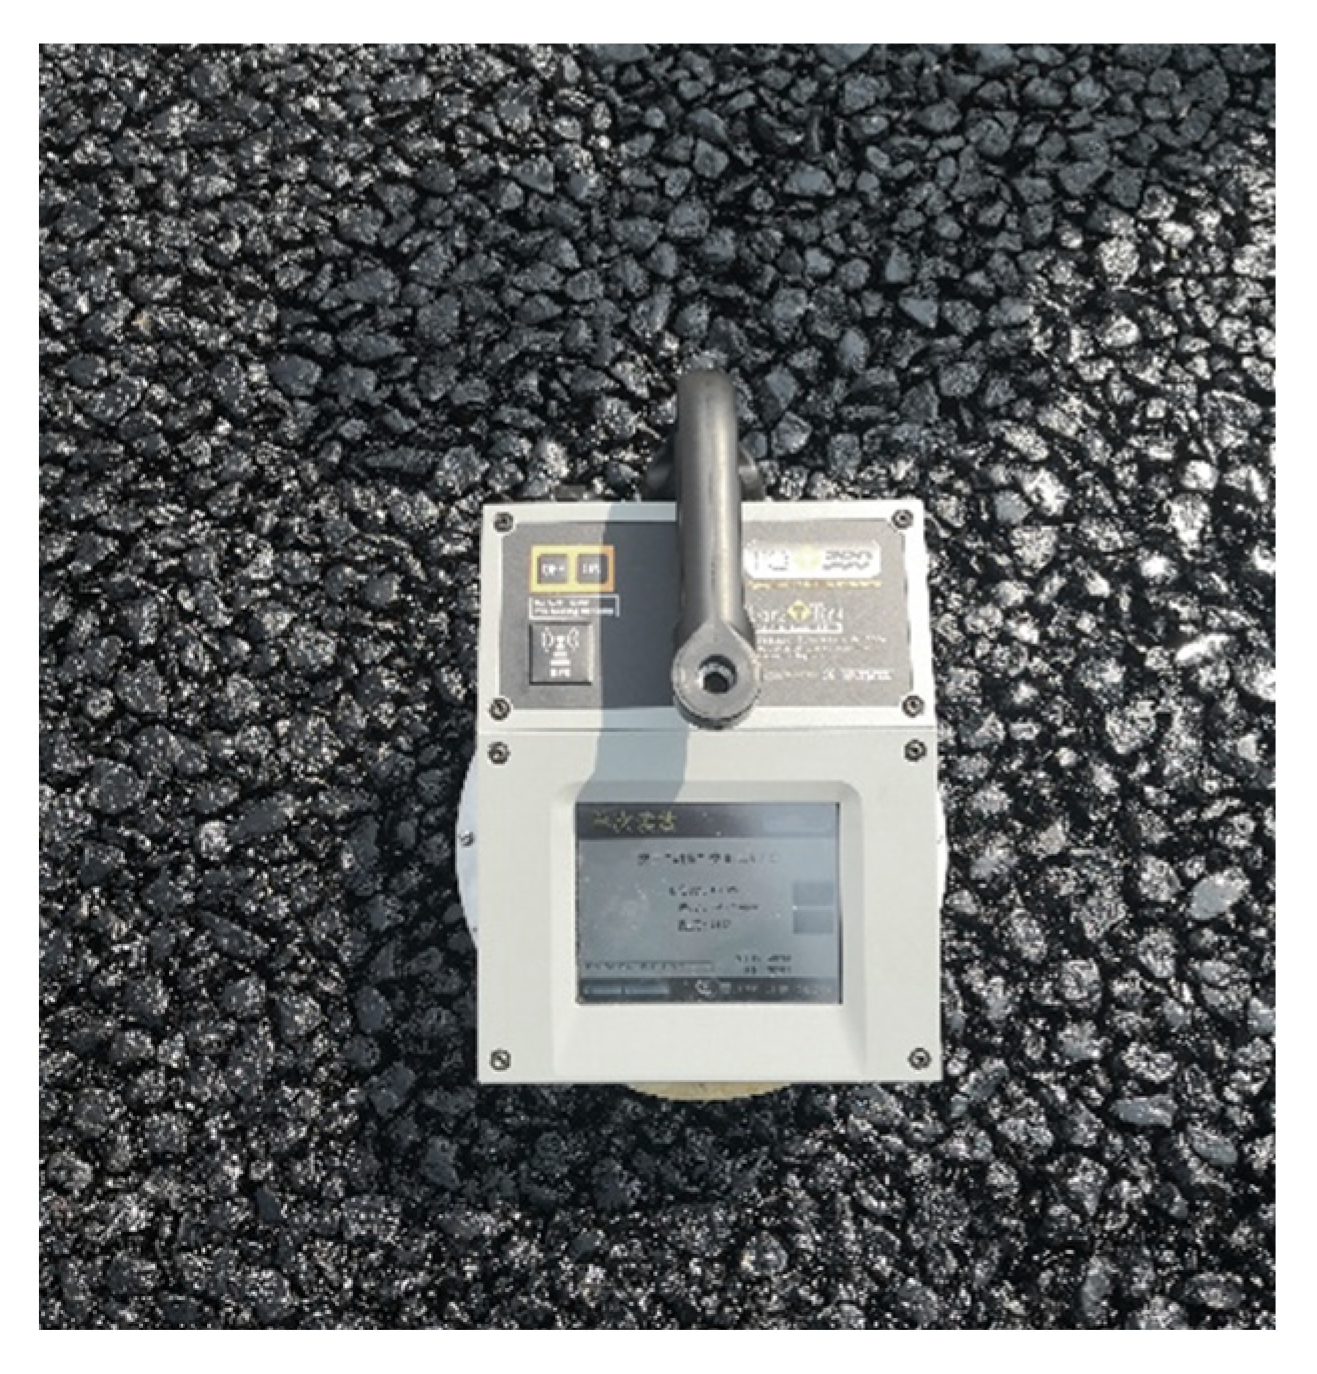
Figure 3. The number of compaction passes performed for “test lane 1” and “test lane 2” were 14 and 16, respectively. In this study, TransTech’s Pavement Quality Indicator Model 380 (PQI380) was employed in in situ tests, as shown in
Figure 4. PQI380 uses impedance spectroscopy to measure the electrical response of asphalt from which the density is calculated. The density determined by the PQI380 is highly material-dependent, so it is required that the mix information for each mix design is input accurately into the gauge. The mix information includes stone sizes, depth, and maximum theoretical density (MTD). For one pass, the degree of compaction was measured about every 10 m and the mean value is used to indicate the degree of compaction of this pass.
Figure 5 shows the measuring results of the degree of compaction. The open circles denote the degree of compaction measured in the in-situ tests, the solid circles denote the average degree of compaction for each pass. It can be seen from
Figure 5 that the degree of compaction increased with the increasing number of passes. For AC-25 asphalt mixture, it is generally required that the degree of compaction is at least 97%. In this compaction experiment, about 10 passes needed to be performed to satisfy the requirement.
2.2. Signal Processing
When the vibratory roller moved on the test lanes, the vibration signals measured by two accelerometers (in the cab and on the drum frame) were continuous. Since the velocity of the roller was about 1 m/s, it took about 60 s for one pass. Therefore, a 60-s long vibration signal was obtained from one accelerometer in one pass. A total of 60 long signals were collected since a total of 30 passes were performed on two test lanes. Theoretically, the frequency components of the vibration signals from the cab and drum frame should be the same, even though the amplitudes may be different.
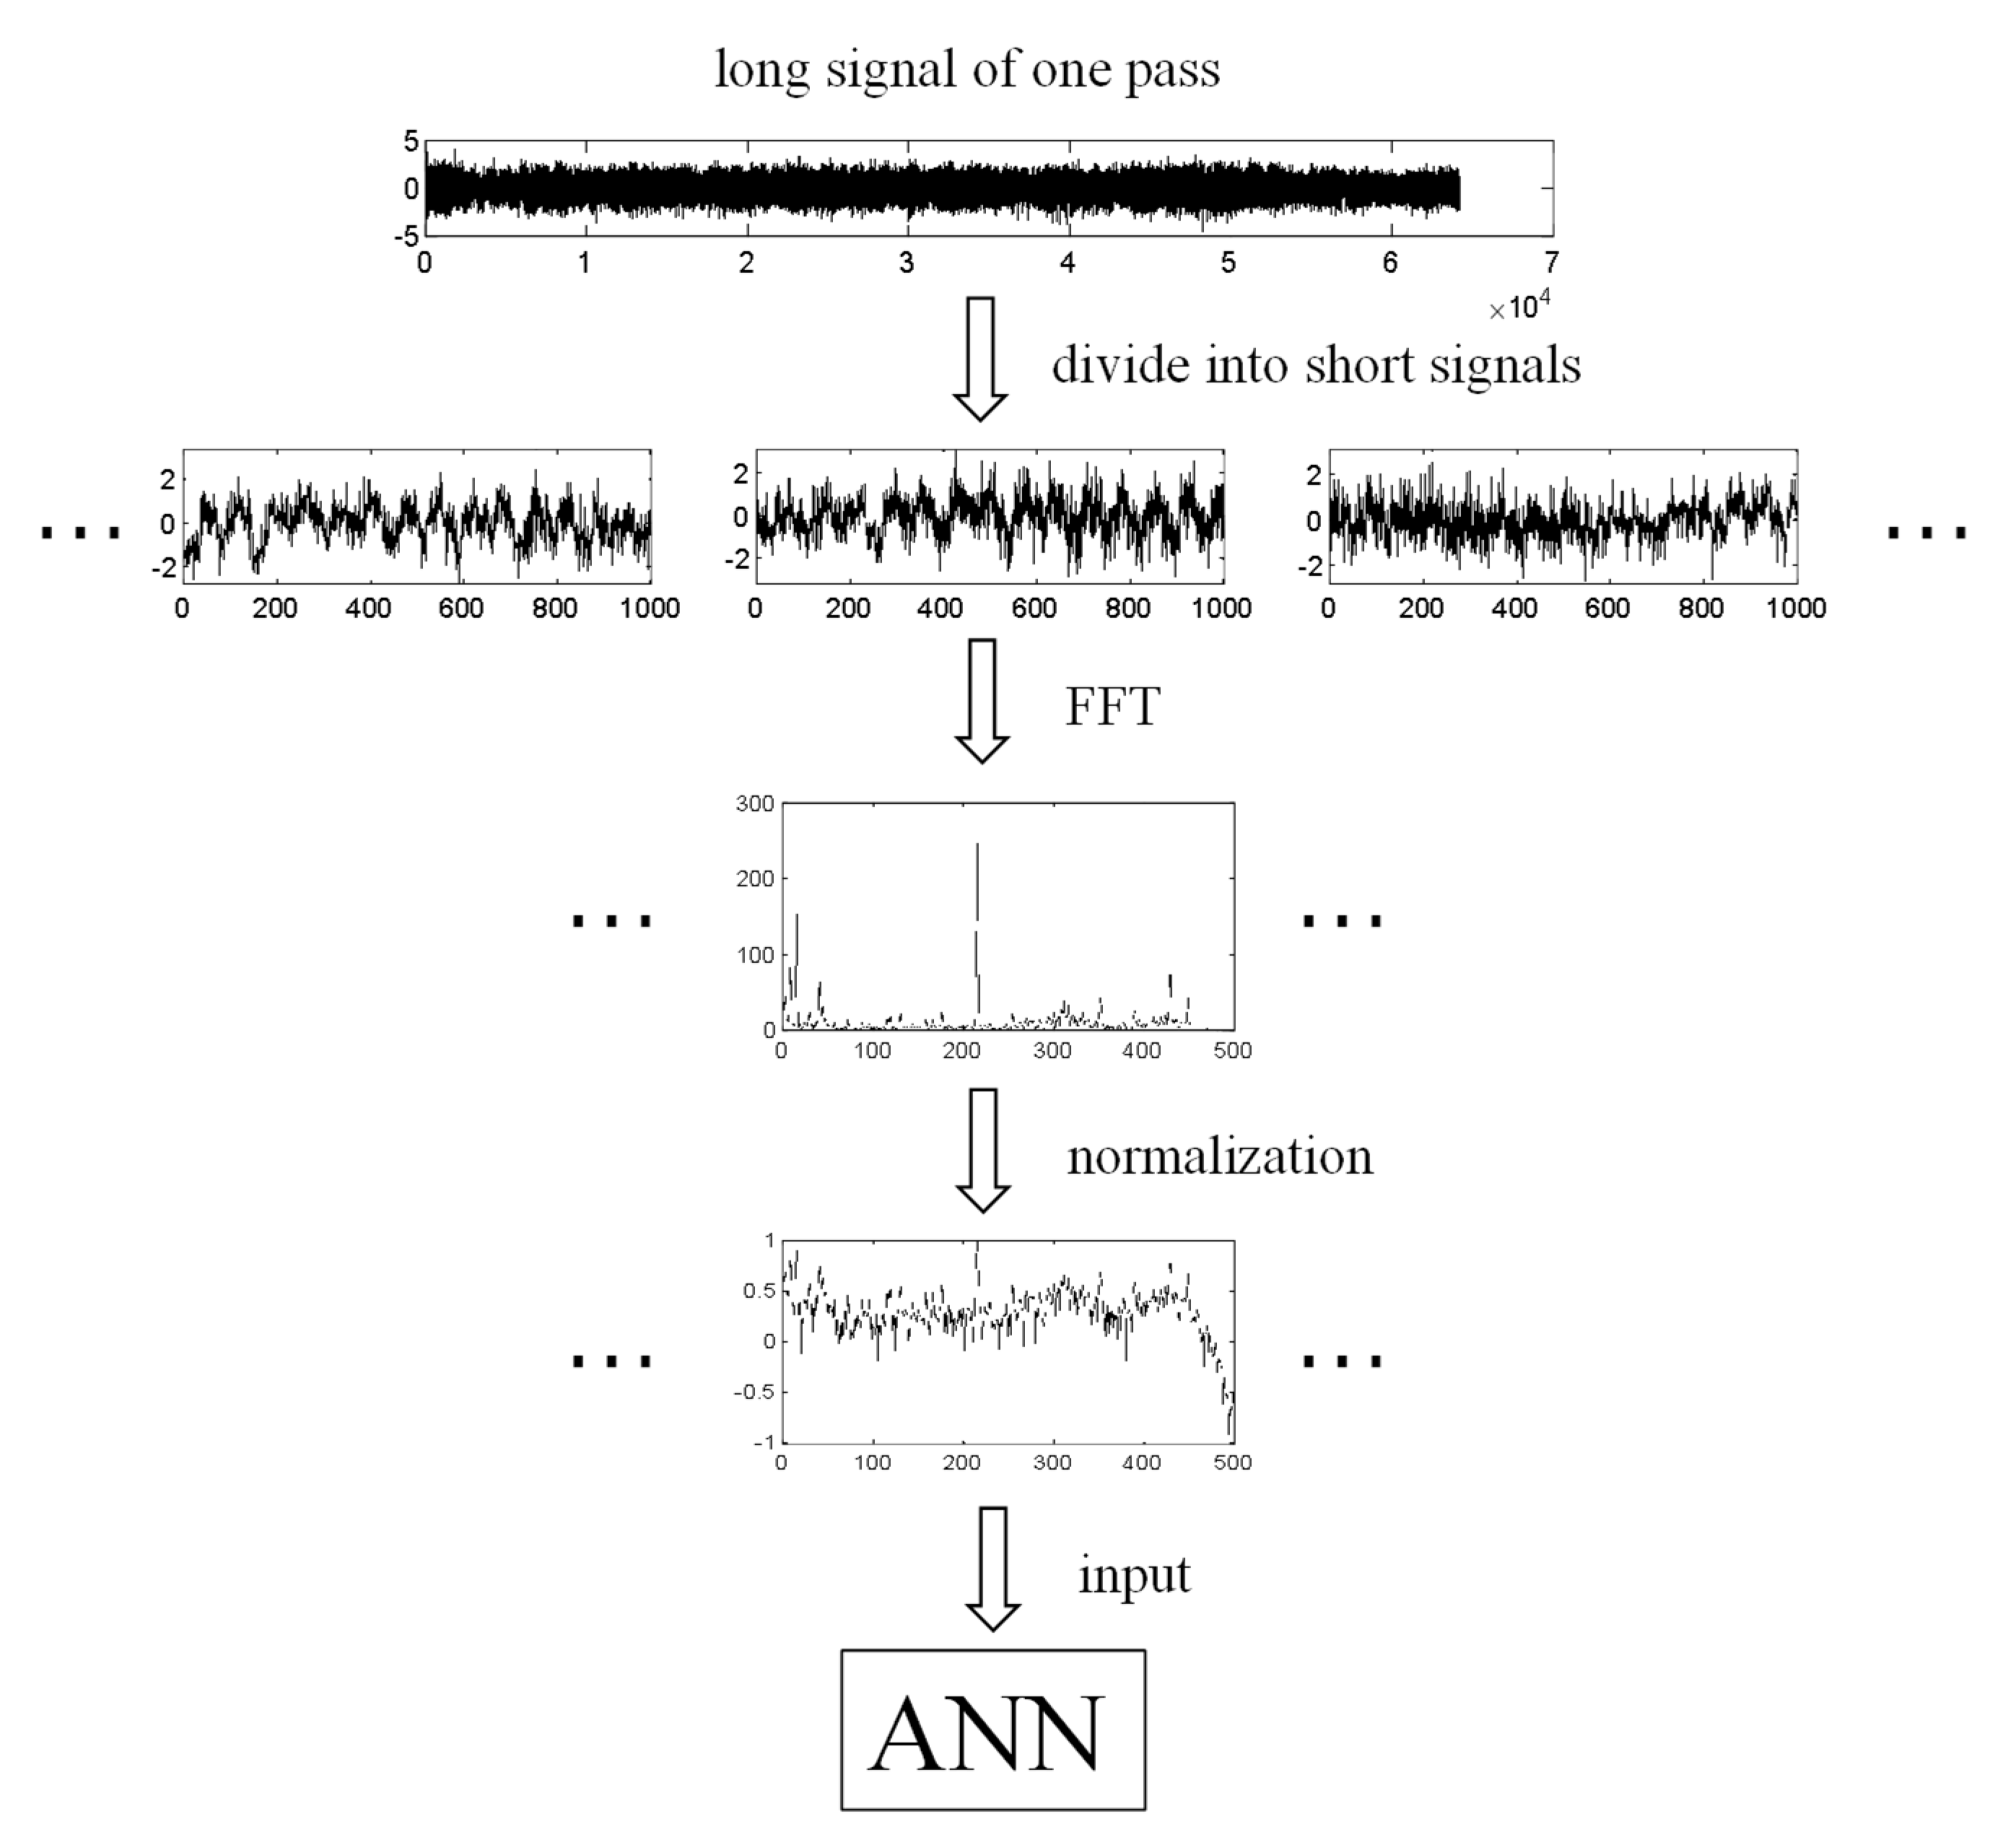
The vibration was sampled at 2 kHz. The 60-s long signal (collected in one pass) was successively split into many 0.5-s short signals. A short signal had 1000 contiguous data samples, the first 500 values of a short signal overlapped with the last 500 values of the previous short signal. The short signals were converted into the frequency domain by using a fast Fourier transform (FFT). The Nyquist frequency was 1 kHz since the vibration was sampled at 2 kHz. The Nyquist frequency is half of the sampling rate of a discrete signal processing system. According to the Nyquist–Shannon sampling theorem, if a system uniformly samples an analog signal at a rate that exceeds the signal’s highest frequency by at least a factor of two, the original analog signal can be perfectly recovered from the discrete values produced by sampling. In other words, the Nyquist frequency should be higher than the signal’s highest frequency to express the signal’s features accurately. The system in this study is a low-frequency system, 1 kHz Nyquist frequency is enough. By using the single-sided FFT, each short signal was converted to a frequency spectrum distributed between 0 and 1 kHz, expressed as an array of 500 elements,
a = (
a1,
a2, …,
a500). Therefore, the frequency features of the vibration signal were extracted by using FFT. In this study, the amplitude was not considered as a kind of feature. To eliminate the effects of amplitudes, array
a should be normalized. The normalized array
x was obtained as follows.
In Equation (1), some inconspicuous frequency components can be amplified by the logarithmic operation. The signal processing procedure is summarized as the following three steps:
The 60-s long vibration signal collected in one pass is successively split into many 0.5-s short signals.
The short signals are converted into the frequency domain by using a single-sided FFT.
The short signals are normalized by using Equation (1).
The signal processing method is also diagrammed in
Figure 6. The input arrays,
x, were the samples used to train the ANN model, the elements of
x were the features of the sample. Therefore, in this paper, 500 features were considered for a sample. Before the training, every sample was tagged with a target class, the signal sample’s corresponding compaction level. In this study, four compaction levels were considered and represented by four target classes, as is shown in
Table 2. Each sample was tagged according to the data of degree of compaction measured in the in-situ tests shown in
Figure 5, then the tagged samples formed the dataset to train the ANN model.
3. Development of ANN Model
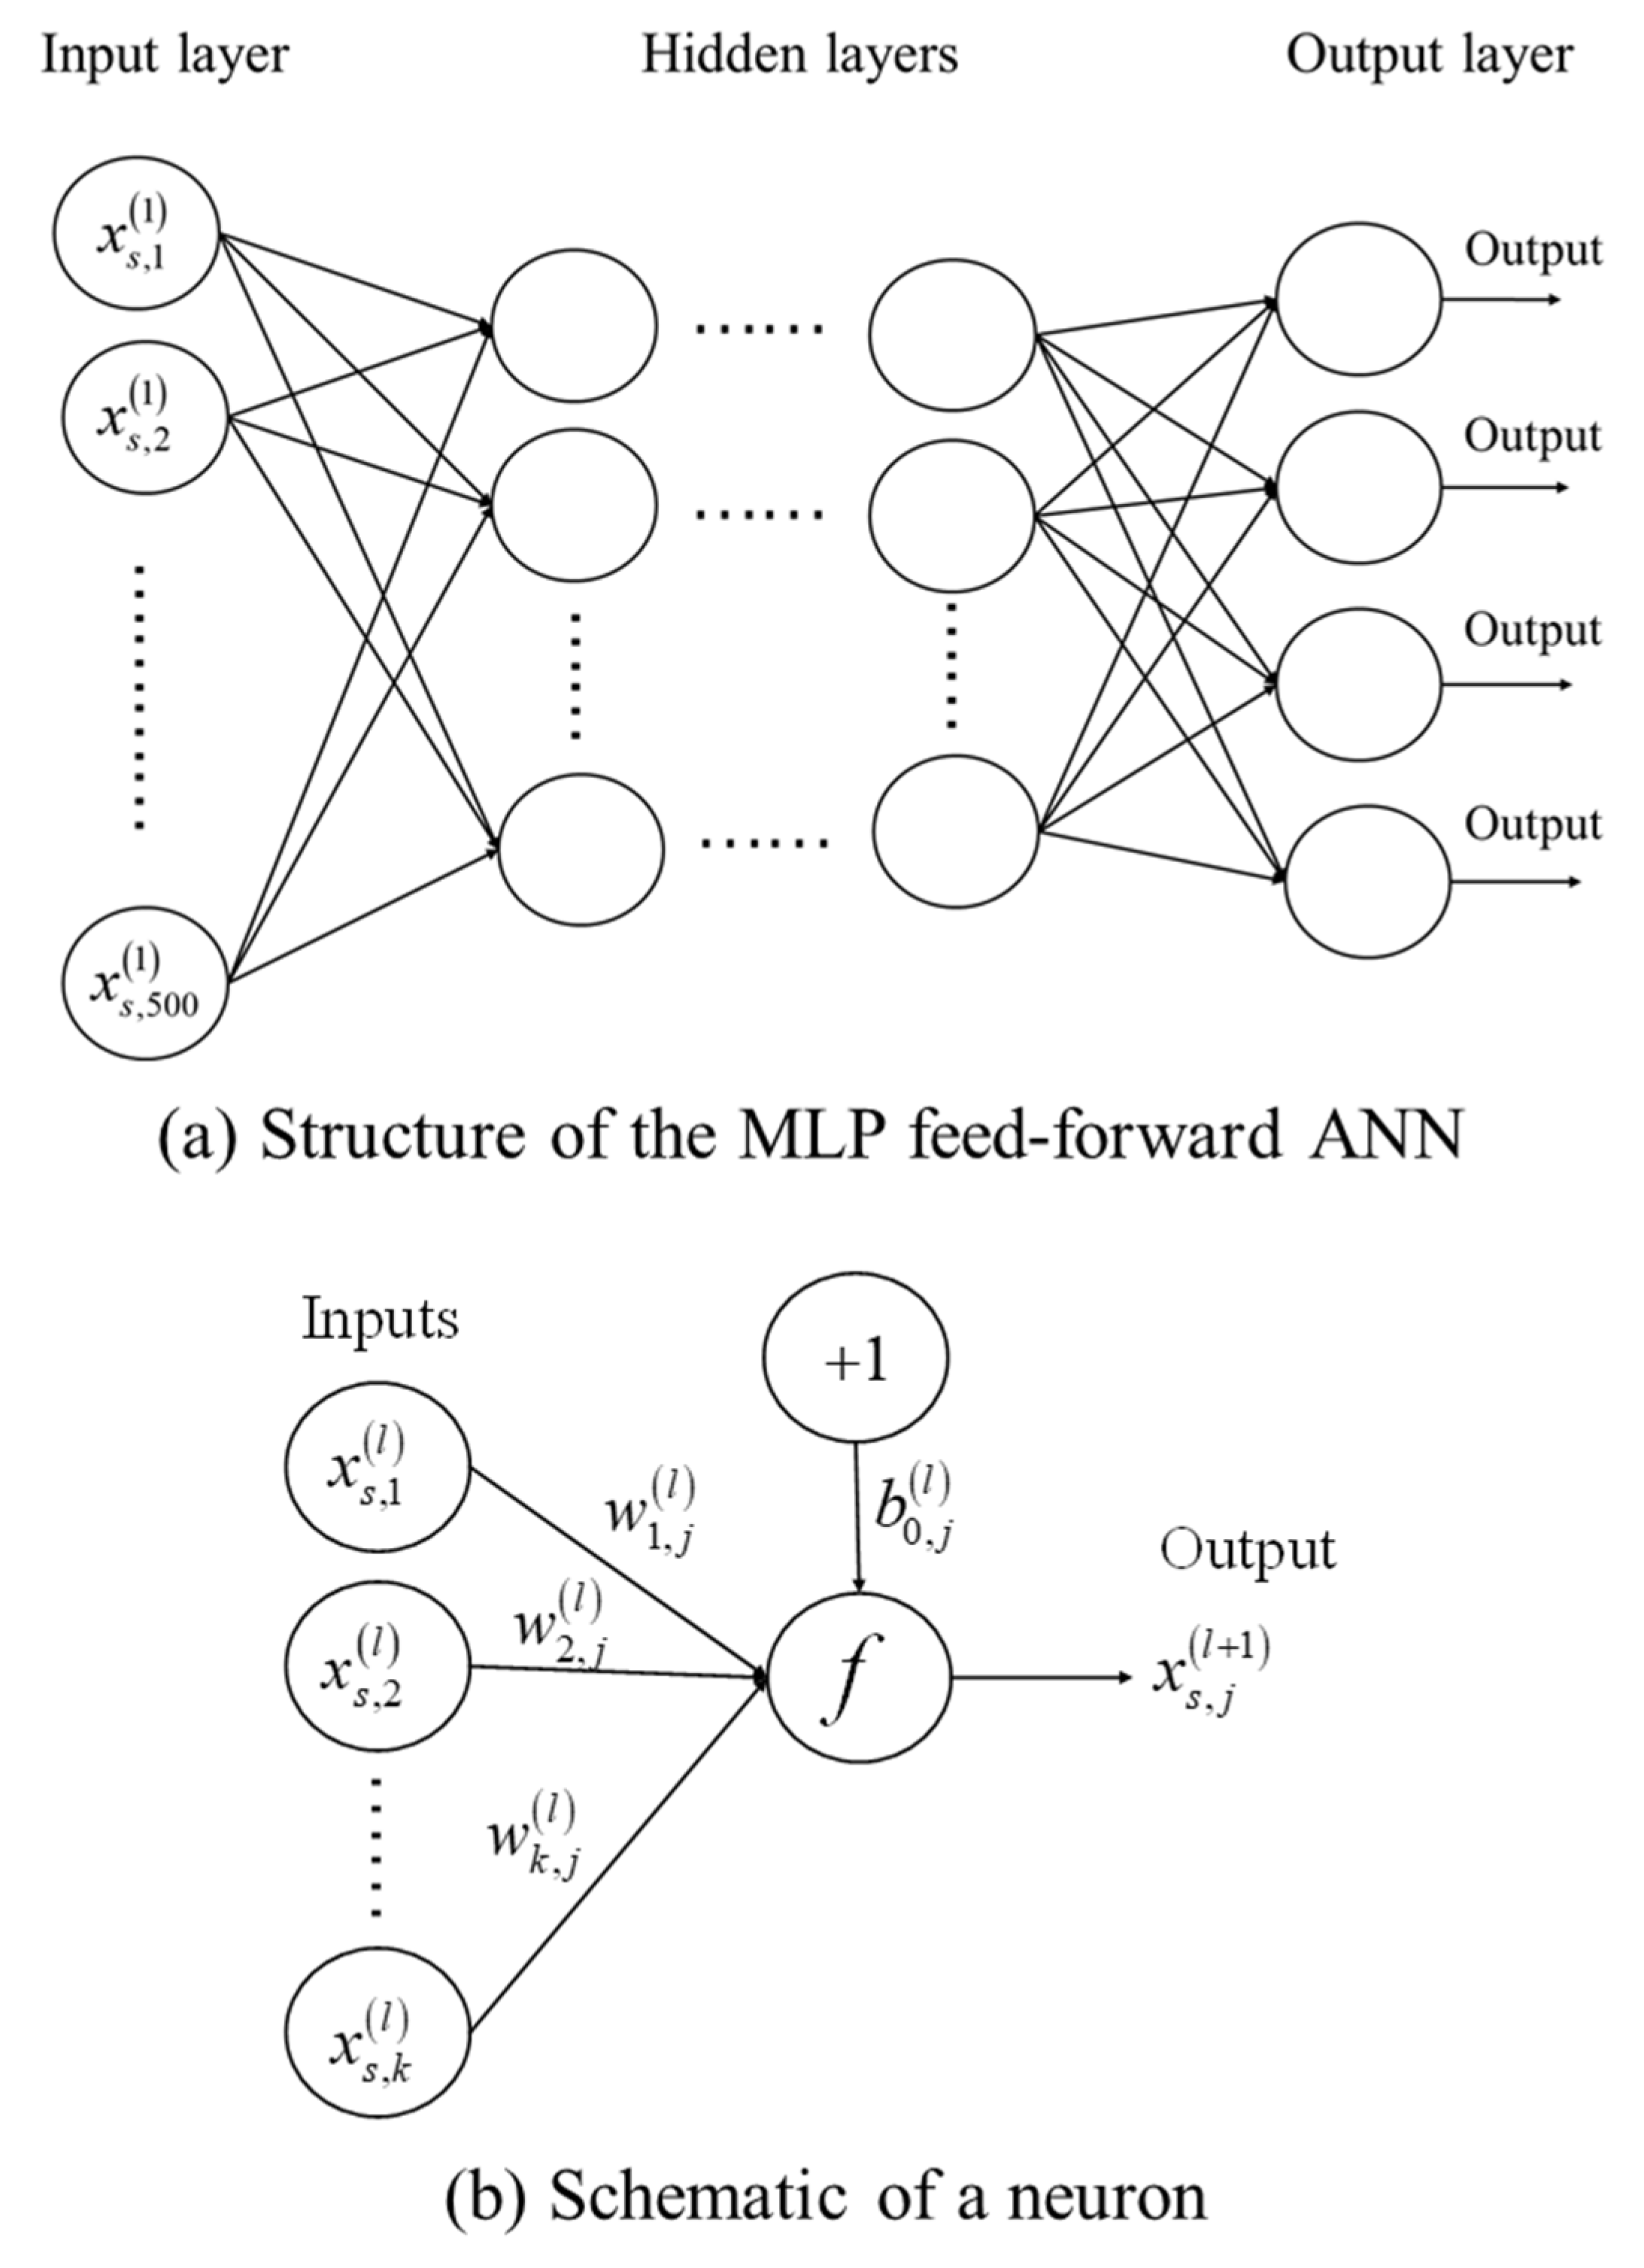
The multi-layer perceptron (MLP) feed-forward neural network was considered. The network structure shown in
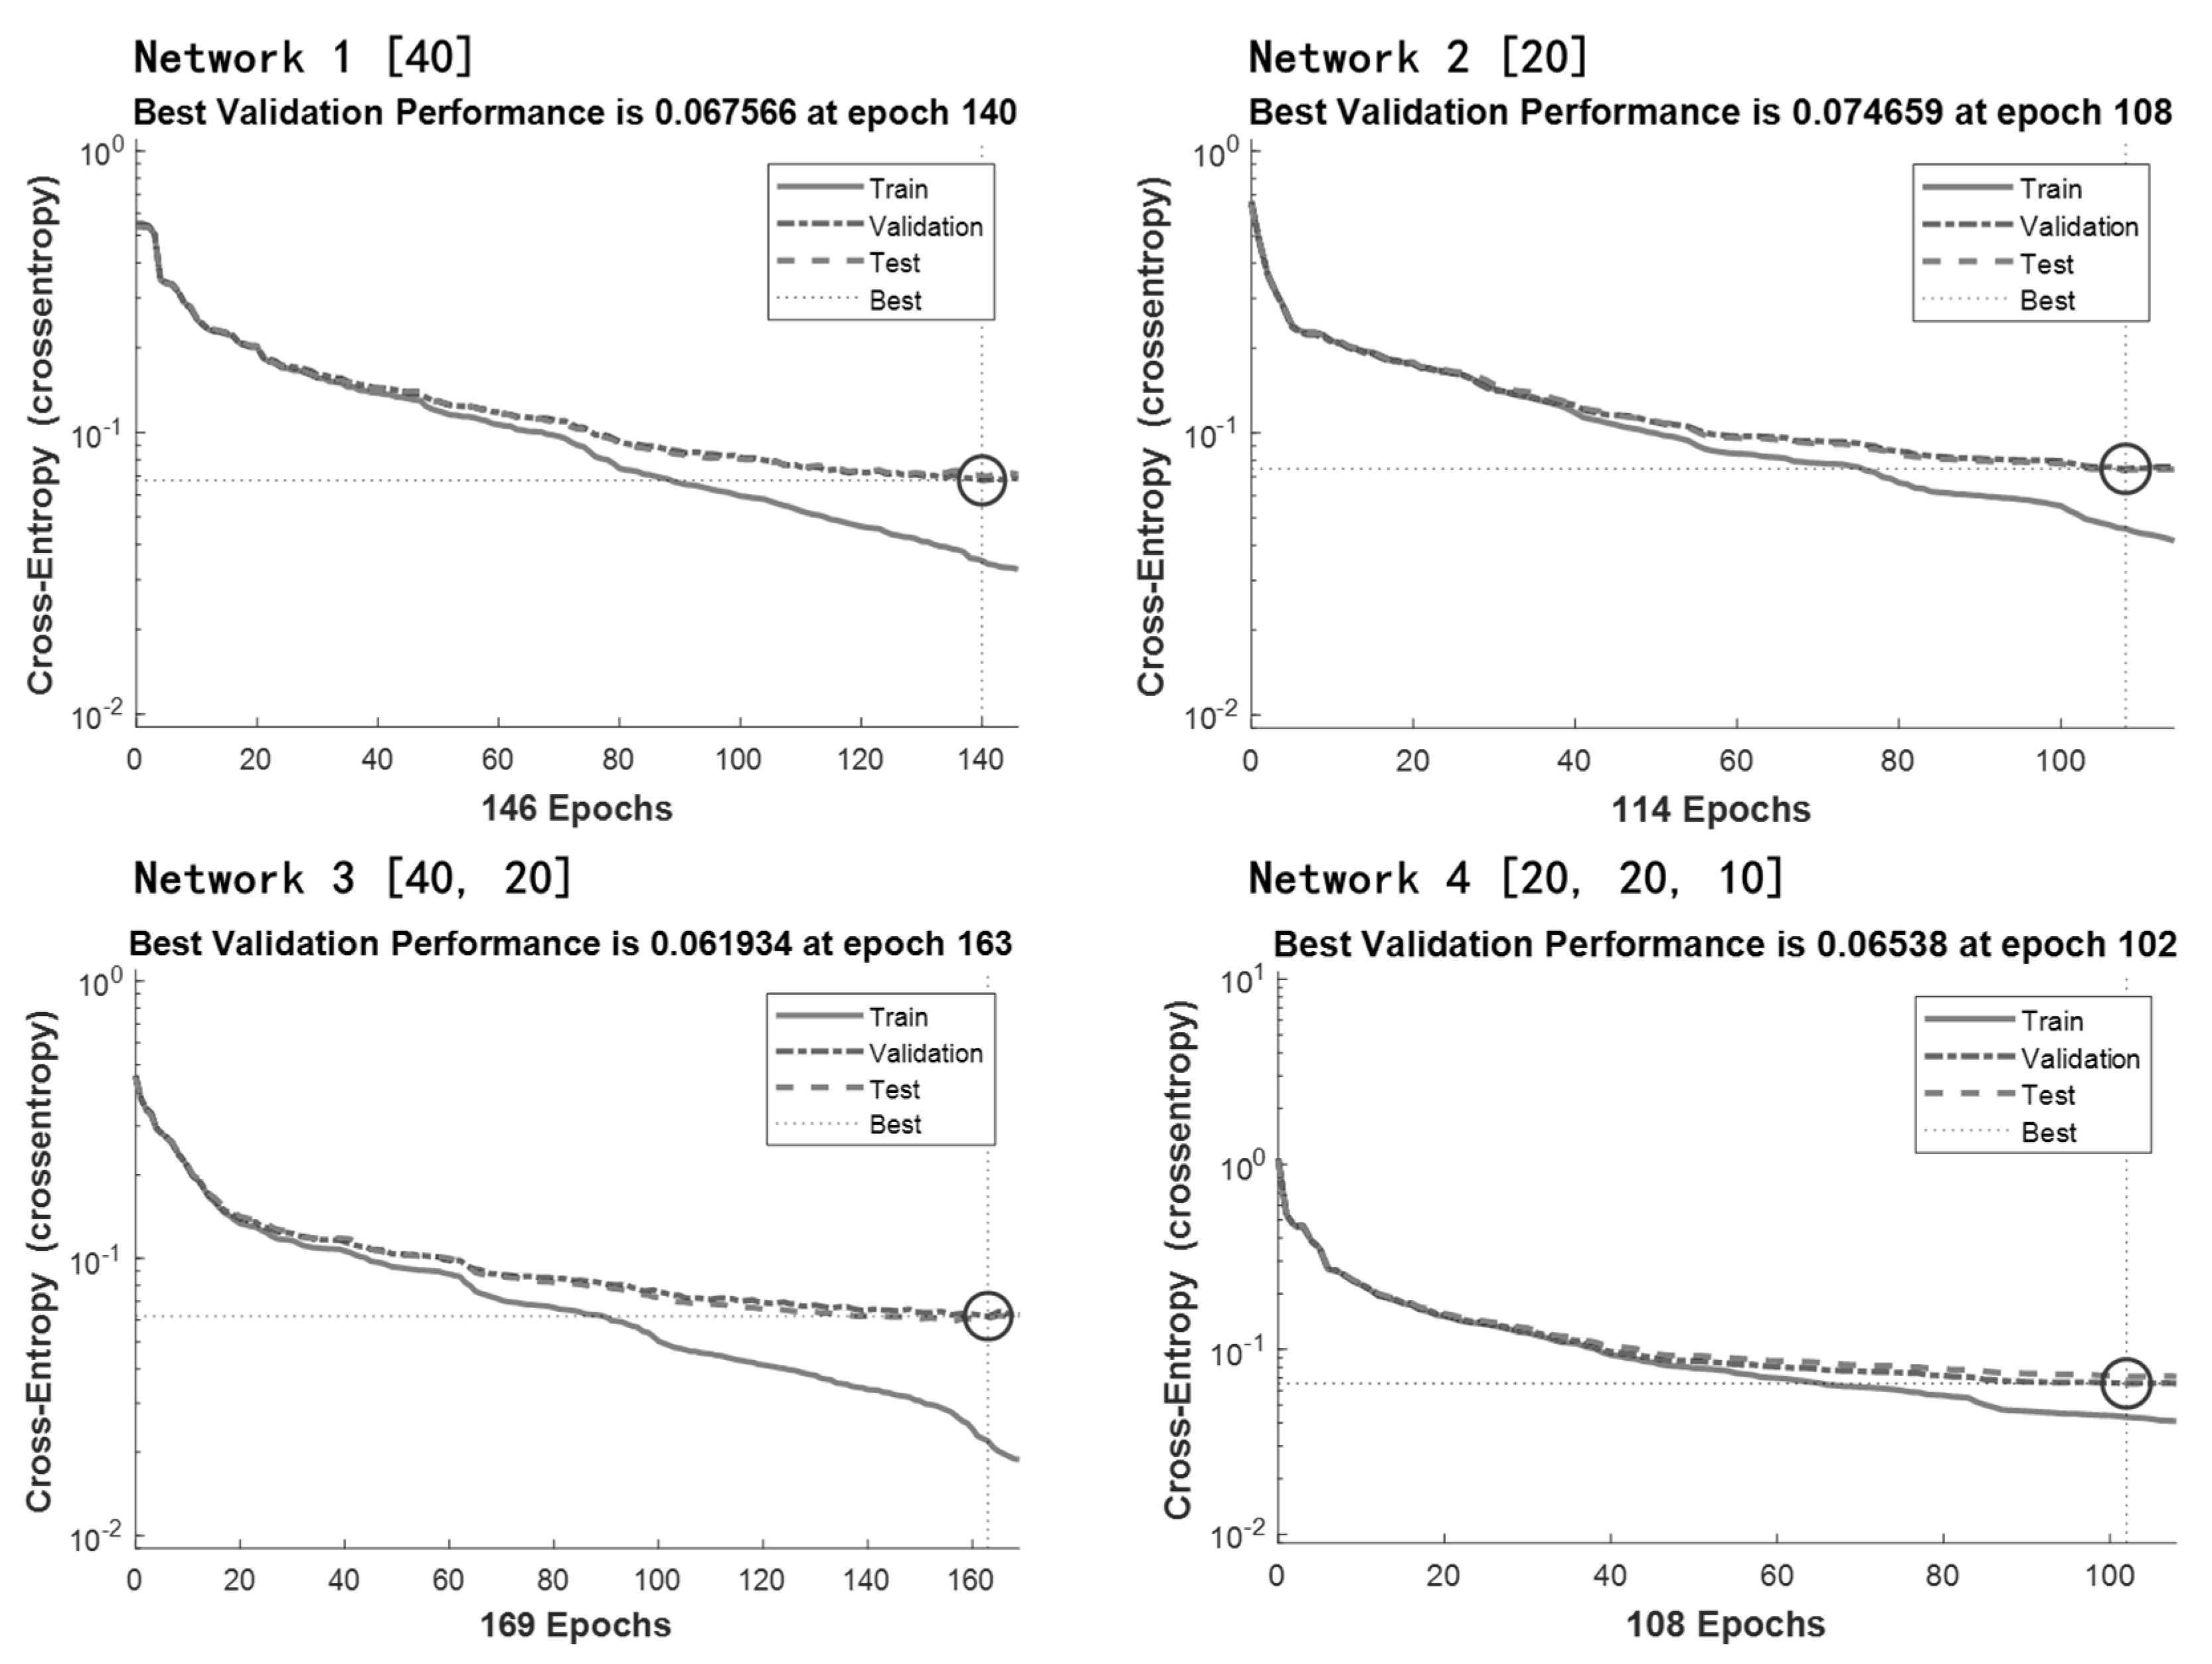
Figure 7 consisted of an input layer, several hidden layers, and an output layer. The input layer included 500 nodes since each sample had 500 features. There were four nodes in the output layer, representing four classes of compaction levels. Four networks with different hidden layer setups are considered in this paper, as is shown in
Table 3. In
Table 3, Network 4 has three hidden layers, and the first, second, and third hidden layers contain 20, 20, and 10 nodes, respectively. For convenience, the hidden layer setup of Network 4 is signified by an array [20, 20, 10], the other three networks follow this rule of expression.
The schematic of a single neuron is shown in
Figure 7b. The governing equation of each node is shown as follows,
In Equation (2), the subscript s denotes the sth sample, the number of nodes is k in the lth layer. denotes the ith input of the lth layer. denotes the jth output of the lth layer, meanwhile, also denotes the jth input of the (l + 1)th layer. denotes the weight from the ith input to the jth output. denotes the weight from the bias term of the lth layer to the jth output. f() denotes the activation function. In this study, all the bias terms were set as 1. A softmax function, , was adopted for the output layer, and a sigmoid function, , was used in the rest of the layers.
4. Training of the ANN Model
A supervised learning method was adopted for the ANN training. The network was trained for vibration pattern recognition. The targets were expressed as the four-dimensional arrays of all 0 values except for a 1 in the
cth element as shown in
Table 2, where
c denoted the compaction level they were to represent.
The network’s performance was measured by the cross-entropy loss function. The loss of the
sth prediction would be
In Equation (3), y denotes the target, denotes the output from the output layer. The subscript c denotes the cth element of y or , and s denotes the sth sample. The entire loss of the dataset used for training is represented by the average of all samples’ loss.
The scaled conjugate gradient (SCG) algorithm was adopted to perform training in this study; the derivatives of the loss with respect to the weights were obtained by backpropagation. SCG is an optimization algorithm based on the conjugate gradient method (CGM), it avoids the line-search per learning iteration by using a Levenberg-Marquardt approach to scale the step size [
23].
The dataset used for training was divided randomly into three subsets: training set, validation set, and test set. The training set was used to calculate the gradient to update the weights. The overfitting phenomenon during the training was monitored by using the data of the validation set. Generally, the errors on the training and validation sets decrease together during the initial phase of training. When the overfitting occurs, the error on the validation set starts to increase. In this study, the training would be terminated when the error on the validation set kept increasing for six iterations, and the weights corresponding to the minimum validation error would be returned. The test set was used to test the network’s performance after training. In this study, the training set, validation set, and test set were set to 70%, 15%, and 15% of the original data, respectively. Moreover, it was considered that the samples should be independent of each other, the samples were therefore arranged in a random order in the matrix of training data.
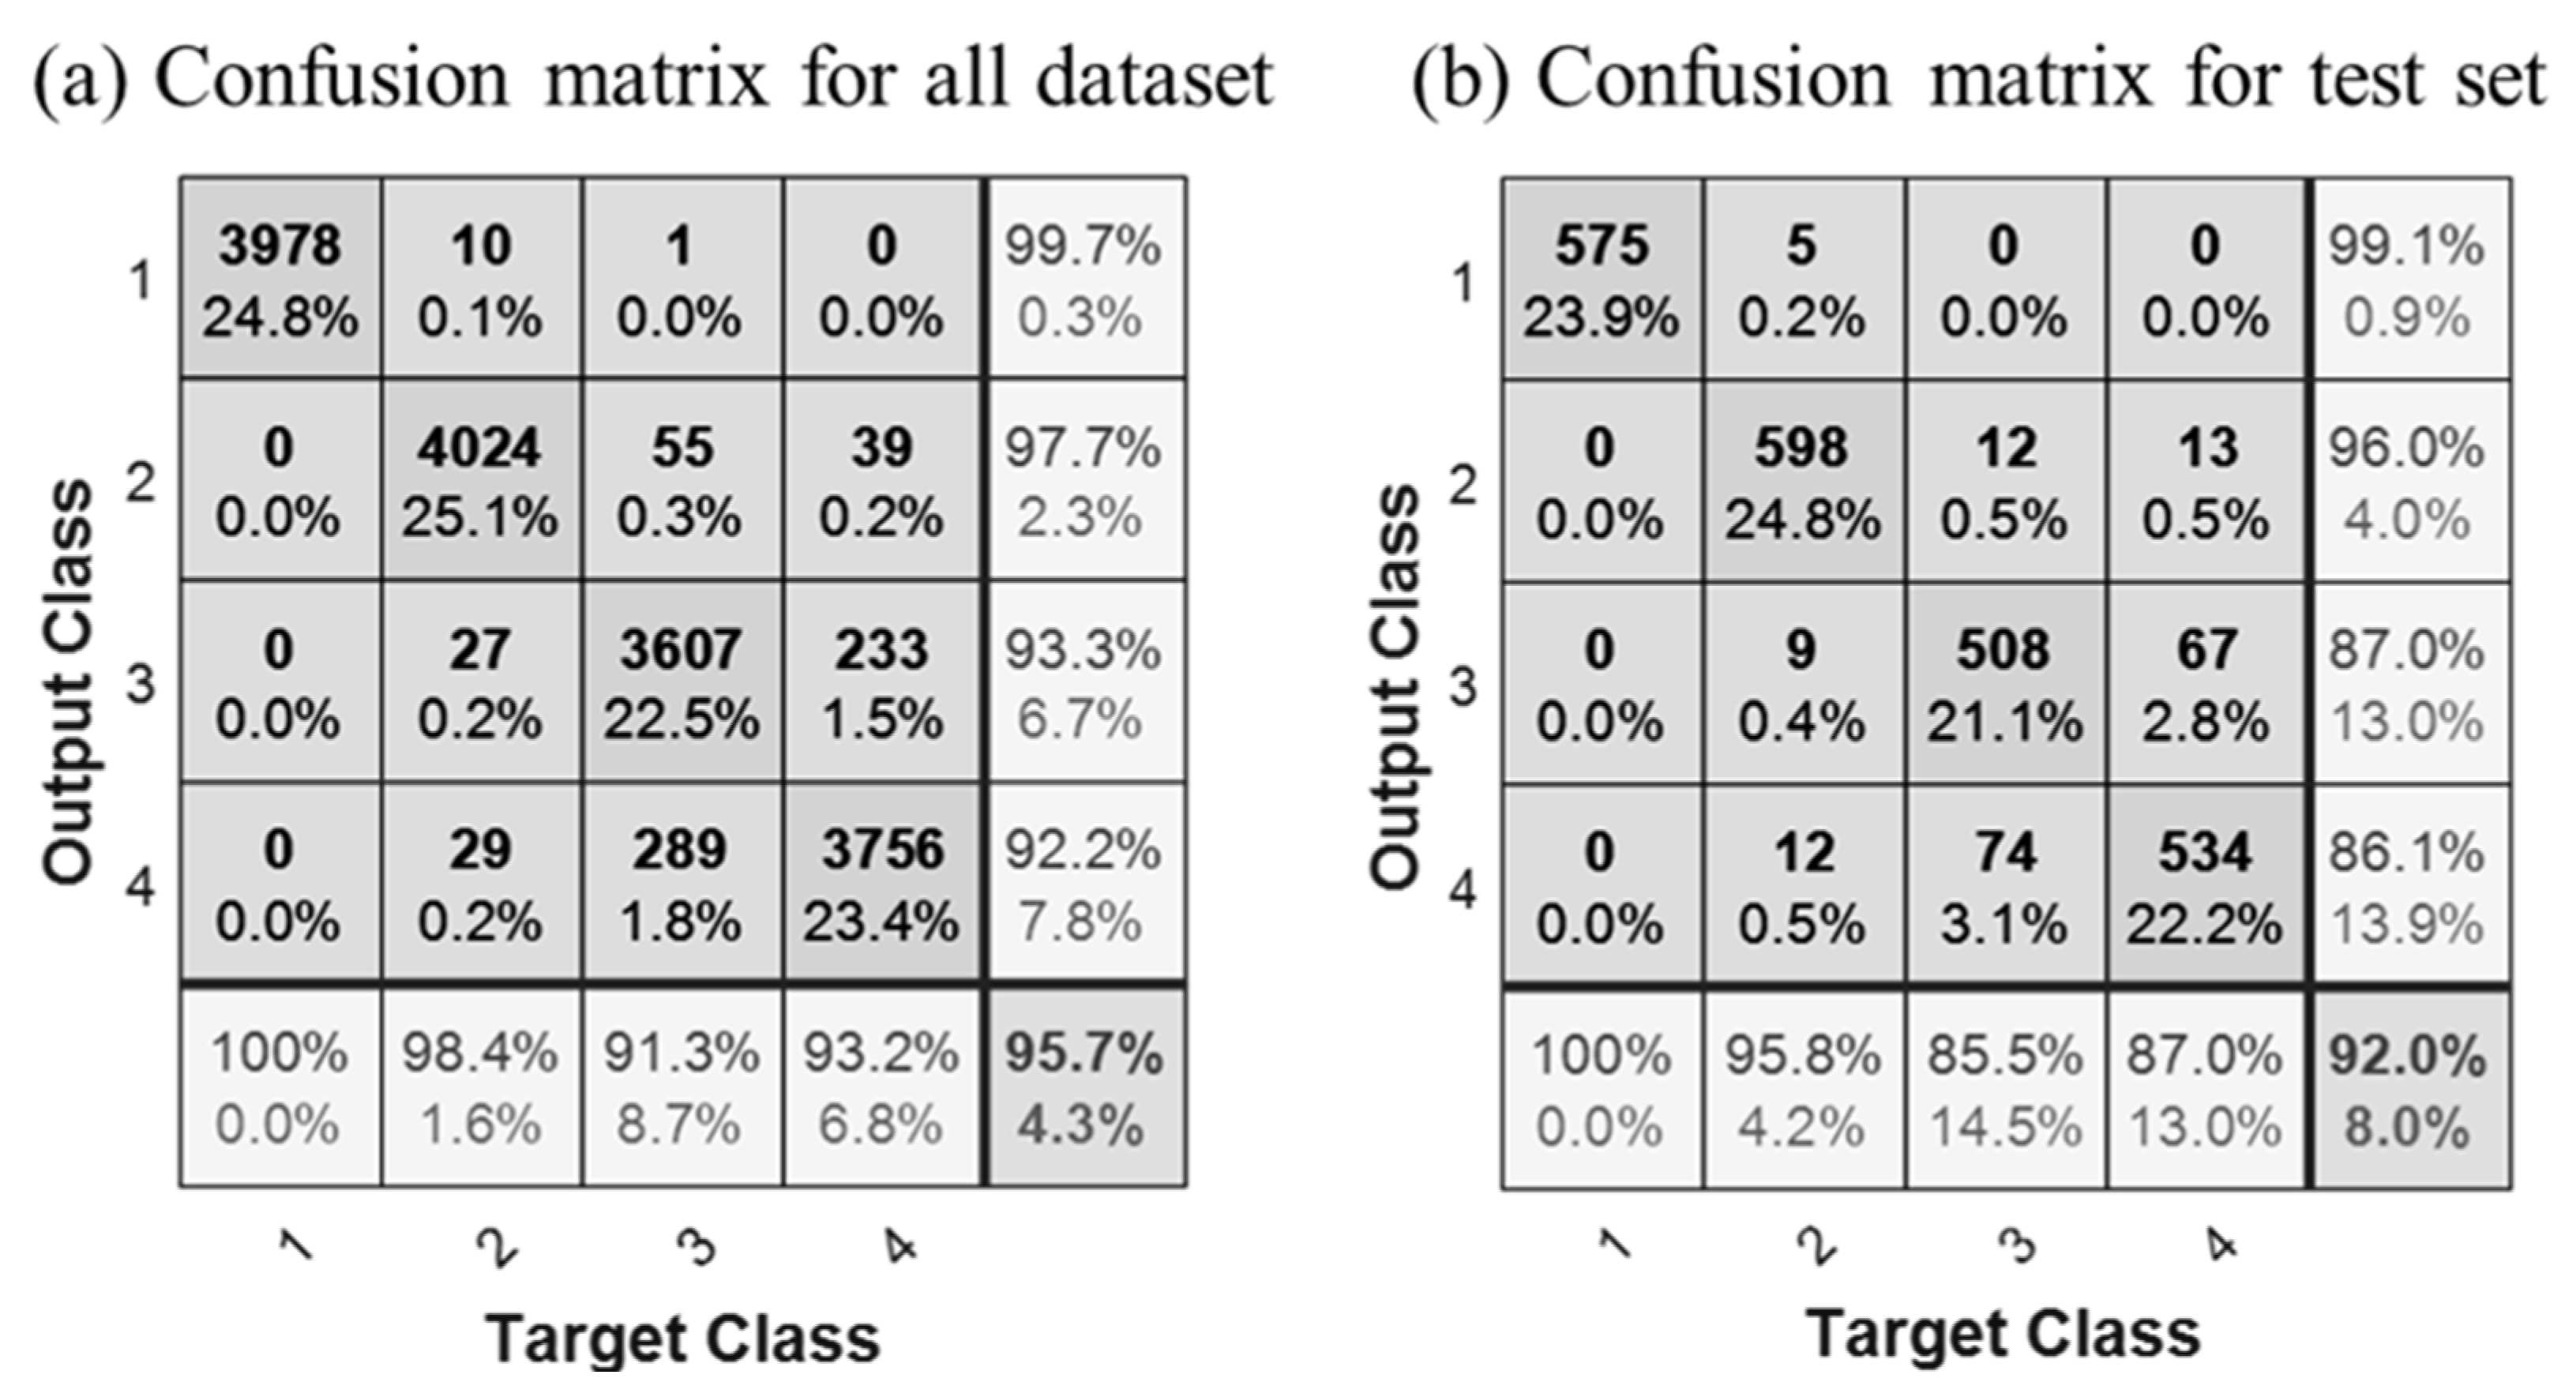
The training performances of the four networks are shown in
Figure 8. Network 3 had the best performance 0.062. The performance of Network 3 is visualized in a confusion matrix in
Figure 9. Each column of the matrix denotes the samples in an actual class while each row denotes the samples in a predicted class. The cells on the diagonal line denote the correctly classified samples. The off-diagonal cells denote the incorrectly classified samples. In each cell, the upper number denotes the number of samples and the lower number denotes the percentage of the total number of samples. The far-right column shows the accuracy of classification in each predicted class. The bottom row shows the accuracy of classification in each actual class. The cell in the bottom right shows the overall accuracy.
5. Validation of ANN Classifier
As shown in
Figure 10, an ANN classifier can be gotten by integrating the signal processing procedure and the ANN model. Once inputting a 0.5-s signal, the ANN classifier will output an estimated compaction level. Network 3 was used as the ANN model in the ANN classifier since Network 3 had the best training performance.
As is mentioned in
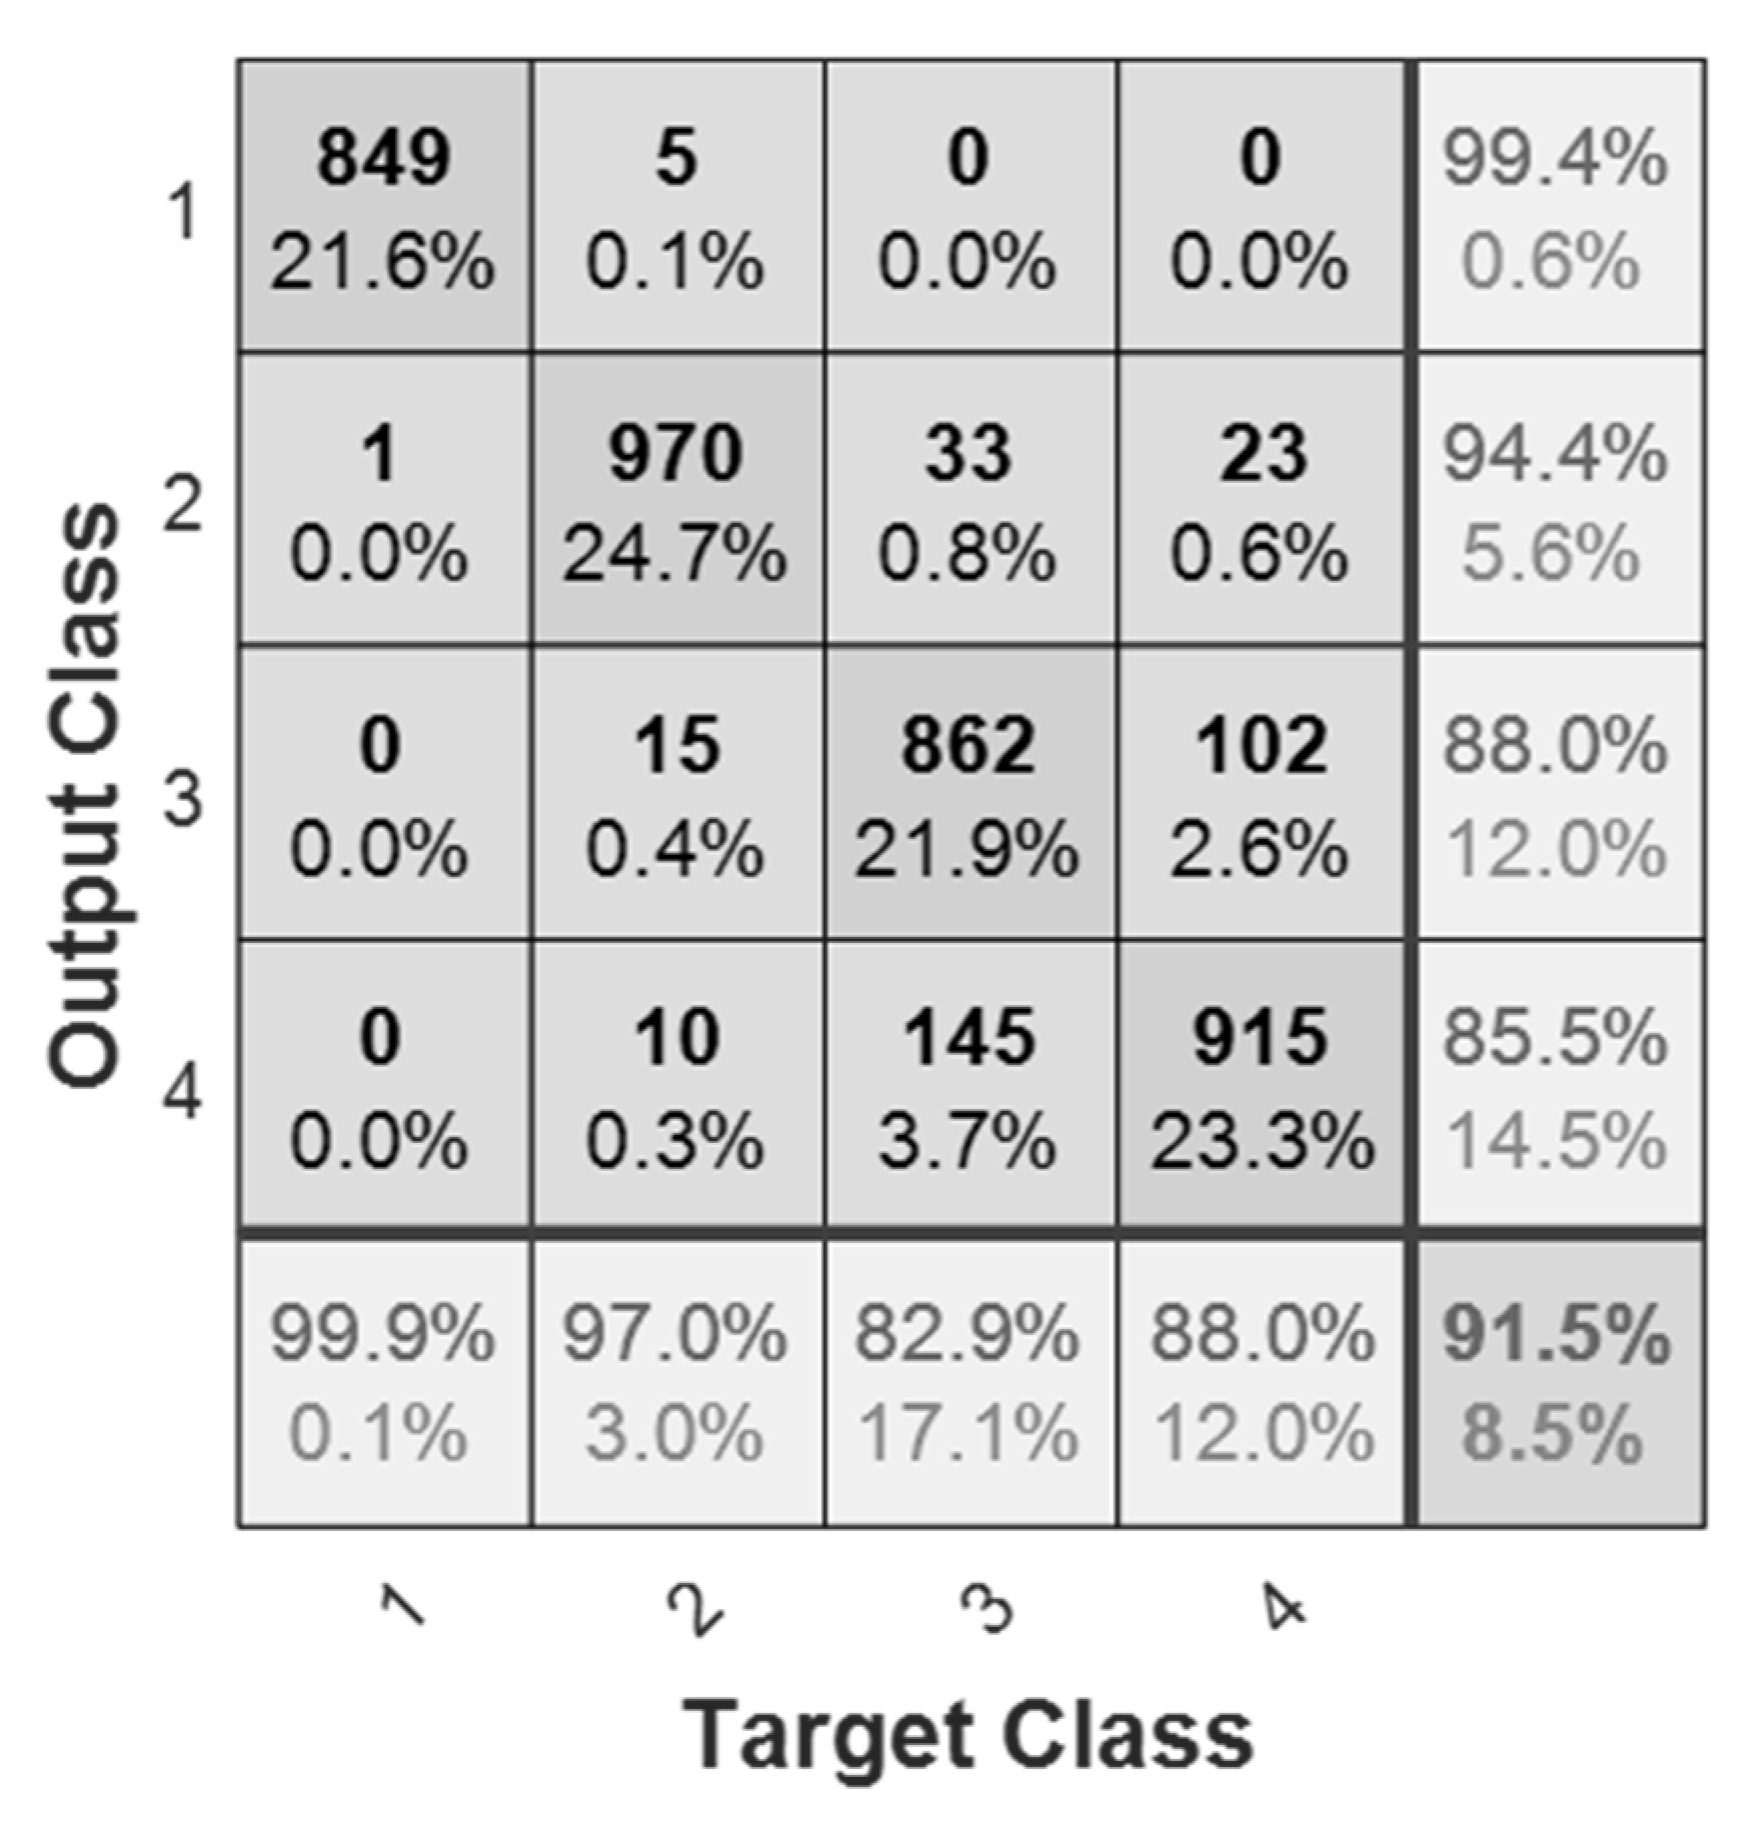
Section 2.1, the data used to train the ANN models were collected during the compaction of two test lanes. The validation test of the ANN classifier was performed on the other 50-m lane in the construction site of the Ning-Liang expressway project. During the compaction of this validation lane, the degree of compaction was measured by NNDG for each roller pass. The number of the collected signals in each compaction level is shown in
Table 4. The output accuracy of the ANN classifier is shown in
Figure 11 in the form of a confusion matrix. The overall accuracy was 91.5%, and the ANN classifier had the worst performance on the recognition for the signals of level 3 with an accuracy of 82.9%.
6. Conclusions and Findings
In this study, an ANN classifier was developed for the real-time quality estimation of HMA compaction. Some conclusions and findings are listed as follows.
(1) To investigate the effect of hidden layer structure on the performance of the ANN model, four ANN models with different hidden layer setups were considered. The double-hidden-layer networks showed the best performance.
(2) The compaction quality was estimated by the ANN classifier based on the vibration signals. The results showed the validity of the ANN classifier for the real-time quality estimation of HMA compaction.
(3) A classifier was developed in this study, but not an estimator. This is due to the limitation of the accuracy of the non-nuclear density gauge. The range of degree of compaction was considered in this study, this was a kind of compromise. To develop the ANN estimator, an accurate measurement of the degree of compaction is necessary.
(4) It should be noted that although this study focused on the compaction of AC-25 asphalt mixture, it is not clear whether the ANN classifier developed in this study can be used for other asphalt mixes, such as AC-20 and SMA-13. Different materials may lead to different vibration patterns, thus ANNs may need to be re-designed and re-trained for different specified materials. Furthermore, different materials and different training dataset sizes may lead to different optimal network designs; the network in this study (Network 3) may not be suitable if the material is not AC-25, or if the amount of training data is very large.
In addition, the amount of training data is limited in this study. Collecting more training data may improve the performance of the ANN model. However, ANN still shows a huge potential for the problem of compaction quality control.
Author Contributions
Conceptualization, W.C. and F.R.; methodology, F.R.; formal analysis, W.C. and S.L.; investigation, W.C., F.R. and Q.W.; resources, Z.X. and S.L.; data curation, S.L. and Q.W.; visualization, F.R.; validation, W.C. and Z.X.; writing—original draft preparation, F.R., W.C. and Q.W.; writing—review and editing, W.C., S.L. and F.R.; project administration, Z.X.; supervision, W.C.; funding acquisition, Z.X. All authors have read and agreed to the published version of the manuscript.
Funding
This work was supported by the Science and Technology Plan of Shandong Transportation Department (No. 2019B48), and the authors would like to acknowledge their financial support.
Institutional Review Board Statement
Not applicable.
Informed Consent Statement
Not applicable.
Data Availability Statement
The data presented in this study are available on request from the corresponding author. The data are not publicly available due to them forming part of an ongoing study.
Conflicts of Interest
The authors declare no conflict of interest.
References
- Wróbel, M.; Woszuk, A.; Franus, W. Laboratory methods for assessing the influence of improper asphalt mix compaction on its performance. Materials 2020, 13, 2476. [Google Scholar] [CrossRef] [PubMed]
- Arambula, E.; Masad, E.; Martin, A.E. Influence of air void distribution on the moisture susceptibility of asphalt mixes. J. Mater. Civ. Eng. 2007, 19, 655–664. [Google Scholar] [CrossRef]
- AASHTO; FAA; FHWA; NAPA; USACE; APWA; NCAE. Hot Mix Asphalt Paving Handbook; FAA: Washington, DC, USA, 2000.
- Beainy, F.; Commuri, S.; Zaman, M. Asphalt compaction quality control using artificial neural network. In Proceedings of the 49th IEEE Conference on Decision and Control, Atlanta, GA, USA, 15–17 December 2010. [Google Scholar]
- Beainy, F. Non-Contact Sensor for the Real-Time Measurement of Quality of Asphalt Pavements during Compaction. Ph.D. Thesis, University of Oklahoma, Norman, OK, USA, 2011. [Google Scholar]
- Jeongho, O. A review on intelligent compaction techniques in railroad construction. Int. J. Railw. 2014, 7, 80–84. [Google Scholar]
- Liu, D.; Wang, Y.; Chen, J.; Zhang, Y. Intelligent compaction practice and development: A bibliometric analysis. Eng. Constr. Arch. Manag. 2019, 27, 1213–1232. [Google Scholar] [CrossRef]
- Mooney, M.; Adam, D. Vibratory roller integrated measurement of earthwork compaction: An overview. In Proceedings of the 7th International Symposium on Field Measurements in Geomechanics, Boston, MA, USA, 24–27 September 2007. [Google Scholar] [CrossRef]
- Zhang, J.; Xu, G.; Cai, Y. An investigation on quality inspection and control for continuously compacting subgrade. Rock Soil Mech. 2015, 36, 1141–1146. [Google Scholar]
- Xu, G.; Gao, H.; Wang, Z. Continuous dynamic monitor technology on subgrade compaction quality. China J. Highw. Transp. 2007, 20, 17–22. [Google Scholar]
- Meehan, C.L.; Cacciola, D.V.; Tehrani, F.S.; Baker, W.J., III. Assessing soil compaction using continuous compaction control and location-specific in situ tests. Autom. Constr. 2017, 73, 31–44. [Google Scholar] [CrossRef]
- Liu, D.; Gao, L. Analysis and improvement of roller vibration behavior-based indexes for monitoring compaction quality of earth-rock dams. J. Hydroelectr. Eng. 2018, 37, 111–128. [Google Scholar]
- Liu, D.; Li, Z.; Lian, Z. Compaction quality assessment of earth-rock dam materials using roller-integrated compaction monitoring technology. Autom. Constr. 2014, 44, 234–246. [Google Scholar] [CrossRef]
- Nie, Z.; Jiao, T.; Wang, X. Study on continuous compaction indicator of railway subgrade based on harmonic balance identification method. China Railw. Sci. 2016, 37, 1–8. [Google Scholar]
- Nie, Z.; Wang, X.; Jiao, T. Anomalous data detection for roller-integrated compaction measurement. Int. J. Geomech. 2016, 16, 1–6. [Google Scholar] [CrossRef]
- Commuri, S.; Mai, A.T.; Zaman, M. Neural network–based intelligent compaction analyzer for estimating compaction quality of hot asphalt mixes. J. Constr. Eng. Manag. 2011, 137, 634–644. [Google Scholar] [CrossRef] [Green Version]
- Xu, Q.; Chang, G.K. Evaluation of intelligent compaction for asphalt materials. Autom. Constr. 2013, 30, 104–112. [Google Scholar] [CrossRef]
- Hu, W.; Jia, X.; Zhu, X.; Gong, H.; Xue, G.; Huang, B. Investigating key factors of intelligent compaction for asphalt paving: A comparative case study. Constr. Build. Mater. 2019, 229. [Google Scholar] [CrossRef]
- Hu, W.; Huang, B.; Shu, X.; Woods, M. Utilising intelligent compaction meter values to evaluate construction quality of asphalt pavement layers. Road Mater. Pavement Des. 2017, 18, 980–991. [Google Scholar] [CrossRef]
- Commuri, S.; Zaman, M. A novel neural network-based asphalt compaction analyzer. Int. J. Pavement Eng. 2008, 9, 177–188. [Google Scholar] [CrossRef] [Green Version]
- Imran, S.A.; Barman, M.; Commuri, S.; Zaman, M.; Nazari, M. Artificial neural network–based intelligent compaction analyzer for real-time estimation of subgrade quality. Int. J. Geomech. 2008, 18. [Google Scholar] [CrossRef]
- Barman, M.; Imran, S.A.; Nazari, M.; Commuri, S.; Zaman, M. Use of intelligent compaction in detecting and remediating under-compacted spots during compaction of asphalt layers. In Solving Pavement and Construction Materials Problems with Innovative and Cutting-Edge Technologies. GeoChina 2018; Sustainable Civil Infrastructures; Springer: Cham, Germany, 2019. [Google Scholar] [CrossRef]
- Møller, M.F. A scaled conjugate gradient algorithm for fast supervised learning. Neural Netw. 1993, 6, 525–533. [Google Scholar] [CrossRef]
| Publisher’s Note: MDPI stays neutral with regard to jurisdictional claims in published maps and institutional affiliations. |
© 2021 by the authors. Licensee MDPI, Basel, Switzerland. This article is an open access article distributed under the terms and conditions of the Creative Commons Attribution (CC BY) license (https://creativecommons.org/licenses/by/4.0/).


