1. Introduction
Oceans account for 70% of the earth’s surface area with abundant biological resources and mineral resources, so the exploration of the ocean is very important. The underwater thermal profiler, which can be used to detect the ocean, is a kind of autonomous vehicle that moves up and down between the sea surface and deep sea. It can harvest OTE through the utilization of phase change materials (PCMs) and convert OTE into mechanical energy for a buoyancy-driven system.
When phase change material melts, it expands in volume and does work; therefore, the study of phase change rate is essential. A mathematical model aimed at analyzing the characteristics of the volumetric change rate as well as the freezing and melting times of the mixed PCMs is proposed, and calculation methods of phase change time are given [
1]. Similarly, an analytical solution is developed to study volumetric heat generation effects during the melting and solidification of nano-enhanced PCMs that are encapsulated in a horizontal cylindrical container [
2]. Zhao et al. proposed an improved Nusselt boundary layer model to describe the contact melting process of PCM in a rectangular cavity. The melting process is recorded by a camera, and results showed that melting is fastest when the container is tilted at 60 degrees [
3]. Research proves that adding materials with high thermal conductivity and specific surface area could increase the rate of thermal charging and discharging. Anne et al. studied two enhancement materials, namely, aluminum and graphite foams, saturated with PCM, and results showed that the thermal charging enhancement of graphite foams is superior to that of aluminum foams [
4]. Murugan et al. prepared NPCM using paraffin as the PCM and high conductive MWCNT as the nanomaterial. Lessening in melting and solidification time of 30% and 43% was attained in the case of NPCM with 0.3% and 0.9% in experiments, respectively [
5].
Based on the principle of work done by melting of PCM, some underwater observation platforms have been developed. The first to use this principle is the American Webb Research Corporation (WRC), which first developed the thermally driven glider Slocum. The first-generation Slocum thermal glider platform is equipped with three temperature difference energy capture heat engines, using PCM as the energy capture working medium. The experiment was carried out in the Seneca lake area of the United States in 1998. The temperature difference between the lake surface and the bottom of the lake was 13 °C, the maximum diving depth was 125 m, and the heat exchange efficiency was about 3%. This test verified that the underwater mobile observation platform can capture the temperature difference energy, and the feasibility of doing work [
6]. After that, WRC successively produced the second- and third-generation thermal glider platforms, which only use the captured temperature difference energy to drive the buoyancy of the underwater mobile observation platform. In 2013, WRC developed the fourth-generation Slocum thermal glider, which not only uses ocean thermal energy for buoyancy driving, but also converts it into electrical energy. Therefore, its observation range and frequency are higher than those of the previous three generations, and more frequent profile observations can be carried out [
7]. The Scripps Institute of Oceanography in the United States developed an underwater mobile observation platform entitled SOLO-TREC, which is equipped with 10 thermal energy capture heat engines. The captured ocean thermal energy is stored in the accumulator in the form of high-voltage potential energy. In addition to being used for buoyancy drive, it can also be converted into electrical energy by a hydraulic motor [
8,
9]. The American Seatreac company designed a set of temperature difference energy capture and power generation system, SL1, to supplement the energy required for the buoyancy adjustment of the Navis series profiler. The Navis-SL1 system is equipped with two sets of SL1 energy capture and power generation systems. It was tested in Hawaiian waters in 2019 and completed 42 sections from 50 m to 750 m depth [
10]. Wang et al. proposed a thermal power generation system that can transform OTE into electrical energy to improve sailing mileage, and this system can be used in ocean observation platforms such as underwater glider, profiler and buoy [
11]. Yuan et al. investigated an ammonia–water-based ocean thermal energy conversion system using experimental methods, and the values of thermal efficiency under different heating sources and cooling sources were given [
12]. Falcão et al. designed a thermal-driven volumetric pump for energy harvesting and used it in an underwater glider [
13]. Kong researched the phase change process of the thermal glider propelled by ocean thermal energy and analyzed the gliding process when the PCMs were partly melted [
14]. Ma established a nonlinear model for the relationship between system pressure and phase change rate and analyzed influencing factors for system pressure and stored energy based on the established nonlinear model [
15].
Existing research on buoyancy adjustment systems is mainly for underwater vehicles driven by electric energy. B.K. Tiwari et al. proposed a computer simulation model (CSM) for the preliminary design of an AUV/AUGs variable buoyancy system (VBS) to achieve effective control of buoyancy [
16,
17]. Hexiong Zhou et al. proposed an accumulator-based hybrid buoyancy adjustment system for deep-sea gliders, which can effectively use ocean pressure difference energy to achieve buoyancy compensation. Using the Newton–Euler formula and Boyle’s law, a mathematical model of DG with ballasted underwater vehicles was established, revealing the relationship between DG’s buoyancy and water depth [
18]. Qinggang Sun et al. designed a variable buoyancy system for the AUV to ensure that the AUV can obtain a good posture. Through AMESim’s simulation of no-load and load operation of the hydraulic system and the comparison of tests in the lake, it provides a reliable reference for system optimization [
19]. However, there are few studies on the driving performance of the thermal profiler’s buoyancy adjustment system in the existing research.
The previous research studies are mainly focused on heat transfer analysis of the phase process of the thermal engine. However, the static and dynamic characteristics of the thermal engine, which is closely related to the performance of the profiler, have not been studied deeply so far. In this paper, a profiler with the new buoyancy adjustment system, which was driven by OTE, was designed, the characteristics of buoyancy regulation system were calculated using power bonding diagram theory and a lake test was carried out. The results show that the new buoyancy adjustment system with the thermal engine can certainly reduce the consumption of electricity and improve the service life of the underwater platform.
2. Design of the Self-Driven Buoyancy Regulation System
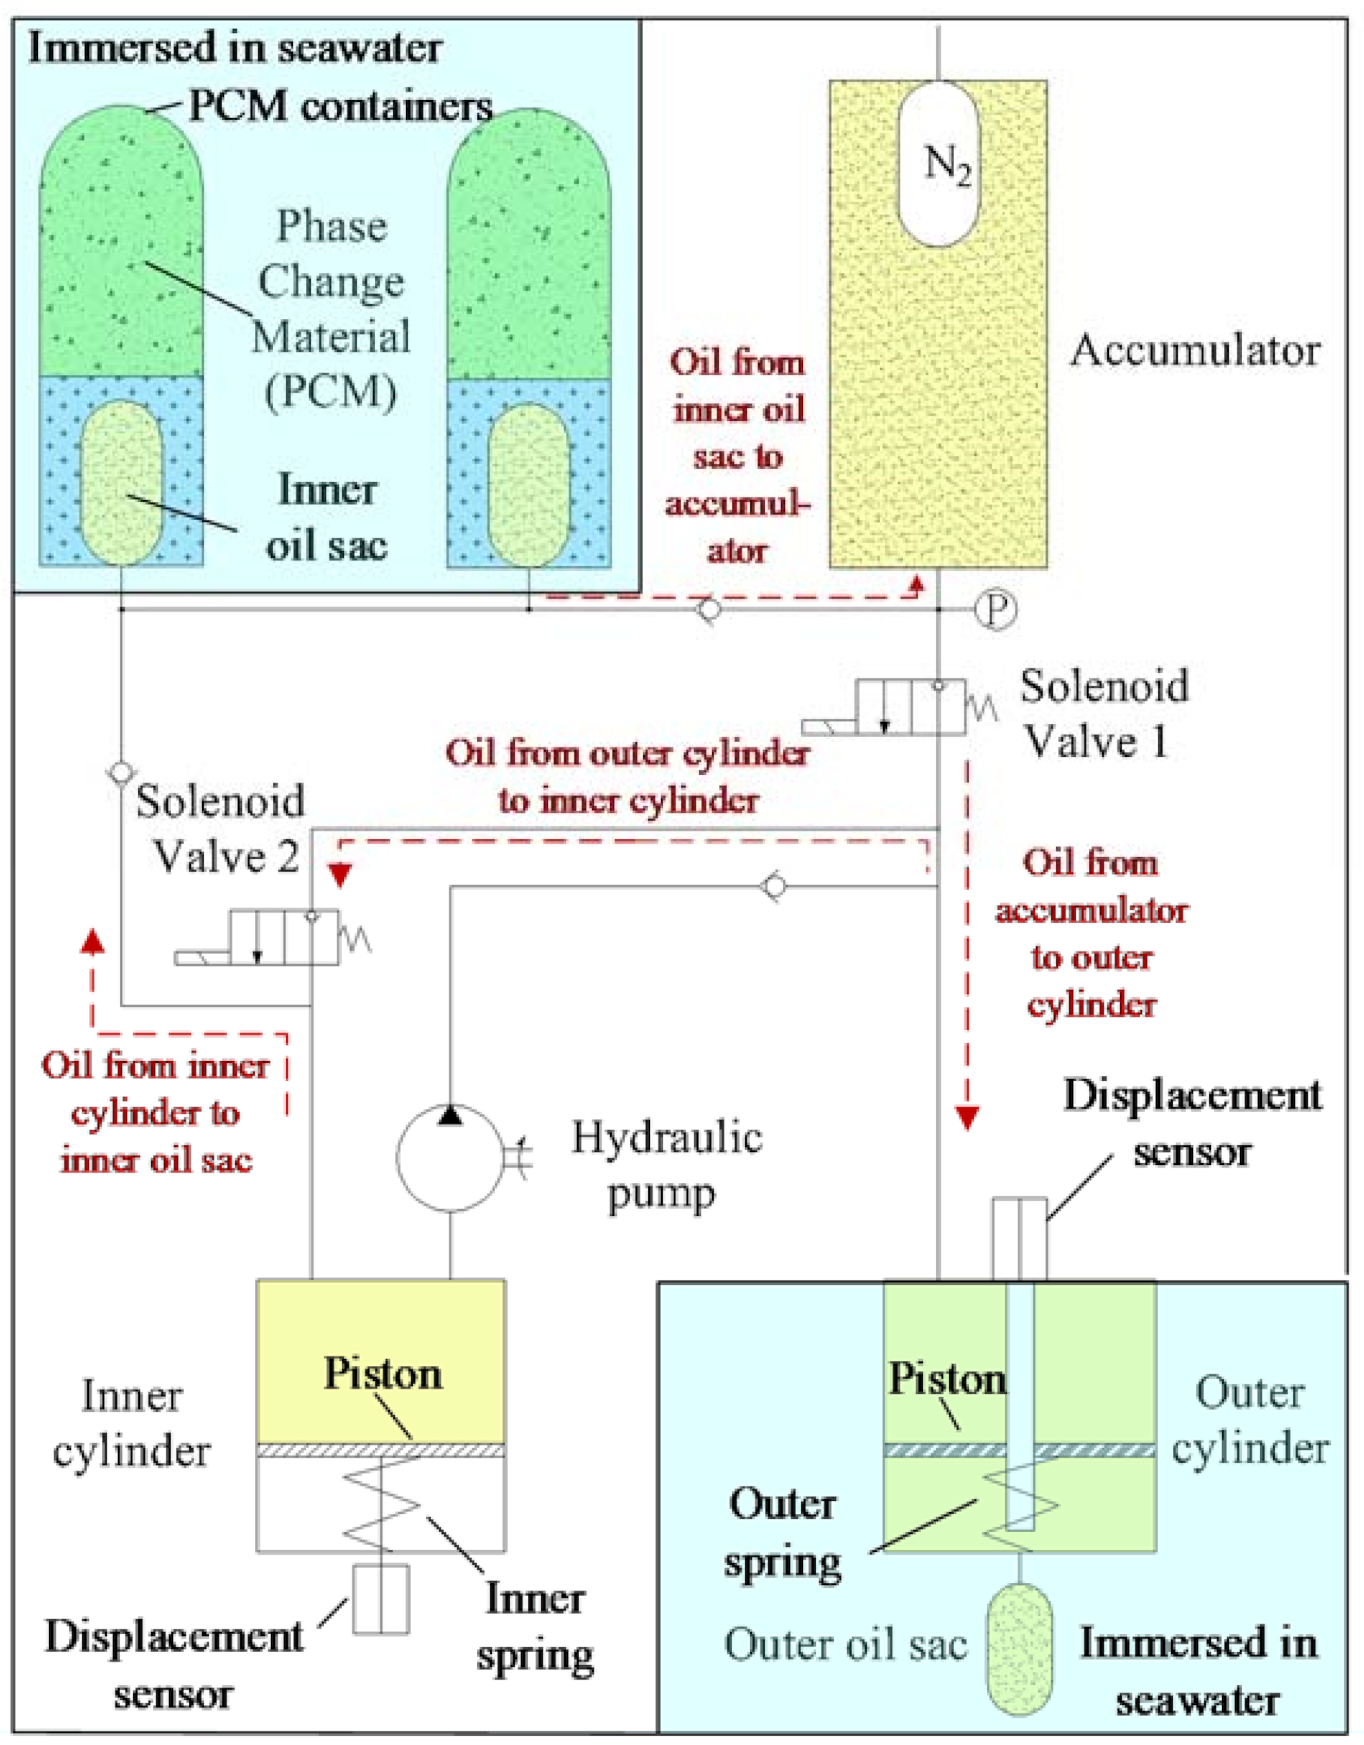
A new type of fluid control system that relies on OTE for buoyancy control has been developed. Compared with the conventional buoyancy regulation system that is used in profilers or Argo buoys, the new system has great energy-saving advantages, because it uses OTE for buoyancy driving. The principle of the buoyancy regulation system is shown in
Figure 1.
The system is mainly composed of PCMs (e.g., n-hexadecane, whose phase change temperature is 18 °C), PCM containers, accumulators, pressure sensors, solenoid valves, hydraulic pumps, internal cylinders, displacement sensors for internal cylinder piston, external cylinder, displacement sensor for external cylinder piston. The PCM containers are fully exposed to the surrounding water. When PCM melts, the heat transfers from seawater to the container wall, and then from the container wall to the PCM. The heat transfer path is the opposite when solidified. When the temperature of seawater is higher than the phase change temperature of the PCM, the PCM melts and expands, and the oil enters the accumulator to compress the nitrogen bladder and causes the pressure to rise. The solenoid valve 2 opens when the accumulator pressure rises to the set pressure, and the external cylinder discharges the fluid into the internal cylinder under the action of the outer spring, so the volume of the outer oil sac decreases and the profiler starts to sink. When the profiler sinks to the low-temperature zone, the PCMs solidifies and shrinks, and the fluid flows to the PCM containers from the internal cylinder. When the piston of the internal cylinder reaches a certain position, solenoid valve 1 opens and high-pressure oil in the accumulator flows into the external cylinder, and the profiler starts to float. The displacement sensors make the oil discharge and the absorption process can be precisely controlled. In this system, the fluid from the internal cylinder to the inner oil sac is driven by the internal cylinder spring and the oil from the external cylinder to the internal cylinder is driven by the external cylinder spring. The elastic potential energy of these two springs comes from OTE, because the accumulator compresses the outer spring first and then the inner spring. Driven by OTE, this equipment can greatly reduce electrical power consumption. The hydraulic pump can also transfer hydraulic oil from the inner cylinder to the outer cylinder, but it does not work when the profiler is working normally. The hydraulic pump has two functions: (1) Emergency floating: When the profiler fails, the hydraulic pump pumps hydraulic oil from the inner cylinder into the outer cylinder; (2) Depth control: When the profiler needs to be suspended at a fixed depth, the hydraulic pump fine-tunes the oil volume of the outer cylinder to make the profiler achieve neutral buoyancy to achieve fixed-depth suspension.
3. Dynamic Performance of the Buoyancy Regulation System
The commonly used analysis methods of dynamic characteristics of the hydraulic systems mainly include transfer function and simulation method. With the development of computer technology, digital simulation has become a common method to study the dynamic characteristics of the hydraulic system. The power bonding diagram is a very effective simulation modeling tool for the dynamic features of the hydraulic system. It can clearly express the physical significance of the model, and there is a correspondence between the bonding graph and the system’s mathematical model. The system’s state equation can be easily derived according to the bonding diagram. In this paper, the dynamic characteristics of the buoyancy control system are simulated and analyzed by using the power bonding graph. The following assumptions are made in establishing the power bond diagram of the system:
- (1)
The initial energy of the profiler comes from the ocean thermal energy. The conversion of the ocean thermal energy to the potential energy of the high-pressure fluid in the accumulator is a slow process. It is assumed that the initial source of energy is the accumulator.
- (2)
The solidification of the phase change material is a very slow process. It is assumed that the solidification shrinkage rate of the phase change material is the same as the oil discharge rate of the inner cylinder.
- (3)
The melting of the phase change material is a slow change process. It can be assumed that the melting and expansion rate of the phase change material is the same as the oil charging rate of the accumulator.
- (4)
The accumulator releases oil for a short time, which is regarded as an isothermal process.
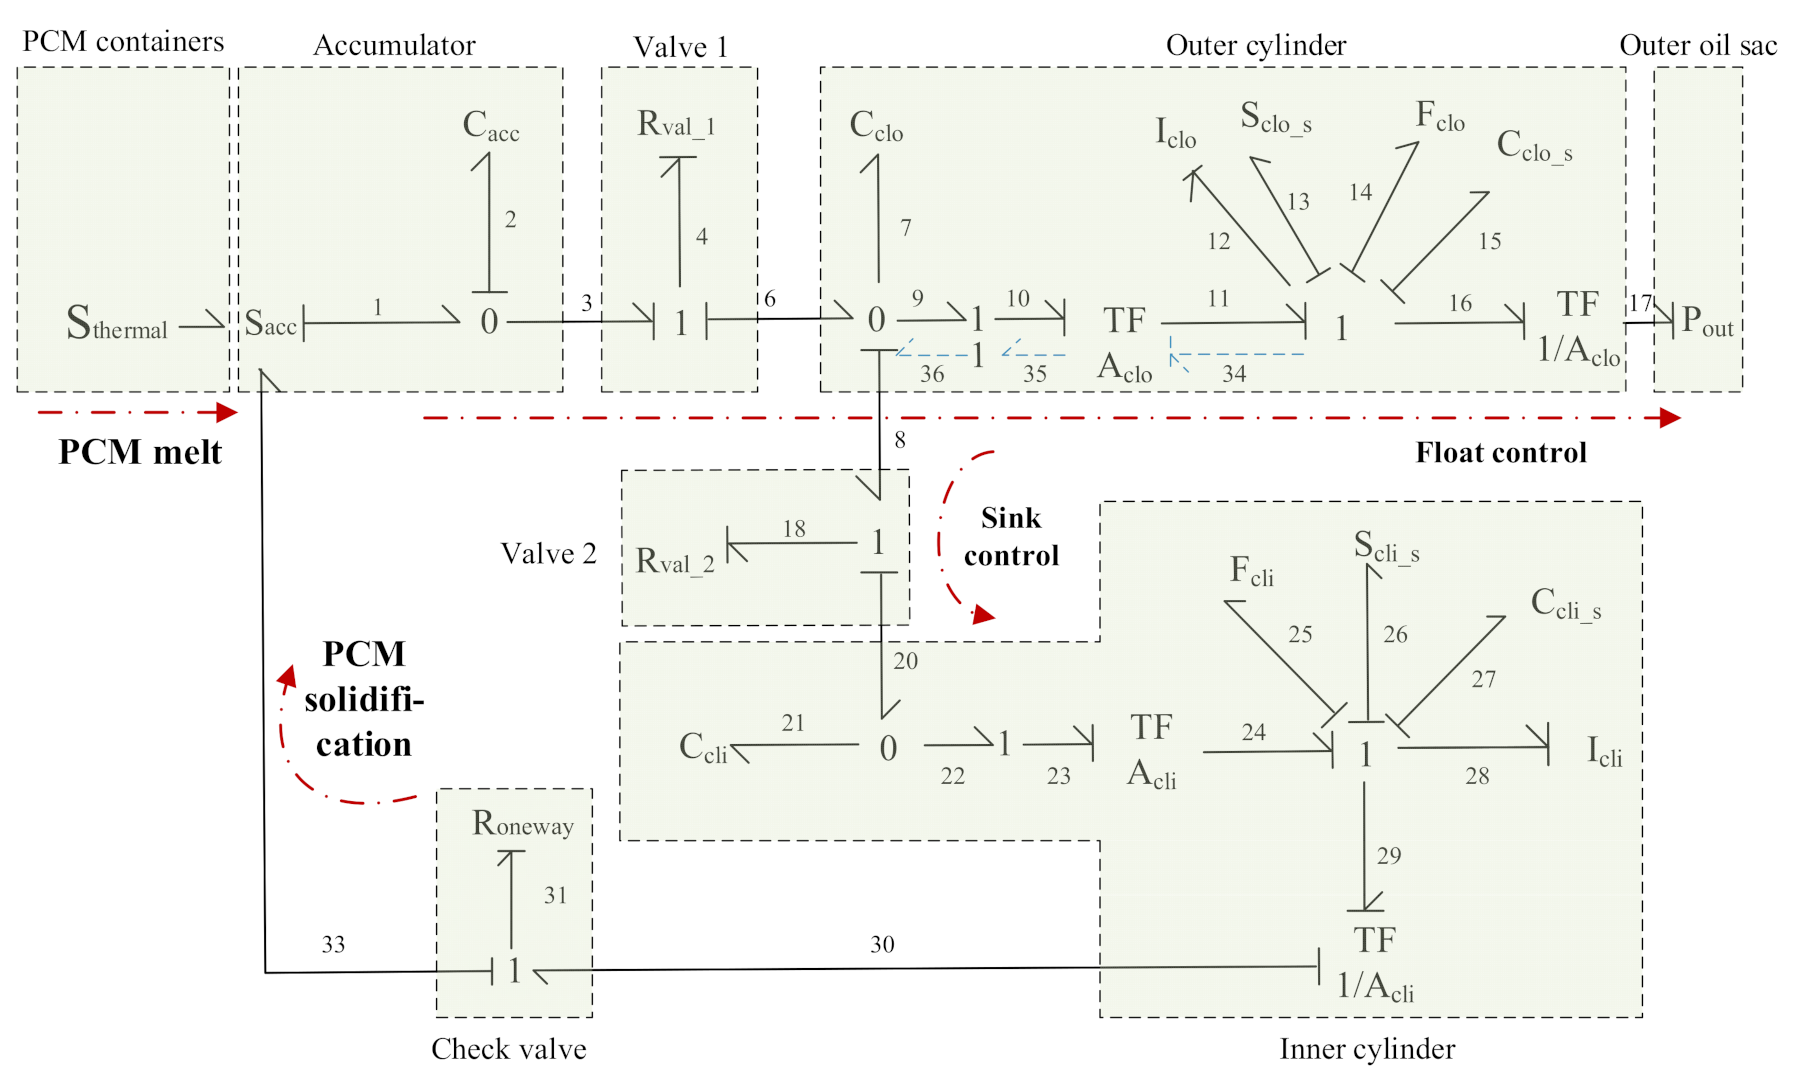
The power bonding diagram of this system is shown in
Figure 2. It is mainly composed of four parts, which are float control, sink control, PCM solidification process and PCM melting process. The details are shown as follows:
3.1. Float Control
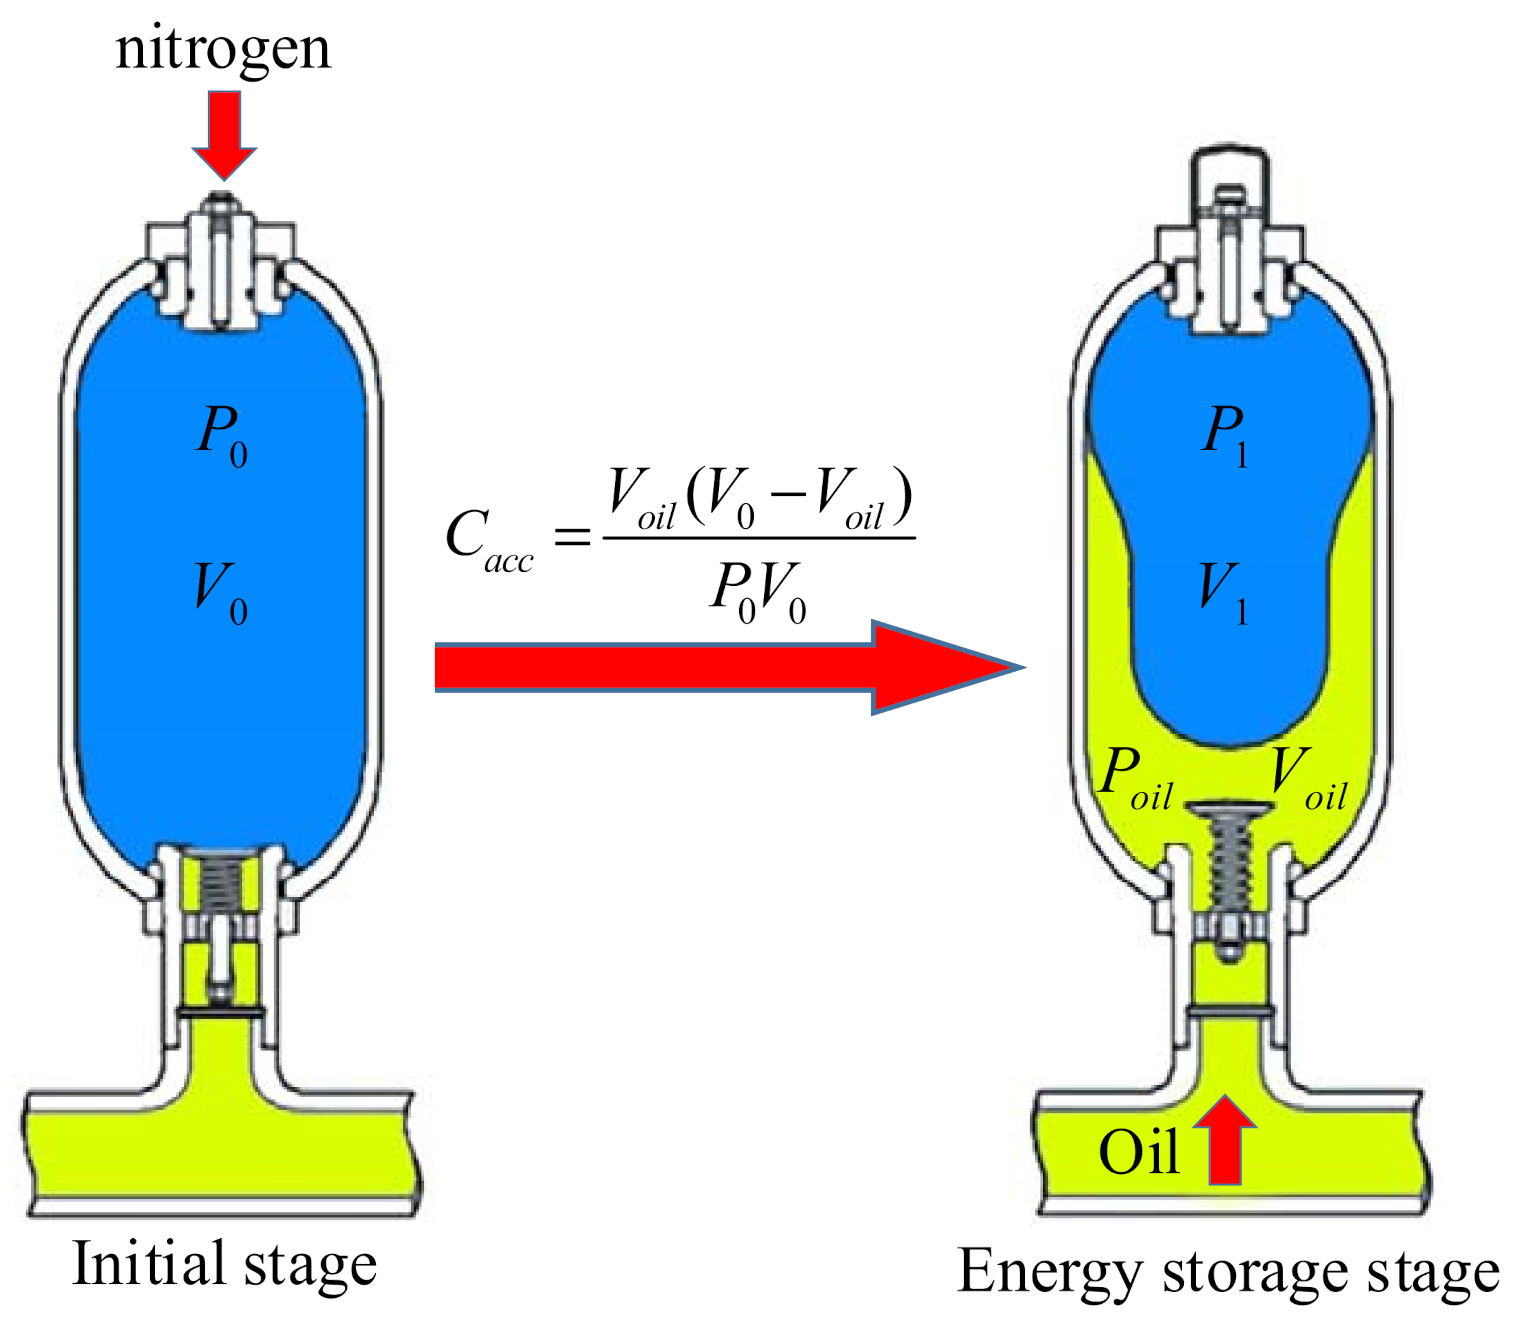
The pressure of the accumulator varies with the amount of oil stored. When the profiler is in the deep sea (low temperature), the float control process is carried out and the oil in the accumulator enters the external cylinder through the solenoid valve 1 (liquid resistance is ). Because the fluid flow rate of the accumulator output, through the valve 1 port, and entering the external cylinder, are consistent, node 1 is used here. Part of the fluid entering the external cylinder is used to fill the space produced by fluid compression due to increased pressure, part of the fluid is used to push the external cylinder piston, part of fluid enters the internal cylinder through valve 2, and the fluid pressure of these three parts is the same, so node 0 is used. The mechanical energy that drives the external cylinder piston movement is converted to the piston kinetic energy represented by mass , elastic potential energy represented by spring pretension force and spring softness , thermal energy represents by friction , and do work to overcome external water pressure.
3.2. Sink Control
When the profiler is on the surface of the water, the sinking control process is carried out. The outer spring overcomes the piston friction and pushes the piston. The oil flows through solenoid valve 2 (fluid resistance ) into the internal cylinder, part of the fluid entering the internal cylinder is used to fill the space produced by fluid compression due to increased pressure, the other part is used to push the inner piston, the fluid flow rate that drives the piston is converted to piston velocity by a proportional factor , which represents the area of the internal cylinder piston. The mechanical energy that drives the internal cylinder piston movement is converted to the piston kinetic energy represented by mass , elastic potential energy represented by spring pretension force and spring softness , thermal energy represents by friction .
3.3. PCM Solidification Process
The spring in the internal cylinder overcomes the friction , and pushes the inner piston. The fluid enters the oil sac of the PCM containers through the check valve whose fluid resistance is . PCM solidification process depends on the chamber diameter, temperature and other conditions, and it often takes one more hour in the experiment.
3.4. PCM Melting Process
The PCM absorbs ocean thermal energy, melts, expands, and pushes the fluid into the accumulator. The melting rate of the PCM is similar to the fluid filling rate of the accumulator. The PCM melting rate, which depends on the chamber diameter and temperature, is very slow, so the dynamic characteristic of this process can be ignored.
5. Experimental Research of Profiler Driven by Ocean Thermal Energy
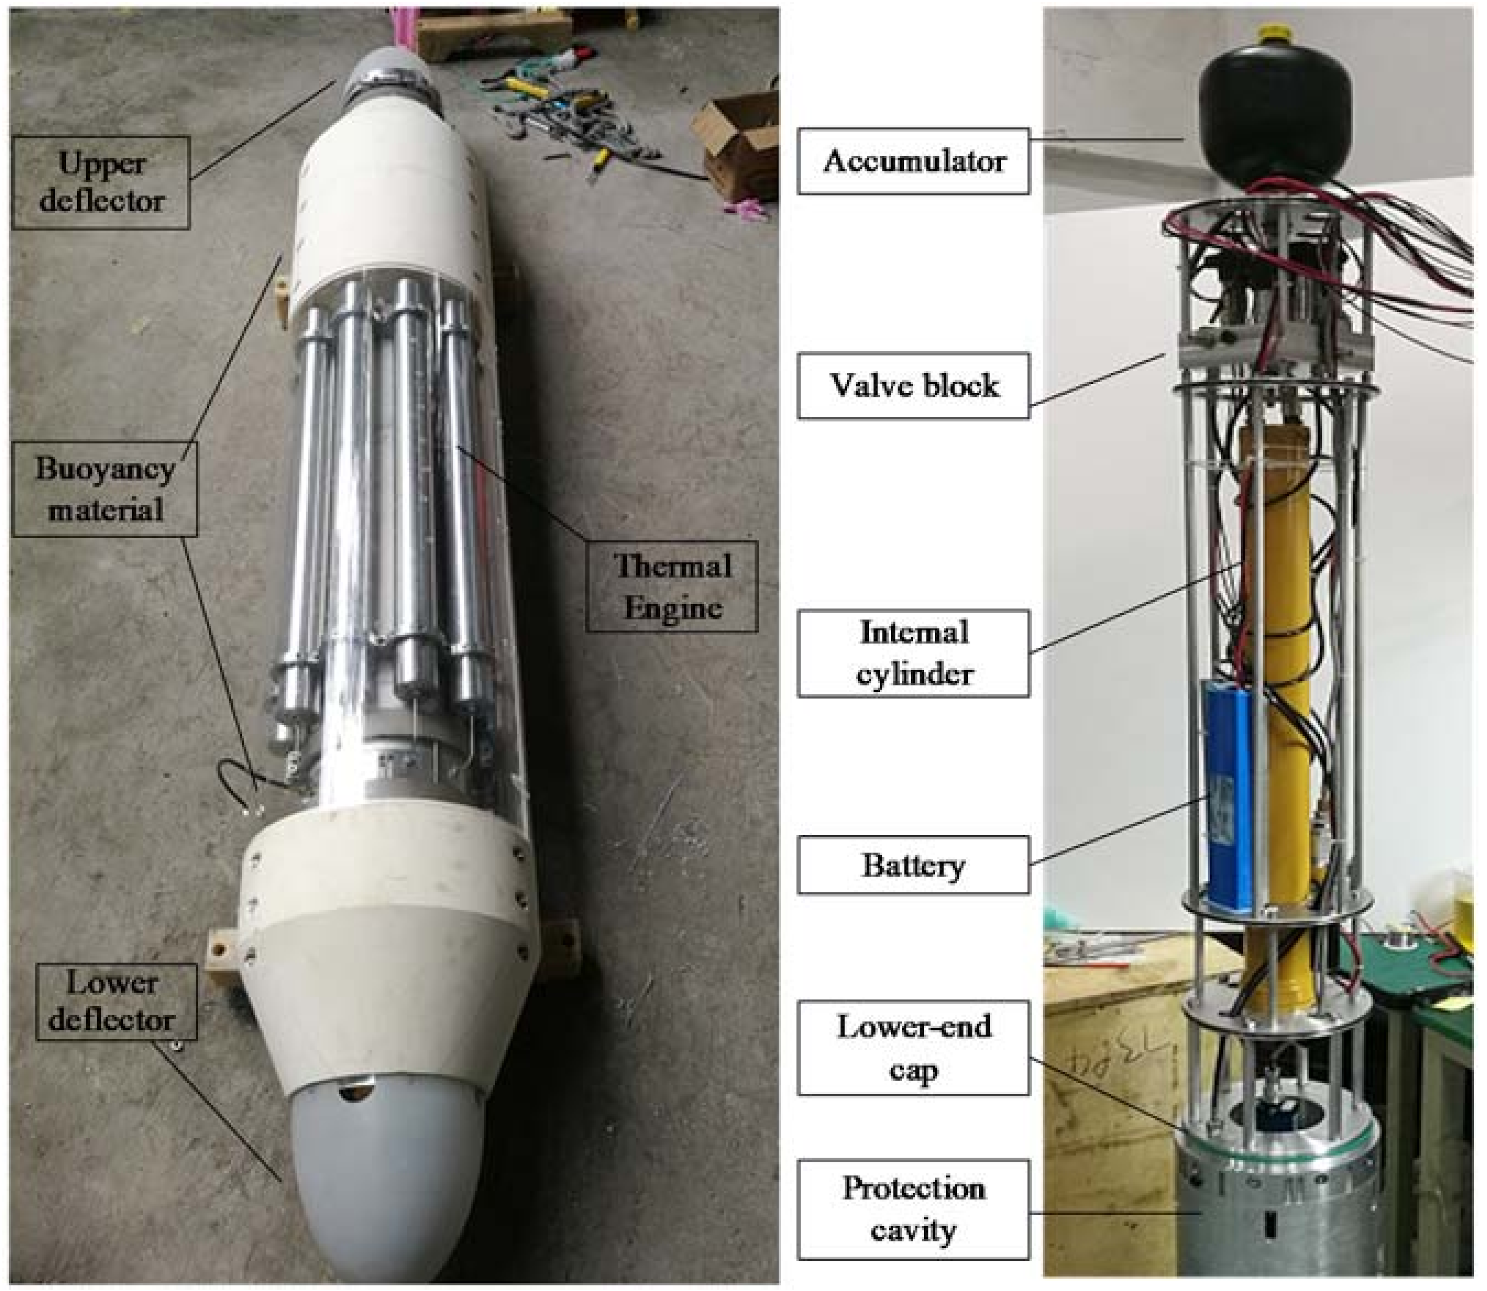
Figure 6 shows the shape and internal structure of the profiler. The profiler carries 8 L PCM, and the capacity of the buoyancy adjustment system is 8 N. Buoyancy materials are installed on the profiler to make buoyancy equal to gravity, and two deflectors are installed at the end of the profiler to reduce flow resistance. The upper-end cap is equipped with a depth sensor and a temperature sensor. The lower-end cap is equipped with the external cylinder and external bladder. Ten thermal engines are evenly arranged on the outside of the main cavity for thermal energy capture. The thermal engines are connected to the lower-end cap through titanium alloy tubes, and then connected to the hydraulic manifold block, which is composed of pressure sensors, solenoid valves, check valves and other components. By installing the pull wire displacement sensor on the inner cylinder and magnetostrictive displacement sensor on the external cylinder, accurate measurements of the oil volume are achieved.
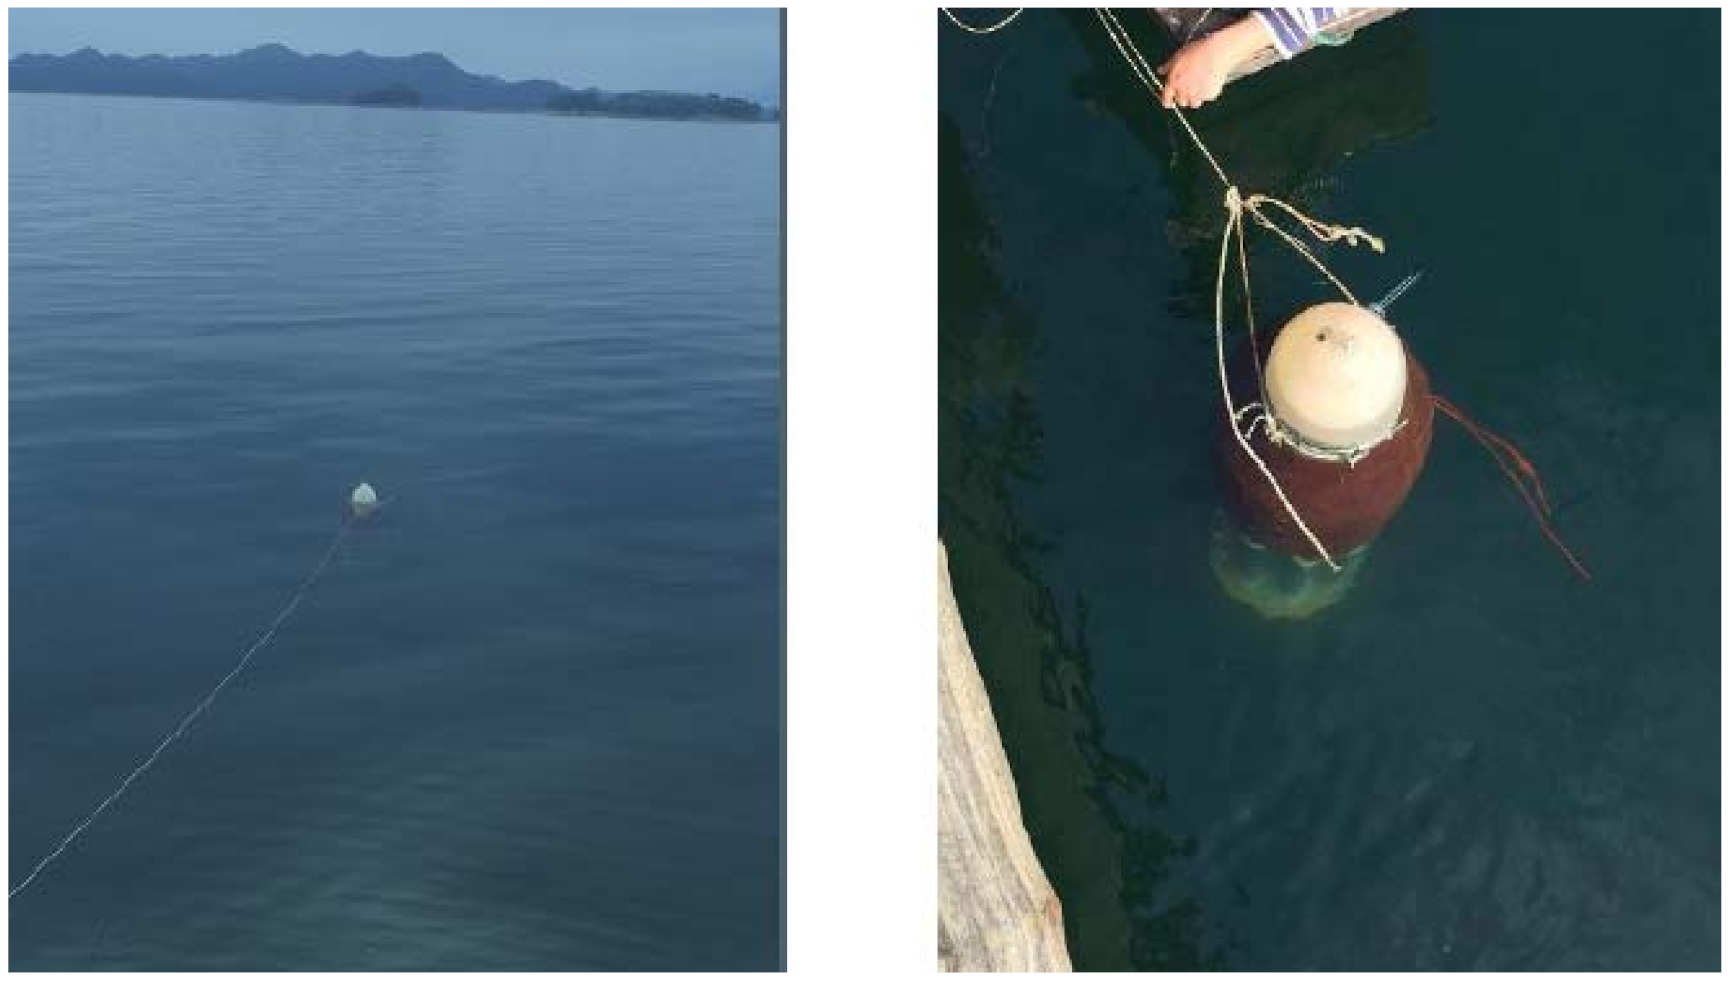
As shown in
Figure 7, the experiment was carried out in Qiandao Lake, where the surface water temperature is 21 degrees, and the bottom water temperature is 11.5 degrees. The ocean thermal profiler prototype was deployed with a float–rope–profiler structure so that the profiler can float freely. Compared with other deployment methods, this deployment layout can make the profiler less affected by the current and the tension of the rope, and the fixed-length rope could prevent the profiler from touching the bottom. During the lake test, setting the profiler to neutral buoyancy first, and then adding a 3.5 N counterweight on the profiler, the profiler starts to dive. After the PCM is solidified to the set value, the profiler will automatically float up. The profiler relies on the temperature difference energy to automatically float up and down, and was recovered after three cycles.
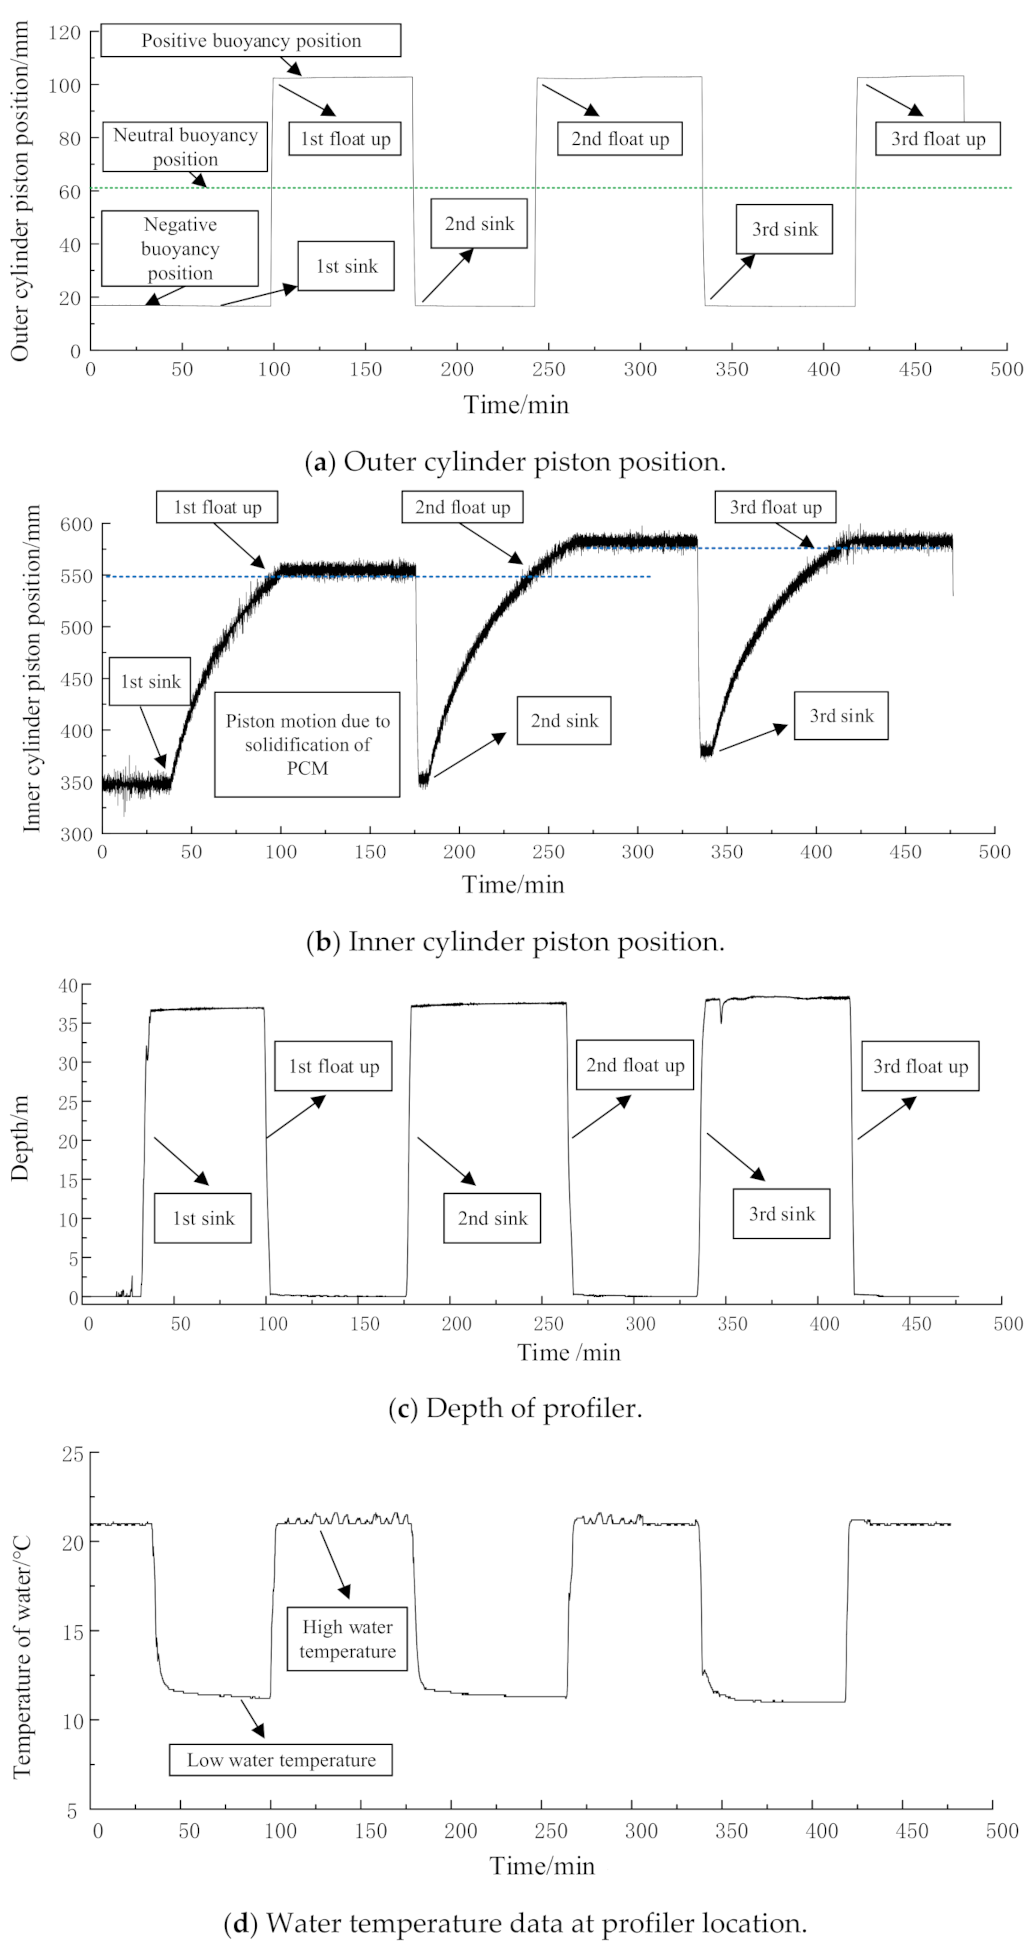
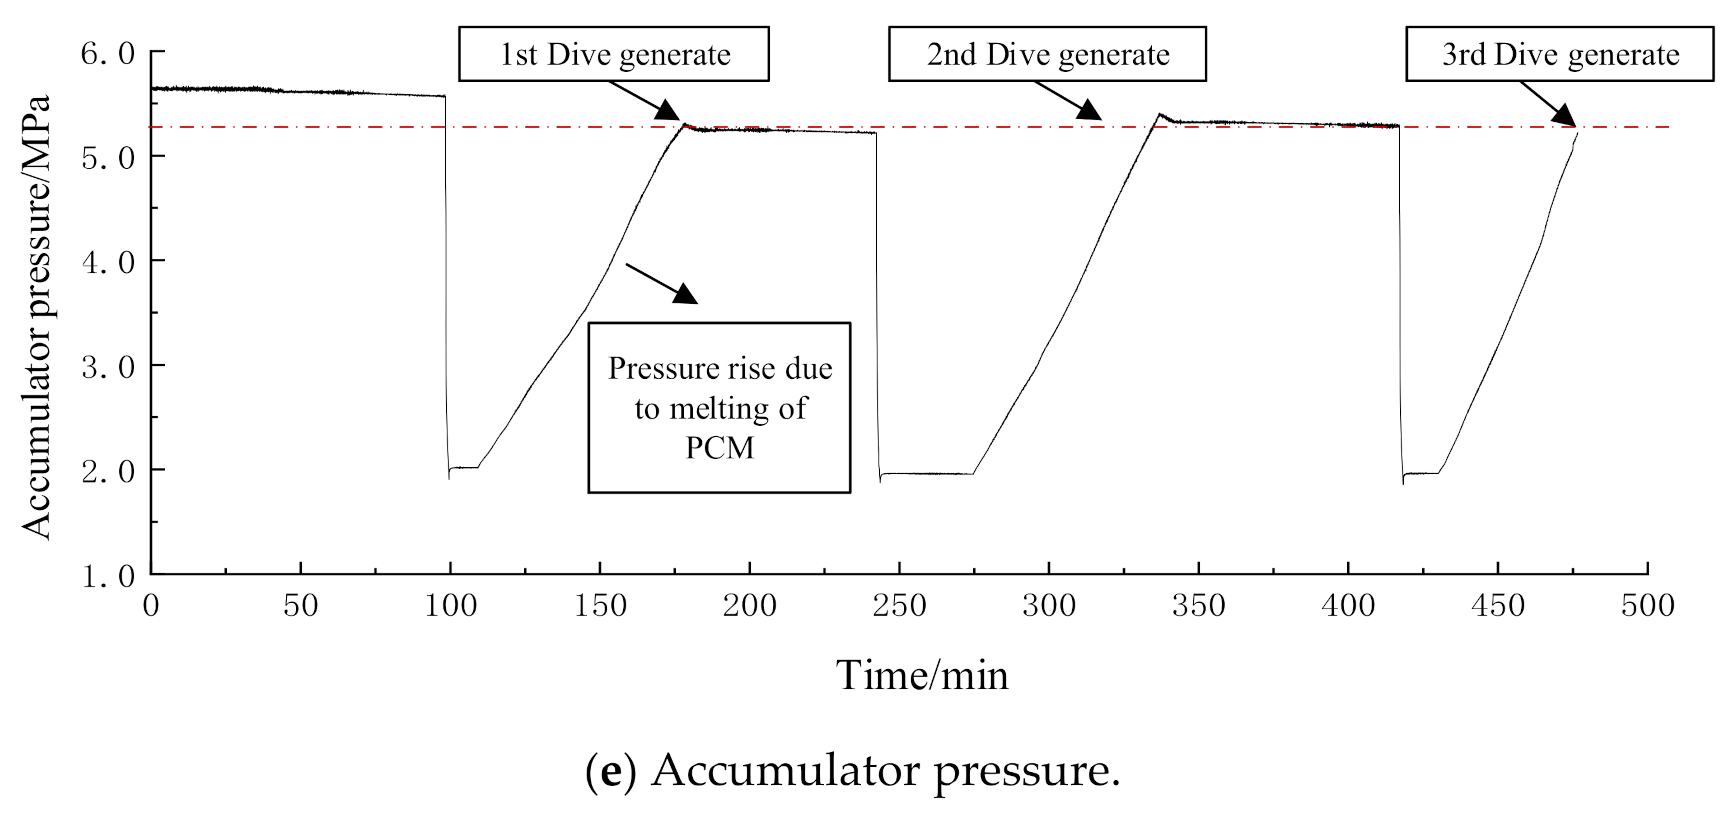
The profiler state of the lake test is shown in
Figure 8. Key data, such as outer cylinder piston position, water depth, water temperature, accumulator pressure, and inner cylinder piston position, are expressed in the diagram. At the beginning of the experiment, the atmospheric temperature was 24 degrees, which is higher than the phase change temperature of PCM (18 °C), so the PCM had already melted before the profiler was placed in the water. The accumulator was under high pressure, the outer cylinder piston position was in low position and the profiler was in a negative buoyancy state. After putting the profiler into the water, it started to sink. Because the water temperature at the bottom of the lake was 12.5 degrees, which is lower than the phase change temperature of PCM, the PCM started to freeze and shrink. The oil flowed from the internal cylinder to the inner oil sacs, which were installed in the PCM containers, and the internal cylinder piston started to move. When the piston reached the 550 mm position, solenoid valve 1 (shown in
Figure 1) opened and the oil entered the external cylinder from the accumulator, and the external cylinder piston moved from the 18 mm to the 104 mm position, which led to an increase of buoyancy and floats up of the profiler. As the surface water temperature was higher (22 °C), the PCM gradually melted and the accumulator pressure increased. Solenoid valve 2 opened when the accumulator pressure raised to 5.2 MPa, and the oil flowed from the external cylinder into the internal cylinder, which caused the inner and outer cylinder pistons to move, and the profiler converted to a negative buoyancy state. The profiler started to sink and the second cycle began. In the experiment, the energy that drives the motion of the profiler came from the accumulator, which originated from the thermal energy of water, so the profiler achieved self-driven movement relying on environmental energy.


 ,
, 