1. Introduction
The transportation sector is responsible for 27% of the total energy consumption in the world economy (a volume that accounts for 33.7% of total CO
2 emissions) because, at present, this sector mainly uses means of transport equipped with internal combustion engines [
1,
2]. The use of internal combustion engines powered by fossil fuels leads to the discharge of toxic emissions of carbon dioxide (CO
2), carbon monoxide (CO), nitrogen oxides (NO
x), hydrocarbons (HCs), particulate matter (PM), volatile organic compounds (VOCs), etc. [
3] into the environment. For this primary reason, the development and use of electric vehicles can directly and immediately contribute to reducing greenhouse gas emissions as well as pollution in large urban areas. The development of technologies for electric vehicles is currently taking place and aims to increase the overall efficiency of electric vehicles and electric powertrains. Thus, in order to offer an alternative to vehicles equipped with internal combustion engines, electric vehicles need a sophisticated and complex control system, a high energy and power density of the energy source, long life cycle of the energy source and high-efficiency power electronic equipment.
Among various power batteries, lithium-ion (Li-ion) batteries with high power density are highly recommended as power sources to provide a long driving range and fast acceleration [
4]. However, Li-ion batteries can generate a lot of heat during rapid charge and discharge cycles at a high current level, and their energy storage capacity and longevity are quite susceptible to temperature and temperature uniformity [
5].
Studies and research have shown the importance of monitoring and operating the batteries in the appropriate temperature range. Research indicates that, in general, the best temperature range for operating a Li-ion battery is between 15 °C and 50 °C [
6]. Zhao et al. [
7] highlighted that the lifetime of the battery will be reduced by two months for a temperature increase of one degree. In addition, the maximum temperature difference in a battery pack should be maintained below 5 °C to promote battery balancing and uniform charging during the cycle [
8], and recent studies have shown that a temperature increase of Li-ion cells due to a higher charge/discharge rate leads to a decrease in the battery life of around 65% to 95% (depending on the cell chemistry) [
9].
Based on the arguments presented above, it is observed that there is a need to design, develop and build a thermal management system for the battery of an electric vehicle (BTMS), which through the command-and-control processes needs to provide optimal thermal operating conditions. Thus, the thermal management system of the battery is used to maintain the temperature of the batteries in the optimal range (according to the cell electrochemistry). Various studies on thermal management, from cooling methods and battery arrangement to the battery thermal modeling, have been carried out. Different cooling methods have been proposed, including air cooling, liquid cooling, heat pipe cooling and phase change material cooling [
10,
11,
12,
13,
14,
15,
16,
17,
18,
19]. Generally, the liquid cooling method has a promising performance with a high coefficient of thermal conductivity. However, the extra weight, including the liquid coolant and sealing elements to avoid liquid leakage, and the increase in manufacturing costs from the liquid coolant circulation system make it less advantageous. Air cooling is one of the most widely used cooling methods in battery thermal management systems due to its low cost and simple structure, and it is extensively applied in electric vehicles and hybrid electric vehicles [
20]. Often, a forced air cooling system is used in a controlled manner, aiming cooled air into the battery cells. Under a lower rate of charging/discharging, the temperature rise rate is low, and this will work efficiently. However, an increased rate of charging/discharging results in a sudden rise in temperature which requires a considerable amount of air to be directed towards the battery module to abate the raised temperature [
21,
22].
Wang et al. [
23] investigated the cooling effect on a cylindrical battery pack with different arrangement structures and forced air cooling strategies through a numeric simulation method, to determine the optimal design of a battery pack. Mahamud and Park [
24] put forward a novel reciprocating air cooling style which can improve the temperature uniformity, and proposed a lumped-capacitance thermal model and flow network model. Further, Wang et al. [
25] also proposed an effective method of reciprocating air flow cooling, which could control the battery temperature well. Liu et al. [
26] proposed a flow resistance network model to calculate the velocities in parallel channels in an air-cooled BTMS with Z-type flow and, furthermore, a transient heat transfer model was incorporated with this model to calculate the battery cell temperature. Chen et al. [
27] combined the flow resistance network model with the Newton method to optimize the angles of the divergence and convergence ducts in BTMS with Z-type flow. Subsequently, the same research group developed a steady heat transfer model to calculate the battery cell temperature [
28].
Studies have proven that electrochemical models coupled with thermal models offer good performance in investigating the electrochemical and thermal behavior of battery cells [
29]. To achieve better cooling performance, several researchers have combined different cooling methods to the electrochemical–thermal model [
30,
31]. Numerous studies have implemented and validated thermal mathematical models that analyze convective heat transfer from the surface of battery cells [
24,
32,
33,
34,
35,
36,
37]. However, these models approach the heat transfer of a cell as a single parameter, which reflects the overall performance of an accumulator. This method can be a good approximation when the cells are positioned in a free air stream and the distribution of air is uniform throughout the battery pack. However, EV battery packs need to be compact and tightly packaged for a good space efficiency. Therefore, for a more realistic approach, one should consider the local heat transfer coefficients of a battery and how they affect the temperature gradients inside the cells.
In this paper, a segmented thermal resistance model for cylindrical batteries in a horizontal position configuration is proposed. The local convective heat transfer coefficients are determined using computational fluid dynamics (CFD) simulations and then introduced into a transient 1D mathematical model to predict temperature variations inside the battery’s cells. The transient model represents a dynamic behavior of the electric powertrain, characteristic for driving on a racetrack. The numerical model allows the evaluation of a battery pack casing’s influence on the local temperatures of a large-scale pack and the calculation of necessary air flow to maintain local maximum temperatures under the desired limit. The main contribution of this study is the development of such a numerical model and its application to thermal management of a Formula Student electric vehicle battery pack with forced air cooling.
2. Research Methodology
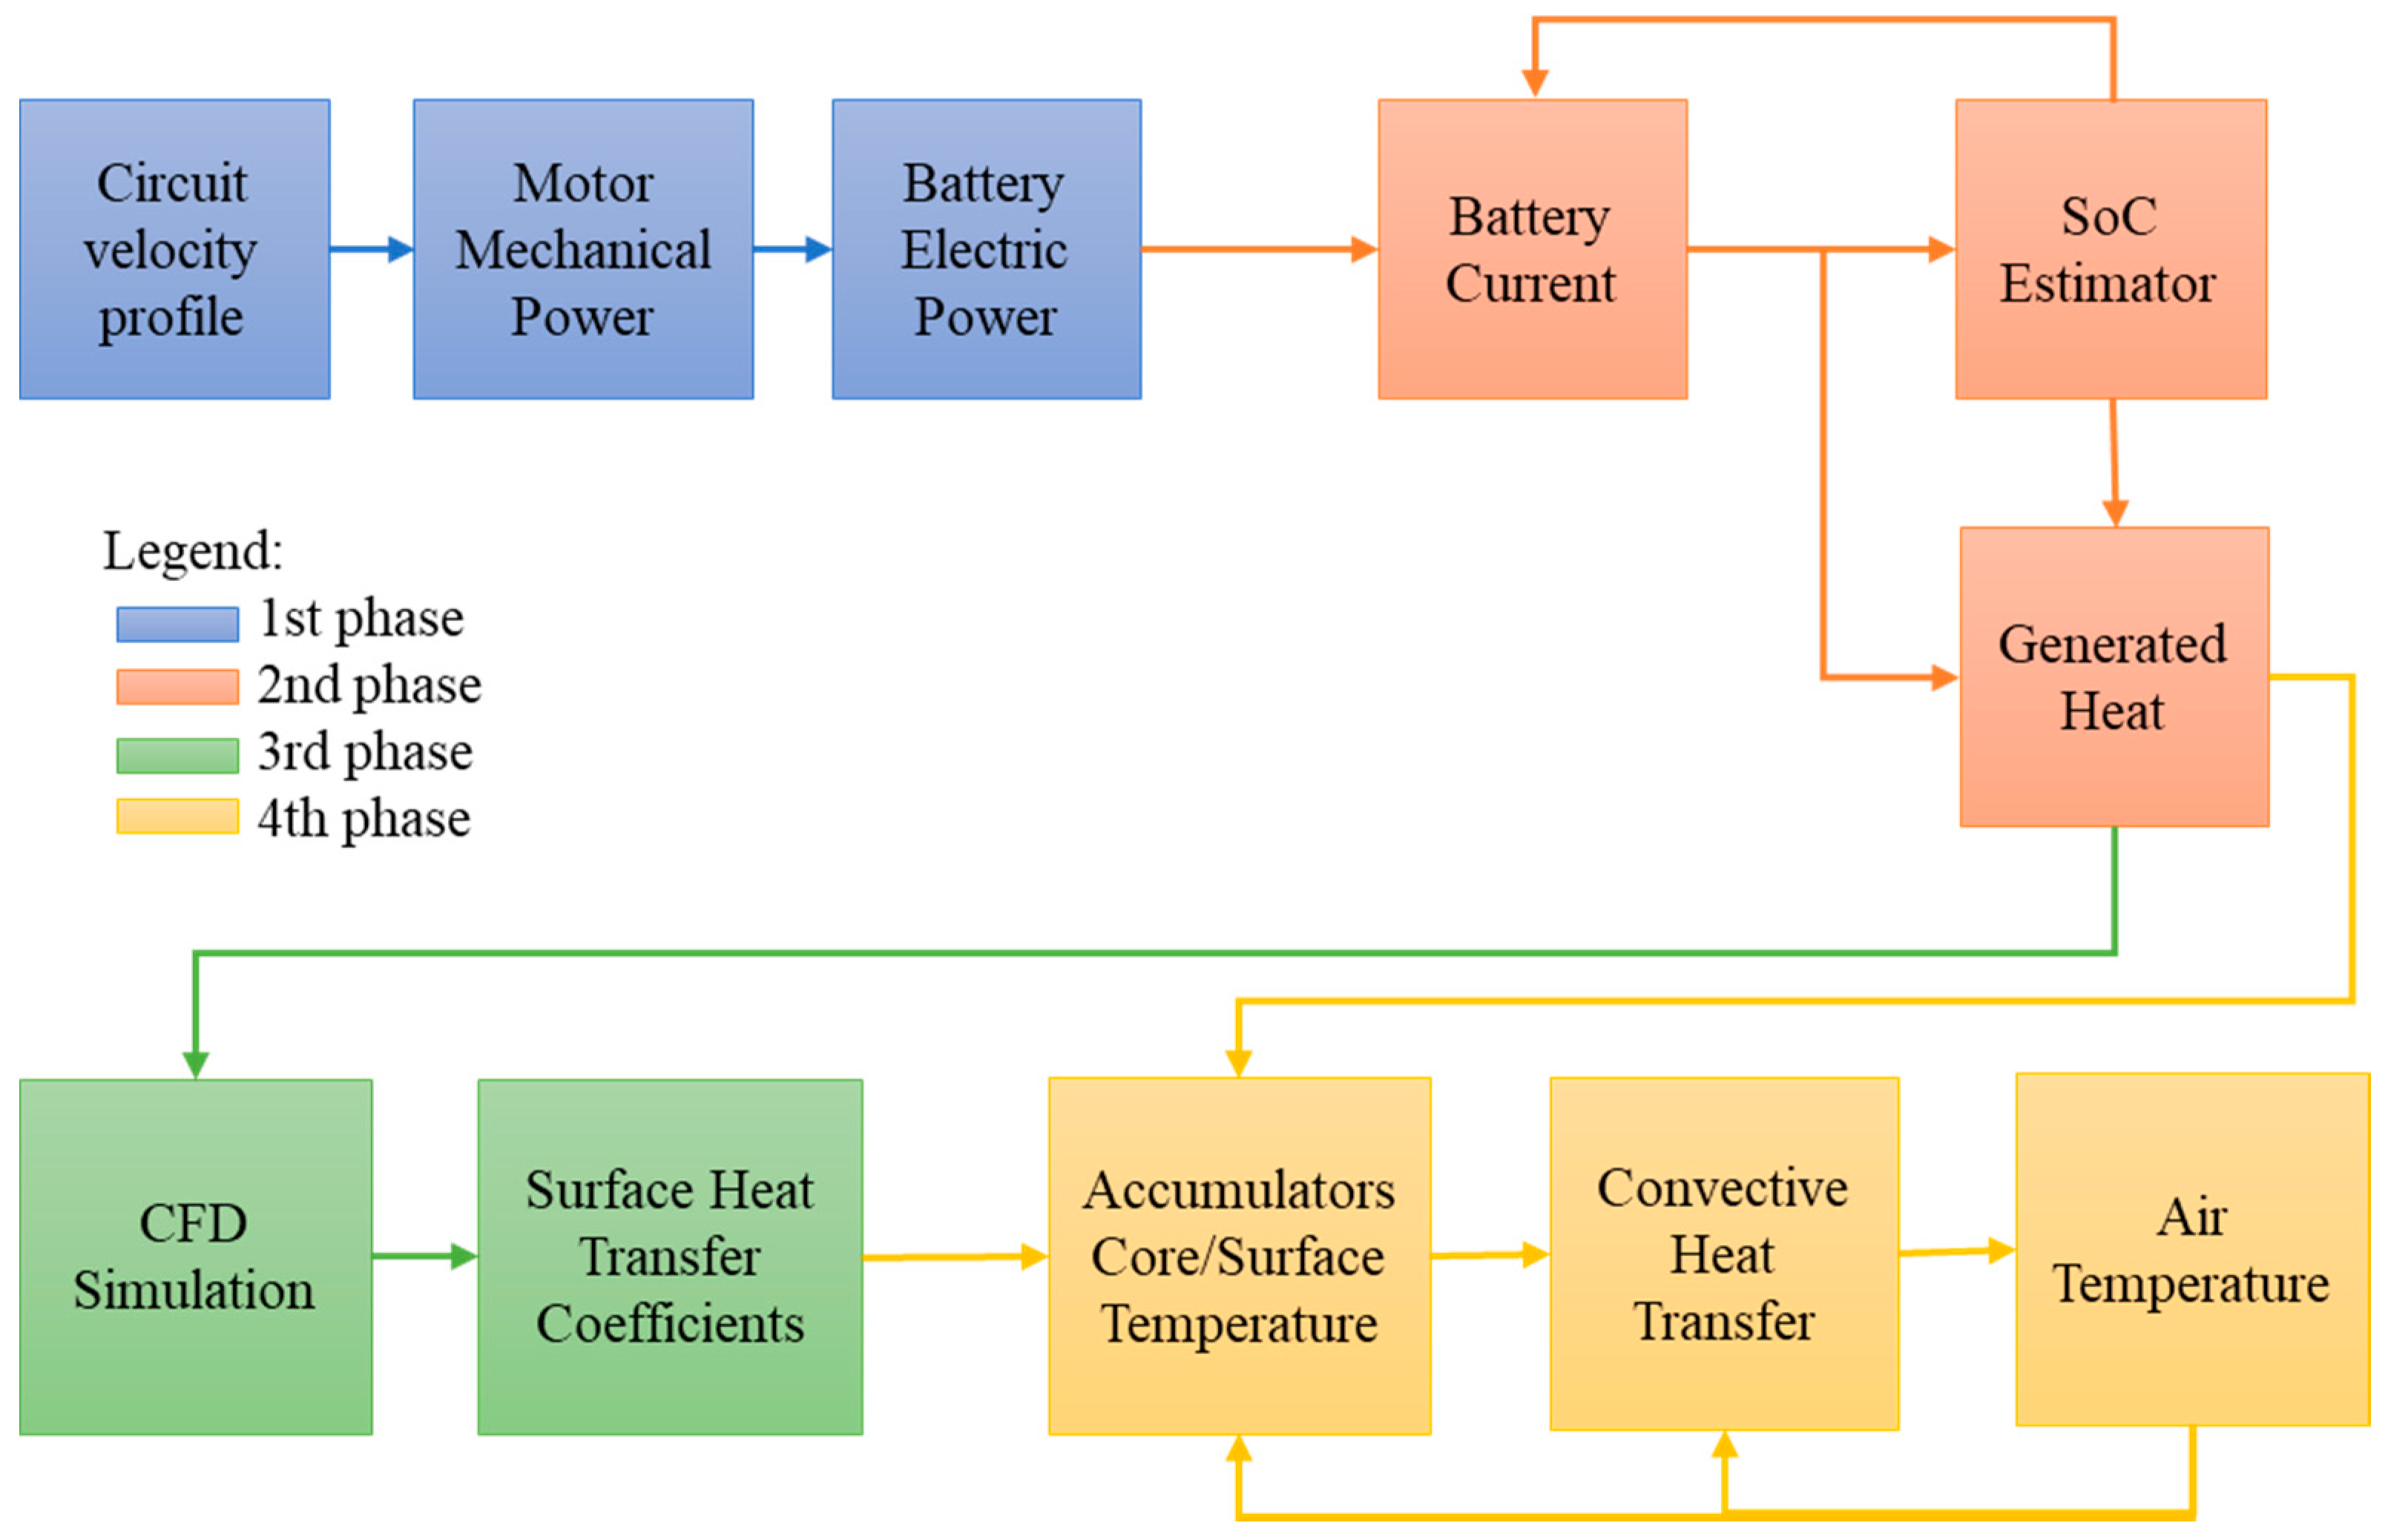
The steps followed to determine the temperatures in the core of cells inside a battery segment, presented in
Figure 1, are as follows:
Defining system requirements;
Defining the profile of the electric current extracted from the batteries during an endurance event of a competition and of the heat generated by the batteries, using 1D simulation;
Steady-state 3D (CFD) simulations to determine the values of the heat transfer coefficient on the surface of the batteries at different air flow and heat generation values;
Completing the mathematical model with the heat transfer maps thus obtained and evaluating the thermal behavior of the system in transient mode using the 1D simulation model.
2.1. Defining Requirements
The heat released by the cells and implicitly by the battery pack depends directly on the battery demand, and therefore on the operating mode of the vehicle. The requirements imposed on the battery pack from a thermal point of view are defined by the completion of 22 km on a racetrack, without exceeding the limit temperature of 50 °C. The calculations are based on the velocity profile of an electric vehicle (Formula Student) during a fast lap on the Hockenheimring circuit, in Germany. By means of this velocity profile of the accelerations and the characteristics of the analyzed propulsion system, it is possible to calculate the electric current needed to be delivered by the battery cells at every moment of the event and thus the thermal load to be handled by the battery’s cooling system. The construction of the analyzed electric prototype powertrain has the following data and technical specifications:
concept: 2 BLDC motors on the rear axle of the car;
maximum power: 30 kW (15 kW for each motor);
battery cell type: 18,650 Sony VTC6T (NMC chemistry);
battery module configuration: 1s5p;
number of modules in parallel: 2;
number of modules in series: 88;
battery pack configuration: 88s10p;
battery maximum discharge current: 464 A;
battery nominal voltage: 317 V;
battery maximum voltage: 369 V;
battery energy: 9.8 kWh.
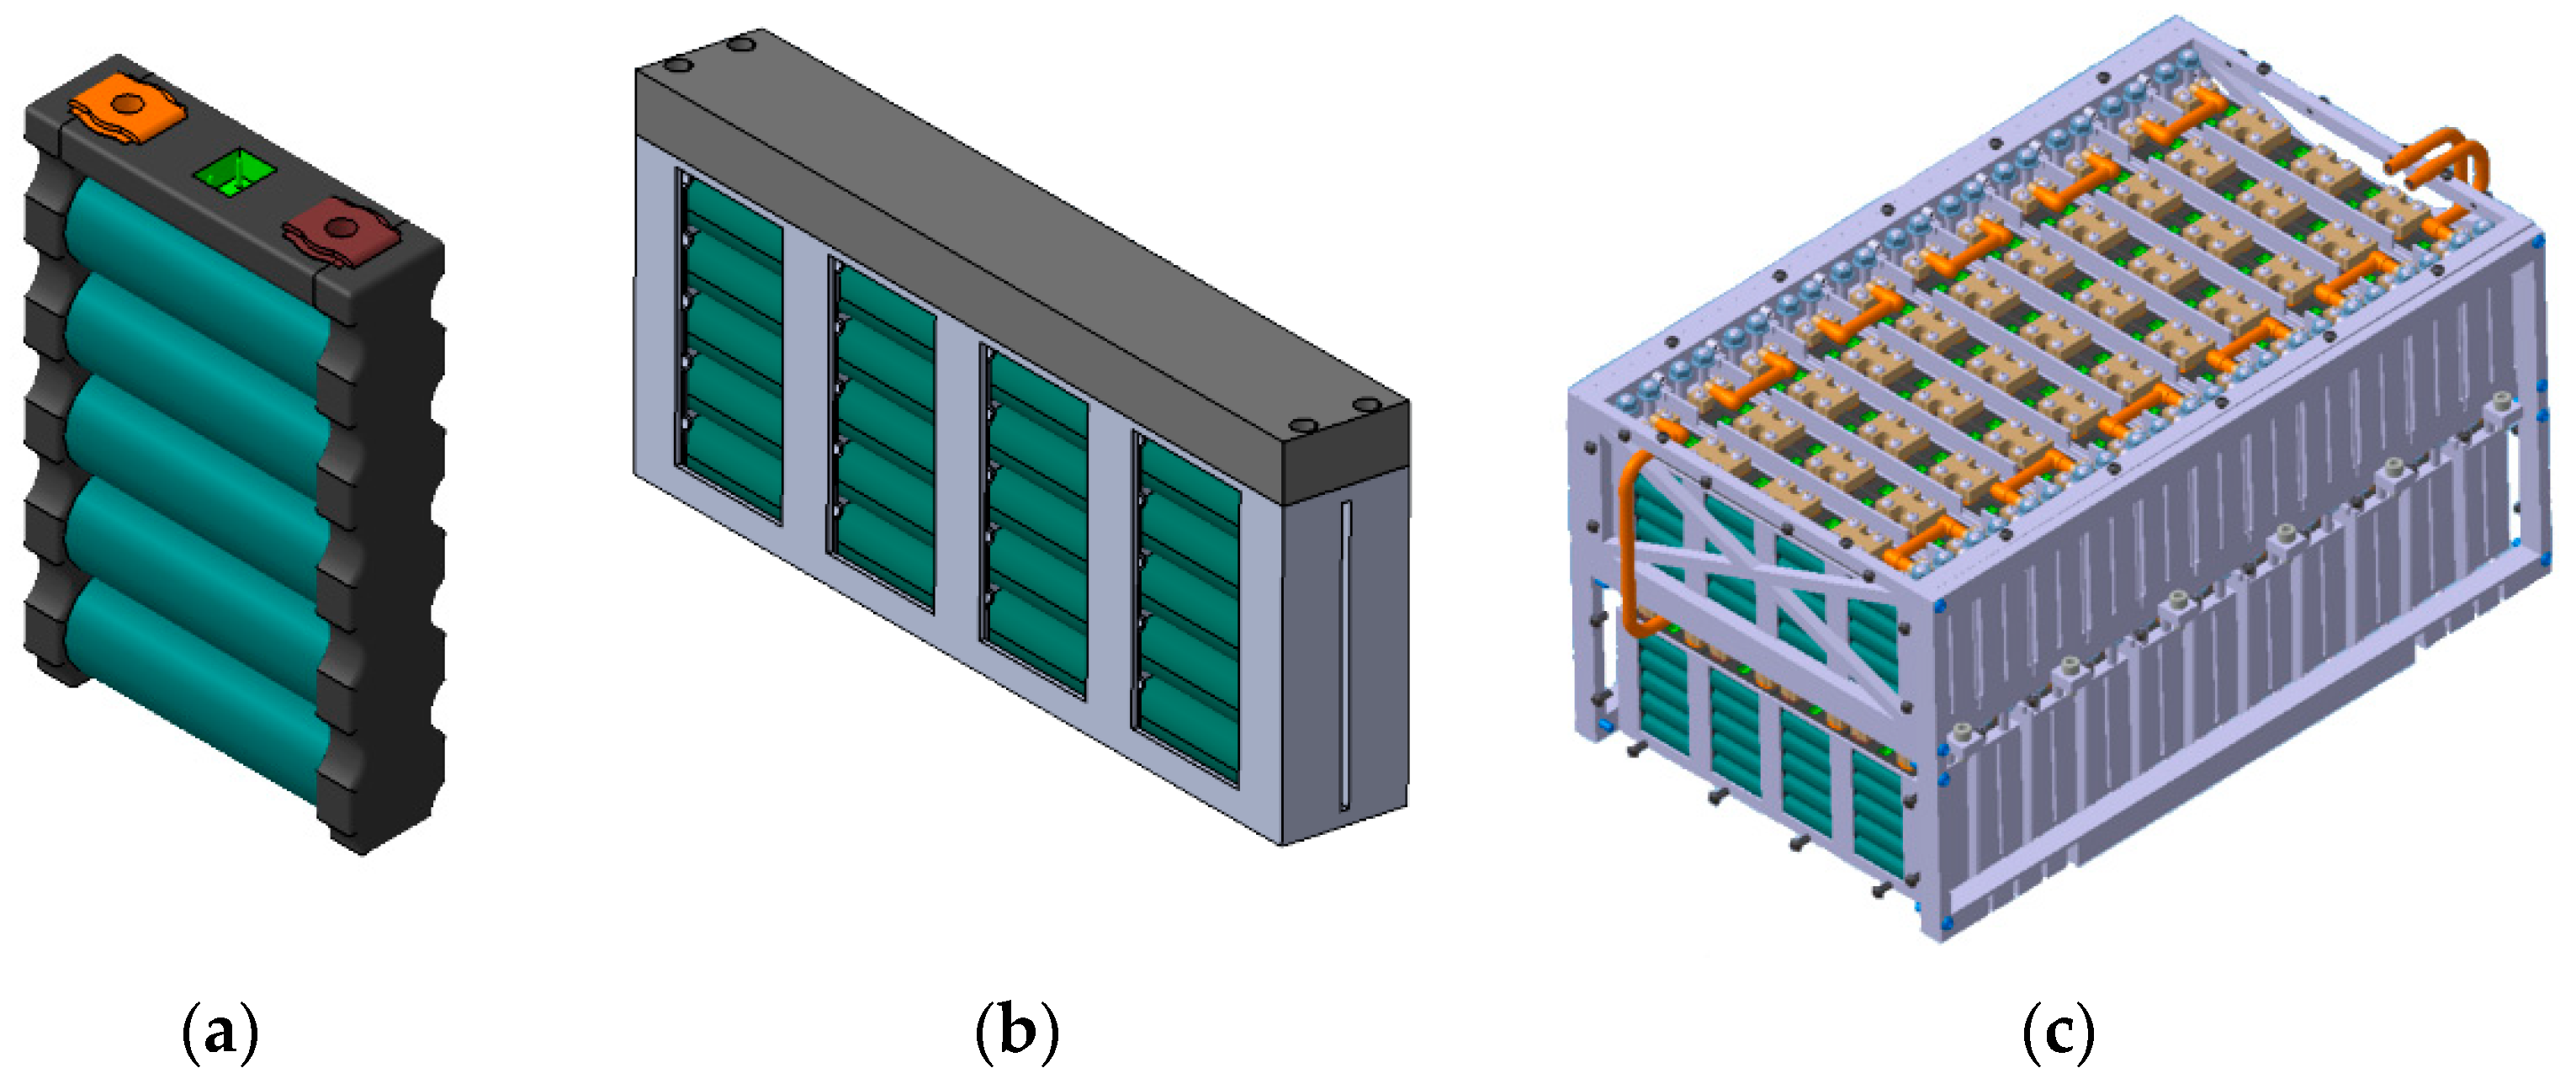
Attention is directed towards the thermal behavior of a battery segment (
Figure 2b), composed of 8 battery modules (
Figure 2a), with the battery pack being composed of 22 segments arranged on 2 levels (
Figure 2c).
2.2. Battery Heat Generation
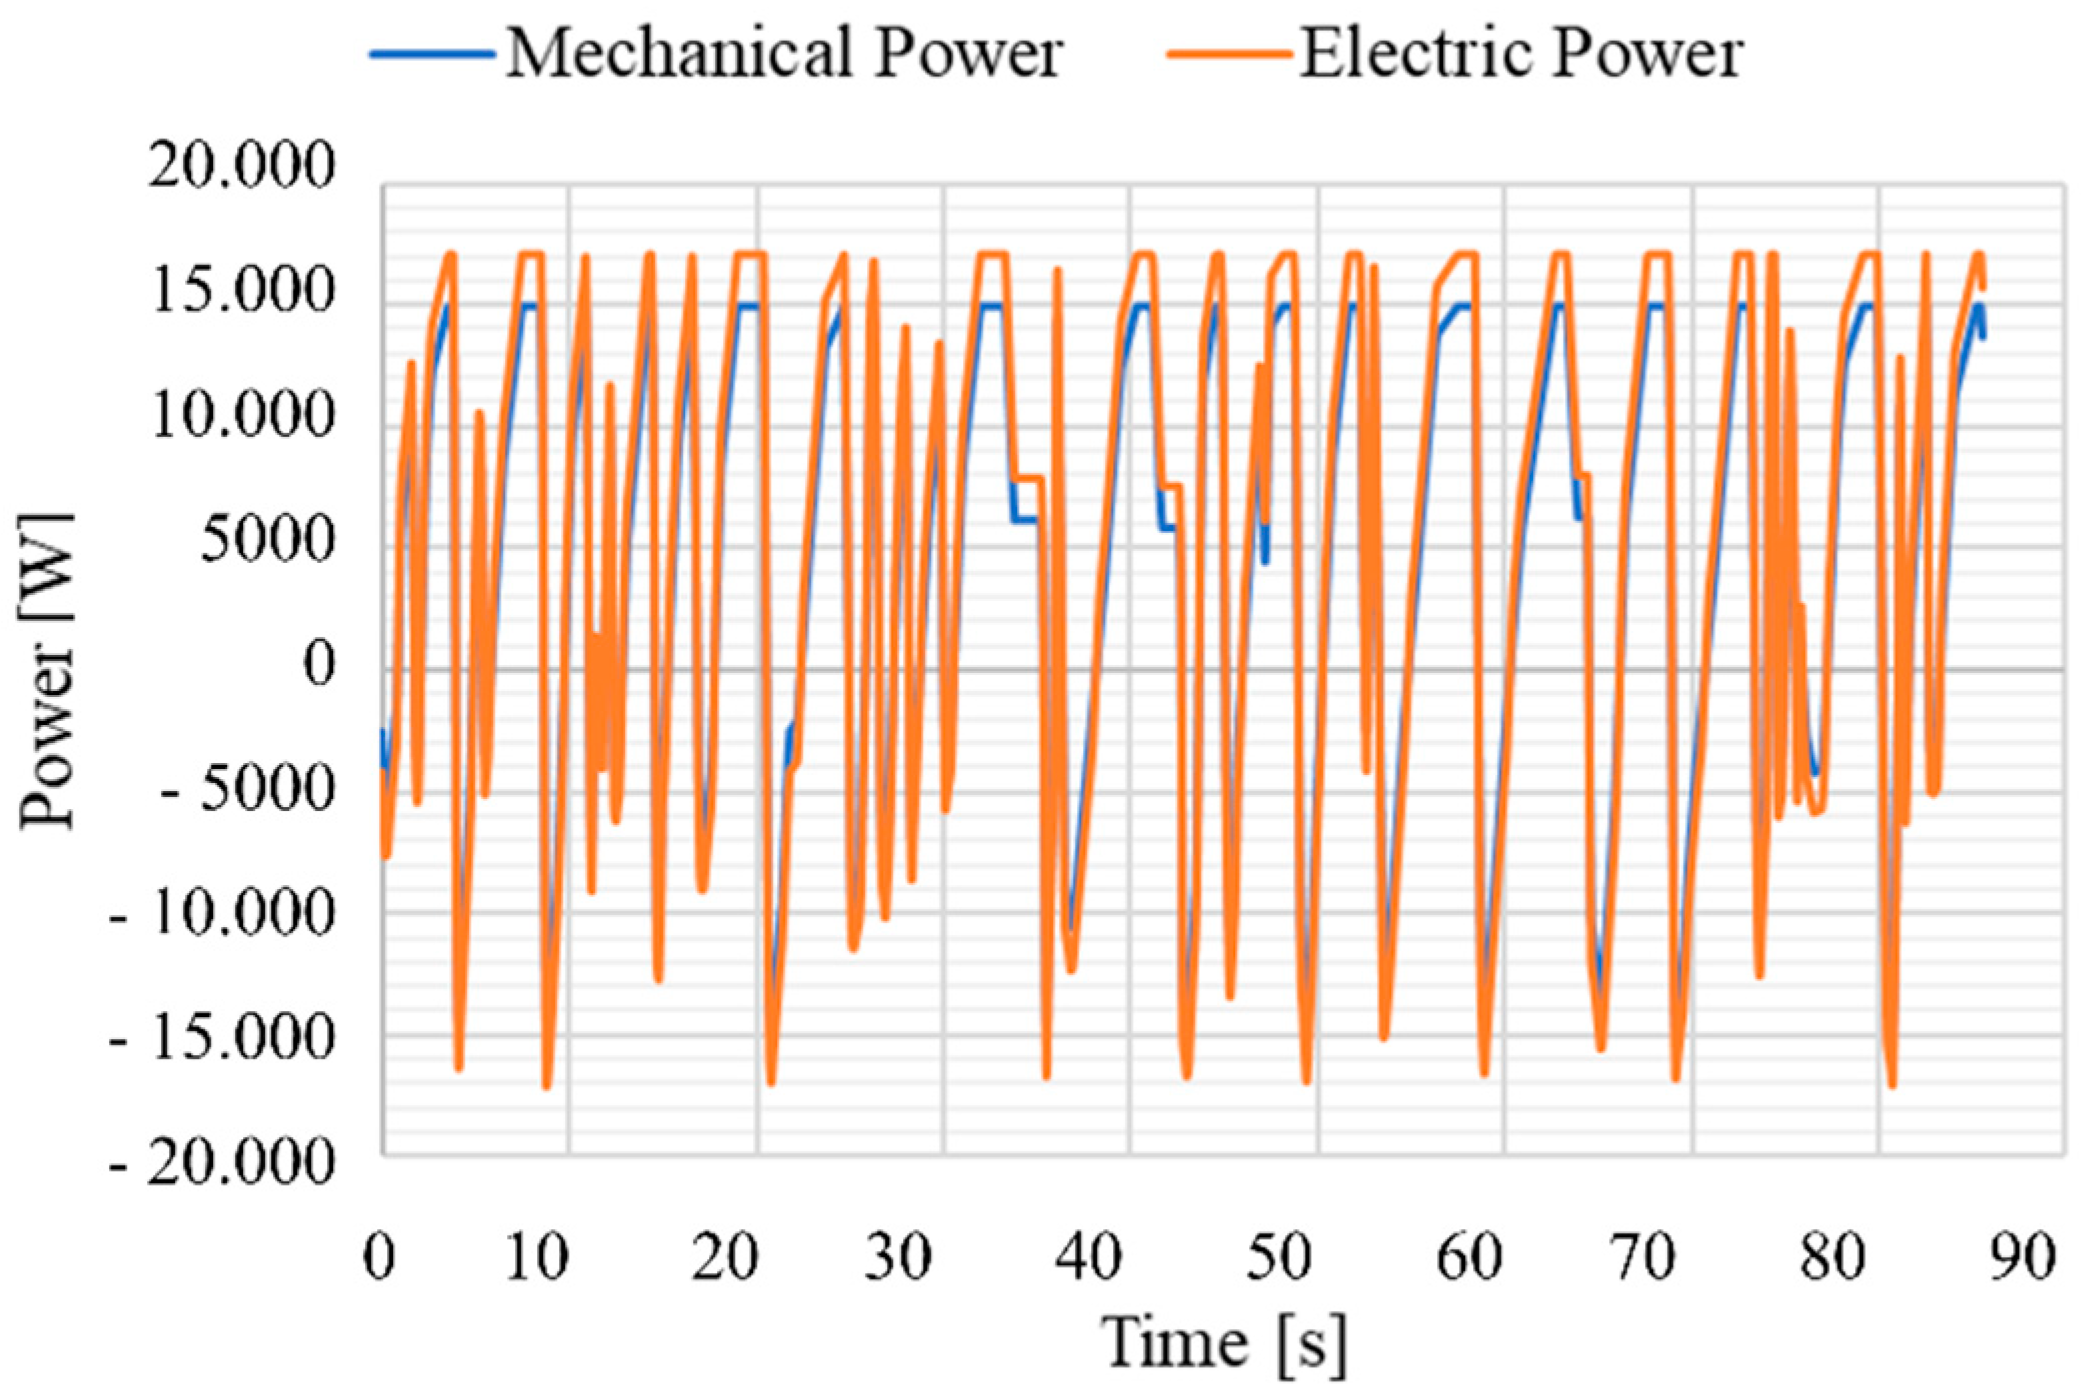
Firstly, the calculation of the electric current extracted from the battery cells is necessary, depending on the power required by the motors and the state of charge of the battery. The longitudinal resistance forces that the vehicle must overcome, in order to follow the required velocity profile, have been calculated. Therefore, the rolling resistance force, the aerodynamic drag force and the acceleration resistance force are determined. Their sum results in the traction force needed at the wheel, from which the torque at the wheel and the motor torque necessary for the required performances are calculated. With the motor speed being known due to the velocity profile, it is possible to determine the mechanical power to be developed by the motors at any time. In addition to the power required during acceleration, the possibility of recovering energy by regenerative braking is also taken into account. Using the efficiency map, the required power supply for each motor is determined (
Figure 3), which is further used to determine the electric current to be extracted from the battery depending on its state of charge.
The power profile is repeated 23 times to cover a distance of 22 km, totaling a time of 1960 s, while the value of the electric current to be extracted from the battery is calculated based on its state of charge according to Equation (1), separate from the voltage at the output of the battery.
where
SoC0 is the initial state of charge,
CAh represents the battery capacity and
I is the extracted current.
The voltage of the batteries, depending on their state of charge, is taken from their data sheet, considering the specific temperature curve of 45 °C. Using the electric current obtained, the heat generated by each cell is determined:
where the internal resistance
Rint is taken from a map according to the discharge rate and the state of charge (
Rint =
f (C-rate, SoC)) and, using the experimental measurements performed by Drake [
38],
T represents the temperature and
dEOV/
dT is the entropic coefficient. The C-rate and SoC of the battery are shown in
Figure 4a,b, respectively. Thus, the profile of the heat generated by the battery cells during the endurance race is represented in
Figure 4c, the average for the 1960 s being ~1 W/cell.
2.3. CFD Simulations
Fluent solver is used to determine the heat transfer coefficient on the surface of the battery cells. The objective of the CFD simulations is to determine the values of the coefficient in steady-state conditions, for several cases of generated heat and air flow. These results are then introduced in heat transfer maps to characterize the thermal behavior in different situations. The reason for using this method, in which transient simulations are performed using a 1D model that integrates the characteristics obtained from steady-state 3D CFD simulations, is the considerable reduction in the required computational effort.
In a first phase, the aim is to define a reference CFD model, which can be used further for the other analyzed cases. The mesh system is generated using 20 inflation layers at the boundaries between the fluid domain and the surface of the battery cells, as well as between the fluid domain and the side wall of the analyzed battery segment. The first inflation layer thickness is calculated for y
+=1 with the following equation:
where
Dh is the hydraulic diameter of the air flow.
In order to reduce the influence of mesh number on the result, the grid independence test was performed by checking the average heat transfer coefficient on the surface of battery cells with refining mesh, until a difference of less than 1% was achieved. The obtained mesh system consisted of about 12.7 million elements (
Figure 5a).
The boundary conditions set in this reference case are the heat flux on the battery cells’ surface of 816 W/m
2 (corresponding to an average of 1 W/cell obtained from
Figure 4c), and the air inlet velocity of 1,268 m/s (corresponding to an air flow for the entire battery pack of 630 m
3/h). The temperature at the inlet was set to 303 K. No-slip was used at the casing surfaces and symmetry was chosen in the middle section of the analyzed battery segment, consisting of two identical rows of battery modules (
Figure 5b,c). The k-ω SST turbulence model was selected in the simulation. The second order upwind scheme is preferred for all conservation equations. The convergence criterion of the residuals was set to 1 × 10
−4, except for the energy equation where it was set to 1 × 10
−6.
Four steady-state simulations were carried out at an air flow of 630 m
3/h, setting the value of battery generated heat at 0.25, 1, 2 and 3 W/cell. As can be seen from
Figure 6, there are significant differences in the heat transfer coefficient on the surface of the battery cells depending on the surface location, the explanation being the restriction of the air flow caused by the segment housing and the wall separations between the modules in the longitudinal direction. The results presented in
Figure 6a,b are from the same simulation, the difference being only the visibility of the battery segment housing.
In order to obtain data related to the local heat transfer coefficient from the cells’ surface, each cell was divided in the post-processing solver into 5 sections of 13 mm in height, which allowed us to differentiate the heat transfer coefficient according to the area on the cells’ surface.
Figure 7 shows an example of dividing the surface of a cell and of a local heat transfer coefficient reading. At the same time, this method also considers the air temperature gradient along the length of a battery cell.
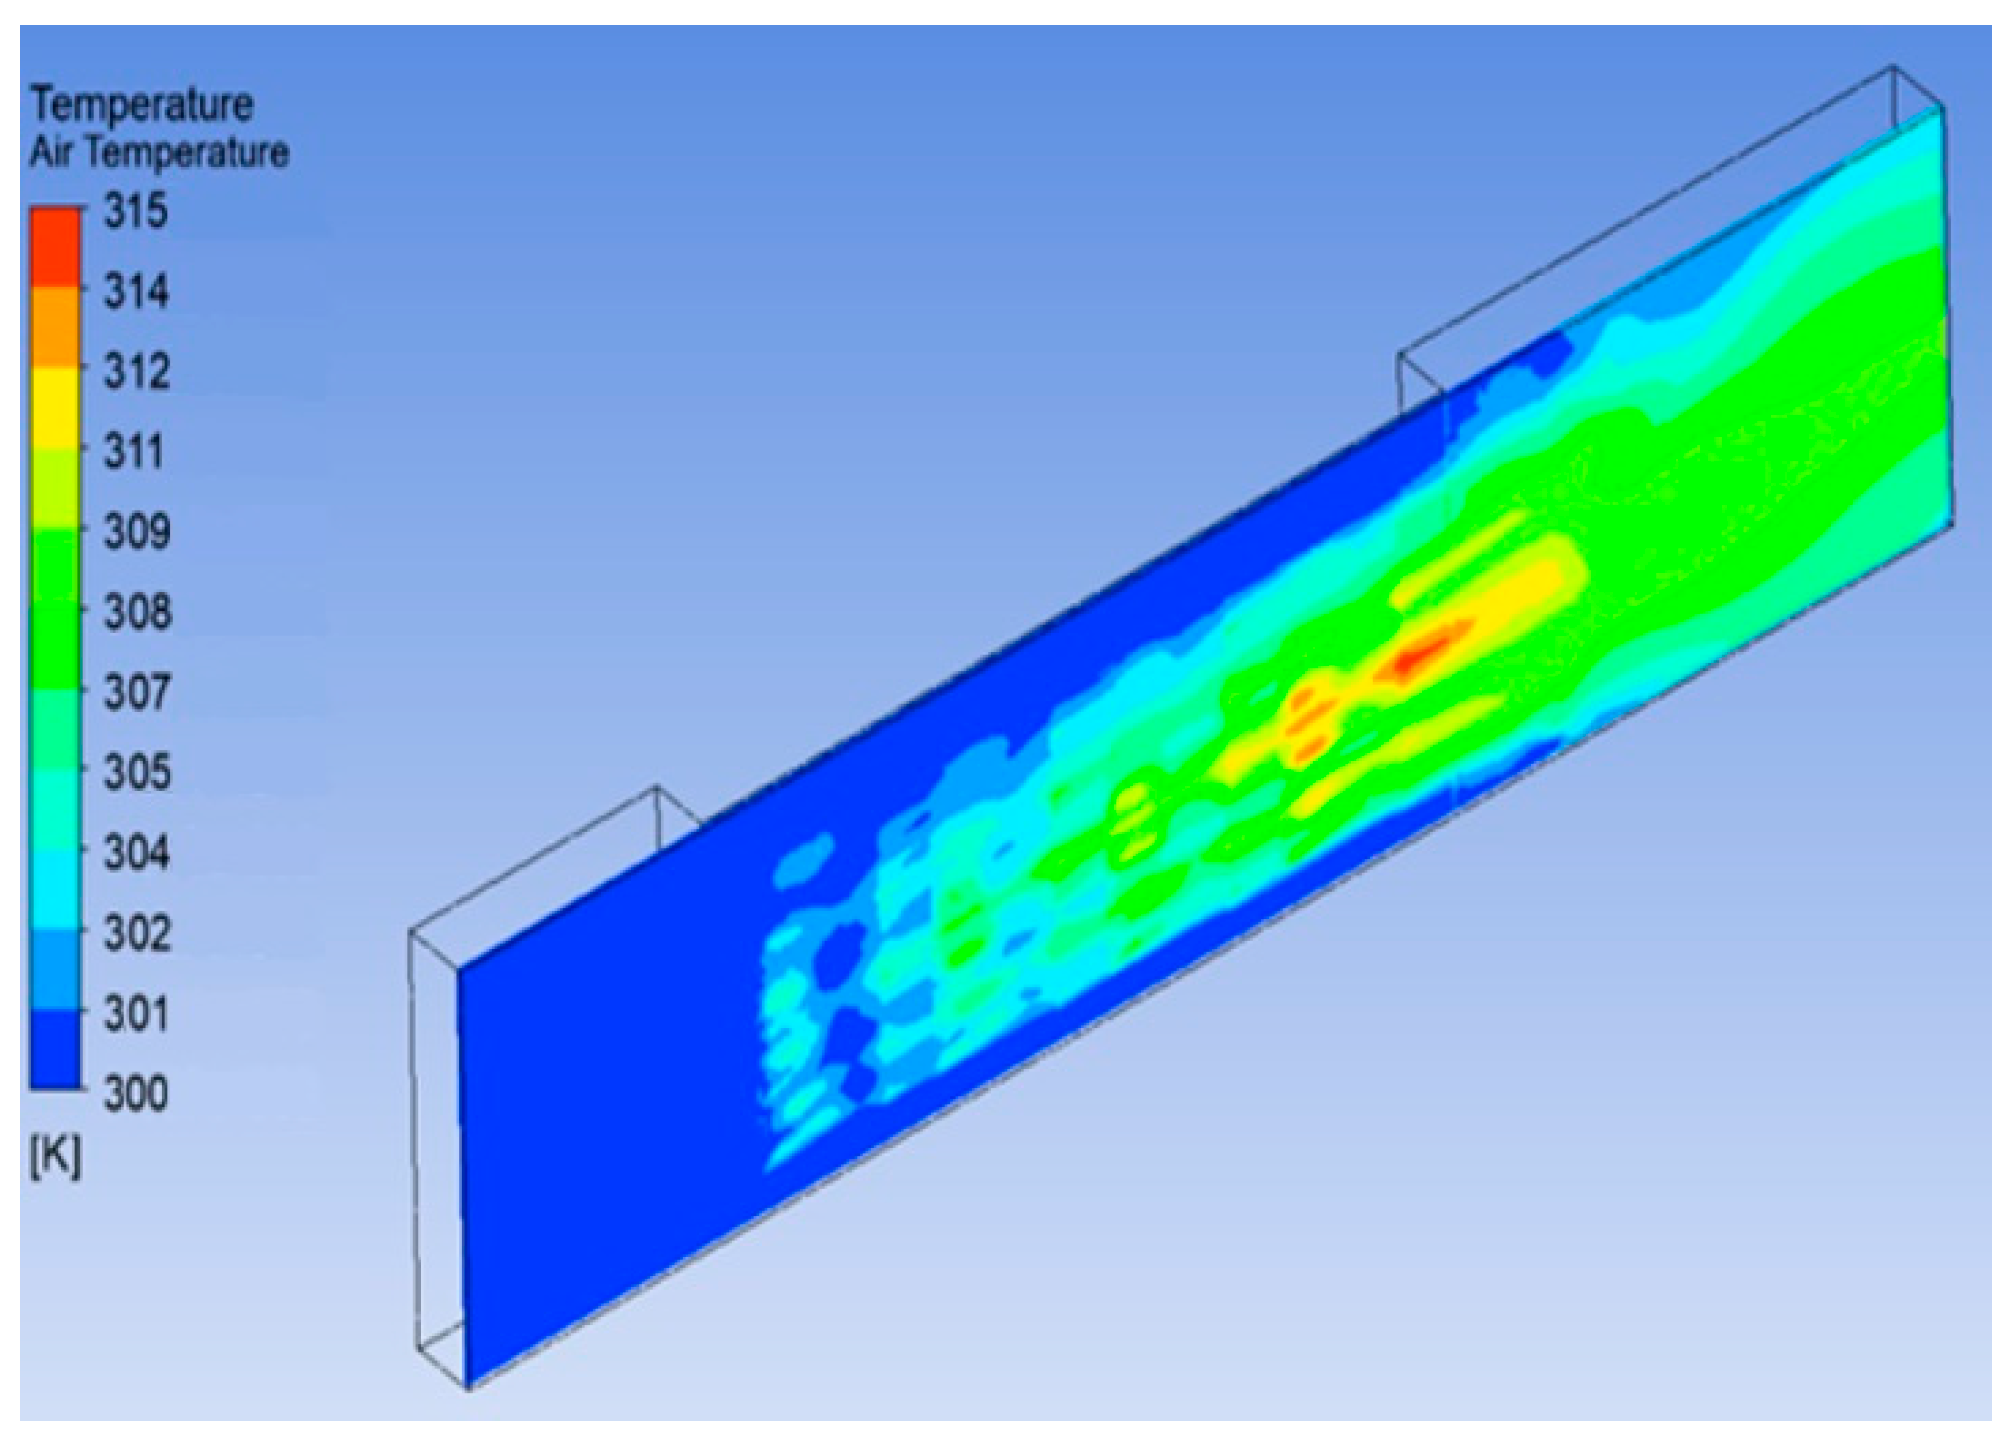
Regarding the differences between consecutive battery modules, a decrease in the coefficient in the air flow’s longitudinal direction is observed, the reason being the increase in air temperature, as can be seen in
Figure 8. By decreasing the temperature difference between the fluid and the cell surface, the heat transfer capacity also decreases, which explains the decreasing values of the coefficient on the battery surfaces.
From the temperature profile, it is observed that in the middle and lower region of the modules, higher air temperatures are registered. The design of the segment housing is such that it partially covers the lowest level cells, as seen in
Figure 6a. This obstructs the access of the cooling air flow to the battery cells and, therefore, the heat transfer is significantly reduced.
Out of the five levels of a module, in 60.6% of cases, the lowest value of the coefficient was recorded on the lowest cell. In order to reduce the computational effort and quantity of data in the following sections of this paper, only the values from the lowest cell’s surfaces are considered, representing the most unfavorable case from a thermal point of view. In
Figure 9 are represented the values of the transfer coefficient obtained from the CFD simulations for the reference flow of 630 m
3/h. In the
i.j notation,
i represents the index of the battery module in the air flow direction (
i = 1 ... 4) and
j represents the index of the divided battery section (
j = 1 ... 5).
2.4. Mathematical Model
The reference mathematical model used for battery convective cooling is shown in
Figure 10. This model analyzes the convective heat transfer in a single transversal section of a battery cell and it has already been used and validated in several research studies [
24,
32,
33,
34,
35,
36,
37].
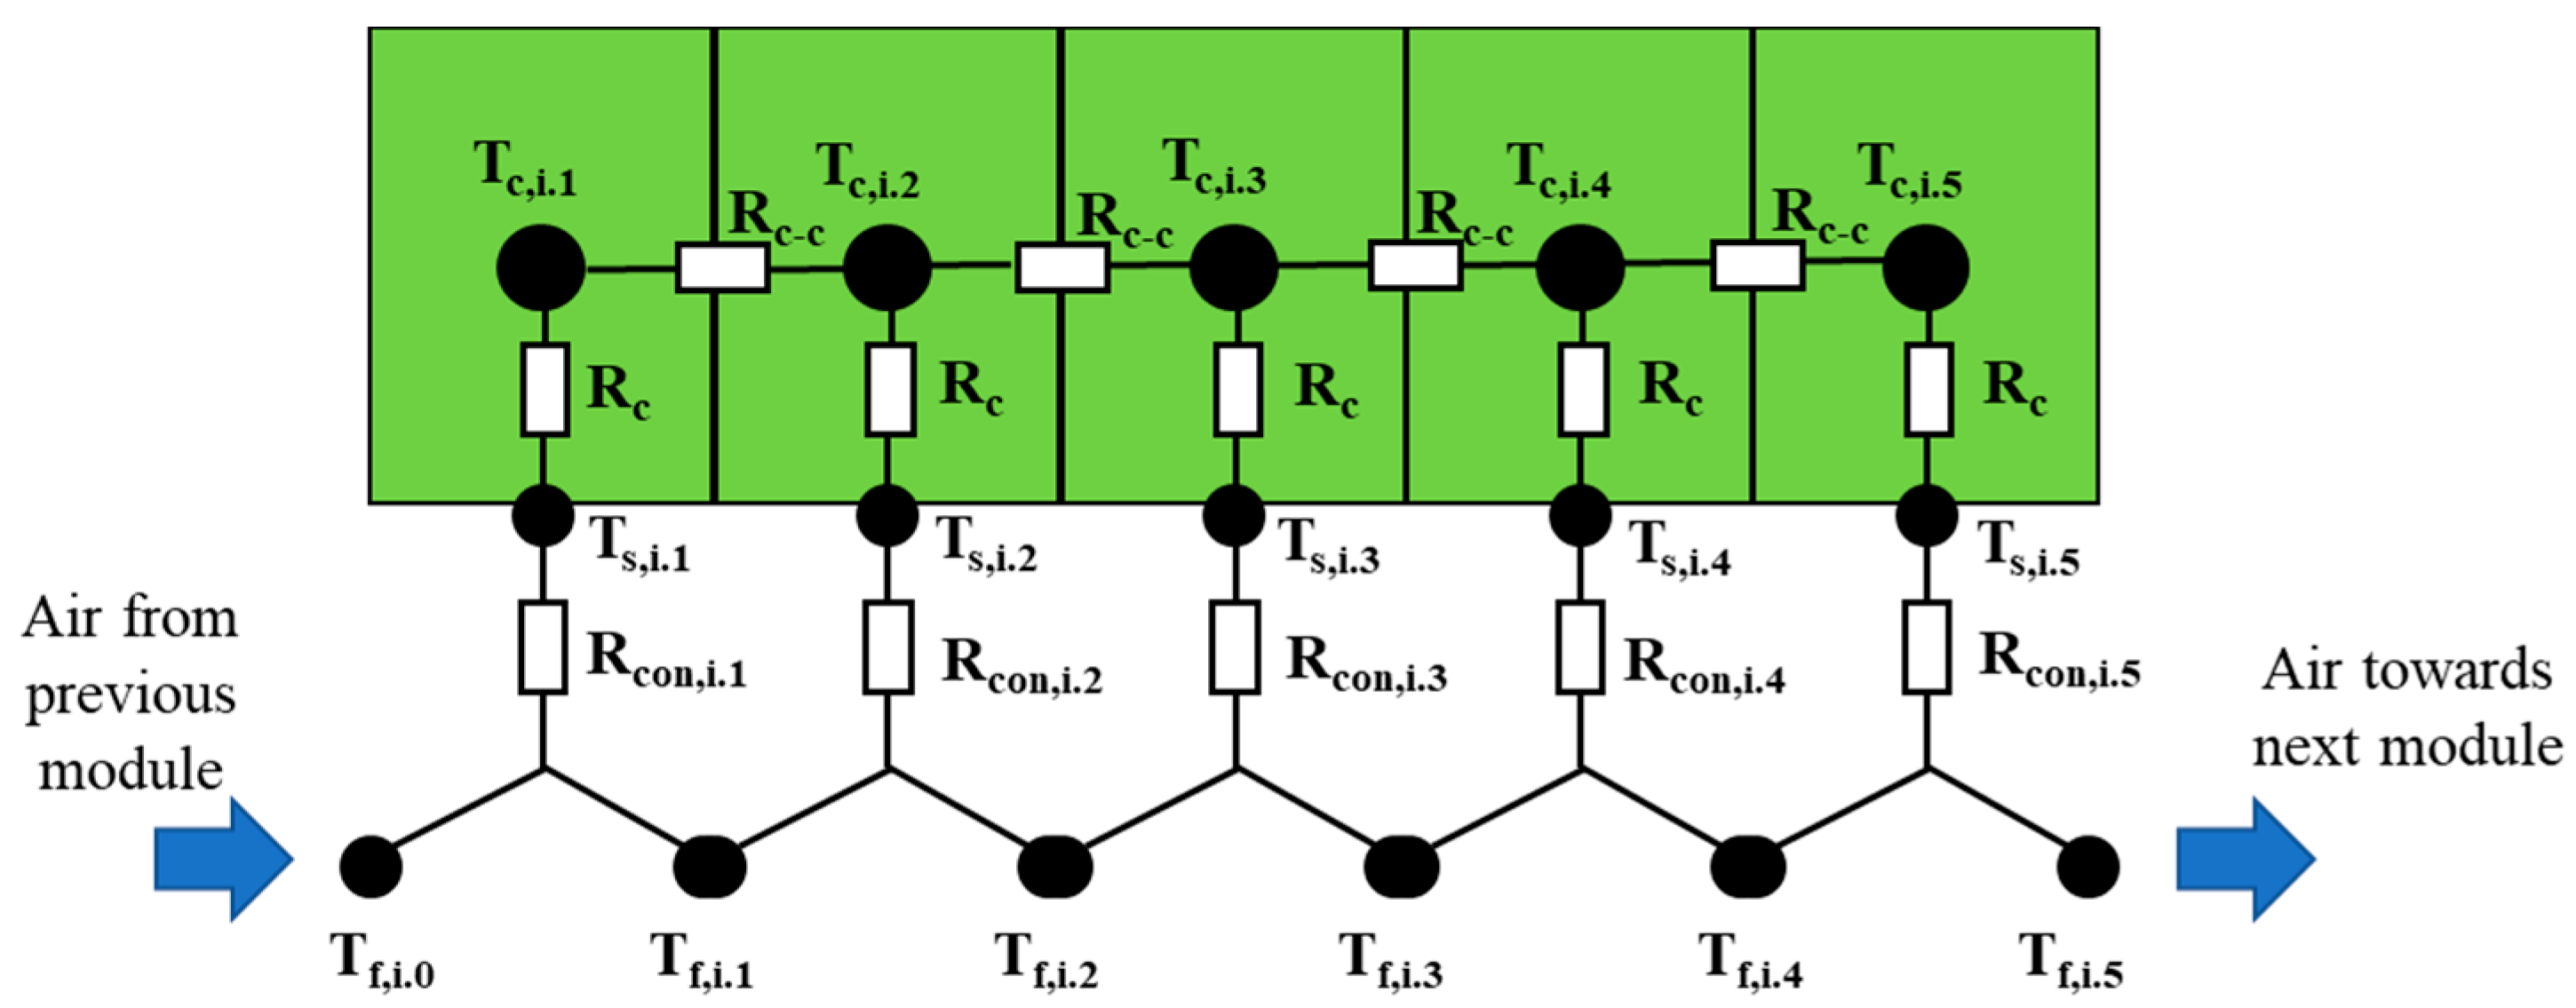
However, such a model is most suitable for cylindrical battery cells in a vertical position. This paper proposes a new mathematical model using a thermal resistance network for cylindrical battery cells placed in a horizontal position, where the thermal characteristics of a battery cell are not considered as a whole, but as an interaction between several sections of the cell.
This approach allows us to consider the differences of convective thermal resistance on different surface areas on the cell, independently of the temperature between different zones inside the cell, according to
Figure 11.
The convective heat transfer rate on a cell’s surface is defined by Equation (4).
The value of convective heat transfer rate depends on the temperature difference between the cell surface and the air (fluid) coming from the previous cell section or the convective thermal resistance, which is calculated based on the convective heat transfer coefficient value obtained from the CFD simulations.
The changes in the temperatures in the core and the surface of the cell or the temperatures of the air are represented by a system of differential equations (Equations (5)–(8). It is observed that the variation in the core temperature is influenced by the heat generated inside the cell and the temperature on the surface. At the same time, given the division of the batteries, the heat transfer by conduction between these sections must be considered, according to
Figure 11.
For the two sections at the end of a cell, Equation (5) is used, where Cc is the battery core heat capacity, Rc is the core thermal resistance in radial direction and Rc-c represents the core thermal resistance in axial direction.
For the other three middle sections, Equation (6) is used:
The variation of the cell surface temperature is influenced by both the core temperature and the temperature of the air that comes into contact with the battery cell, according to Equation (7):
where
Cs is the battery cell surface heat capacity.
Coolant, in this case the air, is heated after passing next to each cell section, with this heating being influenced by the temperature of the cooled surfaces and the flow characteristics, according to Equation (8):
The convective heat transfer resistance, defined in Equation (9), depends on the characteristics of the air flow and the number of transfer units:
The number of transfer units (NTU
), representing the dimensionless size of the heat transfer, is defined according to the convective heat transfer area, the heat transfer coefficient and the air flow characteristics:
where the convection heat transfer coefficient
h is obtained from CFD simulations.
The characteristics of the batteries are considered based on their technical data sheet or the literature [
32,
33,
34,
35,
38,
39,
40] and are presented in
Table 1:
An ambient air temperature of 30 °C is considered, while the initial battery temperature is set to 20 °C.
3. Results
Following the numerical analysis of evaluating the thermal behavior of the considered battery system in transient mode (using the MATLAB/Simulink 1D simulation model), the results are presented in graphical form in
Figure 12,
Figure 13, and
Figure 14. Additionally, the performance of a non-sectioned model is also presented for comparison. In this case, the entire surface of a battery cell is considered as one and there is no conduction inside the cells (as shown in
Figure 10).
It is observed that using the initially estimated air flow, it is not possible to keep the temperature in the cells’ core below the desired value of 50 °C, with the maximum temperature in the last module reaching 51.7 °C, according to
Figure 12. In comparison, when using the non-sectioned model, the maximum temperature is 53.3 °C.
Due to the high temperatures, the re-evaluation of heat transfer coefficients obtained by CFD simulations is necessary. The air flow is increased by 50% and 100%, representing 945 and 1260 m
3/h, and the simulations are run again for all the analyzed heat generation rates. The results illustrated in
Figure 13 represent the values obtained for the reference heat generation of 1 W/cell.
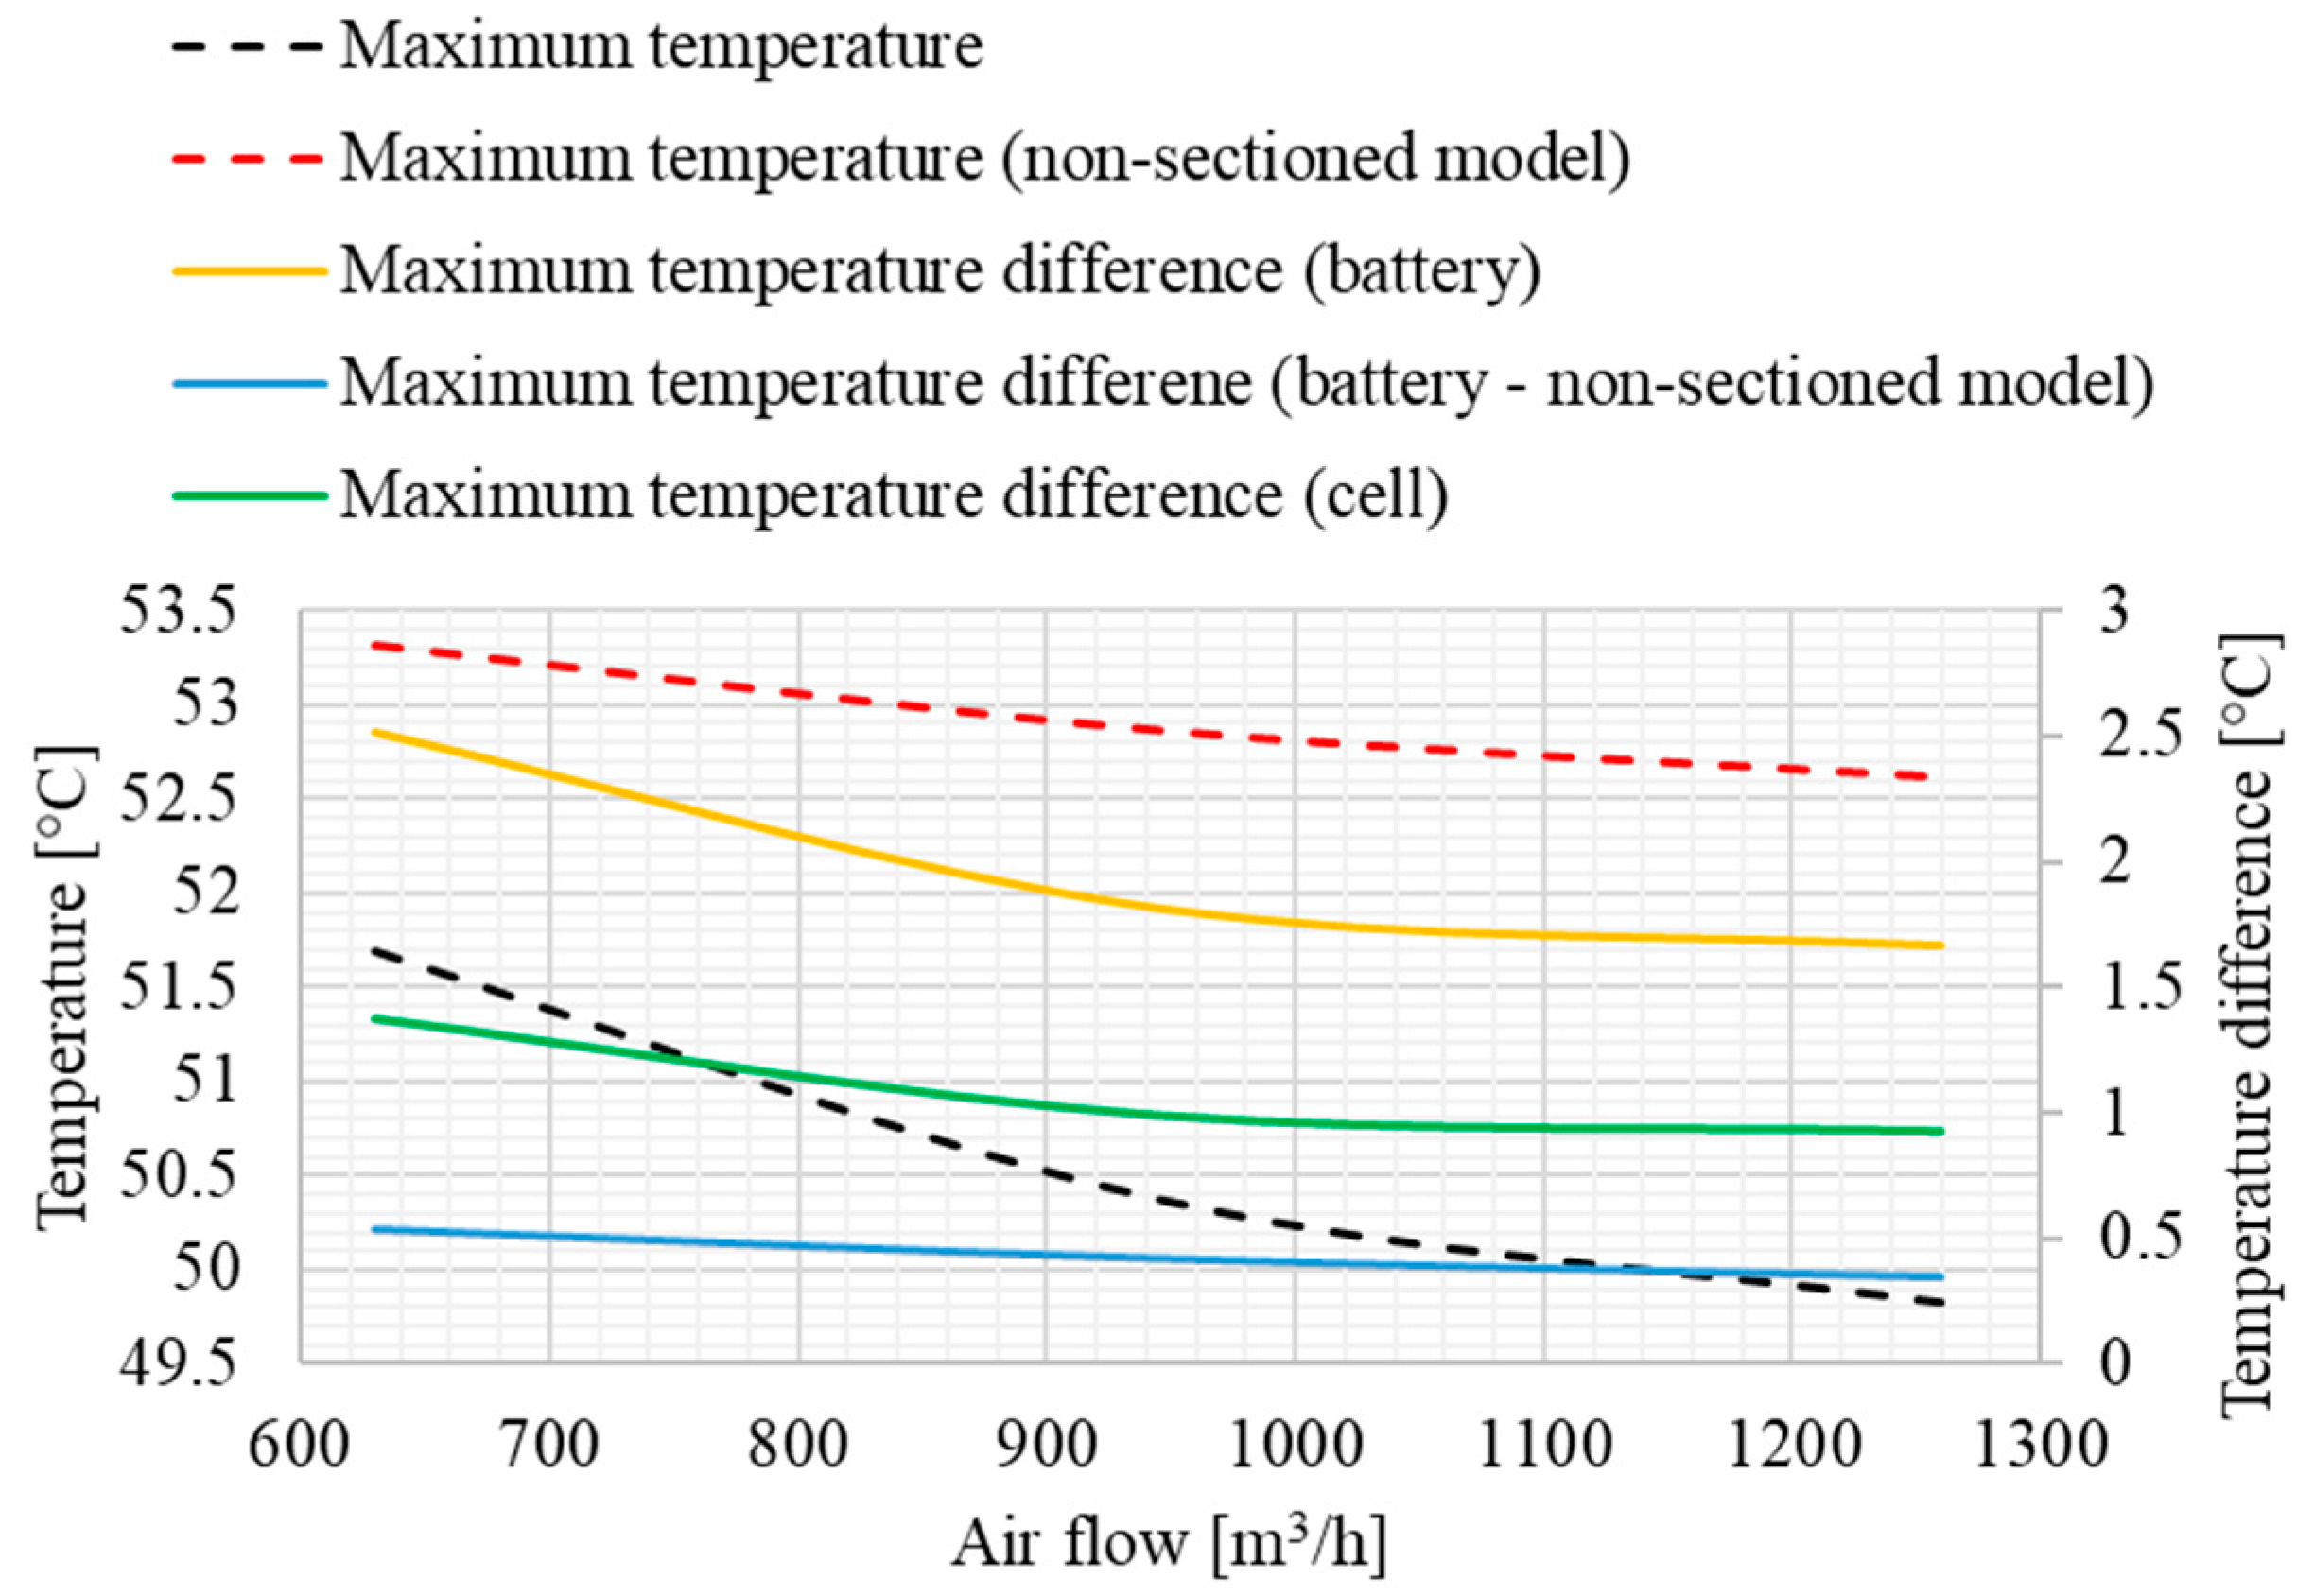
Using these 3D heat transfer maps (h = f(Q
cell, V
air)), the maximum temperature in the analyzed battery segment, the maximum temperature difference in the segment and the maximum temperature difference in a single accumulator are evaluated at the end of the endurance race, and the results are illustrated in
Figure 14.
4. Discussions
It is observed that the modules located at the back of the analyzed battery segment (I = 3, 4) have lower values for heat transfer coefficients, the explanation being the increase in air temperature as it crosses the domain, as seen in
Figure 8. In comparison, the first module has on average 20.4% higher coefficient values than the last module. This causes a lack of uniformity in the temperature distribution inside the segment, with a temperature difference of over 2.5 °C at the end of the 1960 s and a maximum temperature above the desired limit.
In
Figure 9, the general tendency of higher heat transfer coefficient values at the end sections of a cell (
j = 4, 5) can be observed, based on the illustrations seen in
Figure 6. The explanation of this tendency is that the segment housing obstructs the air from cooling the front sections of a cell (
j = 1, 2) and it only starts coming into contact with the accumulators at their middle section. This means that at the front sections of each module’s cells, there is some static air that heats up and therefore considerably reduces the cooling capacity.
When increasing the air flow, the front sections of the cells show a greater improvement in the heat transfer coefficient, according to
Figure 13. On average, doubling the air flow caused an increase in the convective heat transfer coefficient in the first section of the cells by 80.1%, compared to only 21.7% in the last section. This is caused by the higher free stream air velocity, which creates bigger turbulences at each opening in the housing, where the cross-section of the flow suddenly increases. These turbulences help the extraction of static air trapped between the housing and the first section of the cells, therefore significantly increasing the heat transfer coefficient values in this region. Moreover, the differences in coefficient values between the first and last module are reduced to 8.1%.
All these factors enhance the uniformity of temperature distribution inside a cell and inside the whole battery segment as well, which can be seen in
Figure 14. The maximum temperature difference in the analyzed battery segment is reduced from 2.52 °C to 1.67 °C, meaning a reduction of 33.7%, while the maximum temperature difference recorded in a single cell is reduced from 1.37 °C to 0.92 °C, corresponding to a reduction of 32.8%.
The performed simulations show that the minimum air flow necessary to not exceed the temperature limit of 50 °C is 1140 m3/h.
One should also notice the differences between the proposed mathematical model and the non-sectioned one. As illustrated in
Figure 12, the maximum temperatures for the non-sectioned model are 1.5–3 °C higher than for the proposed model. Equations (9) and (10) demonstrate that there is a non-linear relation between heat transfer coefficient and thermal resistance, in a way in which higher heat transfer coefficients have an increasingly bigger impact on the thermal resistance and therefore on the battery cell temperatures. This means that using an average heat transfer coefficient for the entire surface of an accumulator, as presented in the other mentioned studies, will result in higher temperature values. By reading the convective heat transfer coefficients locally, the proposed sectioned mathematical model is able to simulate the cooling of the areas with a good heat transfer capacity. The gain in heat transfer in these areas is more significant than the reduction in cooling capacity in the sections with lower heat transfer coefficient values. Moreover, the mathematical model allows a conductive heat transfer between neighboring sections, which means that part of the heat that cannot be transferred due to a poor convective cooling is passed to another section with a higher cooling capacity.
The same conclusion can be drawn when analyzing
Figure 14. The increasing air flow (and therefore the increasing heat transfer coefficient values) has a less significant impact on both the maximum temperature and the temperature uniformity for the non-sectioned model. When doubling the air flow, the maximum temperature dropped by only 0.7 °C compared to 1.85 °C in the sectioned model. Similarly, the maximum temperature difference in the battery segment is reduced by 0.2 °C compared to 0.85 °C in the proposed model.
Therefore, the higher the heat transfer coefficient values, the bigger the difference between the sectioned and the non-sectioned mathematical model. This gap could become more significant when studying cooling systems with higher cooling capacities, such as an active forced air cooling system (using refrigerated air) or a liquid cooling system, which requires special attention in the procedures of the design and development of a battery’s thermal management system.
5. Conclusions
This article presents a new mathematical model used for the investigation and design of an air-based battery thermal management system. The numerical analysis method using a heat transfer model, proposed by the authors, considers the horizontal positioning of the battery cells in the battery pack and the dynamic behavior of an electric vehicle in conditions of racetrack (Hockenheimring, Germany).
Simulations using CFD software were carried out to evaluate the cooling capacity of the analyzed system, and the cells were divided into five segments for a local reading of heat transfer coefficients. Based on these local coefficients, a sectioned mathematical model is proposed, where each battery cell section individually transfers heat to the cooling fluid and thermal conduction between sections is also taken into account.
The 3D/1D co-simulation highlights the advantages of the proposed mathematical model, including the possibility of evaluating the impact of the local heat transfer coefficient, more precise values regarding the temperature non-uniformity inside the battery pack, the opportunity to calculate temperature differences inside a single battery cell and a better evaluation of the global thermal performance of the BTMS.
Using the non-sectioned mathematical model for the dimensioning of the battery thermal management system can lead to an oversized cooling system, which adds weight and volume and therefore decreases the global efficiency of the vehicle.
The proposed mathematical model can be further improved if the heat generation is not considered as being uniform (e.g., a case considering greater heat generation at the positive electrode of the battery cells). This could also be of interest for batteries placed in a vertical position, while for the ones positioned horizontally, as in this study, a further analysis could be performed regarding the positioning of the positive electrode, with regard to the air flow direction. In such cases, the division of the battery cells and the axial heat conduction could be of greater interest.
As future research and development directions, the proposed methodology and model can also be adapted for liquid cooling analysis or other types of thermal management systems (PCM, heat pipe, thermoelectric cooler, etc.).


