
Changes in Elderberry (Sambucus nigra L.) Juice Concentrate Polyphenols during Storage
by
 ,
,
Cláudia M. B. Neves
1 ,
,
António Pinto
1,2,3,
Fernando Gonçalves
1,3 and
Dulcineia F. Wessel
1,2,4,* 1
Agrarian School of Viseu, Polytechnic Institute of Viseu, 3500-606 Viseu, Portugal
2
CITAB, University of Trás-os-Montes e Alto Douro, 5001-801 Vila Real, Portugal
3
CERNAS-IPV, Agrarian School of Viseu, 3500-606 Viseu, Portugal
4
LAQV-REQUIMTE, Department of Chemistry, University of Aveiro, 3810-193 Aveiro, Portugal
*
Author to whom correspondence should be addressed.
Appl. Sci. 2021, 11(15), 6941; https://doi.org/10.3390/app11156941
Submission received: 13 July 2021
/
Revised: 23 July 2021
/
Accepted: 25 July 2021
/
Published: 28 July 2021
(This article belongs to the Special Issue Celebrating Applied Sciences Reaches 20,000 Articles Milestone: Feature Papers in Applied Biosciences and Bioengineering Section)
Abstract
:Elderberry (Sambucus nigra L.) juice concentrate is highly rich in polyphenols, particularly anthocyanins and flavonols, which have been associated with a wide range of health-promoting properties. Phenolic compounds, in particular anthocyanins, are unstable and may change during storage, which might influence the product color quality and its potential health effects. The aim of this study was to evaluate the changes in the polyphenols profile of elderberry juice concentrate produced at an industrial scale during seven months of storage at 5 °C and at room temperature. The total phenolic content, the total monomeric anthocyanins, the percent polymeric color, and the ABTS•+ scavenging activity were monitored over time. In addition, the profile and content of the main individual phenolic compounds were also assessed by HPLC-DAD. The results show that cyanidin-3-O-sambubioside, cyanidin-3-O-glucoside, cyanidin-3-O-sambubioside-5-O-glucoside, cyanidin-3,5-O-diglucoside, chlorogenic acid, rutin, and quercetin-3-O-glucoside were the main phenolic compounds identified. Storage at room temperature resulted in a strong reduction in total monomeric anthocyanin content accompanied by an increase in percent polymeric color values. Cyanidin-3-O-sambubioside and cyanidin-3-O-glucoside degraded faster than cyanidin-3,5-O-diglucoside and cyanidin-3-O-sambubioside-5-O-glucoside. Concentration of chlorogenic acid also decreased over storage, whereas rutin and quercetin-3-O-glucoside were quite stable. Storage at 5 °C caused a lower impact on the contents of anthocyanins and chlorogenic acid and the percent polymeric color was not affected. The total phenolic content and the in vitro antioxidant activity remained quite similar over the time, for both temperatures, suggesting that elderberry concentrates still preserve their health benefits of antioxidant capacity after seven months of storage.
1. Introduction
Elderberry (Sambucus nigra L.) is a widespread shrub that grows in most parts of Europe and North Africa [1]. It has for a long time been used in folk medicine as a diuretic agent and in the treatment of colds, influenza, and herpes. In recent years, elderberry fruits have received great attention due to the presence of large amounts of anthocyanin pigments and other polyphenols [2,3,4], which are known for their antioxidant activity and health benefits [5,6]. Several studies have shown that elderberries exhibit anti-inflammatory, antiviral, anti-proliferative, anti-diabetic, and immunostimulatory activities [7]. Due to their health-promoting properties and high content of anthocyanin pigments, they are frequently processed to juice concentrate to be used as food colorant, and in pharmaceutical and nutraceutical fields. Some examples of predominant polyphenols that can be found in elderberry juices and concentrates are presented in Figure 1. The main anthocyanins have been identified as cyanidin-3-O-glucoside, cyanidin-3-O-sambubioside, cyanidin-3,5-O-diglucoside, and cyanidin-3-O-sambubioside-5-O-glucoside [8,9,10]. Phenolic acids such as chlorogenic acid and the flavonols quercetin-3-O-glucoside and rutin have also been detected in elderberry juice [11,12].
During storage, the anthocyanins in berry juices may undergo several reactions to form more stable compounds, which typically involve oxidation, polymerization, co-pigmentation with other phenolic compounds, and cleavage reactions [13,14,15]. The cleavage of anthocyanins results in colorless compounds, polymerization is accompanied by browning, and co-pigmentation might result in various colored compounds [16]. The transformation of these compounds influences not only the product color quality and consumer acceptance [17], but also the potential health effects [18].
The main objective of the present work was the evaluation of the effect of storage on the polyphenolic composition of elderberry juice concentrate and the possible consequences on its color pigments and antioxidant capacity. Two elderberry juice concentrates produced at an industrial scale were monitored during seven months of storage at 5 °C and at room temperature.
2. Materials and Methods
2.1. Chemicals
The HPLC standards chlorogenic acid, quercetin, quercetin-3-O-glucoside, and cyanidin-3-O-sambubioside chloride were purchased from Sigma-Aldrich (St. Louis, MO, USA), quercetin-3-O-rutinoside (rutin) and cyanidin-3,5-O-diglucoside chloride from Phytolab (Vestenbergsgreuth, Germany), cyanidin-3-O-sambubioside-5-O-glucoside chloride from Extrasynthese (Lyon, France), and cyanidin-3-O-glucoside chloride from USP (Rockville, MD, USA). Folin–Ciocalteu phenol reagent was acquired from Fisher Scientific (Hampton, NH, USA), and Trolox ((±)-6-hydroxy-2,5,7,8-tetramethylchromane-2-carboxylic acid) and ABTS (2,2-azinobis(3-ethyl-benzothiazoline-6-sulfonic acid) from Sigma-Aldrich. Gallic acid 1-hydrate (99%), aluminum chloride 6-hydrate (pure, pharma grade), sodium carbonate anhydrous, sodium acetate anhydrous, and potassium chloride were obtained from Panreac (Barcelona, Spain) and potassium metabisulfite from LabChem (Zelienople, PA, USA). Methanol, ethanol, and formic acid (analytical grade) were purchased from Fisher Scientific and hydrochloric acid ≥37% from Fluka/Honeywell (Porto Salvo, Portugal). Acetonitrile HPLC far UV gradient grade wasobtained from J.T.Baker (Waltham, MA, USA).
2.2. Equipments
All UV-Vis spectrophotometric measurements were carried out using a Shimadzu UV-1280 (Izasa Scientific, Barcelona, Spain).
Total soluble solids were recorded on an ATAGO digital refractometer (ATAGO USA Inc., Belleuve, WA, USA) and pH values measured on a Consort C1010 multi-parameter pH analyzer (Turnhout, Belgium).
For the HPLC analysis, an Ultimate 3000 HPLC (Dionex, Waltham, MA, USA) equipped with an Ultimate 3000 pump, Ultimate 3000 autosampler, Ultimate 3000 column compartment, and a Thermo Scientific Dionex Ultimate 3000 diode array detector was used.
2.3. Elderberry Juice Concentrate Samples
The elderberry fruits (Sambucus nigra L.) used in the production of juice concentrate were harvested in August 2020 from plants cultivated in Varosa Valley in northern Portugal. The fruits were from three cultivars, “Sabugueira”, “Bastardeira”, and “Sabugueiro”. After harvest, the berries were separated from the branches and crushed in a fruit-processing factory (Régifrutas Company, Tarouca, Portugal). The obtained elderberry mash was immediately transported in isothermal tank trucks at a temperature between −2 and 0 °C to a fruit juice factory (Indumape Company, Pombal, Portugal) where it was processed into juice concentrate. Two samples of juice concentrate (I and II) were collected and sent to the Agrarian School of Viseu where they were stored at −18 °C until use. The technological process to produce the juice concentrates involved the following steps: crushing, mash pressing, depectinization, ultrafiltration, and concentration. The process to obtain concentrate I, in addition to the steps described above, also involved a prior heating step of the mash at 80 °C.
Concentrate I and II were used in the studies of chemical and microbiological stability over time at two different storage temperatures (5 °C and room temperature). For each concentrate, two separate aliquots of 200 mL were transferred under aseptic conditions to sterilized bottles duly identified to remain in the dark, under two different conditions, at room temperature and at 5 °C. For the chemical analyses, “stock solutions” of the concentrates were prepared in ultrapure water (1:25, v:v), hereinafter referred to as Solutions A. For the preparation of these solutions, 4 mL of each sample was measured into a 100 mL flask and dissolved in ultrapure water. Solutions A were kept at 5 °C for analysis, for no more than two days.
2.4. Microbiological Analysis
The groups of microorganisms evaluated were the mesophiles at 30 °C and fungi (mold and yeasts). The enumeration of the mesophiles was carried out by counting colonies in plates, using the culture medium PCA (Plate Count Agar), based on the “Norma Portuguesa” NP 4405:2002 and ISO 4833:2003 standards, using the pour plate technique for inoculation. The enumeration of fungi was carried out by counting colonies, in plates with culture medium of Dichloran Rose-Bengal Agar, with chloramphenicol, based on the ISO 21527-1:2008 standard. The results are expressed in CFU mL−1 (colony-forming units per mL).
2.5. Measurement of Total Soluble Solids
Total soluble solid content in elderberry juice concentrates was determined from Solutions A using a digital refractometer. The auto-zero was carried out with distilled water and each analysis was performed in triplicate. The results were obtained considering the dilution factor used to obtain Solutions A and are expressed as °Brix.
2.6. Total Phenolic Content
The content of total phenolic compounds was determined by the Folin–Ciocalteu method with some modifications [19]. For this analysis, Solutions A were previously diluted with distilled water in the ratio 2:25. To 125 μL of appropriately diluted juice concentrate solution A, or standard solution, 1 mL of distilled water and 125 μL of Folin-Ciocalteu reagent were added. The mixture was homogenized with a vortex and, after a pause of 6 min, 2 mL of 5% sodium carbonate (w/v) was added. The above mixture was homogenized with a vortex and allowed to stand in the dark for 60 min at room temperature. The absorbance of the samples at 760 nm was read in triplicate. The total phenolic content of the juice concentrate samples was determined in triplicate from a standard curve of gallic acid and expressed as g gallic acid equivalents per kg (g GAE kg−1) of concentrate.
2.7. Total Monomeric Anthocyanins Content
The content of total monomeric anthocyanins was determined by the pH differential method according to Giusti and Wrolstad [20]. The appropriate dilution factor (DF) for sample analysis was first defined by diluting the juice concentrate Solutions A with pH 1 potassium chloride buffer to absorbance ˂ 1.2 at λ510 nm. The dilution factor determined was 50. For the analyses, Solutions A were diluted by separately adding the potassium chloride buffer (pH 1) or the potassium acetate buffer (pH 4.5) according to the dilution factor determined above. The mixtures were allowed to equilibrate for 15 min, and the absorbance was read at 510 and 700 nm. The content of total monomeric anthocyanins was determined according to the following equation:
where MW is the molecular mass of cyanidin-3-O-glucoside (449.2 g mol−1), DF is the dilution factor used, ε is the molar absorptivity coefficient of cyanidin-3-O-glucoside (26,900 L mol−1 cm−1), l is optical path length in cm, and A was calculated using Equation (2):
The results are expressed in g cyanidin-3-O-glucoside equivalents per kg (g cy3gluE kg−1) of concentrate.
2.8. Color Density, Polymeric Color, and Percent Polymeric Color
The color density (CD), the polymeric color (PC), and the percent polymeric color (%PC) of the juice concentrates were determined according to Giusti and Wrolstad [20]. Solutions A were diluted in distilled water with the same dilution factor previously used for the quantification of total monomeric anthocyanins. In two test tubes was added 2.8 mL of diluted sample; in one of the tubes was added 0.2 mL of distilled water and in the other was added 0.2 mL of the aqueous potassium metabisulfite solution (200 g L−1). After 15 min, the absorbance was measured at 420, 510, 620, and 700 nm (to correct for haze).
Color density was quantified in samples treated with distilled water and polymeric color in samples with potassium metabisulfite according to Equation (3).
The percent polymeric color of the juices was calculated using the following equation:
2.9. Quantification of Flavan-3-ols
The flavan-3-ol content was determined by the vanillin method according to Sun et al. [21], which consists of the reaction of vanillin with compounds that contain the flavan3-3-ol nucleus in acidic medium. Briefly, the method consisted of the following steps. In test tubes was placed 500 µL of solution A diluted in methanol p.a. grade in the ratio 1:25, or standard to which 1.25 mL of 9 N HCl methanolic solution and then 1.25 mL of 1% vanillin methanolic solution were added. The mixture was homogenized with a vortex and the tubes were placed at 30 °C in the dark for 15 min. The absorbance of the samples at 500 nm was read in triplicate. To avoid the interference of anthocyanins, which, despite not reacting with vanillin, have a maximum absorption at 490–540 nm in an acidic medium, which coincides with that of the colored product of the vanillin method, in parallel, blank tests were prepared replacing the vanillin solution with an equal volume of methanol. Flavan-3-ol content was expressed as g of epicatechin equivalents per kg (g EpiE kg−1) of concentrate, using a standard curve of epicatechin.
2.10. Quantification of Flavonols
The flavonol content was determined according to a spectrophotometric method based on the formation of aluminum–flavonoid complex [22]. In test tubes, 1 mL of solution A diluted 1:10 in methanol p.a. grade or standard, 0.5 mL of distilled water and 0.5 mL of 2% aluminum chloride aqueous solution were placed. The mixtures were homogenized with a vortex and the formation of a yellow complex was observed. The samples were left in the dark for 10 min at room temperature and the absorbance at 425 nm was read in triplicate. The flavonol content was expressed as g quercetin equivalents per kg (g QE kg−1) of concentrate, using a standard curve of quercetin.
2.11. Determination of Antioxidant Activity
The antioxidant activity of elderberry juice concentrate was assessed by the ABTS•+ scavenging method, according to Ozgen et al. [23]. ABTS•+ was prepared by dilution of ABTS to a final concentration of 7 mM with 2.45 mM of aqueous potassium persulfate solution. This mixture was allowed to stand at room temperature in the dark for 12–16 h and then was stored at −18 °C until use. On the day of analysis, the ABTS•+ solution was diluted with ethanol to an absorbance of 0.700 at 734 nm. Assays were conducted by mixing 2 mL of the prepared ABTS•+ solution with 100 µL of solution A previously diluted 1:100 in distilled water. After 15 min in the dark at room temperature, the absorbance of the samples at 734 nm was measured in triplicate. Simultaneously, a blank solution was prepared by replacing the 100 µL of sample with distilled water. The percent inhibition of ABTS•+ was determined according to Equation (5).
The antioxidant activity of the juice concentrates was expressed in mmol Trolox equivalents per kg (mmol TE kg−1) of concentrate, using a Trolox calibration curve.
2.12. HPLC-DAD Analysis and Quantification of Polyphenols
The polyphenol profile of elderberry juice concentrates was analyzed by reversed phase HPLC. Samples A were diluted in 5% (v/v) formic acid in ultrapure water (0.2 mL of sample in a final volume of 1.5 mL) and filtered through a syringe filter before analysis (0.2 µm nylon membrane filter, Whatman, Amadora, Portugal). The compounds were separated on a Macherey-Nagel C18 Nucleodur column, 250 mm of length, 4 mm of internal diameter, and 5 µm particle size, using as eluent A 5% (v/v) formic acid in ultrapure water and as eluent B acetonitrile, a flow rate of 1 mL min−1, and column temperature stabilized at 25 °C, according to the following gradient elution program: 0–10 min—5% B; 10–20 min—20% B; 20–27 min—20% B; 27–37 min—70% B; 37–45 min—70% B; 45–55 min—5% B; 55–65 min—5% B. The eluents were prepared daily and filtered through a 0.22 µm nylon membrane filter (Filter-Lab). The UV-Vis detection was performed at wavelengths between 190 and 800 nm and the injection volume was 20 µL. Instrument control and data acquisition were performed using the software Chromeleon version 6.80 (Dionex, Sunnyvale, CA, USA). Compounds were identified according to the retention times of the peaks and their UV-Vis spectra, in comparison with those of commercial standards.
The quantification of the polyphenolic compounds was carried out using a calibration curve in the range of 2.5–13.0 mg L−1 for chlorogenic acid, 4.0–24.0 mg L−1 for cyanidin-3-O-glucoside, 4.0–44.0 mg L−1 for cyanidin-3-O-sambubioside, 4.0–44.0 mg L−1 for cyanidin-3-O-sambubioside-5-O-glucoside, 1.0–22.0 mg L−1 for quercetin-3-glucoside, and 2.5–28.0 mg L−1 for rutin. The results are presented in g kg−1 of concentrate. Cyanidin-3-O-sambubioside-5-O-glucoside and cyanidin-3,5-O-diglucoside were quantified as the sum of the two compounds, since they appear at the same retention time, and are expressed as g cyanidin-3-O-sambubioside-5-O-glucoside per kg.
3. Results and Discussion
3.1. Characterization of the Initial Eldeberry Concentrates
The concentrates were obtained by an industrial process that involved crushing, mash pressing, depectinization, ultrafiltration, and concentration. The production of concentrate I, in addition to the steps described above, also involved a thermal treatment of the mash at 80 °C, prior to pressing. The main objective of this step is the inactivation of oxidoreductases such as polyphenol oxidase and peroxidase, which are assumed to be involved in the degradation of anthocyanins [24,25]. Some chemical characteristics of the elderberry juice concentrates before storage are presented in Table 1.
Concentrate I and concentrate II presented an average content of total soluble solids of 55.8 and 80.6 °Brix, respectively. Concentrate II contained 54.7 g GAE kg−1 of total phenolic compounds, 15.8 g kg−1 of total monomeric anthocyanins, 4.8 g QE kg−1 of flavonols, and 1.5 g EpiE kg−1 of flavan-3-ols. The ratio between the concentrates in all these parameters was around 1.5, which indicates that concentrate II is 1.5-fold more concentrated compared to concentrate I. Therefore, for these analyzed parameters, the lower contents observed in concentrate I are explained by the concentration process, which results in different values of °Brix, and are not related to the heating treatment. The results obtained allow us to infer that the initial juices have similar phenolic characteristics. The percentage of polymeric color (%PC) was also similar; 26.2 ± 1.6% and 28.3 ± 1.2% for concentrate I and concentrate II, respectively. These values of %PC are within the expected values for fruit juices that have been subjected to industrial processing [20]. The concentrates I and II showed an ABTS•+ antioxidant activity equal to 352.3 and 455.0 mmol TE kg−1, respectively. The ratio between these values reveals the same trend observed for the content of phenolic compounds, where juice II is about 1.5 times more concentrated. Overall, the values presented in Table 1 are in agreement with those obtained by Bermúdez-Soto and Tomás-Barberán [9] for elderberry concentrate.
The most important phenolic compounds in the two concentrates were identified and quantified by HPLC-DAD. The concentrations of the phenolic compounds identified are presented in Table 2.
The phenolic profile was similar in the two concentrates. As an example, the chromatograms of the concentrate I before storage are shown in Figure 2a,b.
In the chromatogram at 325 nm, the peak at about 18.0 min (1) was identified as chlorogenic acid and the peaks at 24.8 (5) and 25.9 min (6) as rutin and quercetin-3-O-glucoside, respectively. In the chromatogram at 520 nm, three peaks corresponding to anthocyanins can be observed. The peaks at 20.1 (3) and 20.3 min (4) were identified as cyanidin-3-O-sambubioside and cyanidin-3-O-glucoside, respectively. Cyanidin-3-O-sambubioside and cyanidin-3-O-glucoside corresponded, respectively, to around 33% and 20% of the total individual anthocyanins in both concentrates. Cyanidin-3-O-sambubioside-5-O-glucoside and cyanidin-3,5-O-diglucoside are other anthocyanins described to be present in high amounts in elderberries and elderberry products [3,8,9,12,26]. The peak at 18.2 min (2) was attributed to these two anthocyanins that eluted at the same retention time and appeared overlaid. Therefore, they were quantified together, the result being expressed in g of cyanidin-3-O-sambubioside-5-O-glucoside equivalents per kg. The sum of cyanidin-3-O-sambubioside-5-O-glucoside and cyanidin-3,5-O-diglucoside accounted for 45% of the total analyzed anthocyanins. The total anthocyanins content determined by HPLC was 9.68 and 14.04 g kg−1, for concentrate I and II, respectively, which is slightly lower than the total monomeric anthocyanins obtained using the pH differential method (Table 1). These differences may be explained by the presence of some compounds that were not quantified by HPLC.
3.2. Effect of Storage on Total Phenolic Content, Total Monomeric Anthocyanins, Percent Polymeric Color, and Antioxidant Activity
The changes in total phenolic content (TPC), total monomeric anthocyanins (TMA), percentage of polymeric color (%PC), and antioxidant activity (AA) were evaluated during storage at 5 °C and at room temperature (Figure 3).
After seven months of storage at 5 °C, the content of total monomeric anthocyanins decreased from 10.6 to 8.2 g cy3gluE kg−1 in concentrate I and from 15.8 to 13.5 g cy3gluE kg−1 in concentrate II, representing losses of 22% and 14%, respectively. Moreover, storage at room temperature resulted in a strong reduction in total monomeric anthocyanins in both concentrates. After the same seven months, their content was 3.5 g cy3gluE kg−1 in concentrate I and 4.6 g cy3gluE kg−1 in concentrate II, corresponding to losses of 67% and 71%. These results demonstrate the greater stability of monomeric anthocyanins at lower temperatures, which is in accordance with studies conducted by Buckow et al. [27] in which they observed that degradation of anthocyanins in blueberry juices was significantly accelerated with increasing storage temperatures. At the same time, the percentage of polymeric color was slightly affected at 5 °C for both juices, while at room temperature increased from 26.2% to 43.0% in concentrate I and from 28.3% to 47.9% in concentrate II. Similar observations were made by Brownmiller et al. [28] in blueberry juices with 64–68% losses of anthocyanins after six months of storage at 25 °C accompanied by a linear increase in percent polymeric color values. In addition, losses up to 75% in monomeric anthocyanins and a marked increase in percent polymeric color in blackberry [29] and in raspberry juices [30] after six months of storage at 25 °C were reported. Our results are also consistent with the kinetic studies developed by Casati et al. [31] that predict a reduction of 50% of the monomeric anthocyanins in elderberry juice after 120 days of storage at 25 °C.
The total phenolic content of the juice concentrates measured by the Folin–Ciocalteu method, whether stored at room temperature or at refrigerated temperature, does not follow the decrease in total monomeric anthocyanin content, and small variations over time were observed. The higher stability observed in the total phenolic content may be explained by the formation of polymerized phenolic compounds that are detected by the Folin–Ciocalteu method [32]. This hypothesis is corroborated by the increase in the percent polymeric color. In fact, the decrease in monomeric anthocyanins content and the increase in percent polymeric color indicates that anthocyanins were transformed into polymeric compounds. For total phenolic compounds, after seven months of storage losses of about 13% and 14% were obtained for concentrate I and 10% and 8% of losses were found for concentrate II, at room temperature and at 5 °C, respectively. The results demonstrate that the total phenolic content is not much affected by the storage temperature, contrary to what happens with the monomeric anthocyanin content. The antioxidant activity, in general, follows the same profile of variation of total phenolic content and remained approximately stable over the seven months of storage despite the losses of total monomeric anthocyanins (Figure 3). Other authors [28,31] have shown no significant changes in antioxidant capacity of juices during storage, despite a marked loss of anthocyanins. This may be related to the presence of polymeric compounds which have been associated with antioxidant capacity [33].
3.3. Effect of Storage on Individual Phenolic Compounds
The content of individual phenolic compounds in the juice concentrates was followed by HPLC-DAD over the seven months of storage. The chromatograms of concentrate I after seven months of storage are presented in Figure 2c–f. A decrease in the areas of anthocyanin peaks at refrigerated temperature and an almost disappearance of anthocyanin peaks at room temperature were observed.
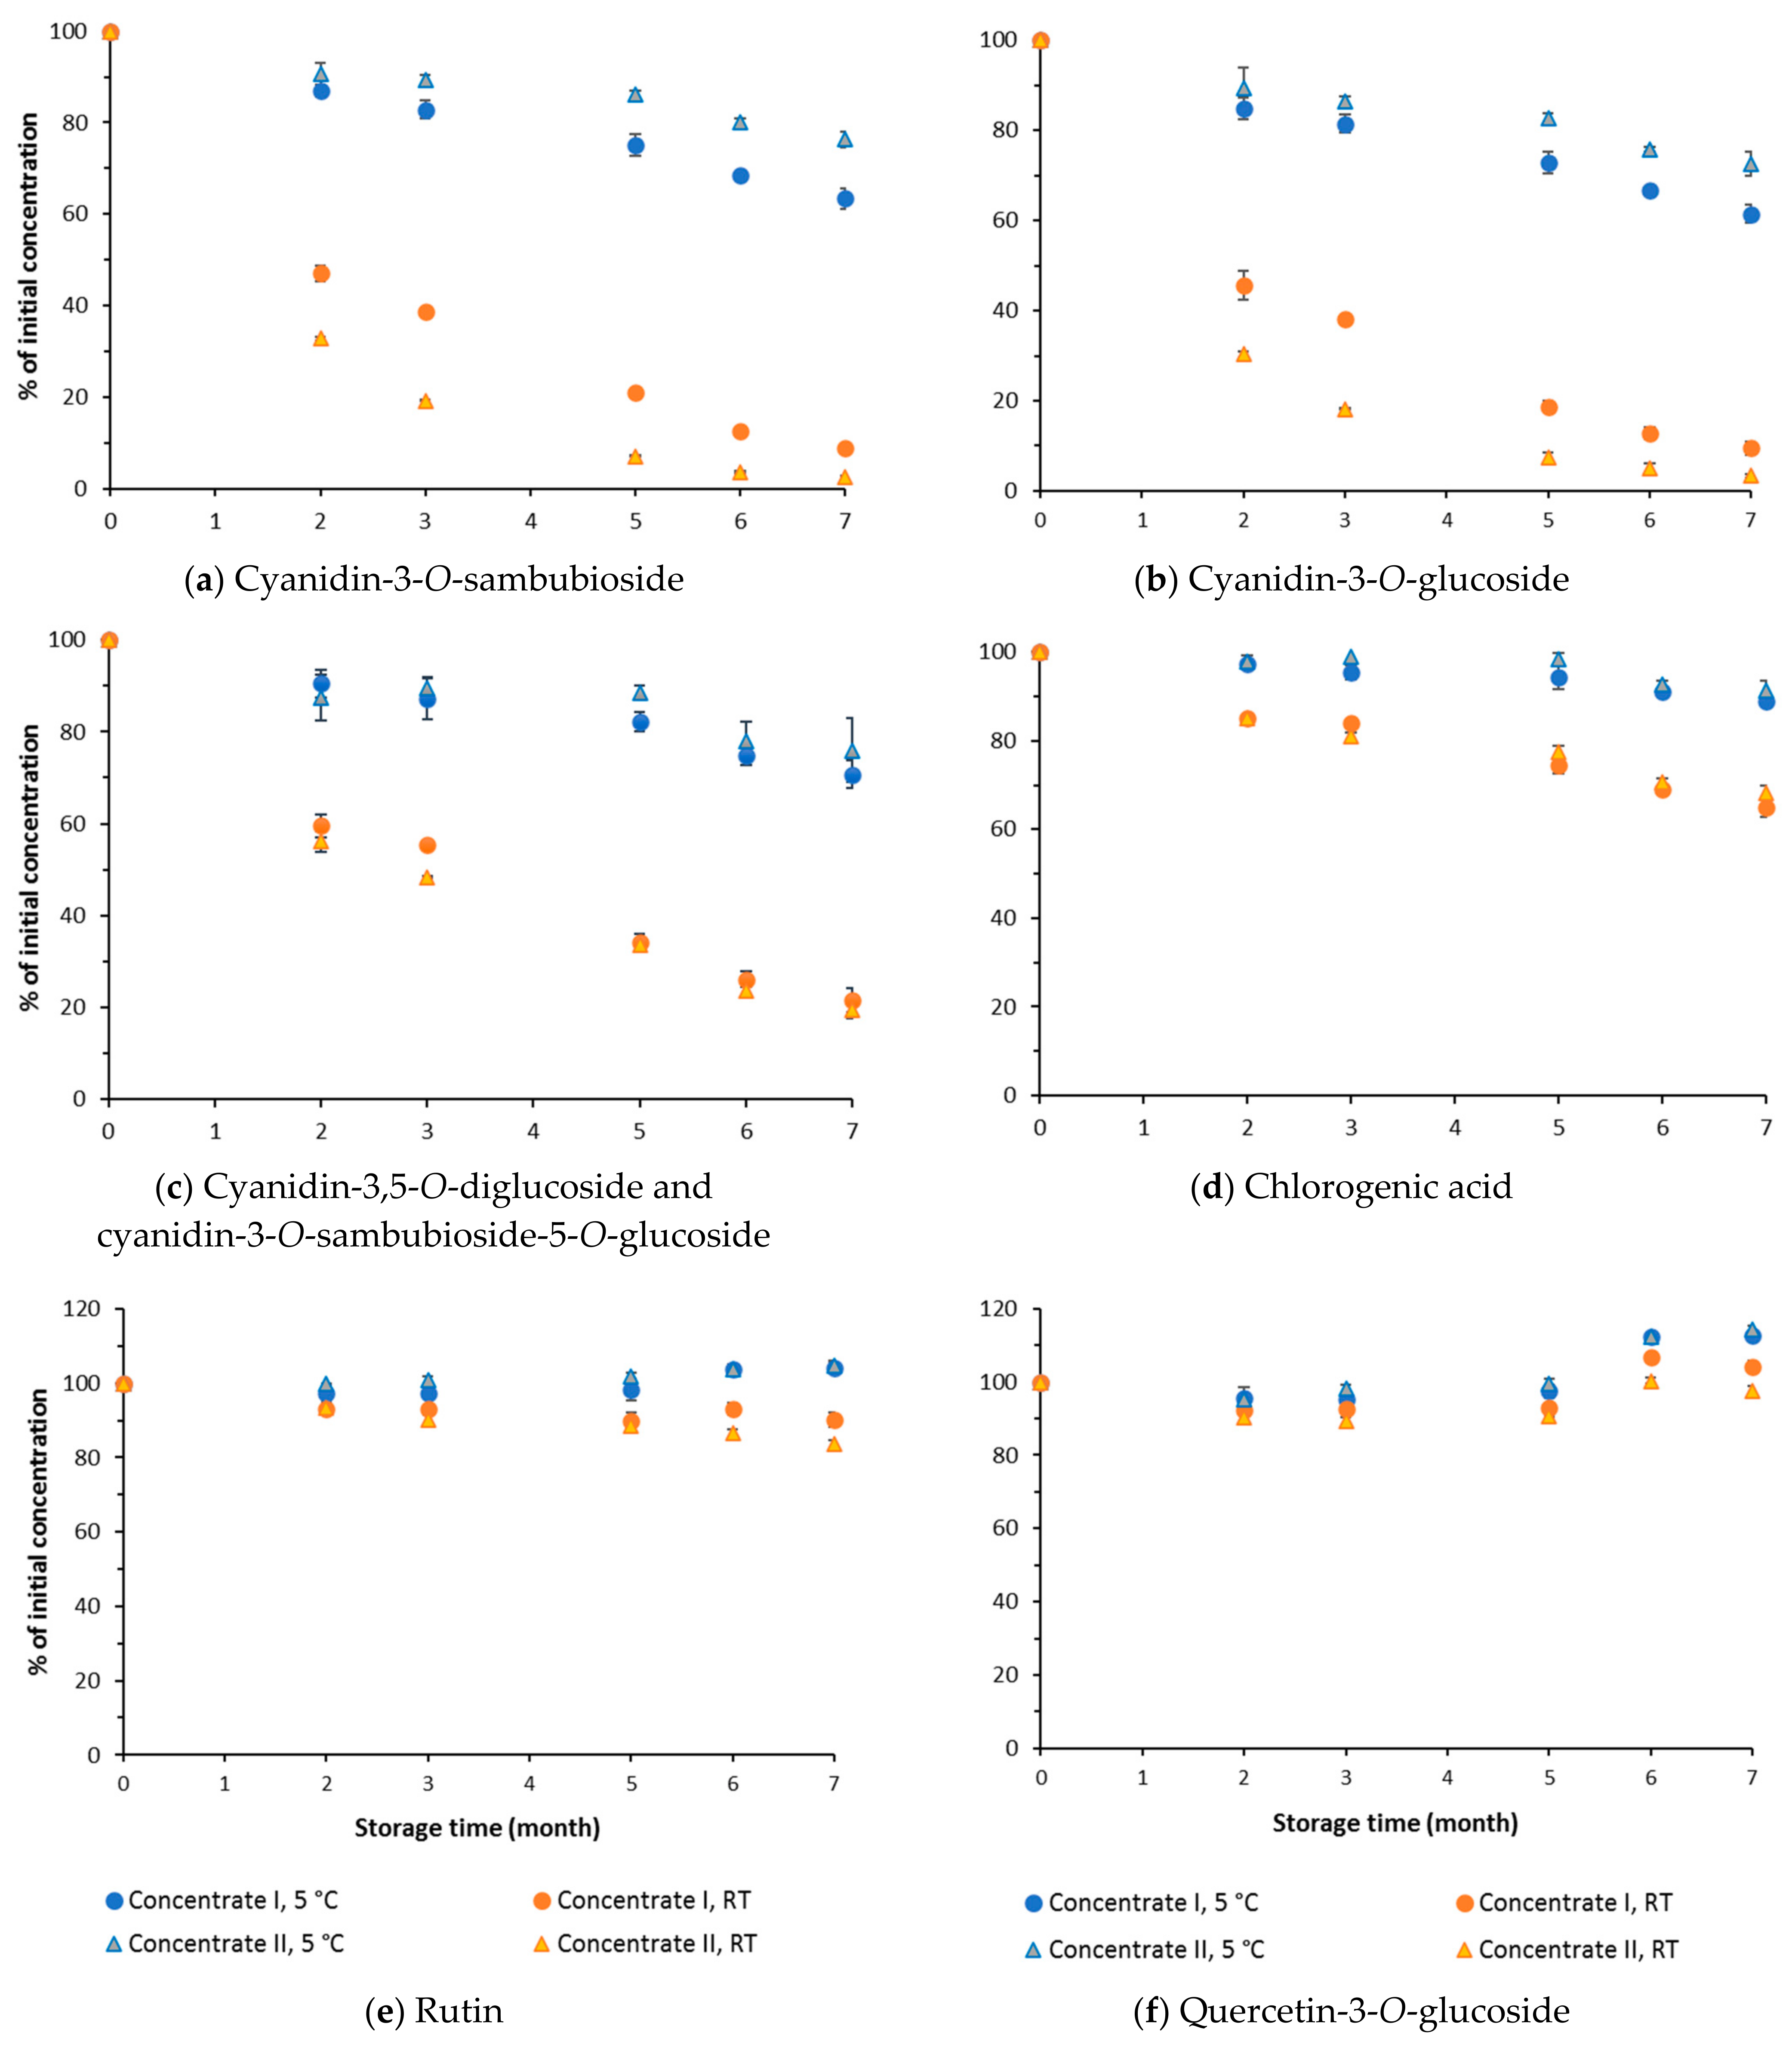
Figure 4 shows the evolution of the content of individual phenolic compounds in concentrate I and concentrate II over storage.
After seven months, at 5 °C the concentrates presented a composition of anthocyanins that represented 61–76% of the initial concentration, while for room temperature, the values represented 3–21%—Figure 4a–c. Chlorogenic acid showed a slight decrease around 10% over the time—Figure 4d, and the amount of rutin and quercetin-3-O-glucoside remained quite stable, with a tendency to increase after five months—Figure 4e,f.
For both concentrate I and concentrate II there is a marked loss of anthocyanin content at room temperature over the storage time—Figure 4a–c. Degradation was more pronounced for cyanidin-3-O-sambubioside and cyanidin-3-O-glucoside—Figure 4a,b, respectively—than for cyanidin-3,5-O-diglucoside and cyanidin-3-O-sambubioside-5-O-glucoside—Figure 4c. In the case of concentrate I, after seven months of storage at room temperature, 21.5% of the initial concentration of cyanidin-3,5-O-diglucoside + cyanidin-3-O-sambubioside-5-O-glucoside was found, whereas only 9.0% of cyanidin-3-O-sambubioside and 9.5% of cyanidin-3-O-glucoside were maintained. A similar result was obtained for concentrate II with retained concentrations of 19.4%, 2.5%, and 3.4%, respectively for cyanidin-3,5-O-diglucoside + cyanidin-3-O-sambubioside-5-O-glucoside, cyanidin-3-O-sambubioside, and cyanidin-3-O-glucoside, respectively. It has been described that anthocyanins’ stability is influenced by the glycosylation site, and by the type and number of glycosyl moieties attached [34]. Our findings are in line with other studies that showed lower stability of 3-O-glycosides compared to the 3,5-O-diglycosides counterparts [35,36]. The lower stability of 3-O-glycosides can be explained by the mesomeric effect of the hydroxyl group at C-5 position that favors the electrophilic attack at C-6 and C-8 positions. The glycosyl substitution at C-5 reduces the nucleophilicity of C-6 and C-8 positions which makes 3,5-O-diglycosides more stable to electrophilic attack [37].
The contents of chlorogenic acid also decreased substantially during storage at room temperature in both concentrates. After seven months, 65.0% and 68.4% of its initial concentration was obtained for concentrate I and II, respectively. This indicates a possible involvement of chlorogenic acid in anthocyanins polymerization, which agrees with the observations of other authors [24].
In the present study, concentrate II, with about 80.6 °Brix, showed a faster degradation of some compounds at room temperature when compared with concentrate I, which had 55.8 °Brix. For instance, after three months of storage, concentrate I presented 39% of the initial concentration of cyanidin-3-O-sambubioside, while in concentrate II only 19% was retained. A similar result was obtained for cyanidin-3-O-glucoside. Conversely, Kirca et al. [38] showed that the degradation of monomeric anthocyanins in black carrot juice decreased with increasing soluble solid content during storage at 20 °C. It should be noted that concentrate II was not subjected to the heat treatment at the initial stage of processing and the native enzymes may be present in concentrate II, favoring the polymerization reactions between anthocyanins and other phenolic compounds. In addition, after five months at room temperature, concentrate II presented higher microbial activity than concentrate I (Table 3), which may be another reason for the greater degradation of the compounds. In the storage at refrigerated temperature, concentrate I and concentrate II showed low microbial growth and, in this case, the stability of anthocyanins was similar in both concentrates.
4. Conclusions
The storage at low temperature (5 °C) was shown to be important to minimize anthocyanin degradation and maintain the color attributes of elderberry juice concentrates. At 5 °C there was a loss of 22% and 14% (concentrate I and II) in total monomeric anthocyanins, while at room temperature, losses of 67% and 71% were observed. At the same time, the percent polymeric color increased, especially at room temperature, which indicates that anthocyanins may be involved in polymerization reactions. The analysis of individual phenolic compounds showed that cyanidin-3-O-sambubioside and cyanidin-3-O-glucoside degraded in higher proportion than cyanidin-3,5-O-diglucoside and cyanidin-3-O-sambubioside-5-O-glucoside. At room temperature, cyanidin-3-O-sambubioside and cyanidin-3-O-glucoside degraded faster in the concentrate that was not subjected to the additional heating step during the technological processing. Thus, the thermal treatment of the mash at 80 °C prior to pressing appears to have a beneficial effect on the conservation of anthocyanins during storage at room temperature.
The total phenolic content and the in vitro ABTS•+ antioxidant capacity were relatively stable over storage, suggesting that elderberry concentrates may still preserve their health benefits after seven months of storage.
Author Contributions
Conceptualization, C.M.B.N., A.P., F.G. and D.F.W.; methodology, C.M.B.N., A.P. and D.F.W.; investigation, C.M.B.N., F.G. and D.F.W.; writing—original draft preparation, C.M.B.N.; writing—review and editing, A.P., F.G. and D.F.W.; supervision, D.F.W. All authors have read and agreed to the published version of the manuscript.
Funding
This research was funded by the FEDER, within the PT2020 Partnership Agreement and Compete 2020, grant number POCI-01-0247-FEDER-033558.
Institutional Review Board Statement
Not applicable.
Informed Consent Statement
Not applicable.
Acknowledgments
Thanks are due to the Polytechnic Institute of Viseu and to FCT/MEC for the financial support to CERNAS-IPV, LAQV-REQUIMTE (UIDB/50006/2020) and CITAB (UIDB/04033/2020) research units, through national funds, and the co-funding by the FEDER, within the PT2020 Partnership Agreement and Compete 2020. The authors thank the financial support of the Project BagaConValor—Criação de valor no processo tecnológico de produção de sumo concentrado de baga de sabugueiro (POCI-01-0247-FEDER-033558).
Conflicts of Interest
The authors declare no conflict of interest.
References
- Schmitzer, V.; Veberic, R.; Stampar, F. European elderberry (Sambucus nigra L.) and American Elderberry (Sambucus canadensis L.): Botanical, chemical and health properties of flowers, berries and their products. In Berries: Properties, Consumption and Nutrition; Tuberoso, C., Ed.; Nova Science Publishers Inc.: New York, NY, USA, 2012; ISBN 9781614702573. [Google Scholar]
- Lee, J.; Finn, C.E. Anthocyanins and Other Polyphenolics in American Elderberry (Sambucus Canadensis) and European Elderberry (S. nigra) Cultivars. J. Sci. Food Agric. 2007, 87, 2665–2675. [Google Scholar] [CrossRef] [PubMed] [Green Version]
- Veberic, R.; Jakopic, J.; Stampar, F.; Schmitzer, V. European Elderberry (Sambucus nigra L.) Rich in Sugars, Organic Acids, Anthocyanins and Selected Polyphenols. Food Chem. 2009, 114, 511–515. [Google Scholar] [CrossRef]
- Ferreira, S.S.; Silva, P.; Silva, A.M.; Nunes, F.M. Effect of Harvesting Year and Elderberry Cultivar on the Chemical Composition and Potential Bioactivity: A Three-Year Study. Food Chem. 2020, 302, 125366. [Google Scholar] [CrossRef] [PubMed]
- Sidor, A.; Gramza-Michałowska, A. Advanced Research on the Antioxidant and Health Benefit of Elderberry (Sambucus nigra) in Food—A Review. J. Funct. Foods 2015, 18, 941–958. [Google Scholar] [CrossRef]
- Przybylska-Balcerek, A.; Szablewski, T.; Szwajkowska-Michałek, L.; Świerk, D.; Cegielska-Radziejewska, R.; Krejpcio, Z.; Suchowilska, E.; Tomczyk, Ł.; Stuper-Szablewska, K. Sambucus nigra Extracts–Natural Antioxidants and Antimicrobial Compounds. Molecules 2021, 26, 2910. [Google Scholar] [CrossRef] [PubMed]
- Młynarczyk, K.; Walkowiak-Tomczak, D.; Łysiak, G.P. Bioactive Properties of Sambucus nigra L. as a Functional Ingredient for Food and Pharmaceutical Industry. J. Funct. Foods 2018, 40, 377–390. [Google Scholar] [CrossRef] [PubMed]
- Goiffon, J.-P.; Mouly, P.P.; Gaydou, E.M. Anthocyanic Pigment Determination in Red Fruit Juices, Concentrated Juices and Syrups Using Liquid Chromatography. Anal. Chim. Acta 1999, 382, 39–50. [Google Scholar] [CrossRef]
- Bermúdez-Soto, M.J.; Tomás-Barberán, F.A. Evaluation of Commercial Red Fruit Juice Concentrates as Ingredients for Antioxidant Functional Juices. Eur. Food Res. Technol. 2004, 219, 133–141. [Google Scholar] [CrossRef]
- Vlachojannis, C.; Zimmermann, B.F.; Chrubasik-Hausmann, S. Quantification of Anthocyanins in Elderberry and Chokeberry Dietary Supplements. Phytother. Res. 2015, 29, 561–565. [Google Scholar] [CrossRef]
- Kaack, K.; Fretté, X.C.; Christensen, L.P.; Landbo, A.-K.; Meyer, A.S. Selection of Elderberry (Sambucus nigra L.) Genotypes Best Suited for the Preparation of Juice. Eur. Food Res. Technol. 2008, 226, 843–855. [Google Scholar] [CrossRef]
- Senica, M.; Stampar, F.; Veberic, R.; Mikulic-Petkovsek, M. Processed Elderberry (Sambucus nigra L.) Products: A Beneficial or Harmful Food Alternative? LWT Food Sci. Technol. 2016, 72, 182–188. [Google Scholar] [CrossRef]
- Patras, A.; Brunton, N.P.; O’Donnell, C.; Tiwari, B.K. Effect of Thermal Processing on Anthocyanin Stability in Foods; Mechanisms and Kinetics of Degradation. Trends Food Sci. Technol. 2010, 21, 3–11. [Google Scholar] [CrossRef]
- Buvé, C.; Kebede, B.T.; de Batselier, C.; Carrillo, C.; Pham, H.T.T.; Hendrickx, M.; Grauwet, T.; van Loey, A. Kinetics of Colour Changes in Pasteurised Strawberry Juice during Storage. J. Food Eng. 2018, 216, 42–51. [Google Scholar] [CrossRef]
- Deng, J.; Yang, H.; Capanoglu, E.; Cao, H.; Xiao, J. Technological aspects and stability of polyphenols. In Polyphenols: Properties, Recovery, and Applications; Woodhead Publishing: Duxford, UK, 2018; pp. 295–323. [Google Scholar]
- Jackman, R.L.; Yada, R.Y.; Tung, M.A.; Speers, R.A. Anthocyanins as Food Colorants—A Review. J. Food Biochem. 1987, 11, 201–247. [Google Scholar] [CrossRef]
- Jiang, T.; Mao, Y.; Sui, L.; Yang, N.; Li, S.; Zhu, Z.; Wang, C.; Yin, S.; He, J.; He, Y. Degradation of Anthocyanins and Polymeric Color Formation during Heat Treatment of Purple Sweet Potato Extract at Different PH. Food Chem. 2019, 274, 460–470. [Google Scholar] [CrossRef]
- Howard, L.R.; Prior, R.L.; Liyanage, R.; Lay, J.O. Processing and Storage Effect on Berry Polyphenols: Challenges and Implications for Bioactive Properties. J. Agric. Food Chem. 2012, 60, 6678–6693. [Google Scholar] [CrossRef]
- Gonçalves, F.J.; Rocha, S.M.; Coimbra, M.A. Study of the Retention Capacity of Anthocyanins by Wine Polymeric Material. Food Chem. 2012, 134, 957–963. [Google Scholar] [CrossRef]
- Mónica Giusti, M.; Wrolstad, R.E. Anthocyanins. In Handbook of Food Analytical Chemistry; John Wiley & Sons, Inc.: Hoboken, NJ, USA, 2005; Volume 2, pp. 5–69. ISBN 9780471709084. [Google Scholar]
- Sun, B.; Ricardo-da-Silva, J.M.; Spranger, I. Critical Factors of Vanillin Assay for Catechins and Proanthocyanidins. J. Agric. Food Chem. 1998, 46, 4267–4274. [Google Scholar] [CrossRef]
- Pękal, A.; Pyrzynska, K. Evaluation of Aluminium Complexation Reaction for Flavonoid Content Assay. Food Anal. Methods 2014, 7, 1776–1782. [Google Scholar] [CrossRef] [Green Version]
- Ozgen, M.; Reese, R.N.; Tulio, A.Z.; Scheerens, J.C.; Miller, A.R. Modified 2,2-Azino-Bis-3-Ethylbenzothiazoline-6-Sulfonic Acid (ABTS) Method to Measure Antioxidant Capacity of Selected Small Fruits and Comparison to Ferric Reducing Antioxidant Power (FRAP) and 2,2‘-Diphenyl-1-Picrylhydrazyl (DPPH) Methods. J. Agric. Food Chem. 2006, 54, 1151–1157. [Google Scholar] [CrossRef]
- Kader, F.; Rovel, B.; Girardin, M.; Metche, M. Mechanism of Browning in Fresh Highbush Blueberry Fruit (Vaccinium corymbosum L.) Role of Blueberry Polyphenol Oxidase, Chlorogenic Acid and Anthocyanins. J. Sci. Food Agric. 1997, 74, 31–34. [Google Scholar] [CrossRef]
- Kader, F.; Irmouli, M.; Nicolas, J.P.; Metche, M. Involvement of Blueberry Peroxidase in the Mechanisms of Anthocyanin Degradation in Blueberry Juice. J. Food Sci. 2002, 67, 910–915. [Google Scholar] [CrossRef]
- Watanabe, T.; Yamamoto, A.; Nagai, S.; Terabe, S. Analysis of Elderberry Pigments in Commercial Food Samples by Micellar Electrokinetic Chromatography. Anal. Sci. 1998, 14, 839–844. [Google Scholar] [CrossRef] [Green Version]
- Buckow, R.; Kastell, A.; Terefe, N.S.; Versteeg, C. Pressure and Temperature Effects on Degradation Kinetics and Storage Stability of Total Anthocyanins in Blueberry Juice. J. Agric. Food Chem. 2010, 58, 10076–10084. [Google Scholar] [CrossRef]
- Brownmiller, C.; Howard, L.R.; Prior, R.L. Processing and Storage Effects on Monomeric Anthocyanins, Percent Polymeric Color, and Antioxidant Capacity of Processed Blueberry Products. J. Food Sci. 2008, 73, H72–H79. [Google Scholar] [CrossRef]
- Hager, T.J.; Howard, L.R.; Prior, R.L. Processing and Storage Effects on Monomeric Anthocyanins, Percent Polymeric Color, and Antioxidant Capacity of Processed Blackberry Products. J. Agric. Food Chem. 2008, 56, 689–695. [Google Scholar] [CrossRef]
- Hager, A.; Howard, L.R.; Prior, R.L.; Brownmiller, C. Processing and Storage Effects on Monomeric Anthocyanins, Percent Polymeric Color, and Antioxidant Capacity of Processed Black Raspberry Products. J. Food Sci. 2008, 73, H134–H140. [Google Scholar] [CrossRef]
- Casati, C.B.; Baeza, R.; Sanchez, V.; Catalano, A.; López, P.; Zamora, M.C. Thermal Degradation Kinetics of Monomeric Anthocyanins, Colour Changes and Storage Effect in Elderberry Juices. J. Berry Res. 2015, 5, 29–39. [Google Scholar] [CrossRef] [Green Version]
- Ferreira, D.; Guyot, S.; Marnet, N.; Delgadillo, I.; Renard, C.M.G.C.; Coimbra, M.A. Composition of Phenolic Compounds in a Portuguese Pear (Pyrus communis L. Var. S. bartolomeu) and Changes after Sun-Drying. J. Agric. Food Chem. 2002, 50, 4537–4544. [Google Scholar] [CrossRef]
- Tsai, P.-J.; Huang, H.-P.; Huang, T.-C. Relationship between Anthocyanin Patterns and Antioxidant Capacity in Mulberry Wine during Storage. J. Food Qual. 2004, 27, 497–505. [Google Scholar] [CrossRef]
- Zhao, C.L.; Chen, Z.J.; Bai, X.S.; Ding, C.; Long, T.J.; Wei, F.G.; Miao, K.R. Structure–Activity Relationships of Anthocyanidin Glycosylation. Mol. Divers. 2014, 18, 687–700. [Google Scholar] [CrossRef] [PubMed]
- Martí, N.; Pérez-Vicente, A.; García-Viguera, C. Influence of Storage Temperature and Ascorbic Acid Addition on Pomegranate Juice. J. Sci. Food Agric. 2002, 82, 217–221. [Google Scholar] [CrossRef]
- Brauch, J.E.; Kroner, M.; Schweiggert, R.M.; Carle, R. Studies into the Stability of 3-O-Glycosylated and 3,5-O-Diglycosylated Anthocyanins in Differently Purified Liquid and Dried Maqui (Aristotelia Chilensis (Mol.) Stuntz) Preparations during Storage and Thermal Treatment. J. Agric. Food Chem. 2015, 63, 8705–8714. [Google Scholar] [CrossRef] [PubMed]
- Timberlake, C.F.; Bridle, P. Anthocyanins: Colour Augmentation with Catechin and Acetaldehyde. J. Sci. Food Agric. 1977, 28, 539–544. [Google Scholar] [CrossRef]
- Kırca, A.; Özkan, M.; Cemeroğlu, B. Effects of Temperature, Solid Content and PH on the Stability of Black Carrot Anthocyanins. Food Chem. 2007, 101, 212–218. [Google Scholar] [CrossRef]
Figure 1.
Some polyphenols identified in elderberry (Sambucus nigra L.) juices and concentrates [8,9,10,11,12].
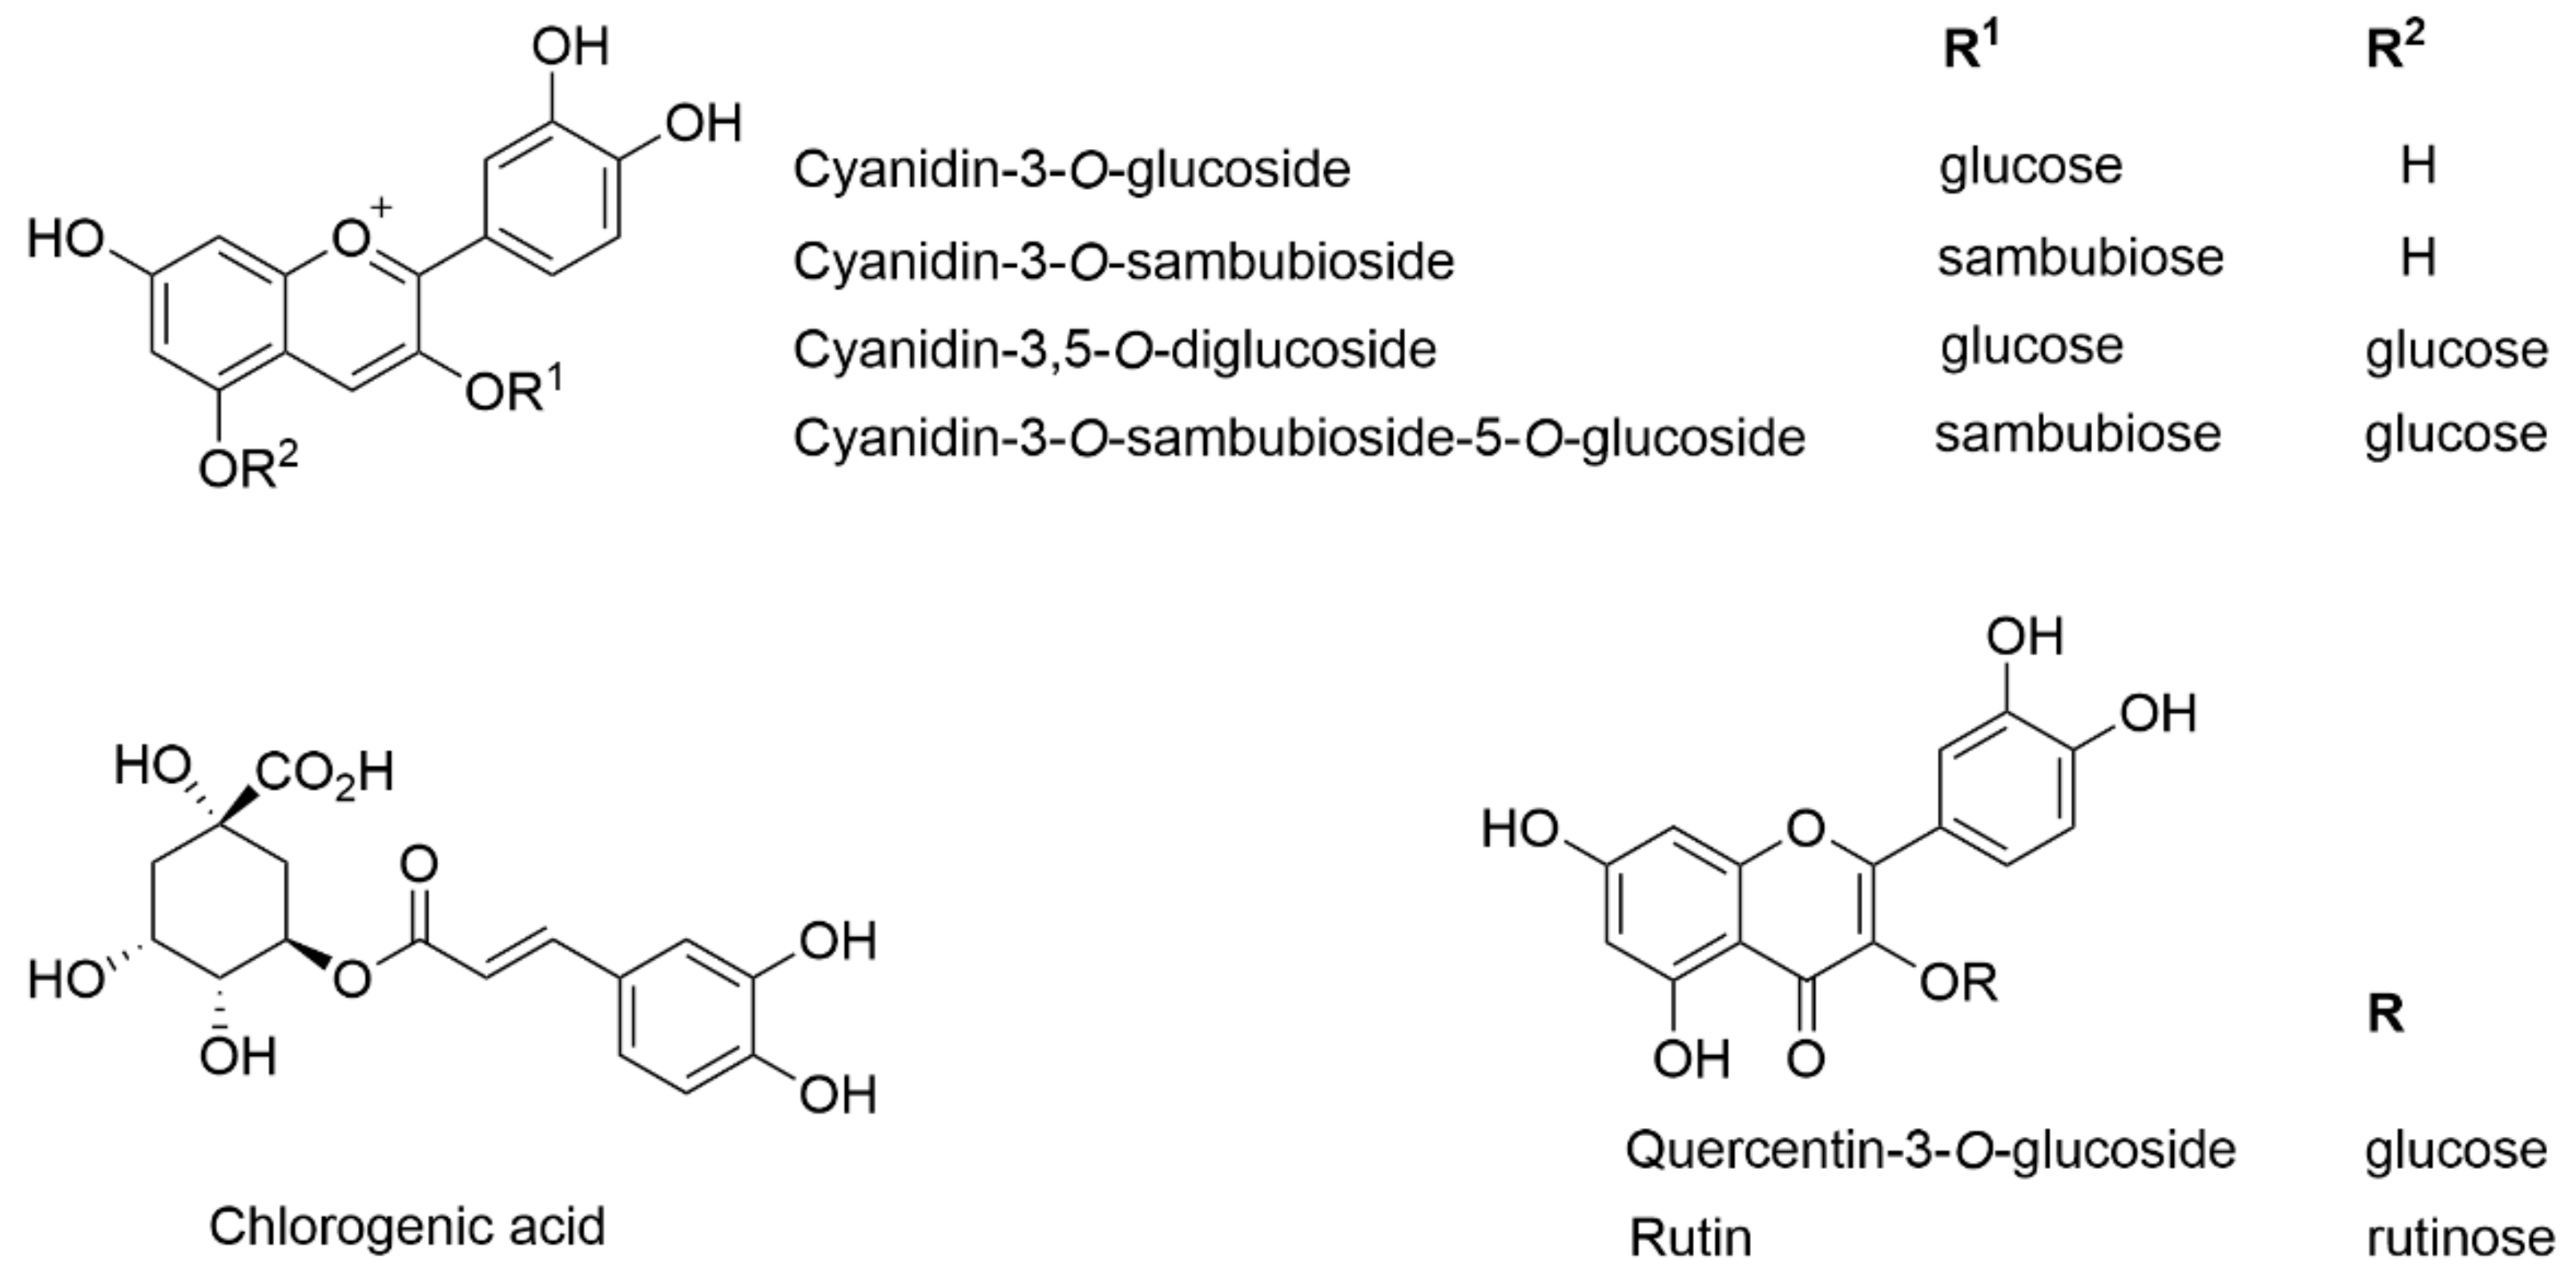
Figure 2.
HPLC chromatograms of concentrate I (a) before storage with detection at 325 nm, (b) before storage with detection at 520 nm, (c) after 7 months of storage at 5 °C with detection at 325 nm, (d) after 7 months of storage at 5 °C with detection at 520 nm, (e) after 7 months of storage at room temperature with detection at 325 nm, and (f) after 7 months of storage at room temperature with detection at 520 nm. (1) Chlorogenic acid, (2) cyanidin-3-O-sambubioside-5-O-glucoside + cyanidin-3,5-O-diglucoside, (3) cyanidin-3-O-sambubioside, (4) cyanidin-3-O-glucoside, (5) rutin, and (6) quercetin-3-O-glucoside.
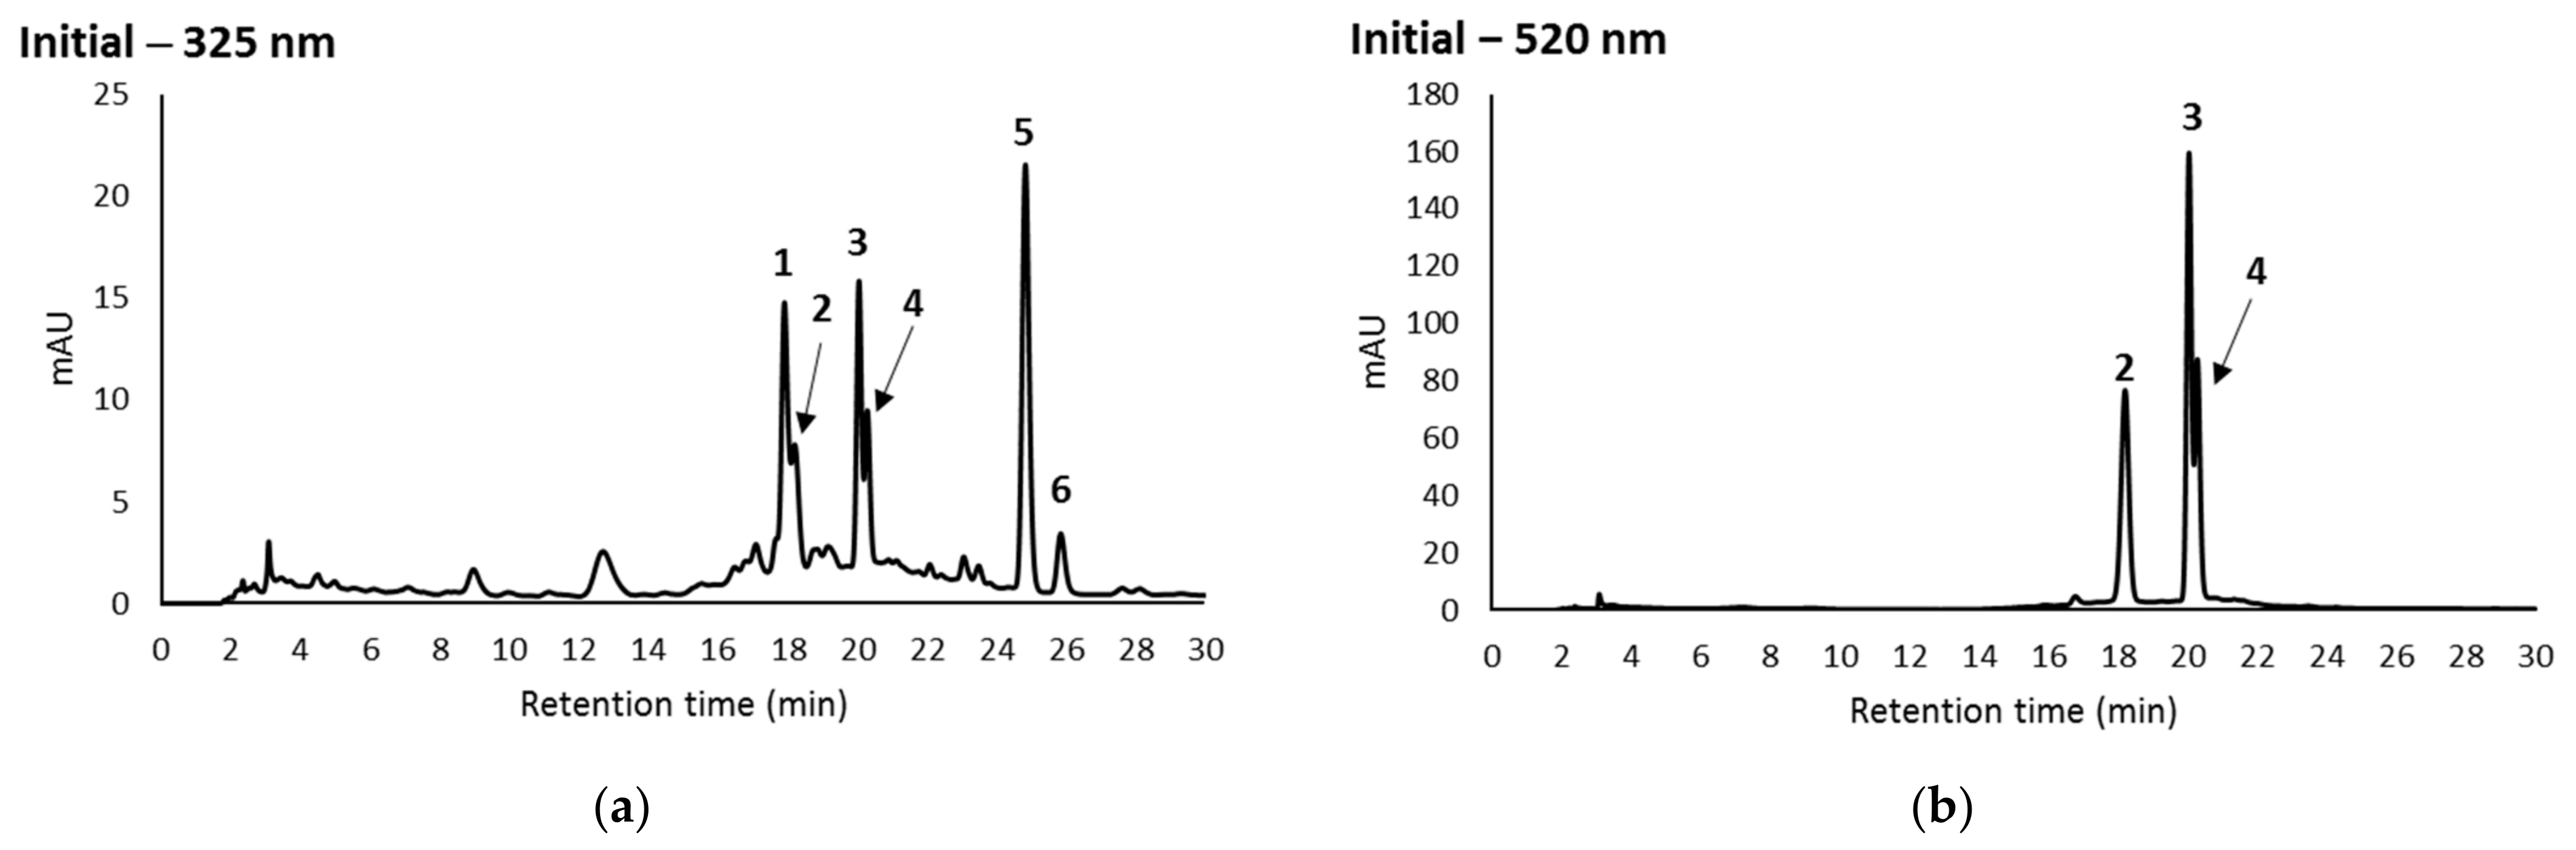
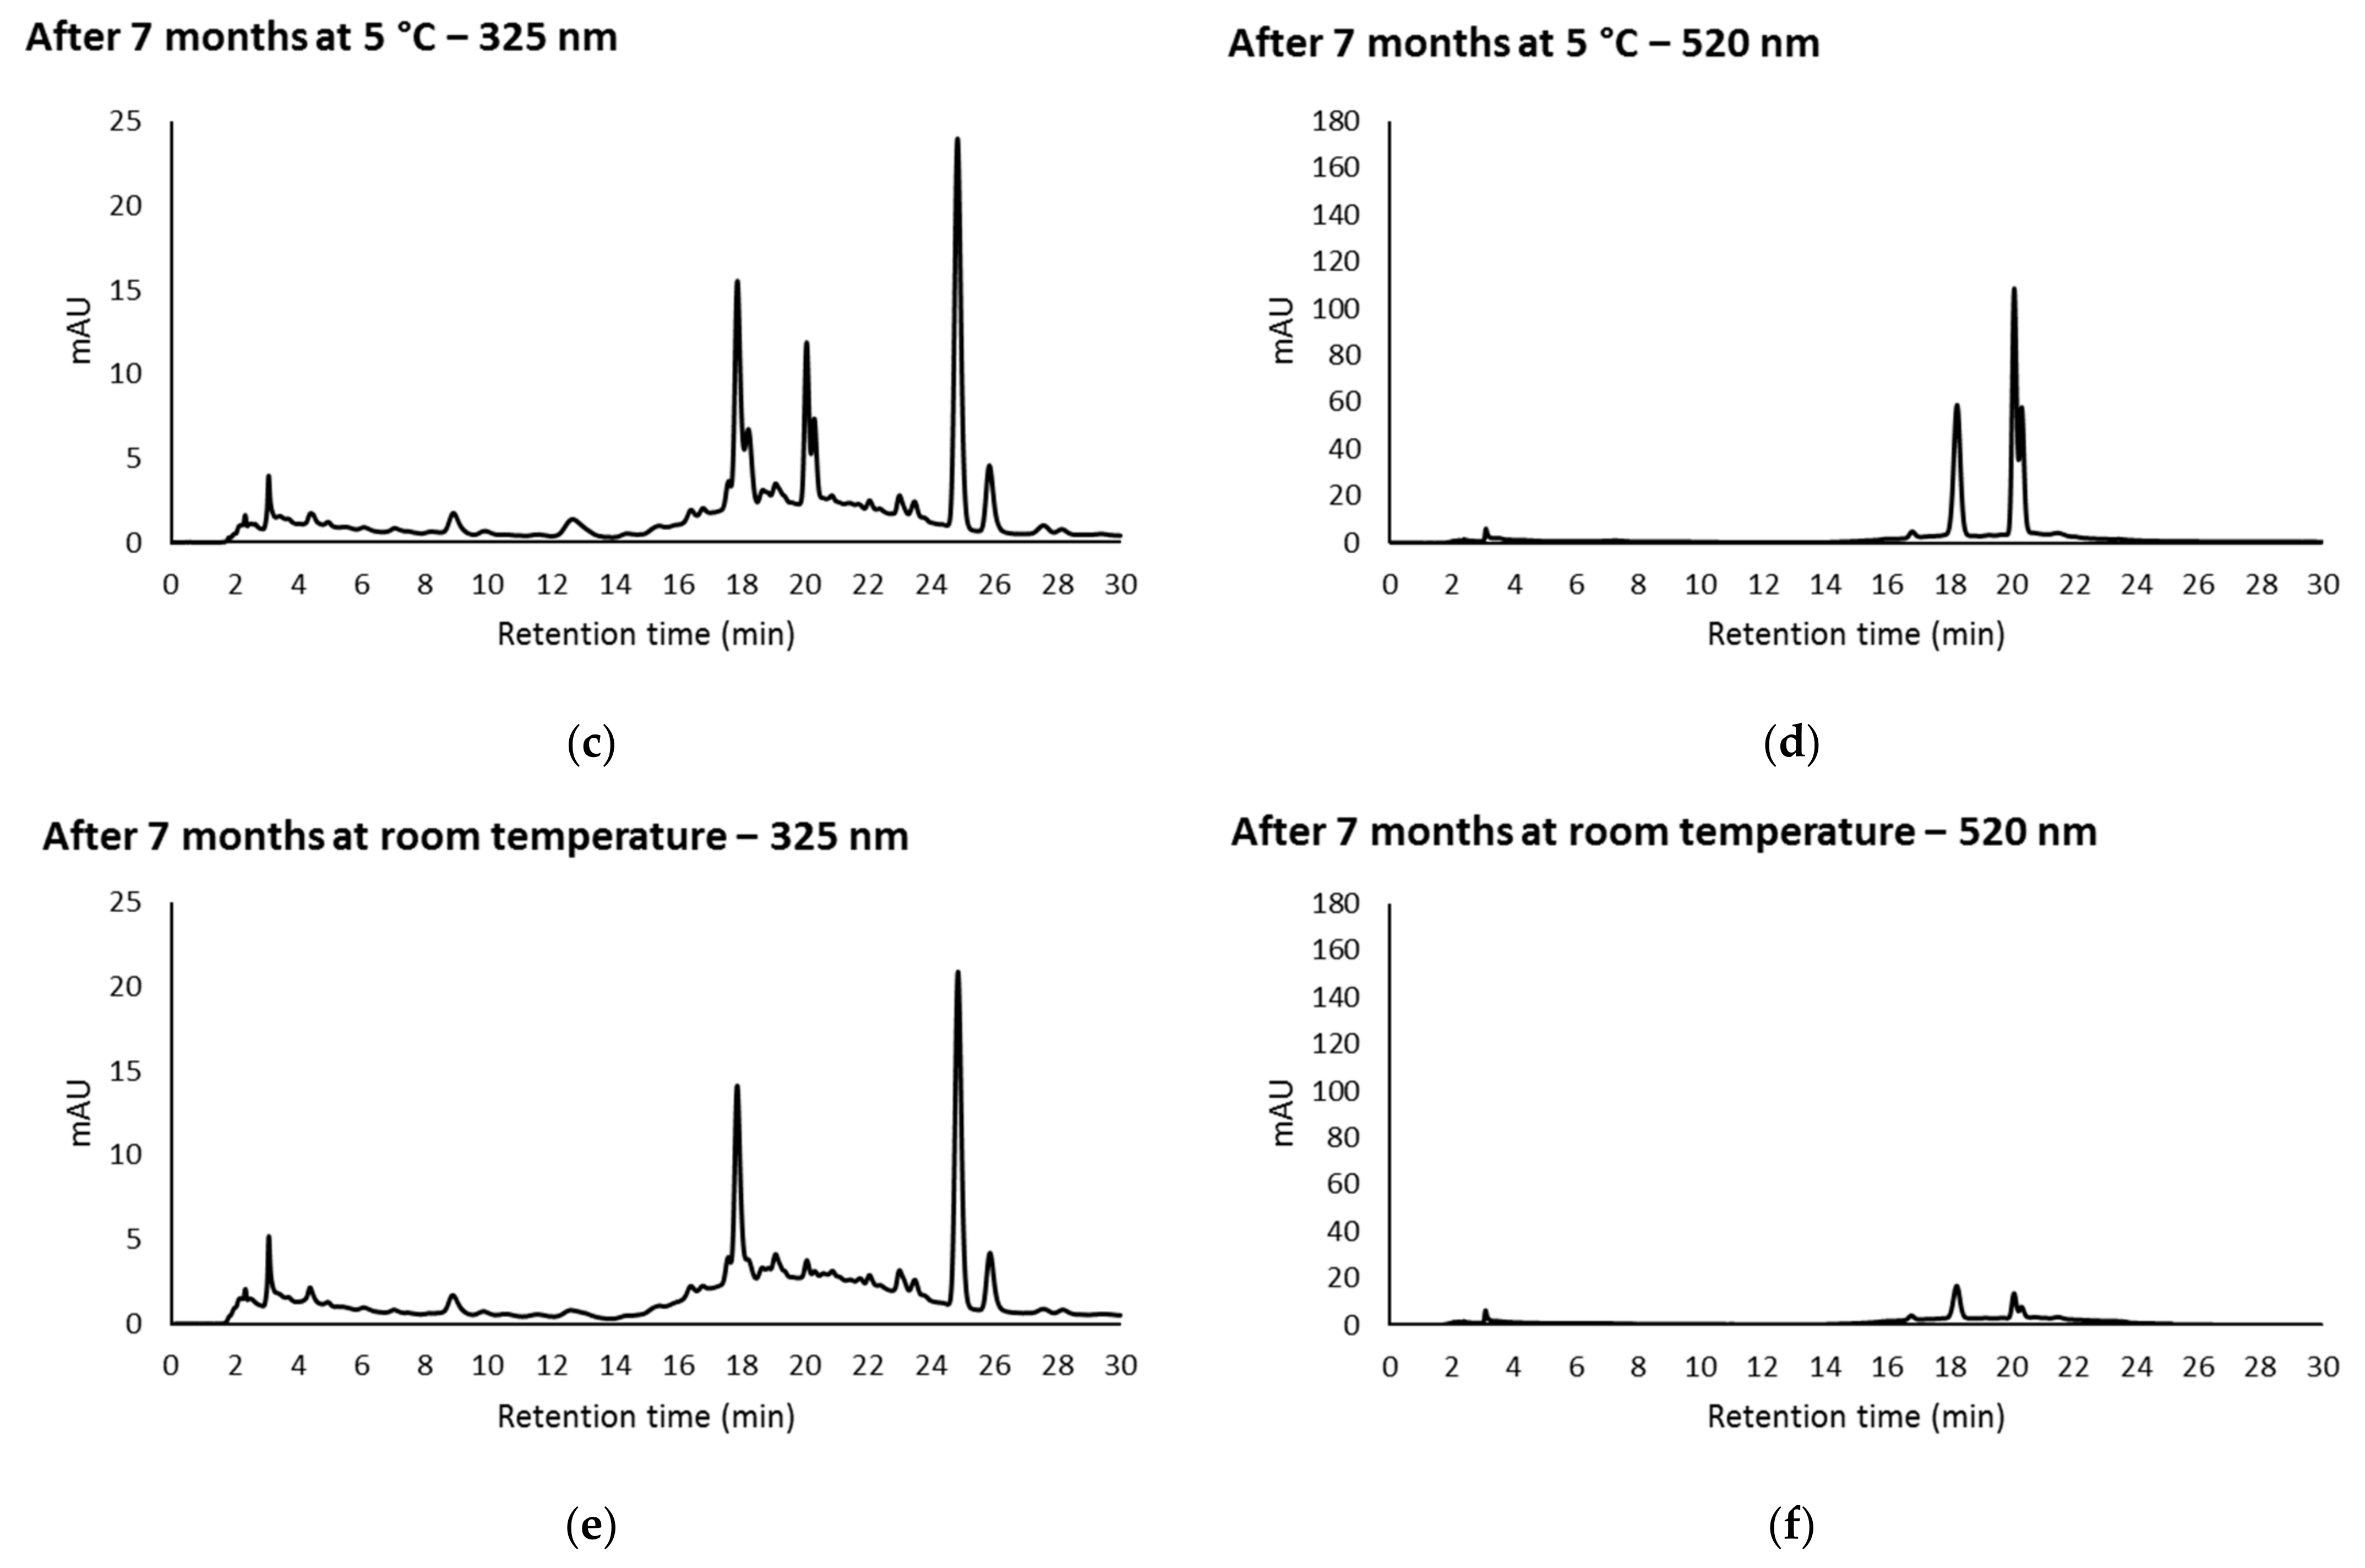
Figure 3.
Evolution during storage at 5 °C and at room temperature (RT) for total monomeric anthocyanins (TMA) and percent polymeric color (%PC) in (a) concentrate I, (b) concentrate II; and total phenolic content (TPC) and antioxidant activity (AA) in (c) concentrate I and (d) concentrate II.
Figure 3.
Evolution during storage at 5 °C and at room temperature (RT) for total monomeric anthocyanins (TMA) and percent polymeric color (%PC) in (a) concentrate I, (b) concentrate II; and total phenolic content (TPC) and antioxidant activity (AA) in (c) concentrate I and (d) concentrate II.
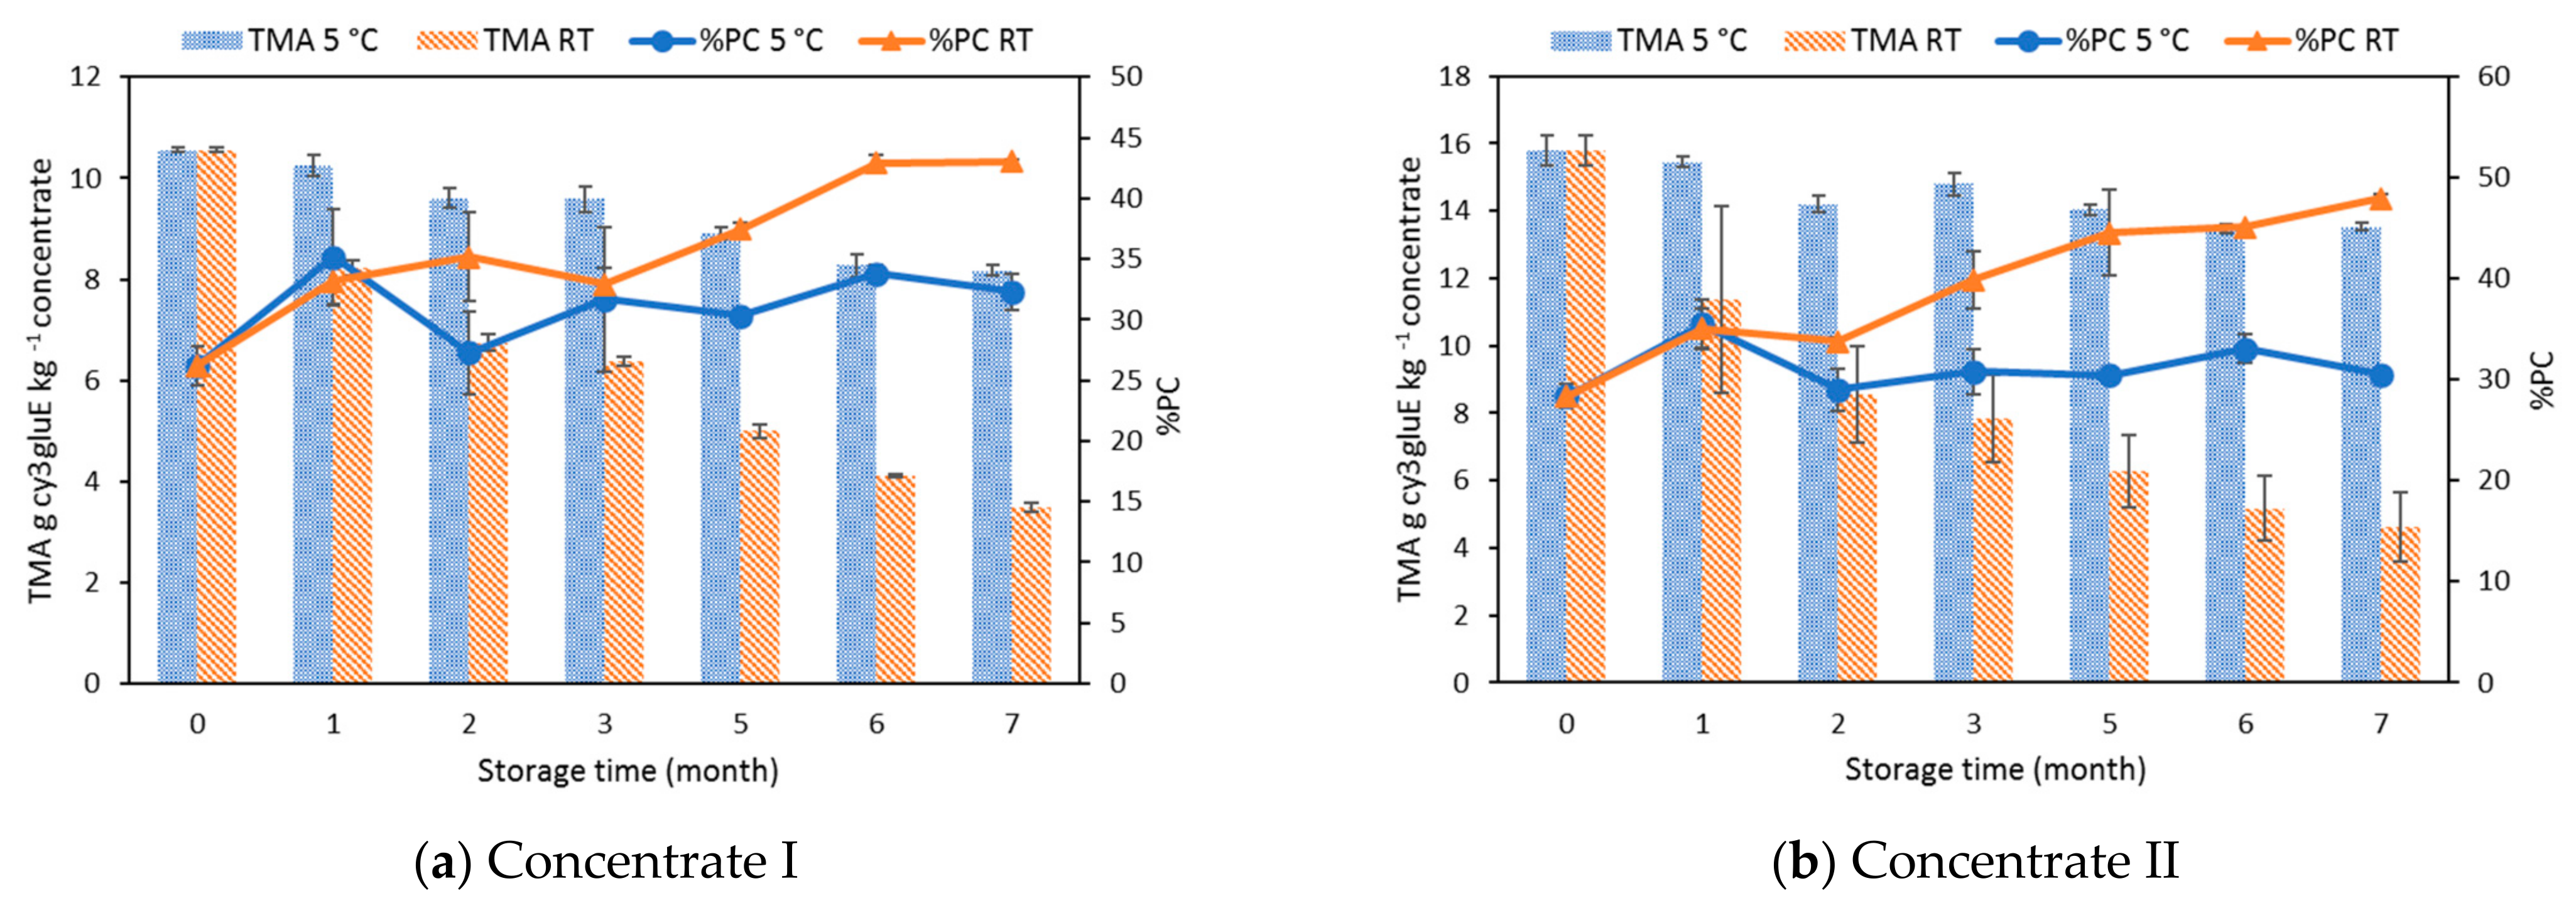
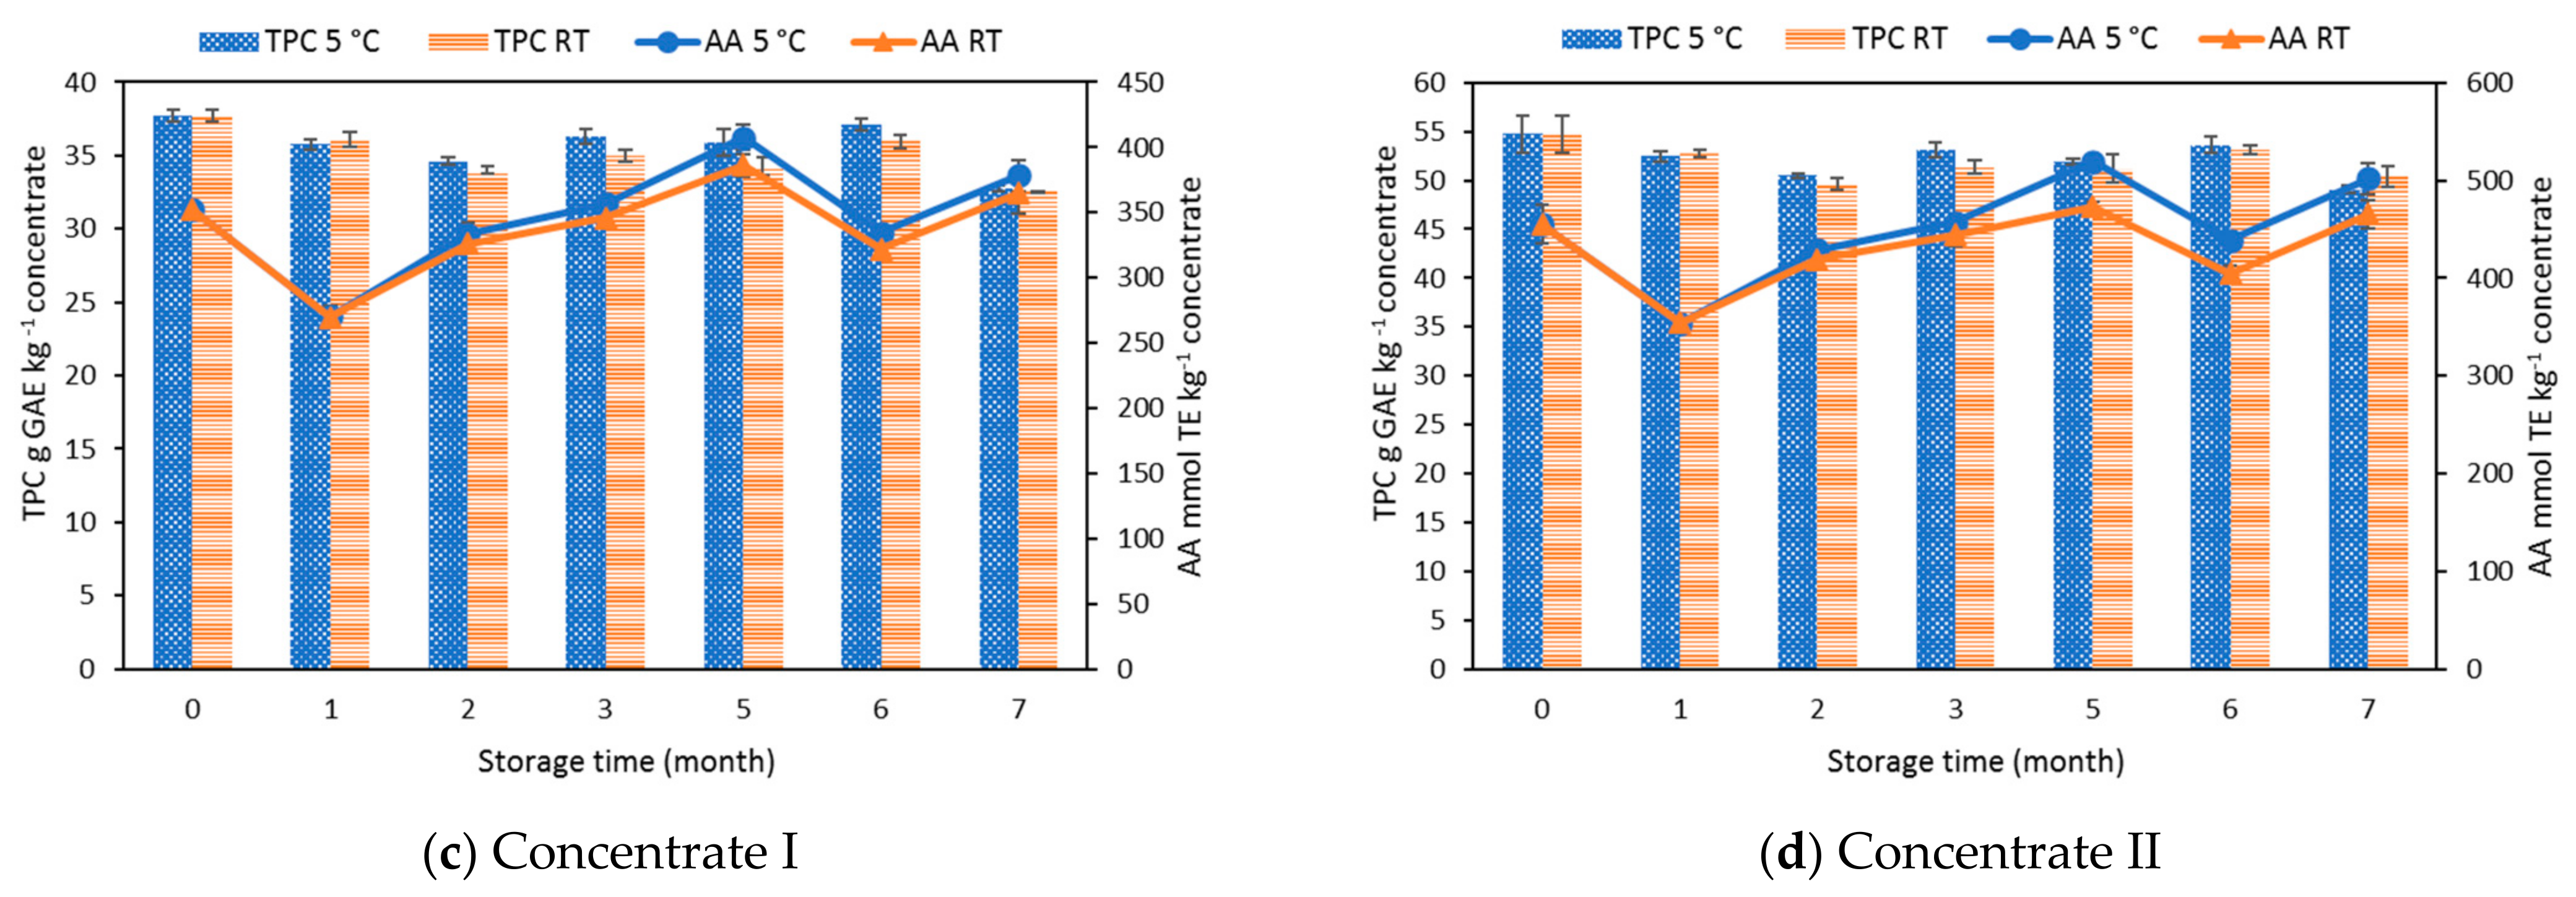
Figure 4.
Changes in (a) cyanidin-3-O-sambubioside, (b) cyanidin-3-O-glucoside, (c) cyanidin-3,5-O-diglucoside + cyanidin-3-O-sambubioside-5-O-glucoside, (d) chlorogenic acid, (e) rutin, and (f) quercetin-3-O-glucoside of elderberry concentrates I and II during storage at 5 °C and at room temperature (RT).

Table 1.
Analytic data of the initial elderberry juice concentrates 1.
| Concentrate I | Concentrate II | |
|---|---|---|
| Thermal processing step | Heating of mash at 80 °C | No |
| Total soluble solids (°Brix) | 55.8 ± 0.8 | 80.6 ± 1.0 |
| Total phenolic content (g GAE kg−1) | 37.7 ± 0.4 | 54.7 ± 1.9 |
| Total monomeric anthocyanins (g Cy3gluE kg−1) | 10.6 ± 0.1 | 15.8 ± 0.4 |
| Flavonols (g QE kg−1) | 3.1 ± 0.04 | 4.8 ± 0.2 |
| Flavan-3-ols (g EpiE kg−1) | 1.0 ± 0.6 | 1.5 ± 0.3 |
| Polymeric color (%) | 26.2 ± 1.6 | 28.3 ± 1.2 |
| Antioxidant activity (mmol TE kg−1) | 352.3 ± 2.6 | 455.0 ± 19.4 |
1 Results are expressed as mean values ± standard deviation (n = 3). GAE—gallic acid equivalents, QE—quercetin equivalents, EpiE—epicatechin equivalents, Cy3gluE—cyanidin-3-O-glucoside equivalents, TE—Trolox equivalents.
Table 2.
Contents of individual phenolic compounds in the initial elderberry concentrates quantified by HPLC in g kg−1.
Table 2.
Contents of individual phenolic compounds in the initial elderberry concentrates quantified by HPLC in g kg−1.
| Compounds | Concentrate I | Concentrate II |
|---|---|---|
| Cyanidin-3-O-sambubioside | 3.30 ± 0.06 | 4.69 ± 0.04 |
| Cyanidin-3-O-glucoside | 1.99 ± 0.07 | 2.86 ± 0.02 |
| Cyanidin-3,5-diglucoside + cyanidin-3-O-sambubioside-5-O-glucoside | 4.39 ± 0.15 | 6.49 ± 0.08 |
| Rutin | 2.51 ± 0.04 | 3.70 ± 0.04 |
| Quercentin-3-O-glucoside | 0.79 ± 0.01 | 0.96 ± 0.01 |
| Chlorogenic acid | 0.78 ± 0.02 | 1.11 ± 0.01 |
Table 3.
Results of microbial counting obtained for concentrates before storage and after five months of storage.
Table 3.
Results of microbial counting obtained for concentrates before storage and after five months of storage.
| Sample | Mesophiles at 30 °C (CFU mL−1) | Fungi (CFU mL−1) |
|---|---|---|
| Concentrate I before storage | ˂1 | ˂1 |
| Concentrate I stored at 5 °C | ˂1 | ˂1 |
| Concentrate I stored at room temperature | 2.1 × 10² | ˂1 |
| Concentrate II before storage | ˂1 | ˂1 |
| Concentrate II stored at 5 °C | 2.2 × 10 | 1.0 × 10 |
| Concentrate II stored at room temperature | 1.1 × 10³ | 1.1 × 10⁴ |
Publisher’s Note: MDPI stays neutral with regard to jurisdictional claims in published maps and institutional affiliations. |
© 2021 by the authors. Licensee MDPI, Basel, Switzerland. This article is an open access article distributed under the terms and conditions of the Creative Commons Attribution (CC BY) license (https://creativecommons.org/licenses/by/4.0/).
Share and Cite
MDPI and ACS Style
Neves, C.M.B.; Pinto, A.; Gonçalves, F.; Wessel, D.F. Changes in Elderberry (Sambucus nigra L.) Juice Concentrate Polyphenols during Storage. Appl. Sci. 2021, 11, 6941. https://doi.org/10.3390/app11156941
AMA Style
Neves CMB, Pinto A, Gonçalves F, Wessel DF. Changes in Elderberry (Sambucus nigra L.) Juice Concentrate Polyphenols during Storage. Applied Sciences. 2021; 11(15):6941. https://doi.org/10.3390/app11156941
Chicago/Turabian StyleNeves, Cláudia M. B., António Pinto, Fernando Gonçalves, and Dulcineia F. Wessel. 2021. "Changes in Elderberry (Sambucus nigra L.) Juice Concentrate Polyphenols during Storage" Applied Sciences 11, no. 15: 6941. https://doi.org/10.3390/app11156941
Note that from the first issue of 2016, this journal uses article numbers instead of page numbers. See further details here.