
Data-Driven Analyses of Low Salinity Waterflooding in Carbonates


Abstract
:1. Introduction
2. Methodology
2.1. Data Collection and Cleaning
2.2. Data Analysis Methods
3. Results and Discussion
3.1. Effect of LSW Governing Parameters on Oil Recovery
3.1.1. Linear Multivariable Regression
3.1.2. Nonlinear Multivariable Regression
3.2. Linking Mechanisms to Parameters
4. Conclusions
- •
- Different single parameters (such as salinity, contrast in salinity change, PDI concentration, oil acidity, base number of crude oil, permeability, and temperature) were individually analyzed using linear regression to study their correlation with the incremental oil recovery by LSW flooding. Negligible and weak relationships indicate that a single parameter is not sufficient to explain the performance of LSW injection.
- •
- Among groups of parameters, a set of oil/brine parameters that include AN, alteration in salinity, SO42− and cation concentrations, showed the best, but still weak, correlation. So, linear correlations are insufficient to forecast LSW potential.
- •
- A nonlinear relationship between parameters and RF was observed using ML models. Among the ML models, DT produced the best correlation for brine only parameters; the correlation coefficients for training and testing data were 0.57 and 0.35, respectively. For oil/brine parameters, all models showed strong and very strong relationships. However, ANN and SVM showed unsatisfactory results for testing data due to overfitting. In contrast, less overfitting was achieved by DT, where the correlation coefficients for training and testing data were 0.68 and 0.63, respectively.
- •
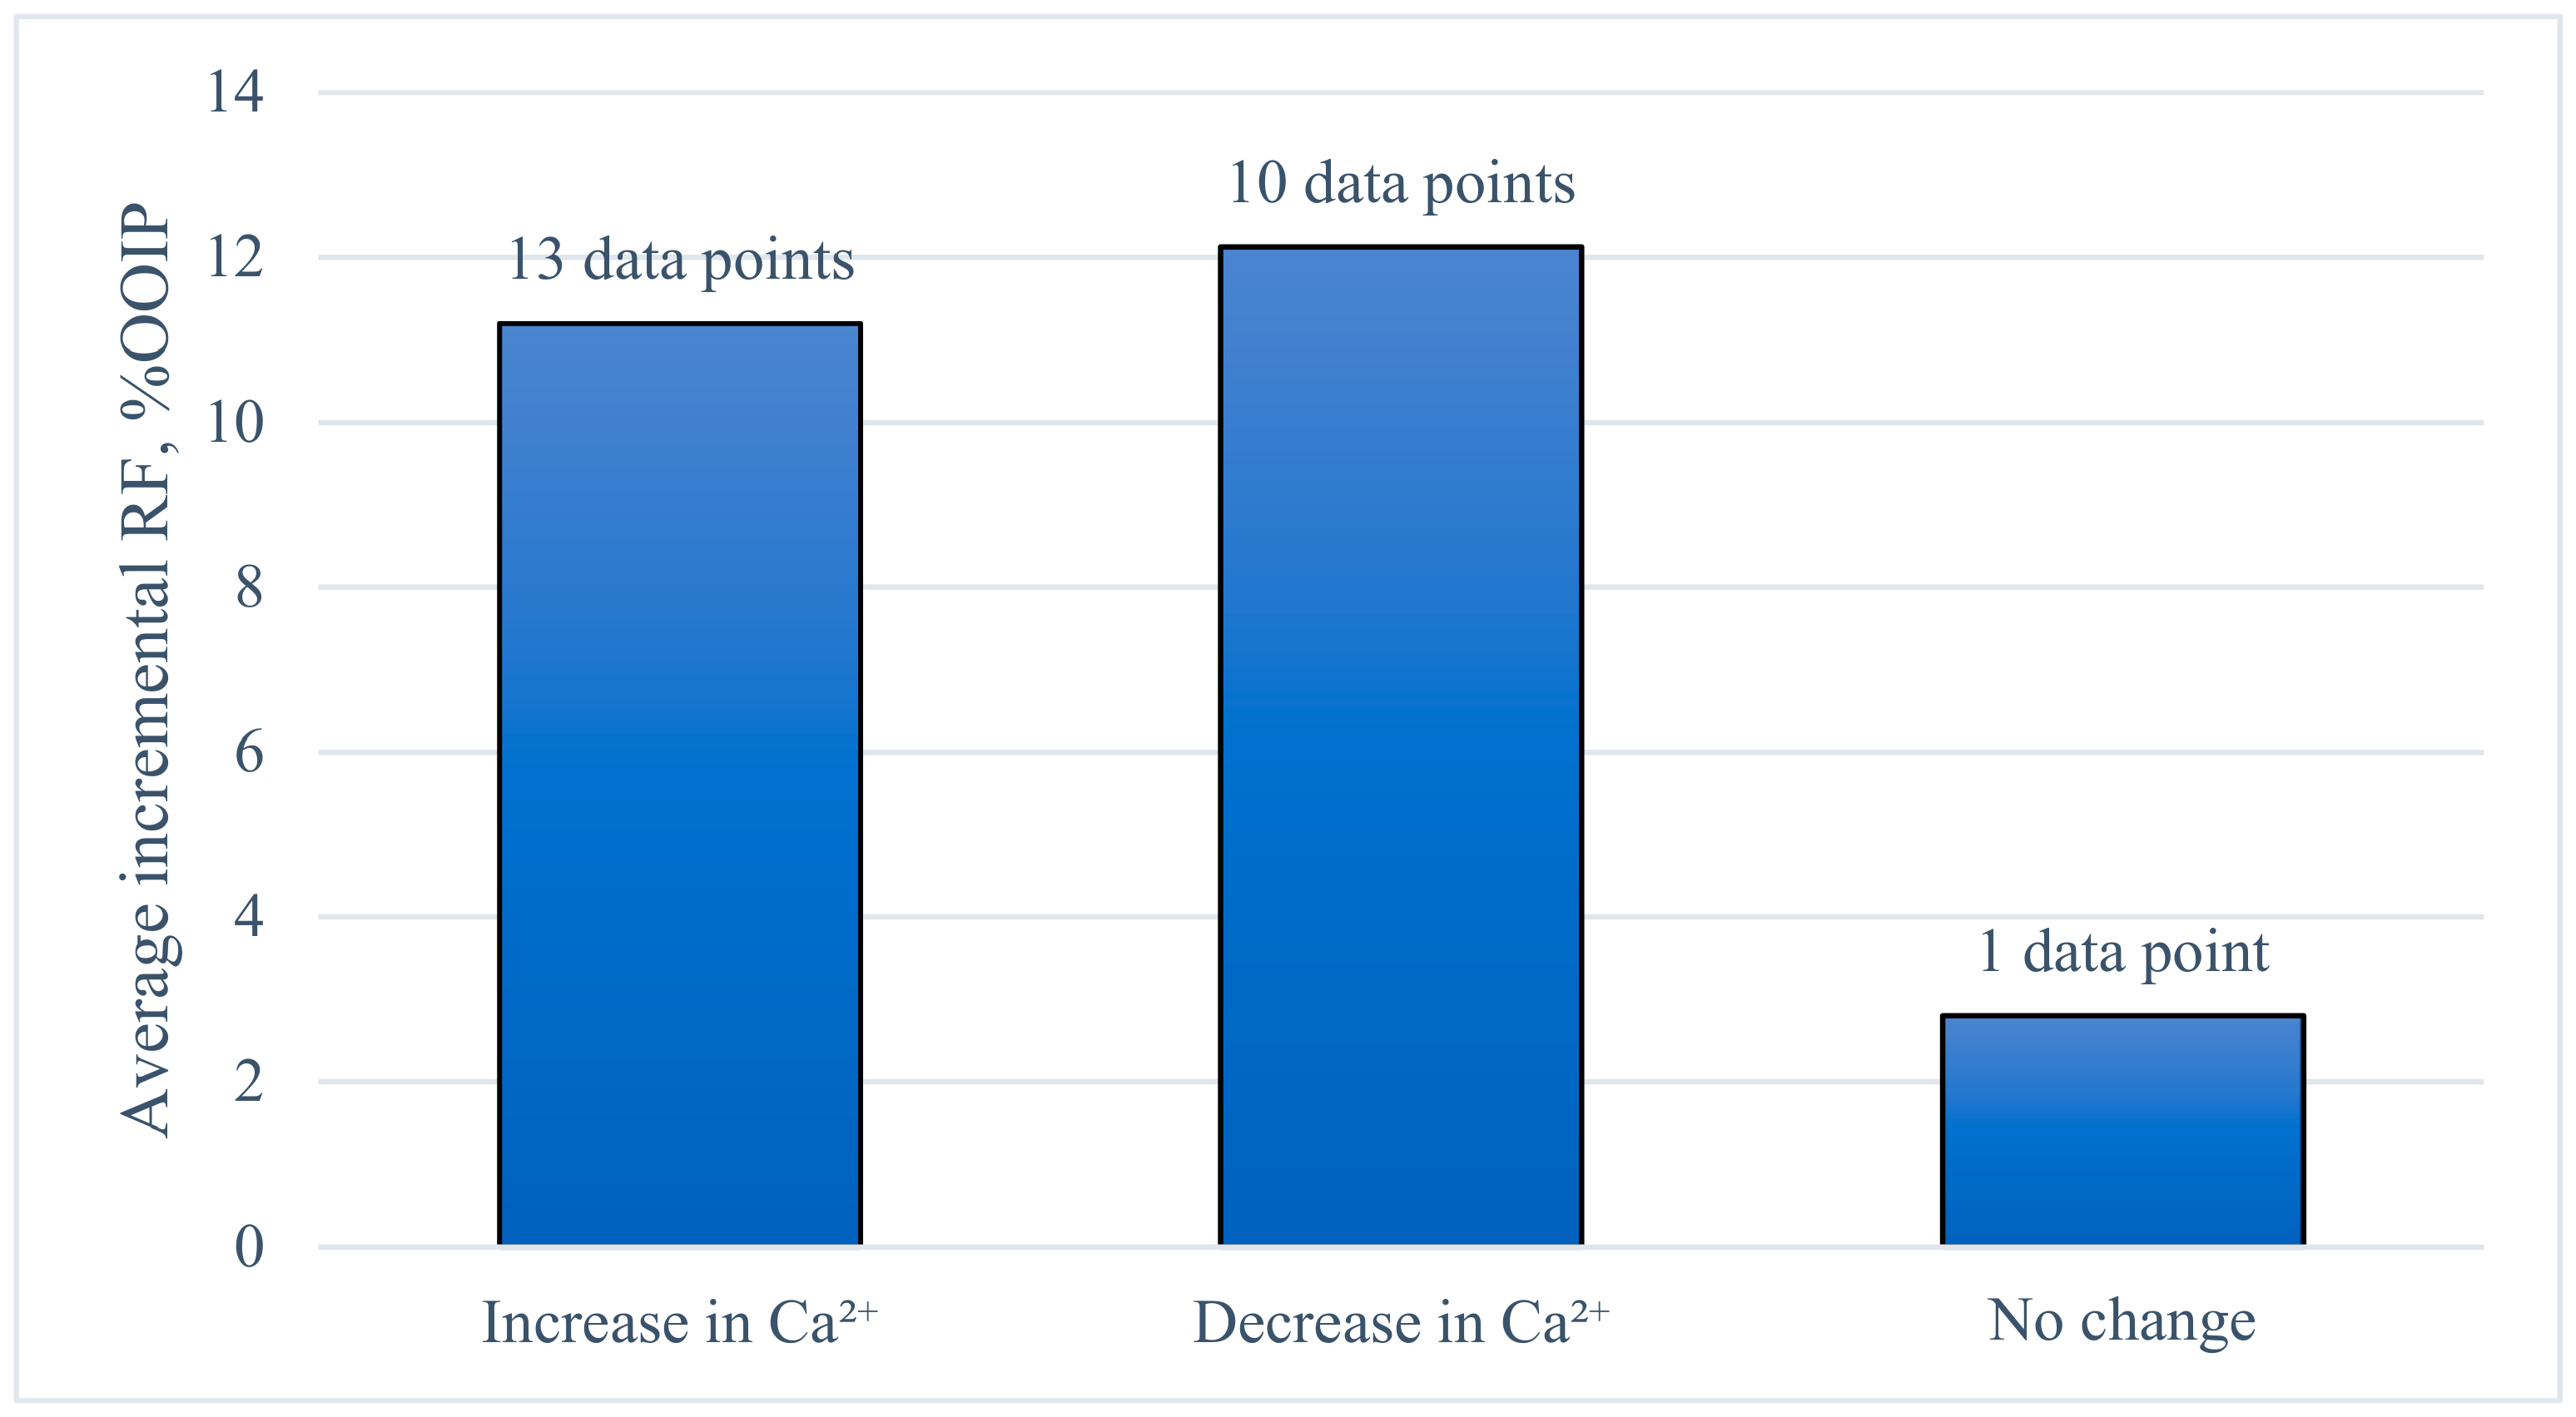
- Several mechanisms involved in the LSW process and the LSW effect cannot be explained by a single mechanism. MIE and rock dissolution are the most widely accepted mechanisms in the literature. These mechanisms result in wettability alteration in coreflooding tests in carbonates. Our studies showed that, by analyzing oil/brine parameters, a better understanding of the active mechanisms during LSW can be achieved, and it is possible to predict the mechanism by analyzing parameters such as salinity, ion concentrations, pH, and IFT.
- •
- Future research should be further conducted to confirm these findings by increasing the data set size. In addition, with more experimental data, other parameters should be added to the model to show fluid/fluid interactions.
Author Contributions
Funding
Acknowledgments
Conflicts of Interest
References
- Akbar, M.; Vissapragada, B.; Alghamdi, A.H.; Allen, D.; Herron, M.; Carnegie, A.; Dutta, D.; Olesen, J.R.; Chourasiya, R.D.; Logan, D.; et al. A snapshot of carbonate reservoir evaluation. Oilfield Rev. 2000, 12, 20–21. [Google Scholar]
- Derkani, M.H.; Fletcher, A.J.; Abdallah, W.; Sauerer, B.; Anderson, J.; Zhang, Z.J. Low salinity waterflooding in carbonate reservoirs: Review of interfacial mechanisms. Colloids Interfaces 2018, 2, 20. [Google Scholar] [CrossRef] [Green Version]
- Austad, T.; Shariatpanahi, S.F.; Strand, S.; Black, C.J.J.; Webb, K.J. Conditions for a low-salinity enhanced oil recovery (EOR) effect in carbonate oil reservoirs. Energy Fuels 2012, 26, 569–575. [Google Scholar] [CrossRef]
- Egbe, D.I.O.; Ghahfarokhi, A.J.; Amar, M.N.; Torsæter, O. Application of low-salinity waterflooding in carbonate cores: A geochemical modeling study. Nat. Resour. Res. 2021, 30, 519–542. [Google Scholar] [CrossRef]
- Srisuriyachai, F.; Meekangwal, S. Evidence of multi-component ion exchange in dolomite formation during low salinity waterflooding. In IOP Conference Series: Earth and Environmental Science; IOP Publishing: Bristol, UK, 2017; Volume 95. [Google Scholar]
- Al Kharousi, B.; Pourafshary, P.; Mosavat, N.; Al-Wahaibi, Y. Design and performance of smart water shock injection SWSI in carbonate reservoirs. In Proceedings of the SPE Annual Caspian Technical Conference and Exhibition, Astana, Kazakhstan, 31 October–2 November 2018; Society of Petroleum Engineers: Houston, TX, USA, 2018. [Google Scholar]
- Meng, W.; Haroun, M.R.; Sarma, H.K.; Adeoye, J.T.; Aras, P.; Punjabi, S.; Rahman, M.M.; Al Kobaisi, M. A novel approach of using phosphate-spiked smart brines to alter wettability in mixed oil-wet carbonate reservoirs. In Proceedings of the Abu Dhabi International Petroleum Exhibition and Conference, Abu Dhabi, United Arab Emirates, 9–12 November 2015; Society of Petroleum Engineers: Houston, TX, USA, 2015. [Google Scholar]
- Okasha, T.M.; Alshiwaish, A. Effect of brine salinity on interfacial tension in Arab-D carbonate reservoir, Saudi Arabia. In Proceedings of the SPE Middle East Oil and Gas Show and Conference, Manama, Bahrain, 15–18 March 2009; Society of Petroleum Engineers: Houston, TX, USA, 2009. [Google Scholar]
- Ligthelm, D.J.; Gronsveld, J.; Hofman, J.; Brussee, N.; Marcelis, F.; van der Linde, H. Novel waterflooding strategy by manipulation of injection brine composition. In Proceedings of the EUROPEC/EAGE Conference and Exhibition, Amsterdam, The Netherlands, 8 June 2009; Society of Petroleum Engineers: Houston, TX, USA, 2009. [Google Scholar]
- Sari, A.; Chen, Y.; Xie, Q.; Saeedi, A. Low salinity water flooding in high acidic oil reservoirs: Impact of pH on wettability of carbonate reservoirs. J. Mol. Liq. 2019, 281, 444–450. [Google Scholar] [CrossRef]
- Mahani, H.; Keya, A.L.; Berg, S.; Bartels, W.B.; Nasralla, R.; Rossen, W.R. Insights into the mechanism of wettability alteration by low-salinity flooding (LSF) in carbonates. Energy Fuels 2015, 29, 1352–1367. [Google Scholar] [CrossRef]
- Al Mahrouqi, D.; Vinogradov, J.; Jackson, M.D. Zeta potential of artificial and natural calcite in aqueous solution. Adv. Colloid Interface Sci. 2017, 240, 60–76. [Google Scholar] [CrossRef] [Green Version]
- Altahir, M.; Yu, M.; Hussain, F. Low salinity water flooding in carbonate rocks–dissolution effect. In Proceedings of the International Symposium of the Society of Core Analysts (SCA2017-070), Vienna, Austria, 27 August–1 September 2017; Volume 27. [Google Scholar]
- Den Ouden, L.; Nasralla, R.A.; Guo, H.; Bruining, H.; Van Kruijsdijk, C.P.J.W. Calcite dissolution behaviour during low salinity water flooding in carbonate rock. In Proceedings of the IOR 2015—18th European Symposium on Improved Oil Recovery, Dresden, Germany, 14–16 April 2015; European Association of Geoscientists & Engineers: Dresden, Germany, 2015. [Google Scholar]
- Hiorth, A.; Cathles, L.M.; Madland, M.V. The impact of pore water chemistry on carbonate surface charge and oil wettability. Transp. Porous Media 2010, 85, 1–21. [Google Scholar] [CrossRef]
- Hiorth, A.; Cathles, L.M.; Kolnes, J.; Vikane, O.; Lohne, A.; Madland, M.V. Chemical modelling of wettability change in carbonate rocks. In Proceedings of the 10th Wettability Conference, Abu Dhabi, United Arab Emirates, 27–28 October 2008; pp. 1–9. [Google Scholar]
- Yousef, A.A.; Al-Saleh, S.H.; Al-Kaabi, A.; Al-Jawfi, M.S. Laboratory investigation of the impact of injection-water salinity and ionic content on oil recovery from carbonate reservoirs. SPE Reserv. Eval. Eng. 2011, 14, 578–593. [Google Scholar] [CrossRef]
- Masalmeh, S.; Al-Hammadi, M.; Farzaneh, A.; Sohrabi, M. Low salinity water flooding in carbonate: Screening, laboratory quantification and field implementation. In Proceedings of the Abu Dhabi International Petroleum Exhibition & Conference, Abu Dhabi, United Arab Emirates, 11–14 November 2019. [Google Scholar]
- AlHammadi, M.; Mahzari, P.; Sohrabi, M. Fundamental investigation of underlying mechanisms behind improved oil recovery by low salinity water injection in carbonate rocks. Fuel 2018, 220, 345–357. [Google Scholar] [CrossRef]
- Legens, C.; Toulhoat, H.; Cuiec, L.; Villieras, F.; Palermo, T. Wettability change related to adsorption of organic acids on calcite: Experimental and ab initio computational studies. SPE J. 1999, 4, 328–333. [Google Scholar] [CrossRef]
- Sekerbayeva, A.; Pourafshary, P.; Hashmet, M.R. Application of anionic Surfactant\Engineered water hybrid EOR in carbonate formations: An experimental analysis. Petroleum 2020, 1, 1–12. [Google Scholar] [CrossRef]
- Bazhanova, M.; Pourafshary, P. Impact of SO42−, Ca2+, and Mg2+ ions in Caspian Sea ion-engineered water on the rate of wettability alteration in carbonates. J. Pet. Explor. Prod. Technol. 2020, 10, 3281–3293. [Google Scholar] [CrossRef]
- Awolayo, A.N.; Sarma, H.K.; Nghiem, L.X. Modeling the characteristic thermodynamic interplay between potential determining ions during brine-dependent recovery process in carbonate rocks. Fuel 2018, 224, 701–717. [Google Scholar] [CrossRef]
- Yi, Z.; Sarma, H.K. Improving waterflood recovery efficiency in carbonate reservoirs through salinity variations and ionic exchanges: A promising low-cost “Smart-Waterflood” approach. In Proceedings of the Abu Dhabi International Petroleum Exhibition & Conference, Abu Dhabi, United Arab Emirates, 11–14 November 2012; Society of Petroleum Engineers: Houston, TX, USA, 2012. [Google Scholar]
- Strand, S.; Austad, T.; Puntervold, T.; Høgnesen, E.J.; Olsen, M.; Barstad, S.M.F. “Smart water” for oil recovery from fractured limestone: A preliminary study. Energy Fuels 2008, 22, 3126–3133. [Google Scholar] [CrossRef] [Green Version]
- Awolayo, A.N.; Sarma, H.K.; Nghiem, L.X. Brine-dependent recovery processes in carbonate and sandstone petroleum reservoirs: Review of laboratory-field studies, interfacial mechanisms and modeling attempts. Energies 2018, 11, 3020. [Google Scholar] [CrossRef] [Green Version]
- Fani, M.; Al-Hadrami, H.; Pourafshary, P.; Vakili-Nezhaad, G.; Mosavat, N. Optimization of smart water flooding in carbonate reservoir. In Proceedings of the Abu Dhabi International Petroleum Exhibition & Conference, Abu Dhabi, United Arab Emirates, 12–15 November 2018; Society of Petroleum Engineers: Houston, TX, USA, 2018. [Google Scholar]
- Dubey, S.T.; Doe, P.H. Base number and wetting properties of crude oils. SPE Reserv. Eng. 1993, 8, 195–200. [Google Scholar] [CrossRef]
- Puntervold, T. Waterflooding of Carbonate Reservoirs: EOR by Wettability Alteration. Ph.D. Thesis, University of Stavanger, Stavanger, Norway, 2008. [Google Scholar]
- Collini, H.; Li, S.; Jackson, M.D.; Agenet, N.; Rashid, B.; Couves, J. Zeta potential in intact carbonates at reservoir conditions and its impact on oil recovery during controlled salinity waterflooding. Fuel 2008, 266, 116927. [Google Scholar] [CrossRef]
- Tetteh, J.; Janjang, N.M.; Barati, R. Wettability alteration and enhanced oil recovery using low salinity waterflooding in limestone rocks: A mechanistic study. In Proceedings of the SPE Kingdom of Saudi Arabia Annual Technical Symposium and Exhibition, Dammam, Saudi Arabia, 23–26 April 2018; Society of Petroleum Engineers: Houston, TX, USA, 2018. [Google Scholar]
- Mohammadkhani, S.; Shahverdi, H.; Esfahany, M.N. Impact of salinity and connate water on low salinity water injection in secondary and tertiary stages for enhanced oil recovery in carbonate oil reservoirs. J. Geophys. Eng. 2018, 15, 1242–1254. [Google Scholar] [CrossRef] [Green Version]
- Gandomkar, A.; Rahimpour, M.R. Investigation of low-salinity waterflooding in secondary and tertiary enhanced oil recovery in limestone reservoirs. Energy Fuels 2015, 29, 7781–7792. [Google Scholar] [CrossRef]
- Wang, L.; Fu, X. Data-driven analyses of low salinity water flooding in sandstones. Fuel 2018, 234, 674–686. [Google Scholar] [CrossRef]
- Wang, L.; Tian, Y.; Yao, B.; Yu, X. Machine learning analyses of low salinity effect in sandstone porous media. J. Porous Media 2020, 23, 731–740. [Google Scholar] [CrossRef]
- Ahmed, S.A.; Elkatatny, S.; Ali, A.Z.; Abdulraheem, A.; Mahmoud, M. Artificial neural network ANN approach to predict fracture pressure. In Proceedings of the SPE Middle East Oil and Gas Show and Conference, Manama, Bahrain, 18–21 March 2019; Society of Petroleum Engineers: Houston, TX, USA, 2019. [Google Scholar]
- Kalam, S.; Khan, M.; Mahmoud, M.; Khan, R.A.; Abu-Khamsin, S.A. New vision into relative permeability estimation using Artificial Neural Networks. In Proceedings of the SPE Asia Pacific Oil & Gas Conference and Exhibition, Perth, Australia, 20–22 October 2020; Society of Petroleum Engineers: Houston, TX, USA, 2020. [Google Scholar]
- Almashan, M.; Narusue, Y.; Morikawa, H. Decision Tree Regressions for estimating liquid holdup in two-phase gas-liquid flows. In Proceedings of the Abu Dhabi International Petroleum Exhibition & Conference, Abu Dhabi, United Arab Emirates, 9–12 November 2020; Society of Petroleum Engineers: Houston, TX, USA, 2020. [Google Scholar]
- Venna, A.R.; Ang, Y.Y.; Nguyen, N.; Lu, Y.; Walters, D. Support-vector-machine phase classification of downhole leak flows based on acoustic signals. Petrophysics 2018, 59, 841–848. [Google Scholar] [CrossRef]
- Al-Harrasi, A.; Al-maamari, R.S.; Masalmeh, S.K. Laboratory investigation of low salinity waterflooding for carbonate reservoirs. In Proceedings of the Abu Dhabi International Petroleum Conference and Exhibition, Abu Dhabi, United Arab Emirates, 11–14 November 2012; Society of Petroleum Engineers: Houston, TX, USA, 2012. [Google Scholar]
- Alotaibi, M.B.; Nasralla, R.A.; Nasr-El-Din, H.A. Wettability challenges in carbonate reservoirs. In Proceedings of the SPE Improved Oil Recovery Symposium, Tulsa, OK, USA, 24–28 April 2010. [Google Scholar]
- Amiri, S.; Gandomkar, A. Influence of electrical surface charges on thermodynamics of wettability during low salinity water flooding on limestone reservoirs. J. Mol. Liq. 2019, 277, 132–141. [Google Scholar] [CrossRef]
- Austad, T.; Strand, S.; Puntervold, T.; Ravari, R.R. New method to clean carbonate reservoir cores by seawater. In Proceedings of the International Symposium of the Society of Core Analysts (SCA2008-15), Abu Dhabi, United Arab Emirates, 29 October–2 November 2008; Volume 29. [Google Scholar]
- Awolayo, A.; Sarma, H.; AlSumaiti, A.M. A laboratory study of ionic effect of smart water for enhancing oil recovery in carbonate reservoirs. In Proceedings of the SPE EOR Conference at Oil and Gas West Asia, Muscat, Oman, 31 March–2 April 2014; Society of Petroleum Engineers: Houston, TX, USA, 2014. [Google Scholar]
- Awolayo, A.N.; Sharma, H.K. Impact of multi-ion interactions on oil mobilization by smart waterflooding in carbonate reservoirs. J. Pet. Environ. Biotechnol. 2016, 7, 2. [Google Scholar]
- Chandrasekhar, S.; Himanshu, S.; and Mohanty, K.K. Wettability alteration with brine composition in high temperature carbonate rocks. In Proceedings of the SPE Annual Technical Conference and Exhibition, Dubai, United Arab Emirates, 26–28 September 2016; Society of Petroleum Engineers: Houston, TX, USA, 2016. [Google Scholar]
- Chandrasekhar, S.; Sharma, H.; Mohanty, K.K. Dependence of wettability on brine composition in high temperature carbonate rocks. Fuel 2018, 225, 573–587. [Google Scholar] [CrossRef]
- Feldmann, F.; Strobel, G.J.; Masalmeh, S.K.; AlSumaiti, A.M. An experimental and numerical study of low salinity effects on the oil recovery of carbonate rocks combining spontaneous imbibition, centrifuge method and coreflooding experiments. J. Pet. Sci. Eng. 2020, 190, 107045. [Google Scholar] [CrossRef]
- Gupta, R.; Smith, P.G.J.; Hu, L.; Willingham, T.W.; Cascio, M.L.; Shyeh, J.J.; Harris, C.R. Enhanced waterflood for Middle East carbonate cores–Impact of injection water composition. In Proceedings of the SPE Middle East Oil and Gas Show and Conference, Manama, Bahrain, 25–28 September 2011. [Google Scholar]
- Jackson, M.D.; Al-Mahrouqi, D.; Vinogradov, J. Zeta potential in oil-water-carbonate systems and its impact on oil recovery during controlled salinity water-flooding. Sci. Rep. 2016, 6, 1–13. [Google Scholar] [CrossRef] [Green Version]
- Jalilian, M.; Pourafshary, P.; Sola, B.S.; Kamari, M. Optimization of smart water chemical composition for carbonate rocks through comparison of active cations performance. J. Energy Resour. Technol. 2017, 139, 062904. [Google Scholar] [CrossRef]
- Li, S.; Jackson, M.D.; Agenet, N. Role of the calcite-water interface in wettability alteration during low salinity waterflooding. Fuel 2020, 276, 118097. [Google Scholar] [CrossRef]
- Mirchi, V. Pore-Scale investigation of the effect of surfactant on fluid occupancies during low-salinity waterflooding in oil-wet carbonates. In Proceedings of the SPE Annual Technical Conference and Exhibition, Dallas, TX, USA, 24–28 September 2018; Society of Petroleum Engineers: Houston, TX, USA, 2018. [Google Scholar]
- Mohsenzadeh, A.; Pourafshary, P.; Al-Wahaibi, Y. Oil recovery enhancement in carbonate reservoirs via low saline water flooding in presence of low concentration active ions; A case study. In Proceedings of the SPE EOR Conference at Oil and Gas West Asia, Muscat, Oman, 21–23 March 2016; Society of Petroleum Engineers: Houston, TX, USA, 2016. [Google Scholar]
- Nasralla, R.A.; Sergienko, E.; van der Linde, H.A.; Brussee, N.J.; Mahani, H.; Suijkerbuijk, B.M.; Al-Qarshubi, I.S.; Masalmeh, S.K. Demonstrating the potential of low-salinity waterflood to improve oil recovery in carbonate reservoirs by qualitative coreflood. In Proceedings of the Abu Dhabi International Petroleum Exhibition and Conference, Abu Dhabi, United Arab Emirates, 10–13 November 2014; Society of Petroleum Engineers: Houston, TX, USA, 2014. [Google Scholar]
- Nasralla, R.A.; Mahani, H.; van der Linde, H.A.; Marcelis, F.H.; Masalmeh, S.K.; Sergienko, E.; Brussee, N.J.; Pieterse, S.G.; Basu, S. Low salinity waterflooding for a carbonate reservoir: Experimental evaluation and numerical interpretation. J. Pet. Sci. Eng. 2018, 164, 640–654. [Google Scholar] [CrossRef]
- Romanuka, J.; Hofman, J.; Ligthelm, D.J.; Suijkerbuijk, B.; Marcelis, F.; Oedai, S.; Brussee, N.J.; van der Linde, A.; Aksulu, H.; Austad, T. Low salinity EOR in carbonates. In Proceedings of the SPE Improved Oil Recovery Symposium, Tulsa, OK, USA, 14–18 April 2012; Society of Petroleum Engineers: Houston, TX, USA, 2012. [Google Scholar]
- Samanova, A. Surfactant/LSW Flooding in Carbonates: An Investigation of Hybrid EOR Method Design to Improve Oil Displacement. Master’s Thesis, Nazarbayev University, Nur-Sultan, Kazakhstan, 2021. [Google Scholar]
- Shehata, A.M.; Alotaibi, M.B.; Nasr-El-Din, H.A. Waterflooding in carbonate reservoirs: Does the salinity matter? Spe. Reserv. Eval. Eng. 2021, 17, 304–313. [Google Scholar] [CrossRef]
- Tetteh, J.T.; Rankey, E.; Barati, R. Low salinity waterflooding effect: Crude oil/brine interactions as a recovery mechanism in carbonate rocks. In Proceedings of the OTC Brasil Offshore Technology Conference, Houston, TX, USA, 4 May 2017. [Google Scholar]
- Tetteh, J.T.; Barati, R. Crude-oil/brine interaction as a recovery mechanism for low-salinity waterflooding of carbonate reservoirs. SPE Reserv. Eval. Eng. 2019, 22, 877–896. [Google Scholar] [CrossRef]
- Vo, L.T.; Gupta, R.; Hehmeyer, O.J. Ion chromatography analysis of advanced ion management carbonate coreflood experiments. In Proceedings of the Abu Dhabi International Petroleum Conference and Exhibition, Abu Dhabi, United Arab Emirates, 11–14 November 2012; Society of Petroleum Engineers: Houston, TX, USA, 2012. [Google Scholar]
- Winoto, W.; Loahardjo, N.; Xie, S.X.; Yin, P.; Morrow, N.R. Secondary and tertiary recovery of crude oil from outcrop and reservoir rocks by low salinity waterflooding. In Proceedings of the SPE Improved Oil Recovery Symposium, Tulsa, OK, USA, 14–18 April 2012; Society of Petroleum Engineers: Houston, TX, USA, 2012. [Google Scholar]
- Yousef, A.A.; Al-Saleh, S.; Al-Jawfi, M.S. Improved/enhanced oil recovery from carbonate reservoirs by tuning injection water salinity and ionic content. In Proceedings of the SPE Improved Oil Recovery Symposium, Tulsa, OK, USA, 14–18 April 2012; Society of Petroleum Engineers: Houston, TX, USA, 2012. [Google Scholar]
- Babuška, R.; Kober, J. Knowledge-Based Control Systems; Delft University of Technology: Delft, The Netherlands, 2010. [Google Scholar]
- Kitts, B. Representation operators and computation. Minds Mach. 1999, 9, 223–240. [Google Scholar] [CrossRef]
- Schuetter, J.; Mishra, S.; Zhong, M.; LaFollette, R. Data analytics for production optimization in unconventional reservoirs. In Proceedings of the Unconventional Resources Technology Conference, San Antonio, TX, USA, 20–22 July 2015; pp. 249–269. [Google Scholar]
- Vapnik, V.; Guyon, I.; Hastie, T. Support vector machines. Mach. Learn. 1995, 20, 273–297. [Google Scholar]
- Alkinani, H.H.; Al-Hameedi, A.T.; Dunn-Norman, S. Predicting the risk of lost circulation using Support Vector Machine model. In Proceedings of the 54th US Rock Mechanics/Geomechanics Symposium, Golden, CO, USA, 28 June–1 July 2020. [Google Scholar]


| Parameter | Number of Data Points | |
|---|---|---|
| Secondary Mode | Tertiary Mode | |
| Porosity, % | 20 | 112 |
| Permeability, mD | 28 | 117 |
| Initial water saturation Swi, % | 23 | 116 |
| Formation water composition, ppm | 26 | 117 |
| Formation water salinity, ppm | 24 | 114 |
| Secondary injected brine composition, ppm | 25 | 114 |
| Secondary injected brine salinity, ppm | 25 | 116 |
| Tertiary injected brine composition, ppm | - | 112 |
| Tertiary injected brine salinity, ppm | - | 114 |
| Crude oil acid number, mgKOH/g | 7 | 87 |
| Crude oil base number, mgKOH/g | 1 | 64 |
| Viscosity of oil, cp | 16 | 106 |
| Density of oil, cp | 25 | 98 |
| Residual oil saturation Sor, % | 7 | 37 |
| pH of effluent brine | 0 | 27 |
| Test temperature, °C | 8 | 100 |
| Secondary recovery factor, %OOIP | 28 | 117 |
| Tertiary recovery factor, %OOIP | - | 117 |
| IFT, mN/m | 5 | 25 |
| Contact angle | 2 | 27 |
| Effluent cations concentration, ppm | 3 | 20 |
| Effluent SO42− concentration, ppm | 1 | 9 |
| Pressure drop, psi | 2 | 60 |
| Zeta potential | 9 | 18 |
| Parameter | Min | Max | Mean |
|---|---|---|---|
| Permeability, mD | 0.40 | 200.60 | 32.70 |
| Low salinity, ppm | 0 | 193,230 | 22,315 |
| SO42− concentration (LS), ppm | 0 | 9222 | 930 |
| Cation concentration (LS), ppm | 0.0 | 13,454.5 | 1416.0 |
| SO42− concentration (HS), ppm | 0 | 4290 | 534 |
| Cation concentration (HS), ppm | 14.34 | 61,480.00 | 15,879.00 |
| AN, mgKOH/g | 0.08 | 4.60 | 0.57 |
| BN, mgKOH/g | 0.01 | 2.49 | 0.50 |
| Temperature, °C | 20 | 250 | 88 |
| Models | Number of Simulations | |||||
|---|---|---|---|---|---|---|
| 100 | 1000 | 5000 | ||||
| Training R | Testing R | Training R | Testing R | Training R | Testing R | |
| SVM | 0.711 | 0.598 | 0.718 | 0.611 | 0.730 | 0.611 |
| DT | 0.678 | 0.657 | 0.685 | 0.613 | 0.687 | 0.628 |
| ANN | 0.751 | 0.527 | 0.759 | 0.592 | 0.754 | 0.593 |
| Number of Layers | Number of Neurons | Results | |
|---|---|---|---|
| Training R | Testing R | ||
| 1 | 2 | 0.162 | 0.034 |
| 1 | 4 | 0.204 | 0.044 |
| 2 | 2 | 0.150 | 0.017 |
| Parameters | Number of Data Points | Correlation Coefficient R | Strength of Relationship * | |
|---|---|---|---|---|
| Rock | Permeability | 118 | 0.1721 | Negligible |
| Brine | Low salinity | 117 | 0.1059 | Negligible |
| Change in salinity | 117 | 0.0460 | Negligible | |
| Cations | 110 | 0.0290 | Negligible | |
| SO42− | 107 | 0.1593 | Negligible | |
| Oil | AN | 80 | 0.1848 | Negligible |
| BN | 60 | 0.2334 | Weak | |
| Temperature | T | 98 | 0.2647 | Weak |
| Variable | R | Adjusted R2 | p-Value | No of Data Points | Strength of Relationship * |
|---|---|---|---|---|---|
| C + DC | 0.088 | −0.0028 | 1.89 × 10⁻⁵; 0.39 | 96 | Negligible |
| C + DC + DS | 0.095 | −0.0012 | 2.7 × 10⁻⁵; 0.39; 0.73 | 96 | Negligible |
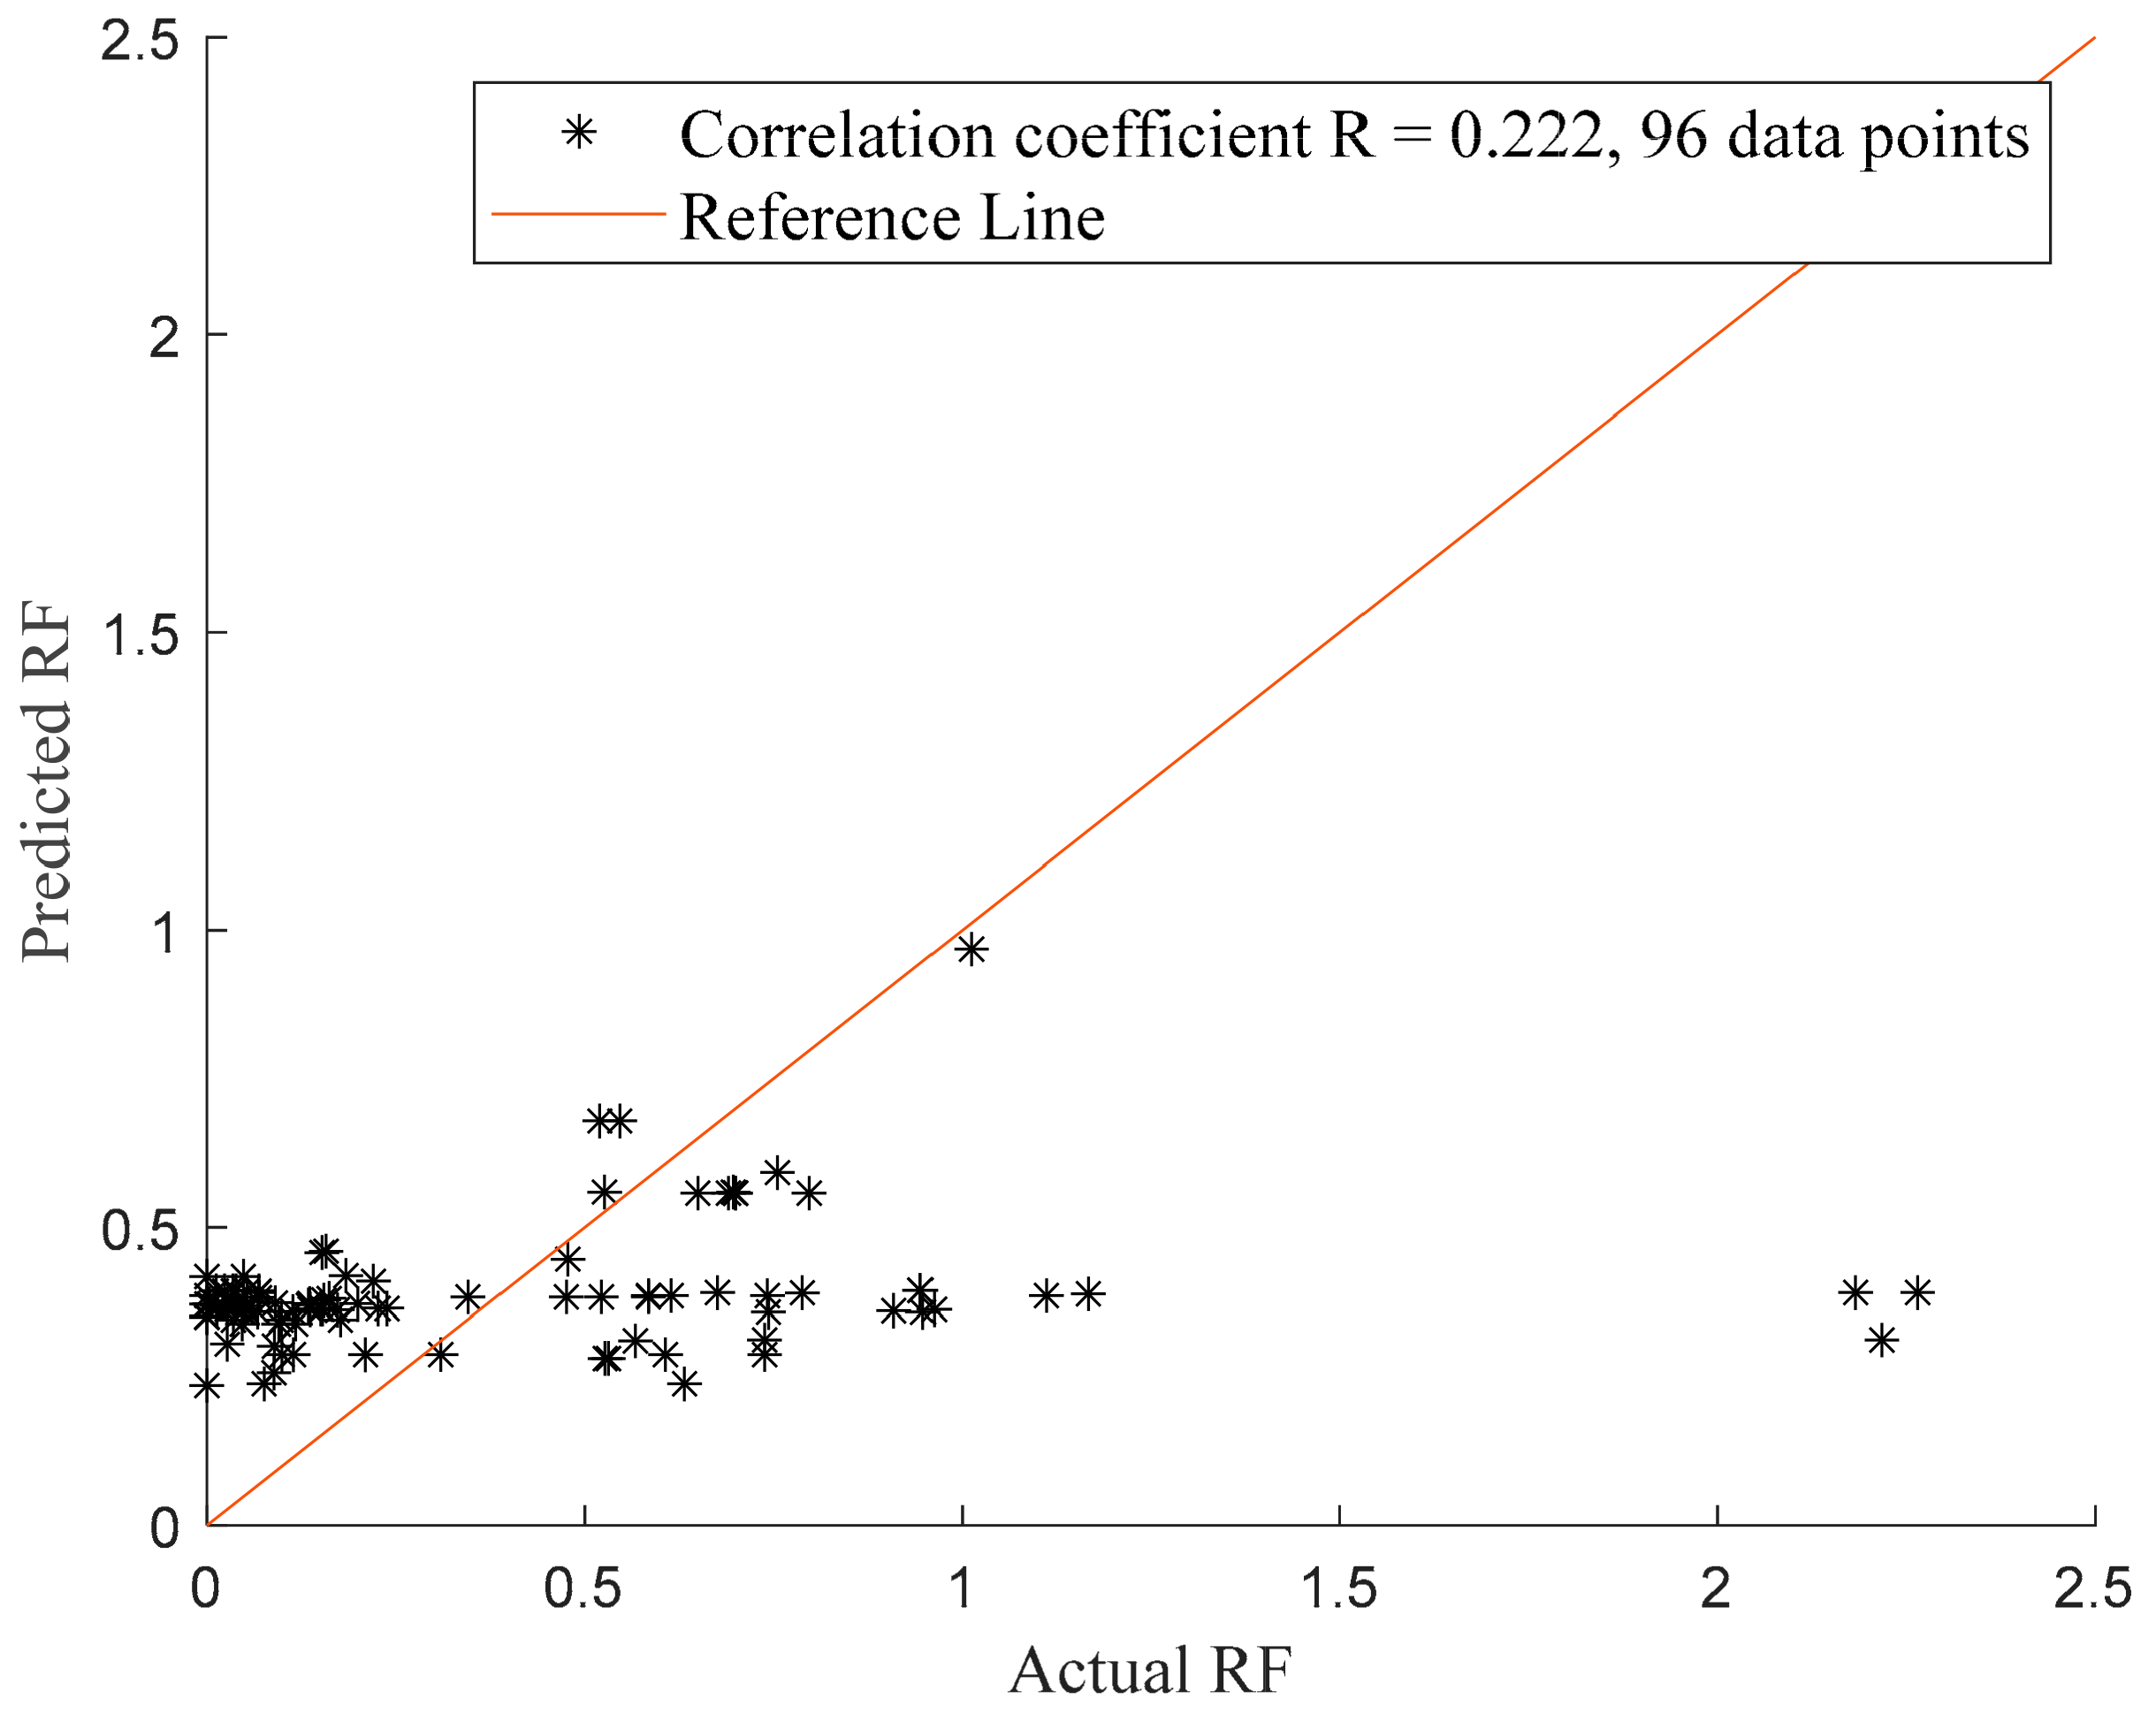
| C + DC + DS + DTDS | 0.222 | 0.0181 | 0.14; 0.09; 0.05; 0.77 | 96 | Weak |
| C + DC + AB | 0.200 | −0.0090 | 0.001; 0.35; 0.23 | 42 | Weak |
| C + DC + AB + DTDS | 0.278 | 0.0044 | 0.6; 0.3; 0.21; 0.22 | 42 | Weak |
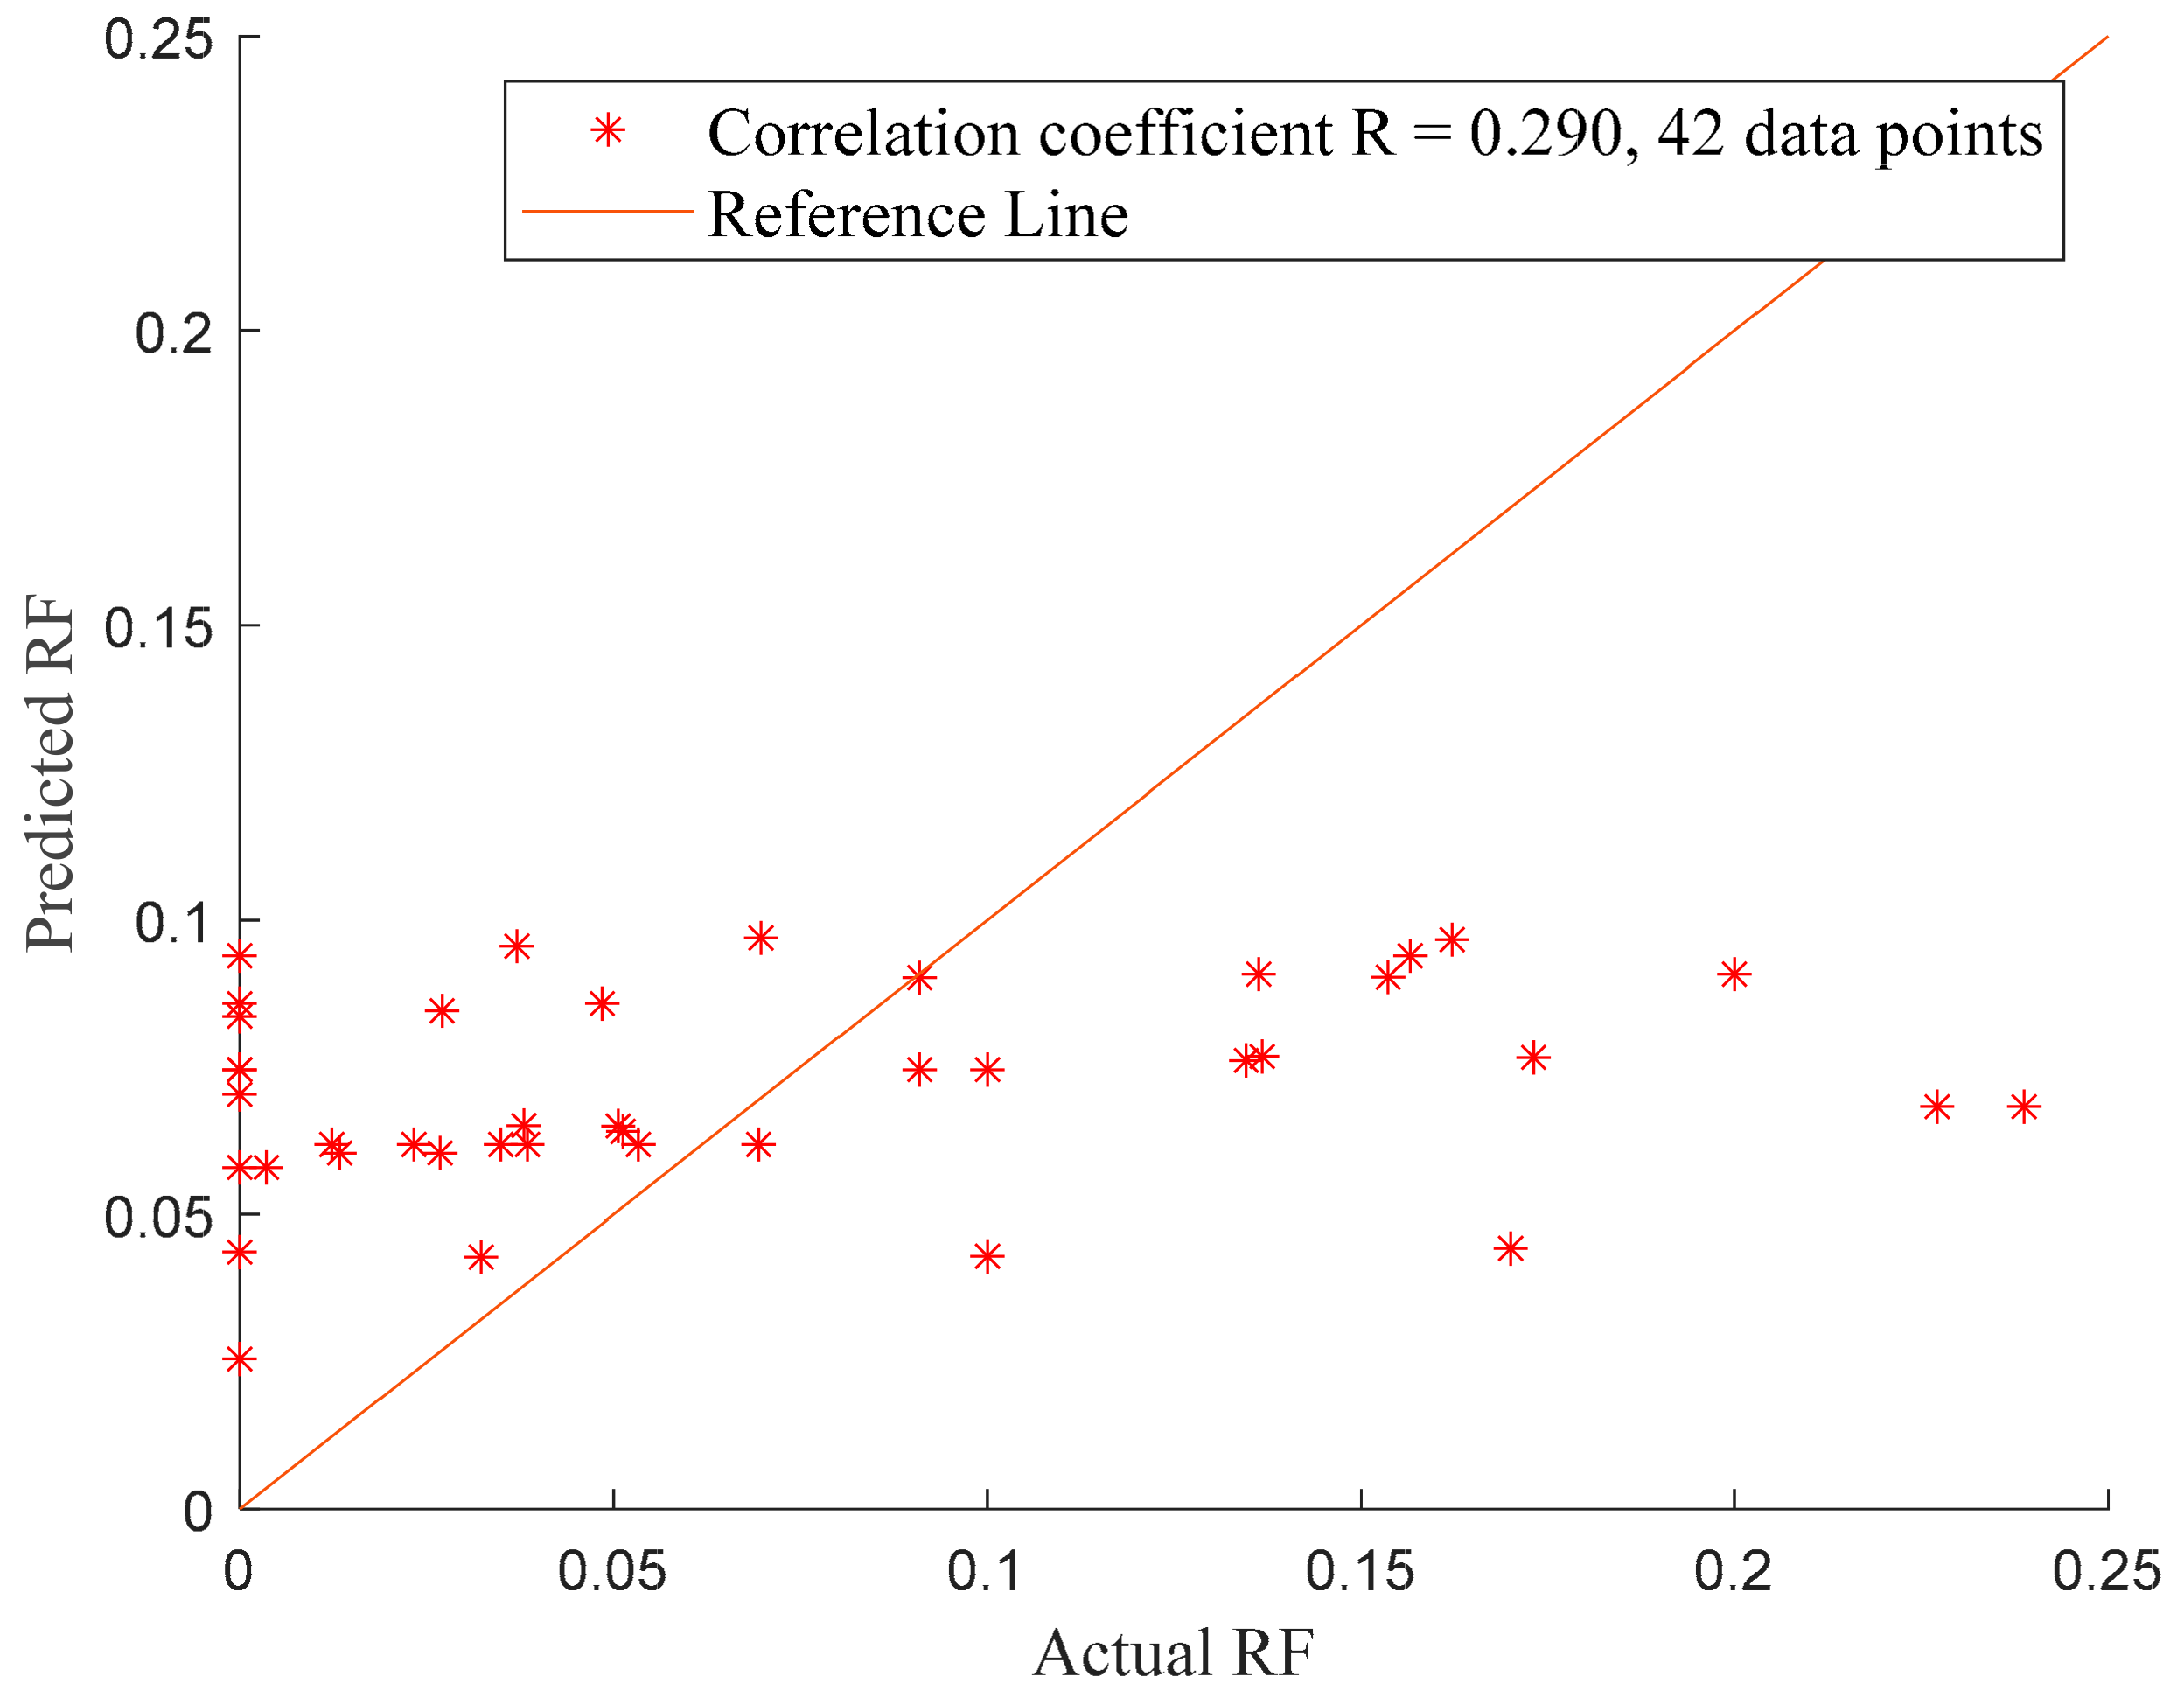
| C + DC + AB + DTDS + DS | 0.290 | −0.0150 | 0.72; 0.31; 0.29; 0.19; 0.60 | 42 | Weak |
| Parameters | Number of Data Points | Model | Average R for Training Data | Average R for Testing Data |
|---|---|---|---|---|
| DC + DS + DTDS | 96 | ANN | 0.20 | 0.04 |
| SVM | 0.24 | 0.18 | ||
| DT | 0.57 | 0.35 | ||
| DC + DS + DTDS + AB | 42 | ANN | 0.75 | 0.59 |
| SVM | 0.73 | 0.61 | ||
| DT | 0.68 | 0.63 |
| Parameters | Model | Strength of Relationship * | |
|---|---|---|---|
| Training Data | Testing Data | ||
| DC + DS + DTDS | ANN | Weak | Negligible |
| SVM | Weak | Negligible | |
| DT | Strong | Moderate | |
| DC + DS + DTDS + AB | ANN | Very strong | Strong |
| SVM | Very strong | Strong | |
| DT | Strong | Strong | |
| Paper | Mg2+ | Ca2+ | SO42− | Proposed Mechanism |
|---|---|---|---|---|
| Austad et al., 2012 | Increase | Increase | Rock dissolution | |
| Chandrasekhar et al., 2016 | No change | Increase | Increase | Rock dissolution |
| Awolayo et al., 2014 | Decrease | Decrease | MIE | |
| Awolayo et al., 2016 | Increase | Decrease | Rock dissolution | |
| Gupta et al., 2011 | No change | Increase | Rock dissolution | |
| Mohammadkhani et al., 2018 | Increase | Decrease | MIE | |
| Vo et al., 2012 | No change | Increase | Rock dissolution | |
| Chandreskaer et al., 2018 | Decrease | Decrease | MIE |
Publisher’s Note: MDPI stays neutral with regard to jurisdictional claims in published maps and institutional affiliations. |
© 2021 by the authors. Licensee MDPI, Basel, Switzerland. This article is an open access article distributed under the terms and conditions of the Creative Commons Attribution (CC BY) license (https://creativecommons.org/licenses/by/4.0/).
Share and Cite
Salimova, R.; Pourafshary, P.; Wang, L. Data-Driven Analyses of Low Salinity Waterflooding in Carbonates. Appl. Sci. 2021, 11, 6651. https://doi.org/10.3390/app11146651
Salimova R, Pourafshary P, Wang L. Data-Driven Analyses of Low Salinity Waterflooding in Carbonates. Applied Sciences. 2021; 11(14):6651. https://doi.org/10.3390/app11146651
Chicago/Turabian StyleSalimova, Rashida, Peyman Pourafshary, and Lei Wang. 2021. "Data-Driven Analyses of Low Salinity Waterflooding in Carbonates" Applied Sciences 11, no. 14: 6651. https://doi.org/10.3390/app11146651
APA StyleSalimova, R., Pourafshary, P., & Wang, L. (2021). Data-Driven Analyses of Low Salinity Waterflooding in Carbonates. Applied Sciences, 11(14), 6651. https://doi.org/10.3390/app11146651