Article

Stiffening Effect of Fillers Based on Rheology and Micromechanics Models

1
Department of Transportation Engineering and Management, University of Engineering and Technology, Lahore 54890, Pakistan
2
Department of Civil Engineering, Universiti Kebangsaan Malaysia, Bangi 43600, Selangor, Malaysia
3
Nottingham Transportation Engineering Centre, University of Nottingham, Nottingham NG7 2RD, UK
*
Authors to whom correspondence should be addressed.
Appl. Sci. 2021, 11(14), 6521; https://doi.org/10.3390/app11146521
Submission received: 1 May 2021 / Revised: 27 June 2021 / Accepted: 2 July 2021 / Published: 15 July 2021
(This article belongs to the Section Civil Engineering)

Abstract

:
The aggregate in an asphalt mixture is coated with mastic consisting of bitumen (dilute phase) and filler (particulates phase). The interaction of bitumen and filler and packing of filler plays an important role in the properties of mastics. The micromechanics models from composite rheology can be used to predict the stiffening effect of a suspension. In this research, the stiffening effect of fillers was investigated based on the rheology of mastic. The frequency sweep tests in a dynamic shear rheometer at different temperatures were performed within a linear viscoelastic range to construct the master curves. The volume fractions were expressed as compositional volumes of filler in mastic. The particle shape and surface texture are determined through microscopy. We used six micromechanics-based models to predict the stiffening potential of fillers in mastics. The models include Maron–Pierce, Lewis Nielsen, Mooney, Krieger–Dougherty, Chong, Robinson, and Hashin Models. The results show that the same volume content of filler has a different effective volume. The fillers increase the stiffening effect of the composite, especially at high temperatures. The behaviour of fillers with similar effective volume and packing is identical. The filler type affects the stiffening of mastics. Micromechanics modelling results show that most models show an accurate stiffening effect at lower concentrations with the exception of the Chong Model. The Maron–Pierce Model under-estimates the stiffening potential for granite mastic at higher concentrations beyond the 30% filler content fraction. The value of maximum packing fraction (ϕm) and Einstien coefficient (KE) in the Mooney model are significantly different from other models for limestone and granite, respectively. The line of equality graph shows good agreement of measured and predicted stiffness. It is difficult to precisely model the mastic data with any single model due to the presence of complex stiffening effects beyond volume filling.

1. Introduction

Asphalt mixture is composed of bitumen, aggregate, and mineral filler [1]. The mixture is effectively a three-phase system consisting of aggregate, mastic, and air voids. The mastic consists of bitumen (dilute phase) and filler (particulates phase). The fillers are suspended in the bitumen matrix phase without particle–particle contact. The dispersion results in the formation of a colloidal suspension system. The mastic affects the rheology and mechanical performance of asphalt mixtures.
The reinforcement role of filler is of volume-filling, physiochemical, and particle-interaction [1,2]. In numerous studies, the positive role of filler has consistently been discussed in asphalt pavements [3,4,5,6,7,8,9,10]. Some of the fillers, such as hydrated lime, are competitive with polymer additives [11].
Anderson showed that mineral filler affects the mastic by increasing its stiffness and moisture resistance [12]. In terms of complex modulus, the filler has an enhanced effect at high temperatures. Bitumen becomes softer at a higher temperature, while filler remains as a rigid entity. This combined effect is useful in reducing the tendency of rutting in hot weather [4]. The filler also acts as an extender, increases workability, and improves ageing characteristics [6]. Chen et al. have discussed the effect of mineral fillers in asphalt mixtures with its historical development along with the effect of filler on temperature, moisture, ageing, and fatigue characteristics [13].
The increase in stiffness is quite a complex phenomenon, which has not been fully understood yet. Studies have tried to simplify this complex problem while attempting to reduce it to a few parameters. In 1998, Shashidhar and Romero reported on the use of traditional as well as non-traditional approaches towards the stiffening potential [8].
One of the earliest references in 1915 is the work of Richardson on bitumen-filler suspension [14]. The role of the filler is not only void-filling, but it also includes some sort of physicochemical interaction between filler and bitumen. Limestone and Portland cement are considered to be better fillers as they adsorb a thicker layer of bitumen. The packing of filler plays an important role in the properties of mastics. The void content of the filler is the most important parameter to influence the properties of a mastic [10]. In 1947, Rigden showed that interaction between bitumen and filler is best explained by the theory of packing particles [15]. According to Anderson and Goetz, the Rigden work on fillers provides a baseline for research on fillers. The Rigden voids incorporate the effect of the secondary properties of the filler in mastic suspension [15,16]. These properties include bulk density, fractional voids, void diameter, and permeability of fillers, etc. The secondary properties are dependent on the intrinsic (primary) properties, including particle density, shape, texture, grain distribution, and surface area.
The viscoelastic properties (viscosity, complex shear modulus, phase angle, and relaxation) of the mastic are dependent on the bitumen and dispersion of filler. A conceptual model was proposed by Faheem and Bahia to understand the mechanism of the filler stiffening effect in the diluted and concentrated regions of mastics. The Einstein coefficient (KE) and maximum packing fraction (φm) are more useful as compared to Rigden voids. This is because Rigden voids ignore the effect of filler agglomeration on the stiffening effect [15,17]. The high dispersion of filler in bitumen is indicated with a low value of maximum packing fraction, and KE shows a stiffening rate of mastics [13]. According to Shashidhar and Romero, KE and φm are the important parameters to predict the stiffening effect, i.e., M/M1 = f ( ϕ m , K E ) , . where M is any modulus (shear, elastic, etc.) and corresponds to the properties of mastic (M) and bitumen (M1) [8]. Some studies have taken φm as constant at 0.63 for mastics because this value indicates an approximate suspension in which particles are well dispersed [11,18].
The micromechanics–rheology models from colloid science are used to calculate the theoretical stiffening ratio (a measure of stiffening potential). These models can predict stiffening potential from the properties of the individual ingredients. Most of these models are either (a) direct or indirect modifications of Einstein’s equation of a particulate suspension system or (b) can be computed from an elastic analysis of two-component systems. Examples of these models include the Maron–Pierce Model, Lewis and Nielsen Model, Mooney’s Equation, Krieger–Dougherty Model, Chong Model, Robinson Model, Hashin Model, and Christensen and Lo Model. The Hashin and Christensen and Lo are widely used models to compute the stiffening ratio of mastic and bitumen [2,19,20]. A comprehensive list of the models to compute the viscosity of the suspension is given by Huang et al. and Hesami et al. [21,22]. On the downside, these micromechanics-based models do not incorporate the physicochemical interaction of bitumen fillers in mastics. In this research, the stiffening effect of fillers was investigated based on the rheology of mastic using a dynamic shear rheometer (DSR). The micromechanics models were used to predict the stiffening effect of limestone and granite in mastics.

2. Materials and Methods

2.1. Materials and Specimen Preparation

In this research, a medium penetration grade of bitumen (40/60) was used. The fillers included limestone, ordinary Portland cement (OPC), gritstone, and granite. These fillers were passing sieve 63 µm and were used in an oven-dried form. The rheology-based stiffening effect was studied for all types of fillers. In the use of the micromechanics models, limestone (basic) and granite (acidic) were selected. The sample preparation involved mixing bitumen with the desired percentage of filler.
The bitumen was preheated in an oven at 160 °C for sufficient time (2 h) to ensure bitumen was ready to pour. It was occasionally stirred to remove the air bubbles and to ensure thorough mixing. It was then placed on a hot plate for mastic preparation. Bitumen was stirred for 30 s by hand. After this, a desired quantity of filler was added slowly, and hand stirring was continued for 4.5 min. The filler was added stepwise, and it was made sure that no filler touched the sides of the pan or fell as a lump. In the mixing process, mastic was continuously stirred as it cooled down until the temperature became low (75 °C) to prevent settling of filler at high temperature.

2.2. Testing

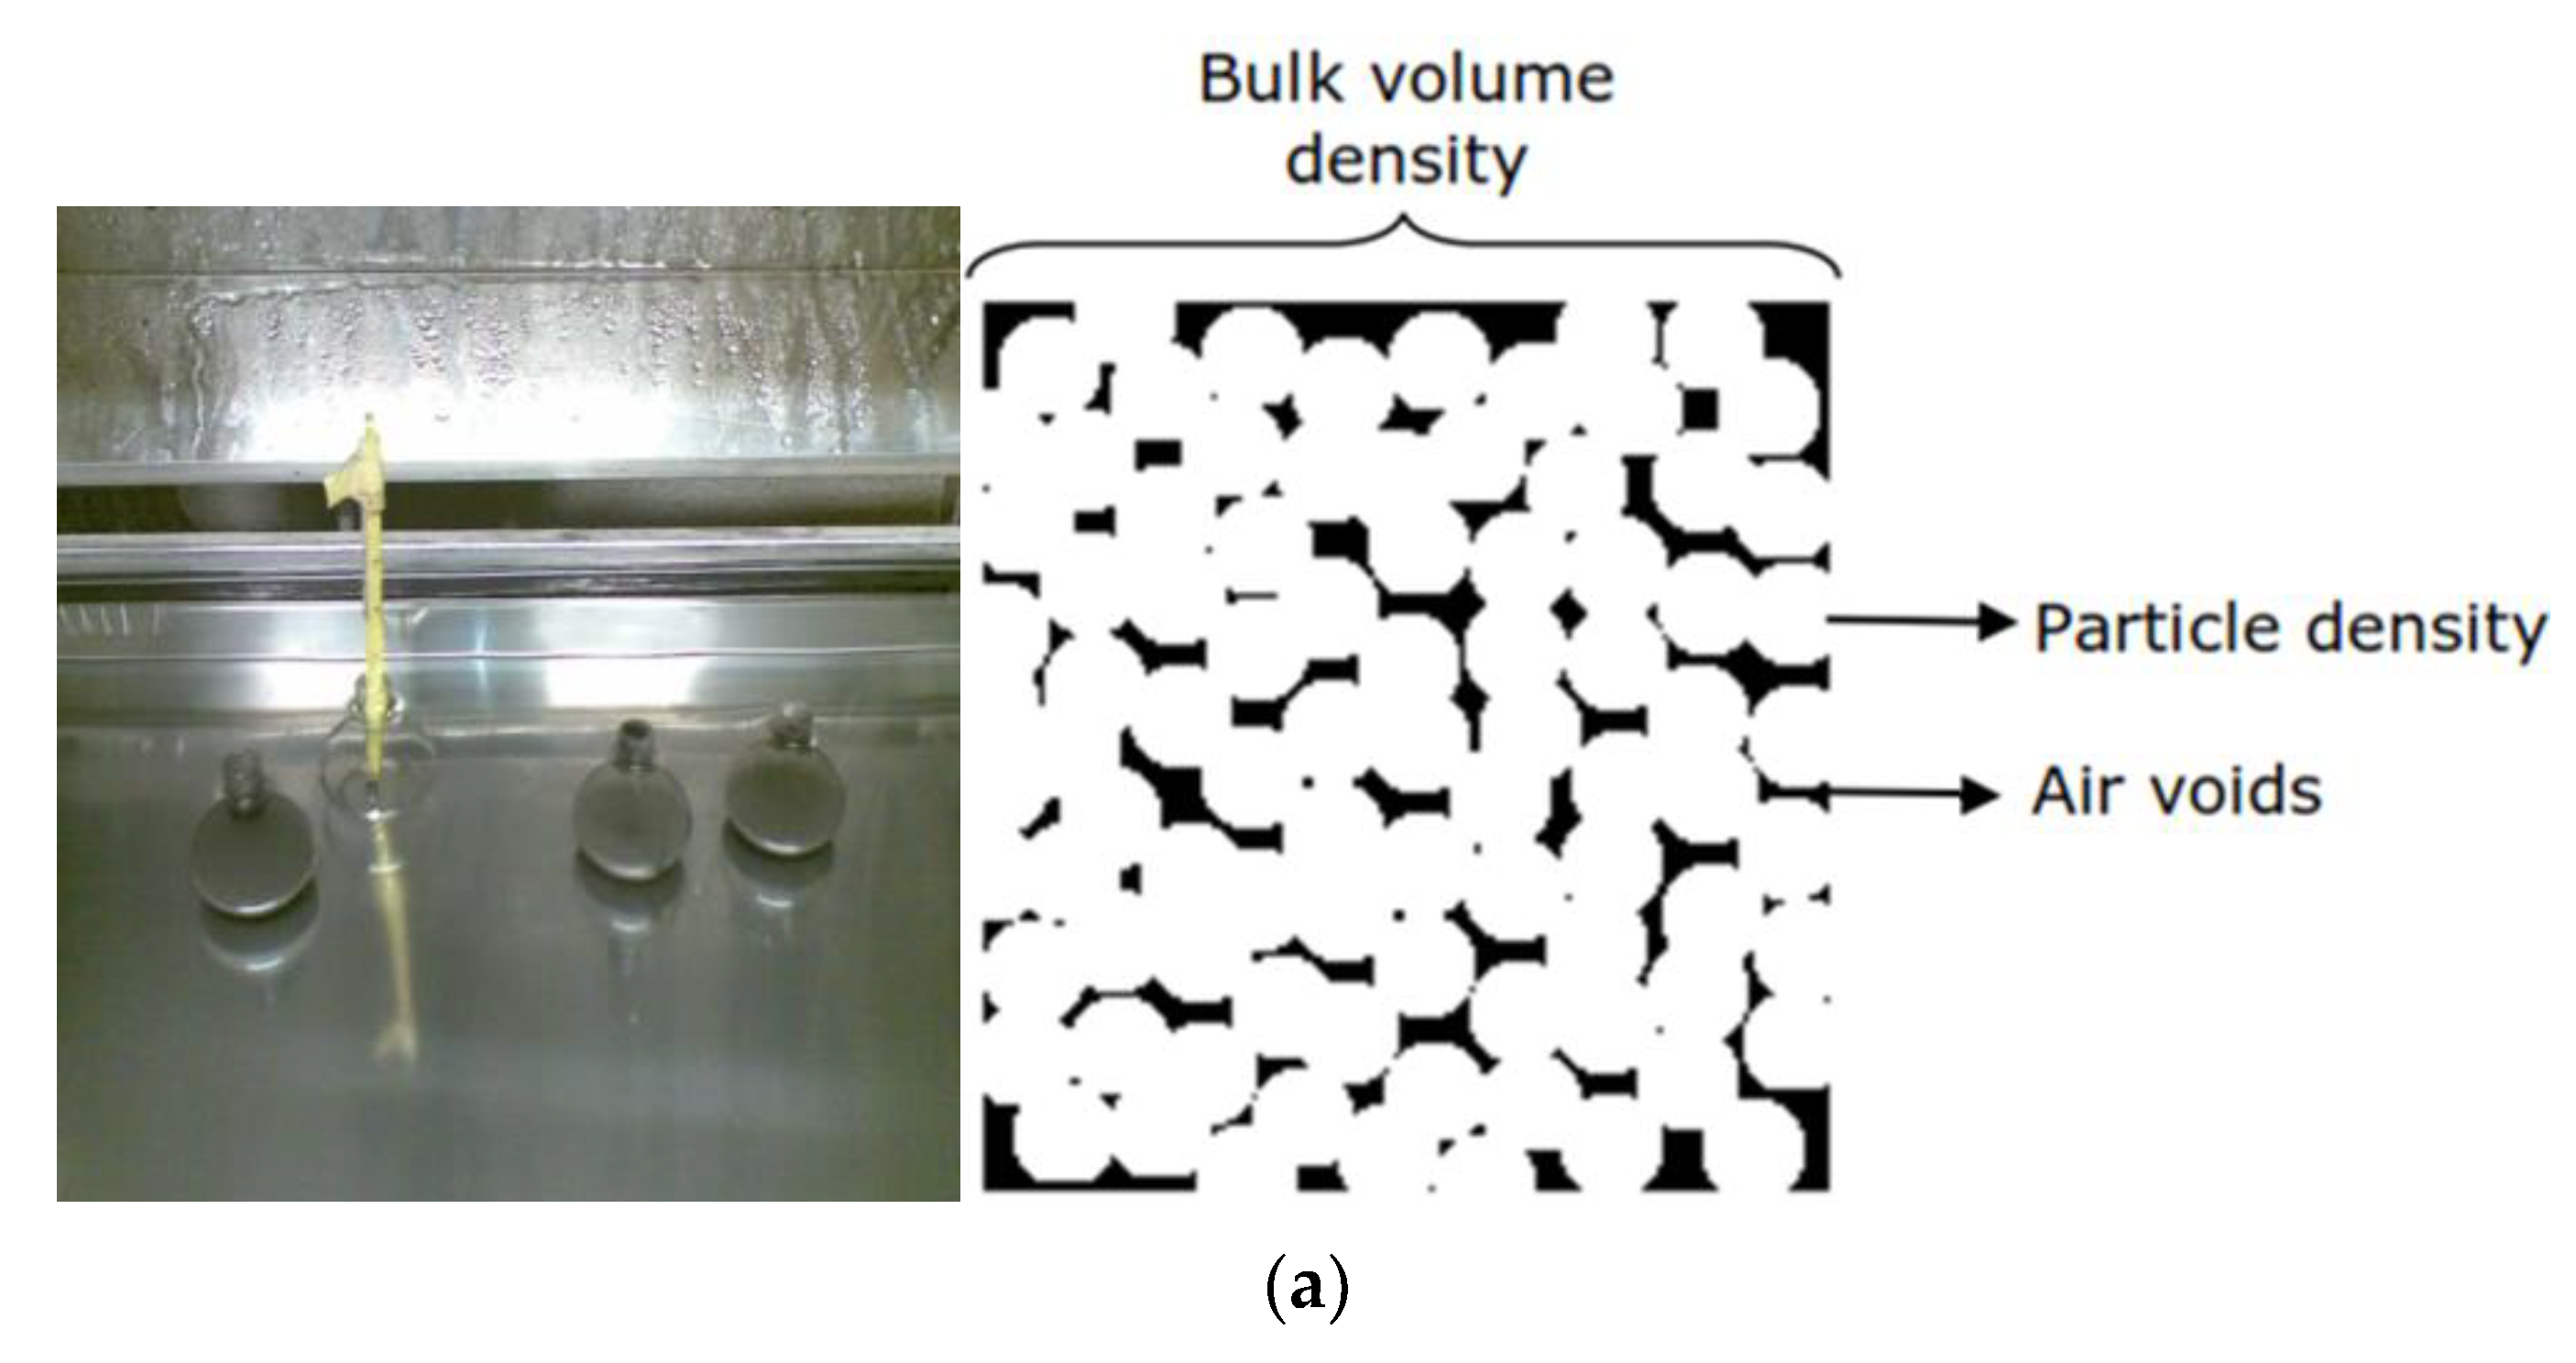
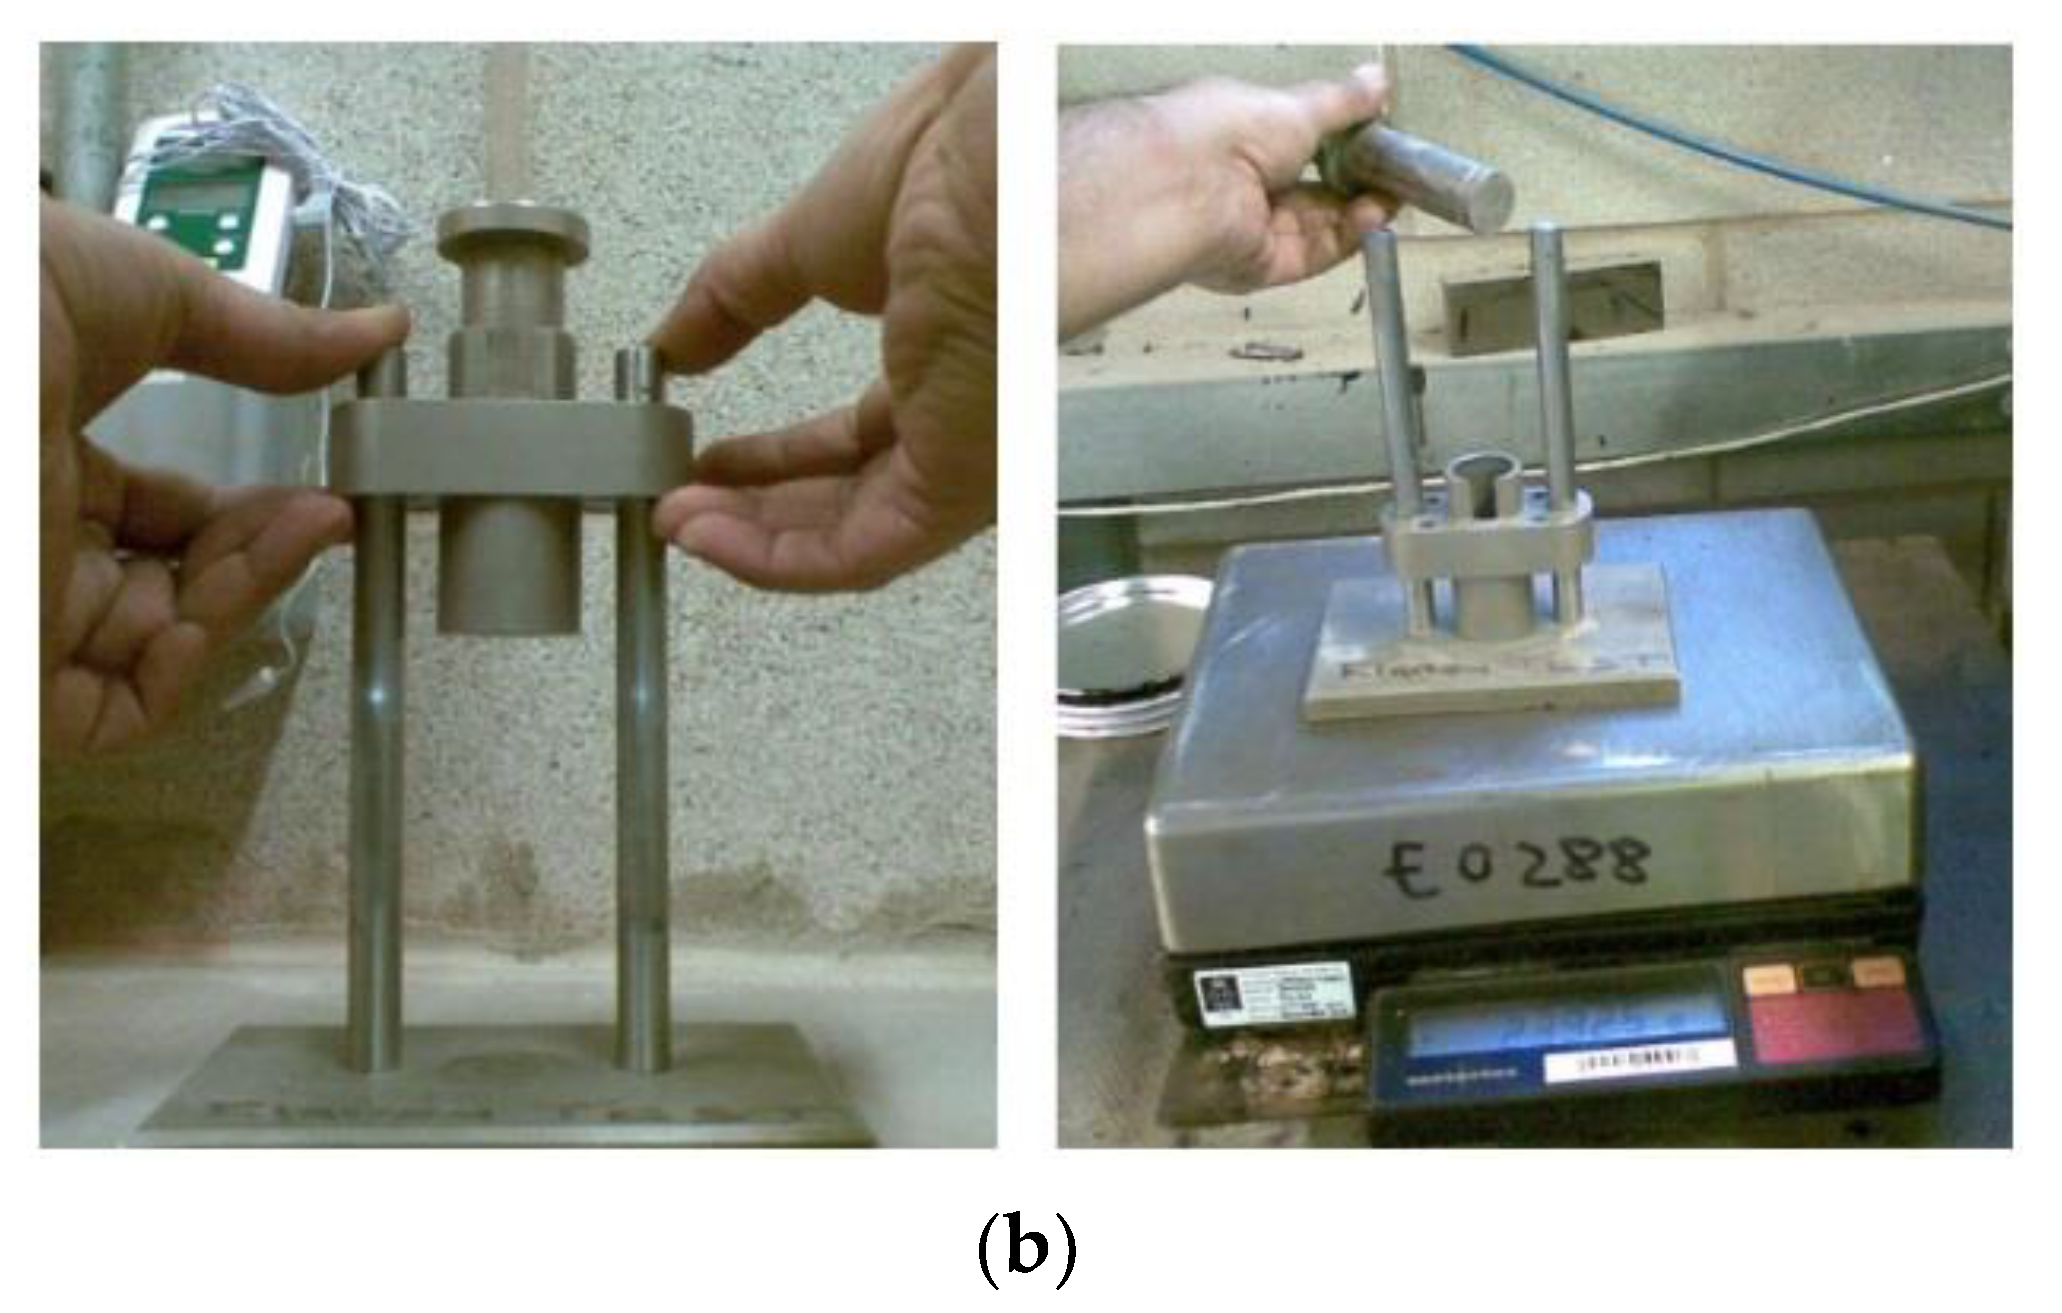
2.2.1. Physical Properties

The physical properties of bitumen are listed in Table 1. The softening point was measured with a ring and ball apparatus with an average value of 50.4. The density of bitumen and particle density of filler was measured by the pycnometer method at 25 °C (Figure 1a). Limestone and granite filler particle density were 2.62 and 2.71 g/cm3, respectively. The Rigden voids were determined as per BS EN 1097-4:2008 for the volume of compacted filler (Figure 1b). The particle density of filler was then used to calculate the percentage of air voids in the compacted filler. Some of the physical properties of fillers are presented in Table 2. The mastics concentration used in this research were 40, 30, and 20% by volume of bitumen, corresponding to 29, 23, and 17% compositional volume (Vf), respectively. The filler was selected on a volumetric basis instead of a mass basis [23].

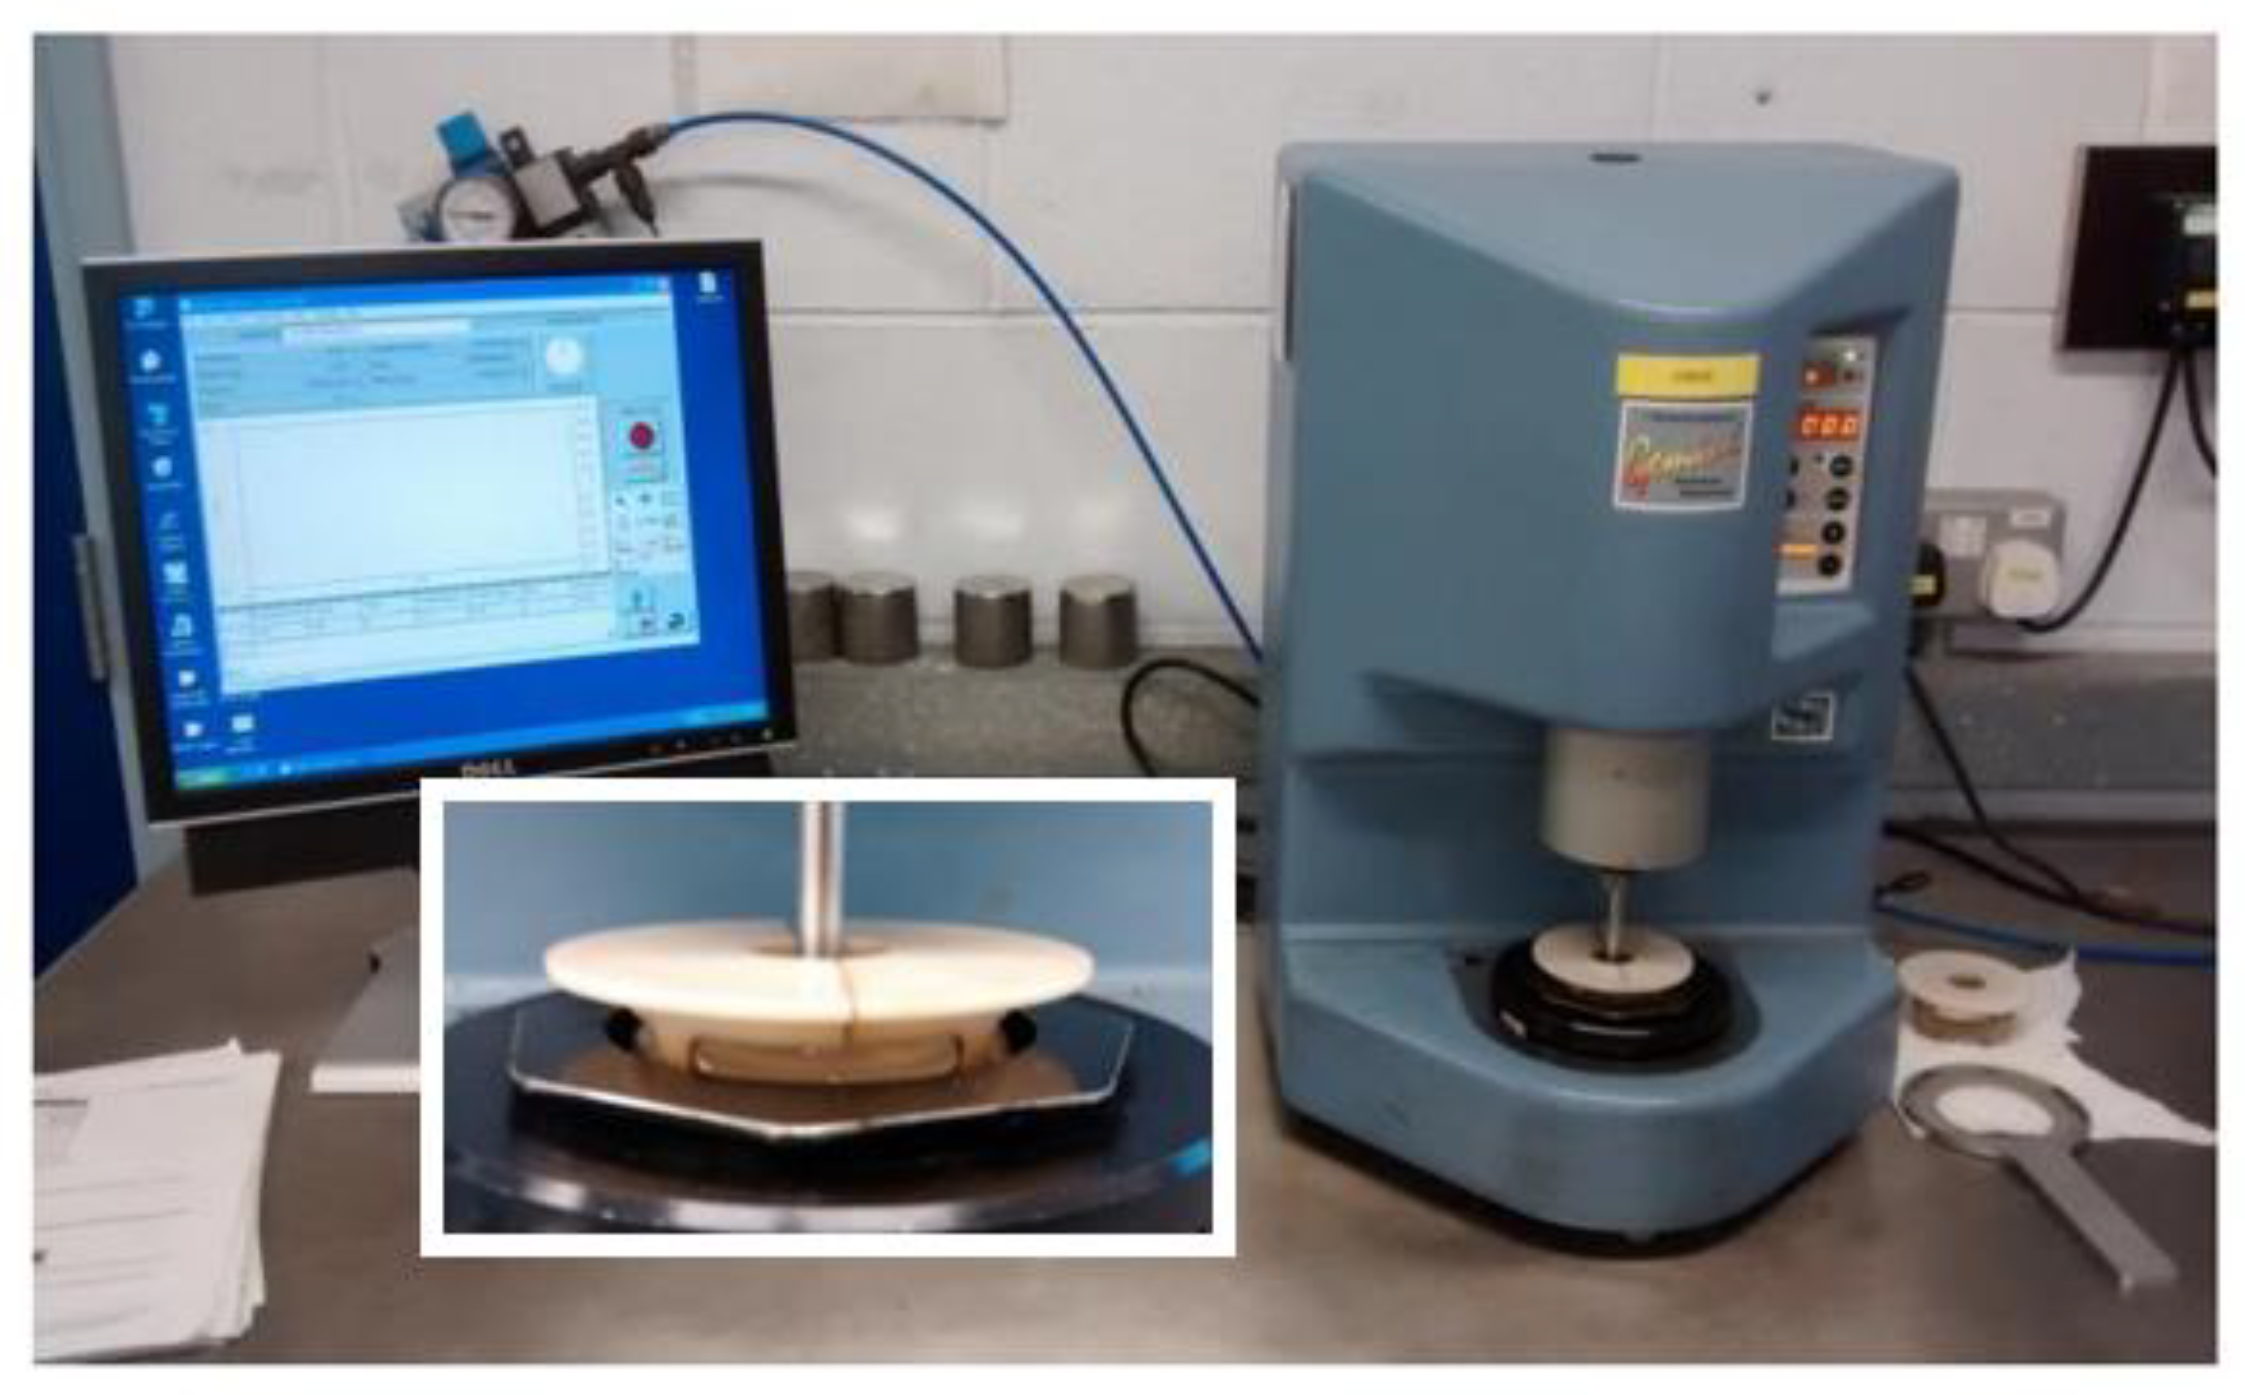
2.2.2. Rheological Properties

Rheological properties were tested with a dynamic shear rheometer (DSR) at intermediate temperatures, as shown in Figure 2. Bitumen from vials was heated to a temperature of 160 °C for 15 min with occasional stirring. It was then poured into silicon moulds to yield bitumen discs of sizes 8 and 25 mm. The bitumen discs were introduced in the DSR to achieve a film thickness of 2 and 1 mm for 8 and 25 mm plates, respectively. The amplitude sweep test was performed to measure the limit of viscoelasticity. After the amplitude test, the material response to cyclic loading was measured as complex shear modulus and phase angle. The response was measured, within the linear viscoelastic range, through the frequency sweep test from 10 to 80 °C with an interval of 5 °C. The response at different temperatures was converted to construct the master curves [10].

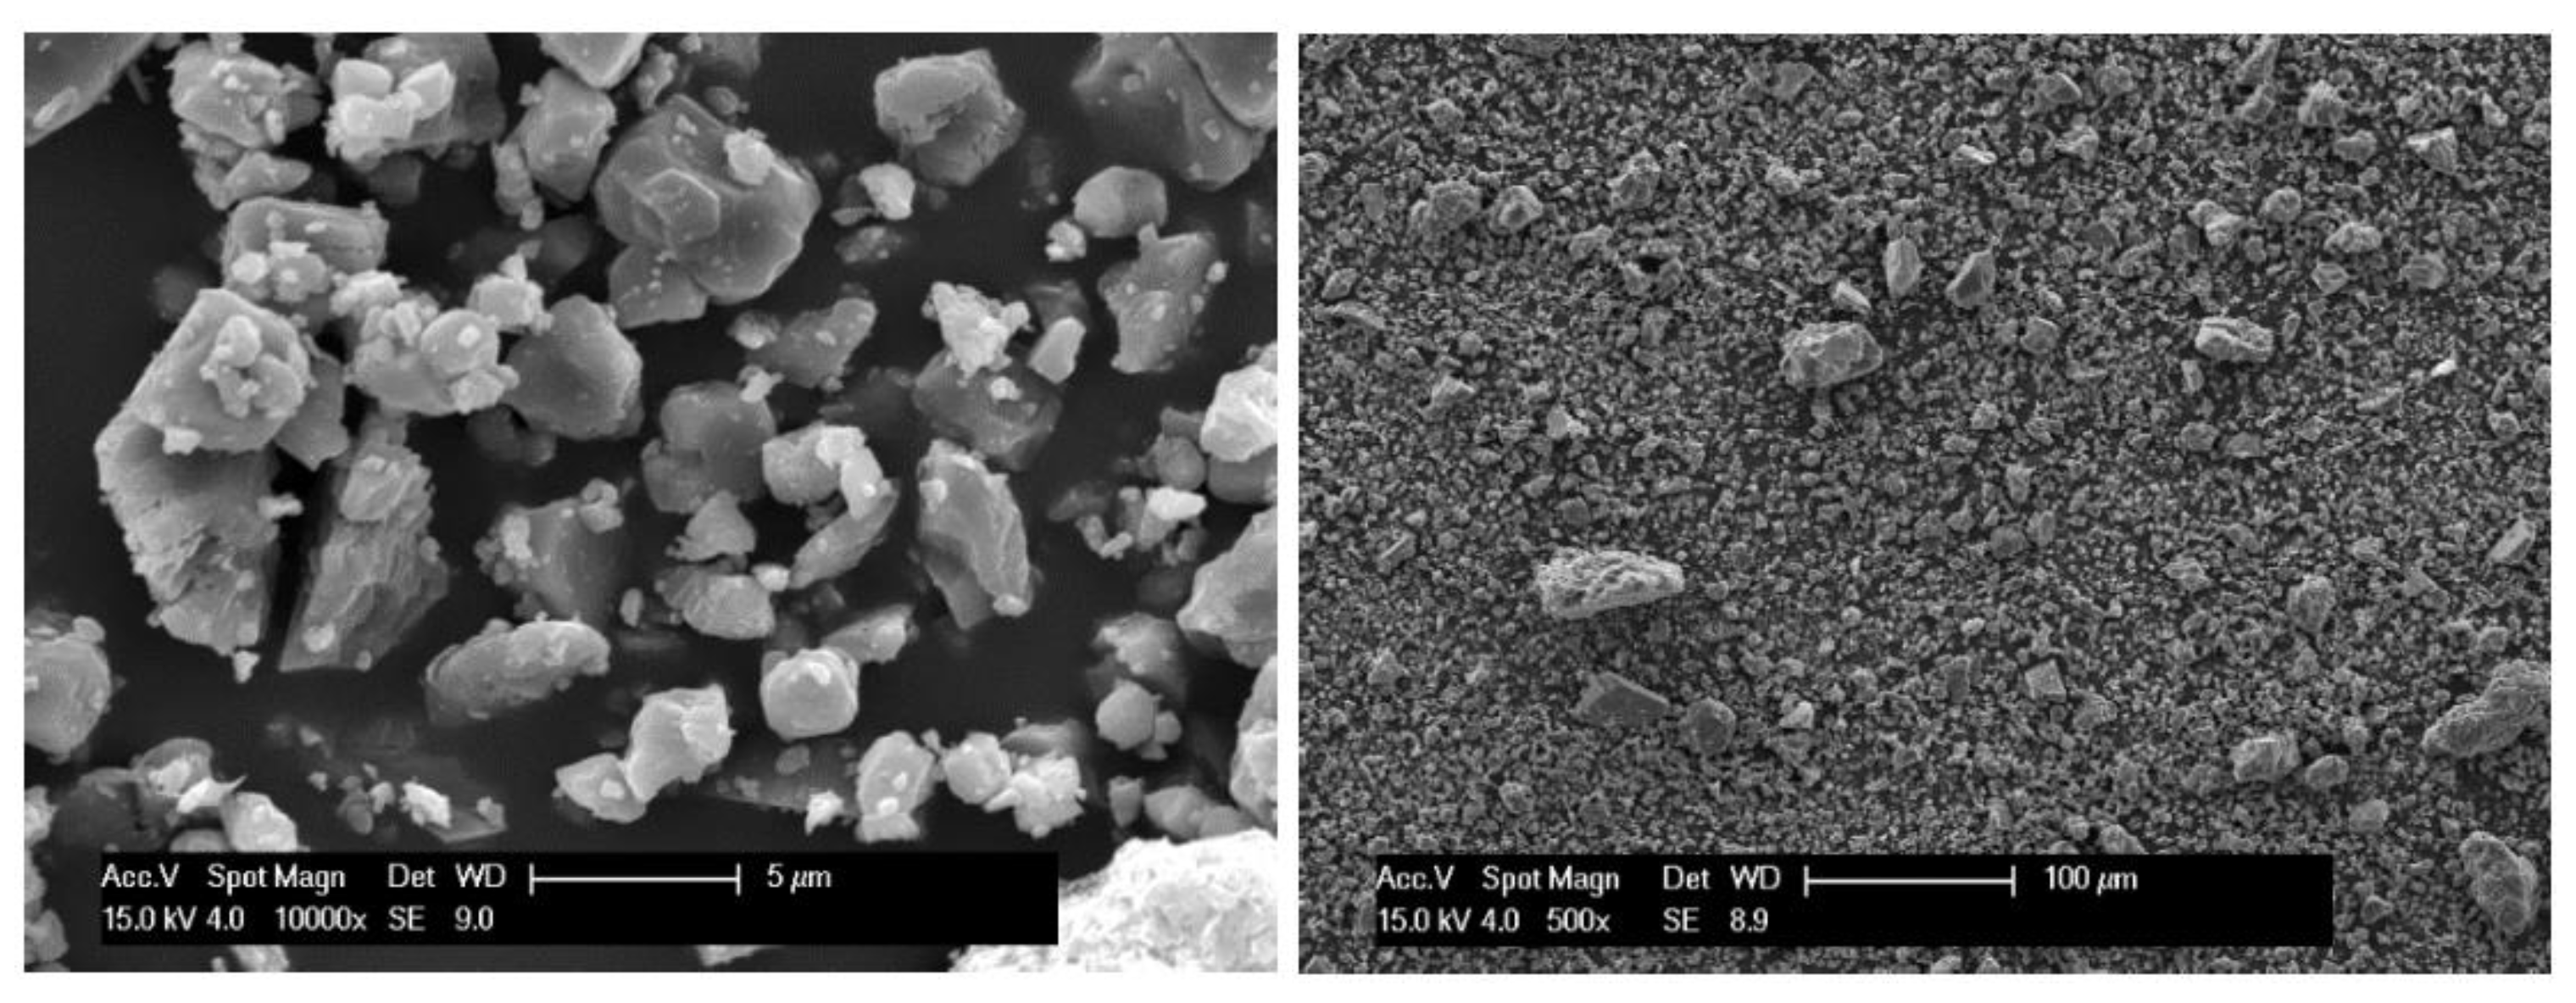
2.2.3. Scanning Electron Microscopy (SEM) and X-ray Diffraction (XRD)

The particle shape and surface texture were determined through Scanning Electron Microscopy (SEM). The electron beam was scanned directly on the material’s surface, and this produced various signals, which were then analysed [24]. In this research, the backscattered electron imaging (BSE) was used to determine the shape of the particle at spot magnification levels 500× and 10,000×. The acidic/basic character of fillers was examined through mineralogical analysis. XRD helped to quantify different types of minerals, which dictates the properties of fillers. Filler particles were composed of various minerals; each of these minerals has a different crystalline structure and chemical composition. The composition of minerals has its effect due to complex processes that occur at the surface of mineral aggregate and its affinity both for bitumen and water.

2.3. Micromechanics Models

There are several mathematical models to predict the stiffening potential in mastics [21,22]. In this research, some of the models were used to relate viscosity and stiffness through Equation (1) [8].
( η η 1 1 ) = 4 5 v 1 3 × ( 1 v 1 ) · ( G G 1 1 )
where G and G1 refer to shear modulus and η and η1 are the viscosity of mastic and bitumen, respectively. v1 is Poisson’s ratio of bitumen with a value of 0.50. Thus, the above relation can be reduced to Equation (2). It indicates that the stiffening effect can be measured in terms of shear modulus values instead of viscosity measurement for the particle suspension system.
η η 1 = G G 1

2.3.1. Einstein Model for Diluted Composites

The Einstein model to calculate viscosity assumes a suspension that is very dilute, such that there is almost no inter-particle interaction [25]. The model yields a linear relationship when viscosity is plotted against the solid volume fraction. Moreover, it does not include the effect of the maximum packing fraction. According to this model, the viscosity of the system keeps on increasing indefinitely as long as the suspension remains in a dilute phase. The model is represented by Equation (3).
η r = 1 + K E
where ηr is the relative viscosity of composite and KE is Einstein constant. The value of KE is 2.5 for a suspension of rigid spherical particulates in a matrix such as bitumen with Poisson’s ratio of 0.50 [26]. Furthermore, Einstein’s coefficient is dependent on agglomeration, average particle size and shape, and interfacial interaction of particle and bitumen. The coefficient, however, has been generalised to consider the non-ideal nature of a real system [8]. The problem of the Einstein model is that the particulates are inert and monodisperse (i.e., containing particles of uniform size). In this research, the Einstein model is not included in the evaluation because it is limited to filler volume fractions of less than 10 per cent. The micromechanics models extend Einstein’s basic analysis of rigid particulates in a dilute suspension of viscous liquid.

2.3.2. Maron–Pierce Model

Maron and Pierce derived a relation for relative viscosity [27]. This model was later used by Heukelom and Wijga to compute the stiffening effect through Equation (4) [18,22].
G m = G b ( 1 ϕ 2 ϕ m ) 2
where φ2 refers to the volume content of filler in mastic and ϕm is the maximum packing fraction. Gm and Gb are the shear modulus of the mastic and bitumen, respectively. The volume content of the filler (φ2) is calculated by dividing the filler volume by the combined volume of bitumen and filler. The maximum packing is a vertical asymptote to the curve in the graph of stiffening ratio plotted against filler volume content. This parameter represents the maximum content of filler added to bitumen without the generation of air voids. The voids occur when the value of φm is less than the value of φ2. Rigden showed volume fraction φ2 of filler controls the stiffening of the bitumen mastic suspension.

2.3.3. Lewis and Nielsen Model

In 1970, Lewis and Nielsen used Halpin and Tsai form of Kerners’s equation to compute the stiffening potential of fillers in mastics [26,28,29,30]. The original Kerners’s equation ignored the effect of packing. Lewis and Nielsen realised this problem and introduced a factor ψ. This factor includes the effect of filler packing. If we remove ψ from Lewis and Nielsen’s model, it becomes Kerner’s equation. The model is given by Equation (5) [28].
M M 1 = 1 + AB   ϕ 2 1 B   ψ   ϕ 2
In this equation, M is any type of modulus (shear, elastic, etc.) for mastic (M1) and bitumen (M). φ2 is the volume content filler, and A, B, and ψ are constants. The constant A considers the important factors related to the geometry of the filler phase and Poisson’s ratio (v1) of the matrix phase. The constant B is related to the elastic moduli of filler and matrix phase (bitumen). A and B can be expressed with Equations (6) and (7), respectively.
A = 7 5 v 1 8 10 v 1
B = M 2 M 1 1   M 2 M 1 A
The M1 and M2 are the elastic moduli of the matrix phase and filler phase. The filler shear modulus (24 GPa) is very large as compared to bitumen, so B ≈ 1. This constant takes into account φm (the packing fraction). The constant ‘ψ’ can be computed from Equation (8) by adding filler fractional volume and maximum volume fraction.
ψ = 1 + ( 1 ϕ m ϕ 2 m ) ϕ 2
Equation (5) can be rewritten as following (Equation (9)) with a value of B equal to 1.
M M 1 = 1 + A   ϕ 2 1 ( 1 + C   ϕ 2 )   ϕ 2
where C is constant and can be computed from ϕm by Equation (10).
C = 1 + ( 1 ϕ m ϕ 2 m )

2.3.4. Mooney’s Equation

A model to predict the stiffening effect of spherical particulates in suspension was given by Mooney [25]. They made use of a self-crowding factor ‘k’. This factor was inverse of the maximum packing fraction. In Equation (11), for a monodisperse system, it is mentioned as 1/φm. Gm and Gb are the shear modulus of the mastic and bitumen, respectively. The factor ‘2.5’ in the equation refers to Einstein’s coefficient KE [25].
G m = G b e ( 2.5 ϕ 2 1 ϕ 2 ϕ m )

2.3.5. Krieger–Dougherty Model

Krieger and Dougherty presented their model to calculate the stiffening effect of the matrix–particulate system [31]. This model also uses Einstein’s coefficient for the monodisperse phase. The monodisperse phase refers to a matrix containing unimodal uniform size particles [9]. This model is represented by Equation (12).
G m = G b ( 1 ϕ 2 ϕ m ) K E ϕ m
where Gm and Gb are the shear modulus of the mastic and bitumen, respectively. KE is the Einstein coefficient, φ2 is the volume packing fraction, and φm refers to the maximum packing fraction.

2.3.6. Chong Model

In 1971, Chong et al. was used to predict the stiffening potential of fillers in mastics [32]. This model makes use of maximum packing and Einstien’s coefficient along with a varying amount of filler volume fraction [9]. The Chong model can be represented with Equation (13).
G m = G b ( 1 + K E ϕ 2 2 · ϕ 2 ϕ m 1 ϕ 2 ϕ m ) 2
where Gm and Gb are the shear modulus of the mastic and bitumen, respectively. KE refers to the Einstien coefficient, φ2 is the volume packing fraction, and φm refers to the maximum packing fraction.

2.3.7. Robinson Model

In 1949, Robinson proposed a model for the prediction of the stiffening effect of fillers in mastics [33]. This model makes use of Einstien’s coefficient (KE) and maximum packing fraction (ϕm) to compute the stiffening ratio. The Robinson model can be represented as shown in Equation (14) [34,35].
G m = G b (   1 + K E · ϕ 2 1 ϕ 2 ϕ m   )
These parameters are the same as defined earlier.

2.3.8. Hashin Model

Hashin developed a model for an approximate isotropic heterogeneous material suspended with spherical particulates [19]. This model is similar to Kerner’s model, as is the Lewis and Nielsen Model [28]. The stiffness modulus of a linear elastic composite can be computed by Equation (15) [36].
G c = G m ( 1 + 15 ( 1 v m )   ( G p G m 1 ) v p 7 5   v m + 2   ( 4 5   v m ) ( G p G m ( G p G m 1 ) v p ) )
where Gc and Gm are the complex shear moduli of mastic and matrix phase (bitumen) and Gp refers to shear modulus of particle taken as 24 GPa [36]. vm is the Poisson ratio with a value of 0.50 for the matrix phase. vp is the volume fraction of filler.
This micromechanics model is purely theoretical without any adjustable parameters. This model underpredicts the stiffening potential of filler, so it has been excluded from evaluation.

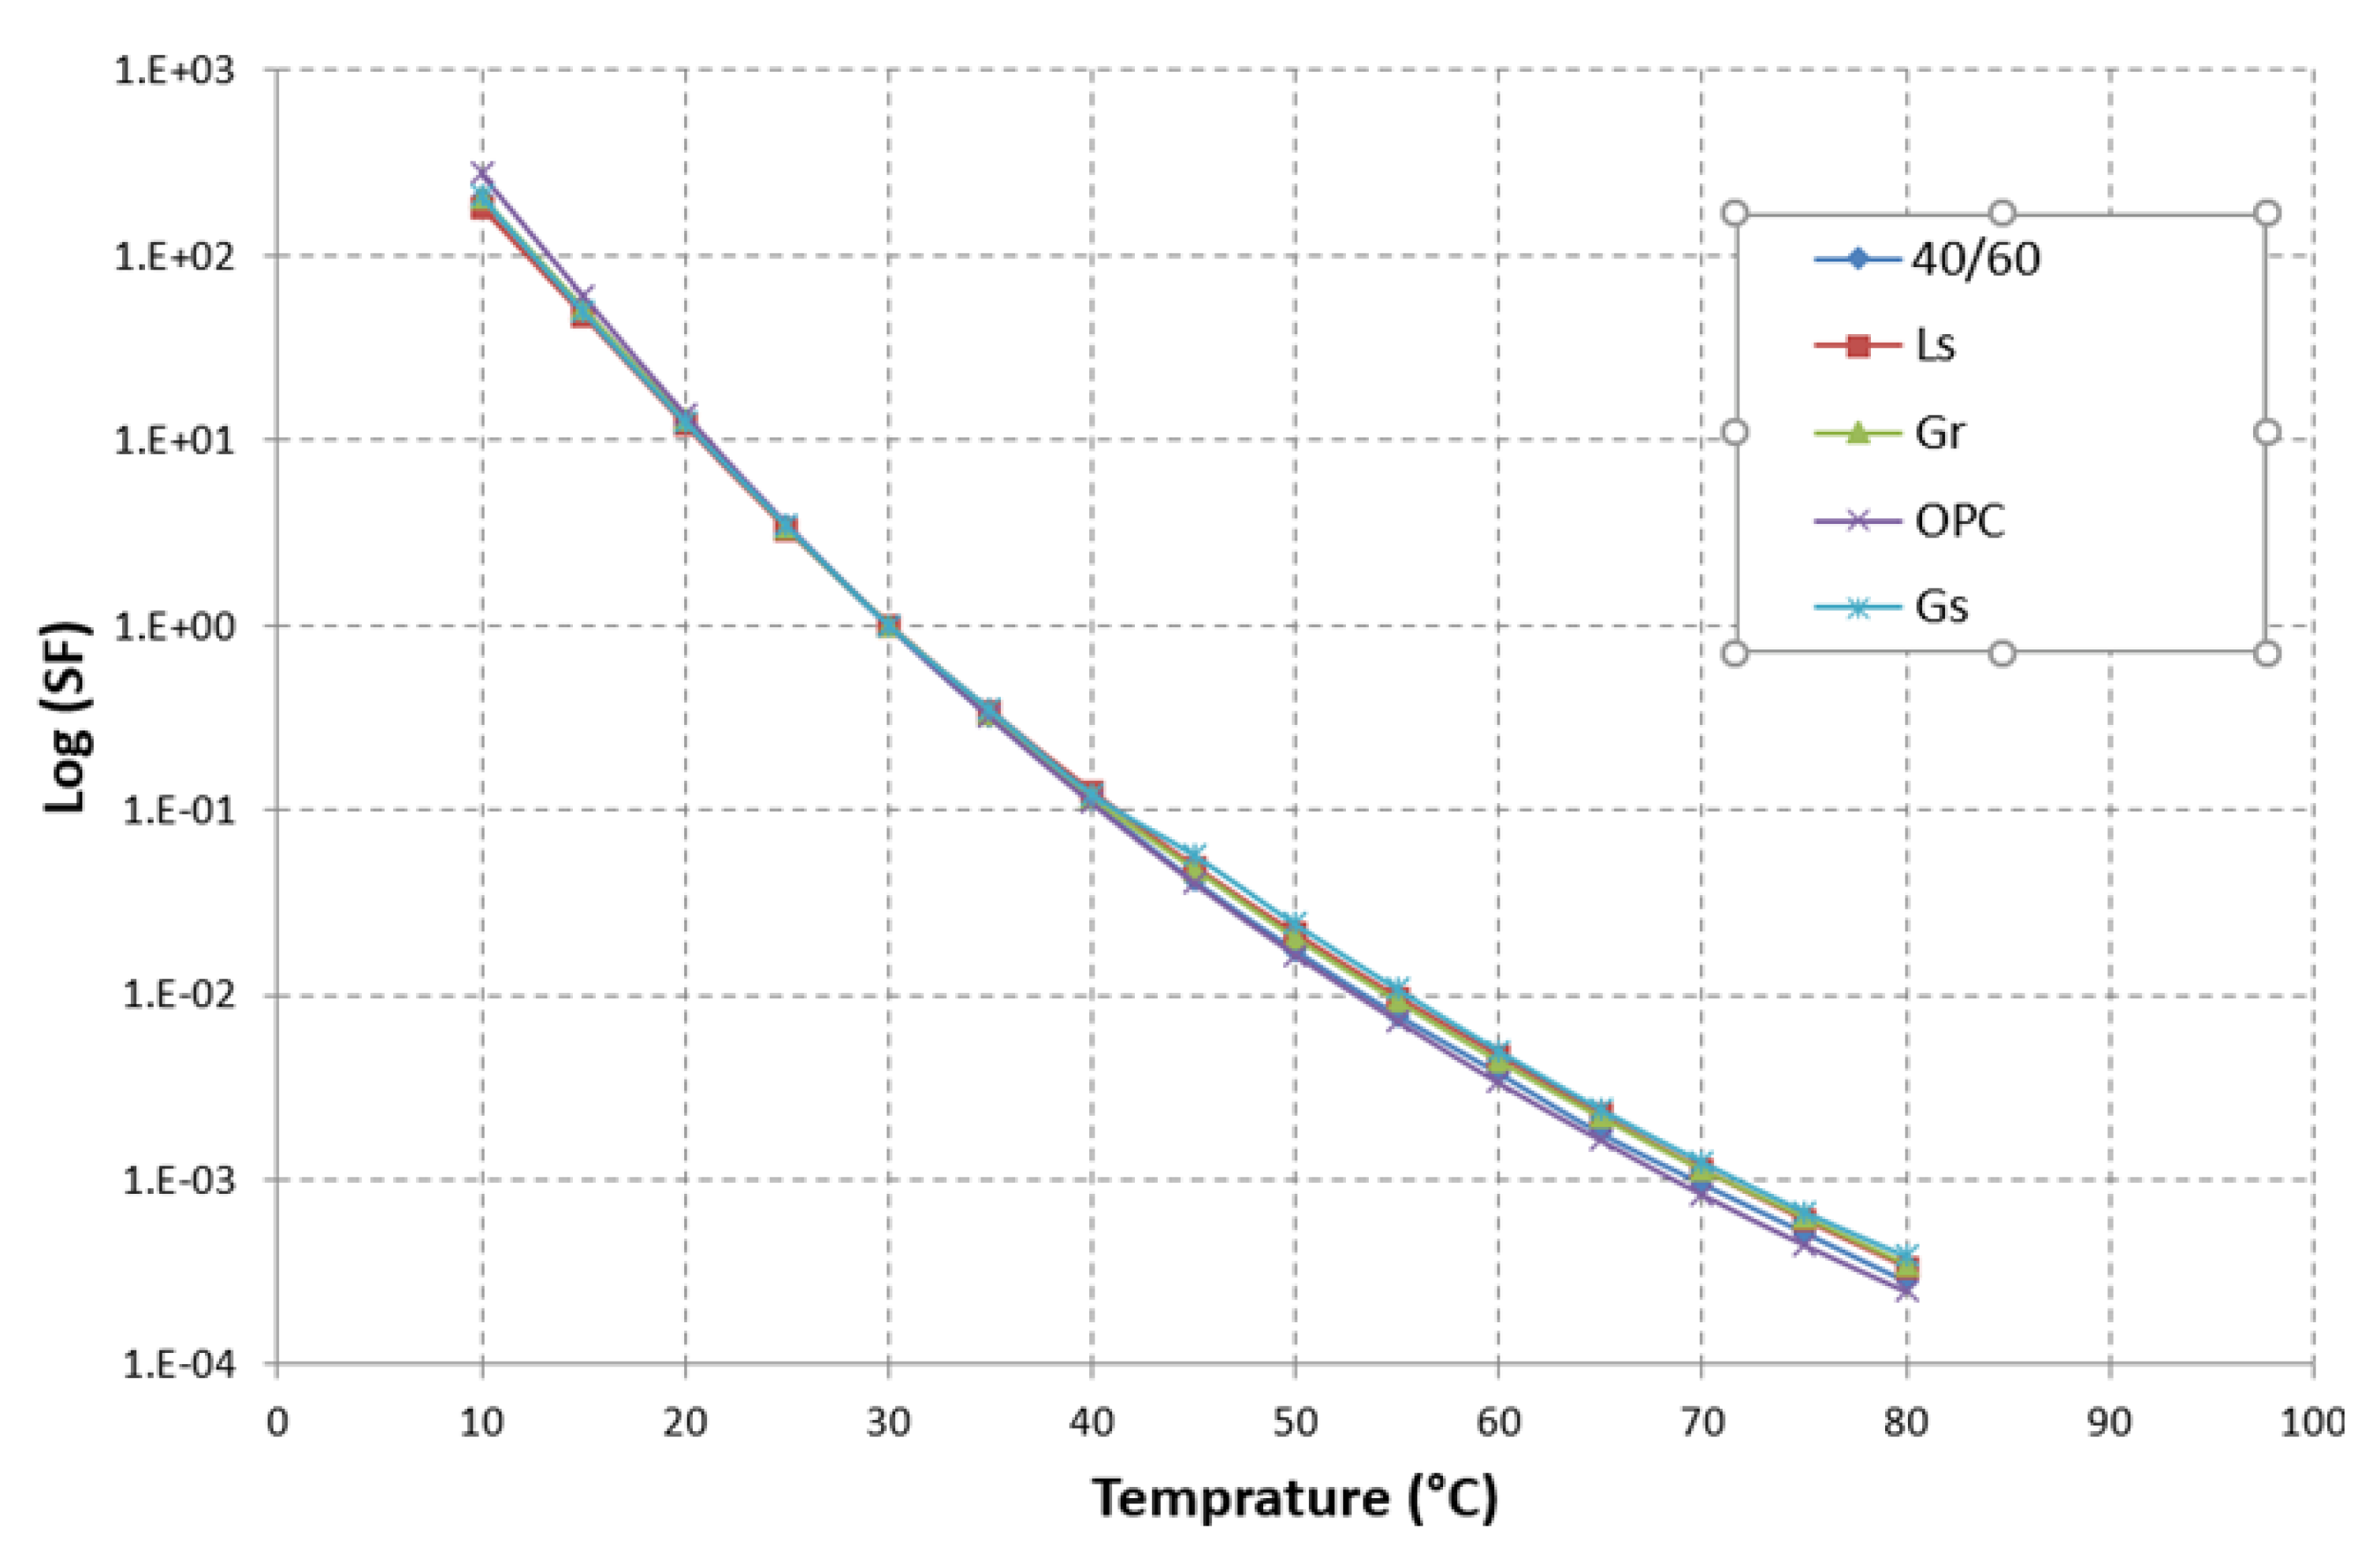
2.4. Master Curve Construction

The value of complex modulus (G*) at different temperatures (10–80 °C) was plotted against frequency. The curves at each temperature were transposed to generate a single response (known as a master curve) through the use of shift factors. The curves were shifted at a reference temperature of 30 °C, as shown in Figure 3. The shifting was performed by the use of the time–temperature superposition principle (TTSP). An optimisation technique was used for the complex modulus and phase angle isothermal plots to construct master curves. The initial shift factors served as a base value for optimisation and were calculated using the Williams–Landel–Ferry equation (WLF) through DSR software. The shifting factors, in a real sense, were calculated using the method termed ‘numerical, non-linear least square shift’ [37]. In this method, the shape factors of the sigmoidal function and shift factors (for various complex modulus isothermal plots) were solved simultaneously using non-linear least-squares fitting [38]. This was achieved using the Solver function in MS Excel. This has the advantage of not assuming any functional form of relationship of shift factor vs. temperature.
Non-linear regression was also used to fit the micromechanics models to the measured data with help of the solver function [39]. Maximum packing and Einstein’s coefficient were calculated accordingly.

3. Results and Discussion

3.1. Compositional and Effective Volume

The volume fractions are expressed as compositional volumes (Vf) of filler in the bitumen. The effective volume (Ve) of bitumen considers the effect of packing using Rigden voids. The effective volume is calculated using Equations (16) and (17) [6,34,40].
V f = M f S f M f S f + M b S b
V e = 100 ( 1 ϵ )   V f
where, Mf and Sf refer to mass and specific gravity of filler, respectively, while Mb is the mass of bitumen and Sb is the specific gravity. ε indicates the Rigden voids of mineral filler. The calculations for one filler concentration for effective volume (Ve) and free bitumen volume (FBV) are presented in Table 3. The results show that the same volume content of the filler result has different effective volumes. This will result in a difference in the stiffening effect.

3.2. Morphological Characteristics

The factors that affect the stiffening potential of particulate in the matrix phase are mainly dispersion, mixing, agglomeration, particle size and shape, gradation, and interface properties. Figure 4 indicates the morphology of limestone filler measured by performing SEM. We have assessed the basic shape in comparison to particle shapes such as rod, tile, disk, cubes, grains, and spheres, etc. [41].
Antunes et al. evaluated the effect of geometrical and physical properties in mastics. In view of the discussion of this research, the filler particles in our work can be classified as angular and granulous with smooth to rough texture [42]. Moreover, as the objective of this study is to evaluate different micromechanics models than to compare fillers, we have assumed the particle shape to be roughly spherical.
For the non-spherical particles, the aspect ratio (longest and shortest dimension ratio) affects the rheology of the suspension. An increase in particle aspect ratio lowers maximum packing fraction (φm) and increases generalised Einstein’s coefficient KE [8]. The elliptical particles will have more KE and φm as compared to spheres due to an increase in aspect ratio. This will eventually increase the stiffening effect. The irregular shape and rough texture will also increase the effective volume and result in an increase in viscosity.

3.3. Mineralogical Characterisation

Filler particles are composed of various minerals; each of these minerals has a different crystalline structure and chemical composition. The composition of minerals has its effect due to complex processes that occur at the surface of mineral aggregate and their effects on its affinity for bitumen and water. Aggregate fillers can be categorised based on mineralogy. Regarding XRD analysis, there can be hundreds of minerals in a single aggregate type depending upon its source and composition, etc. In Table 4, only the important minerals are presented from the XRD mineralogical analysis.
The XRD results show that in granite, quartz acts as an important mineral along with calcite and relatively low amounts of Vandendriesscheite and Cuprite. Quartz is a silicate mineral deriving its origin from igneous rocks. This leads to its classification as an acidic nature. Calcite is basic in its generic nature; however, the relatively higher proportion of quartz will give an acidic character to the overall mineralogy of the filler. Limestone filler has a higher presence of calcite and dolomite as main minerals, which support its basic character.

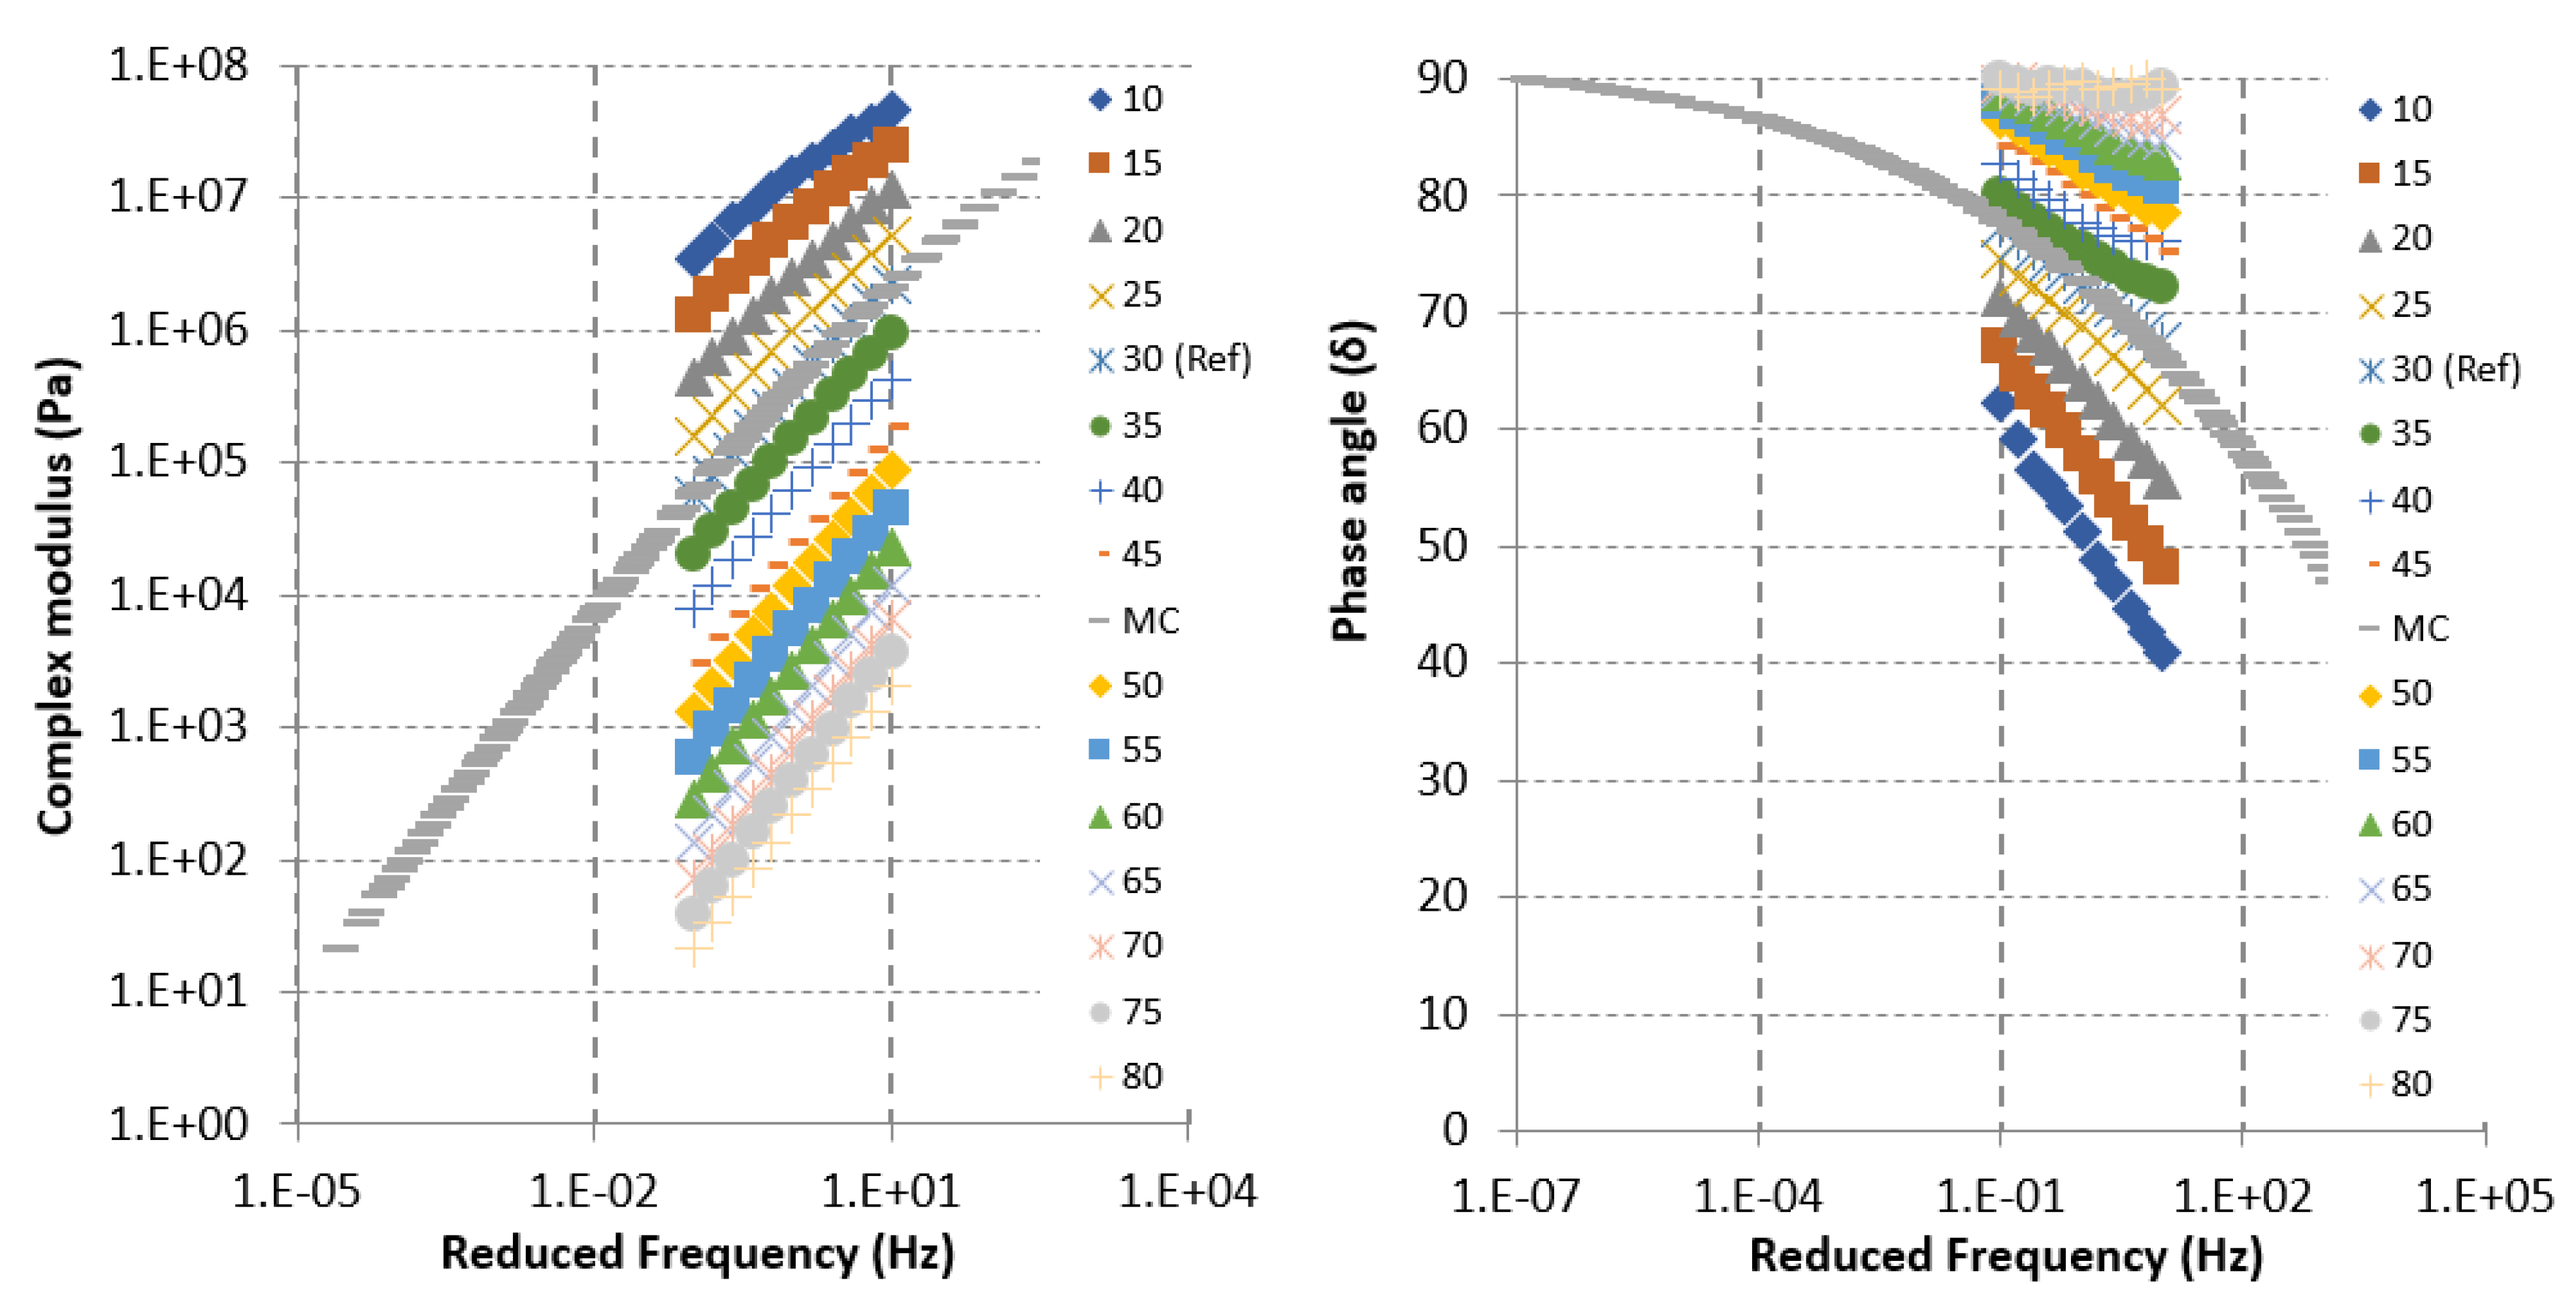
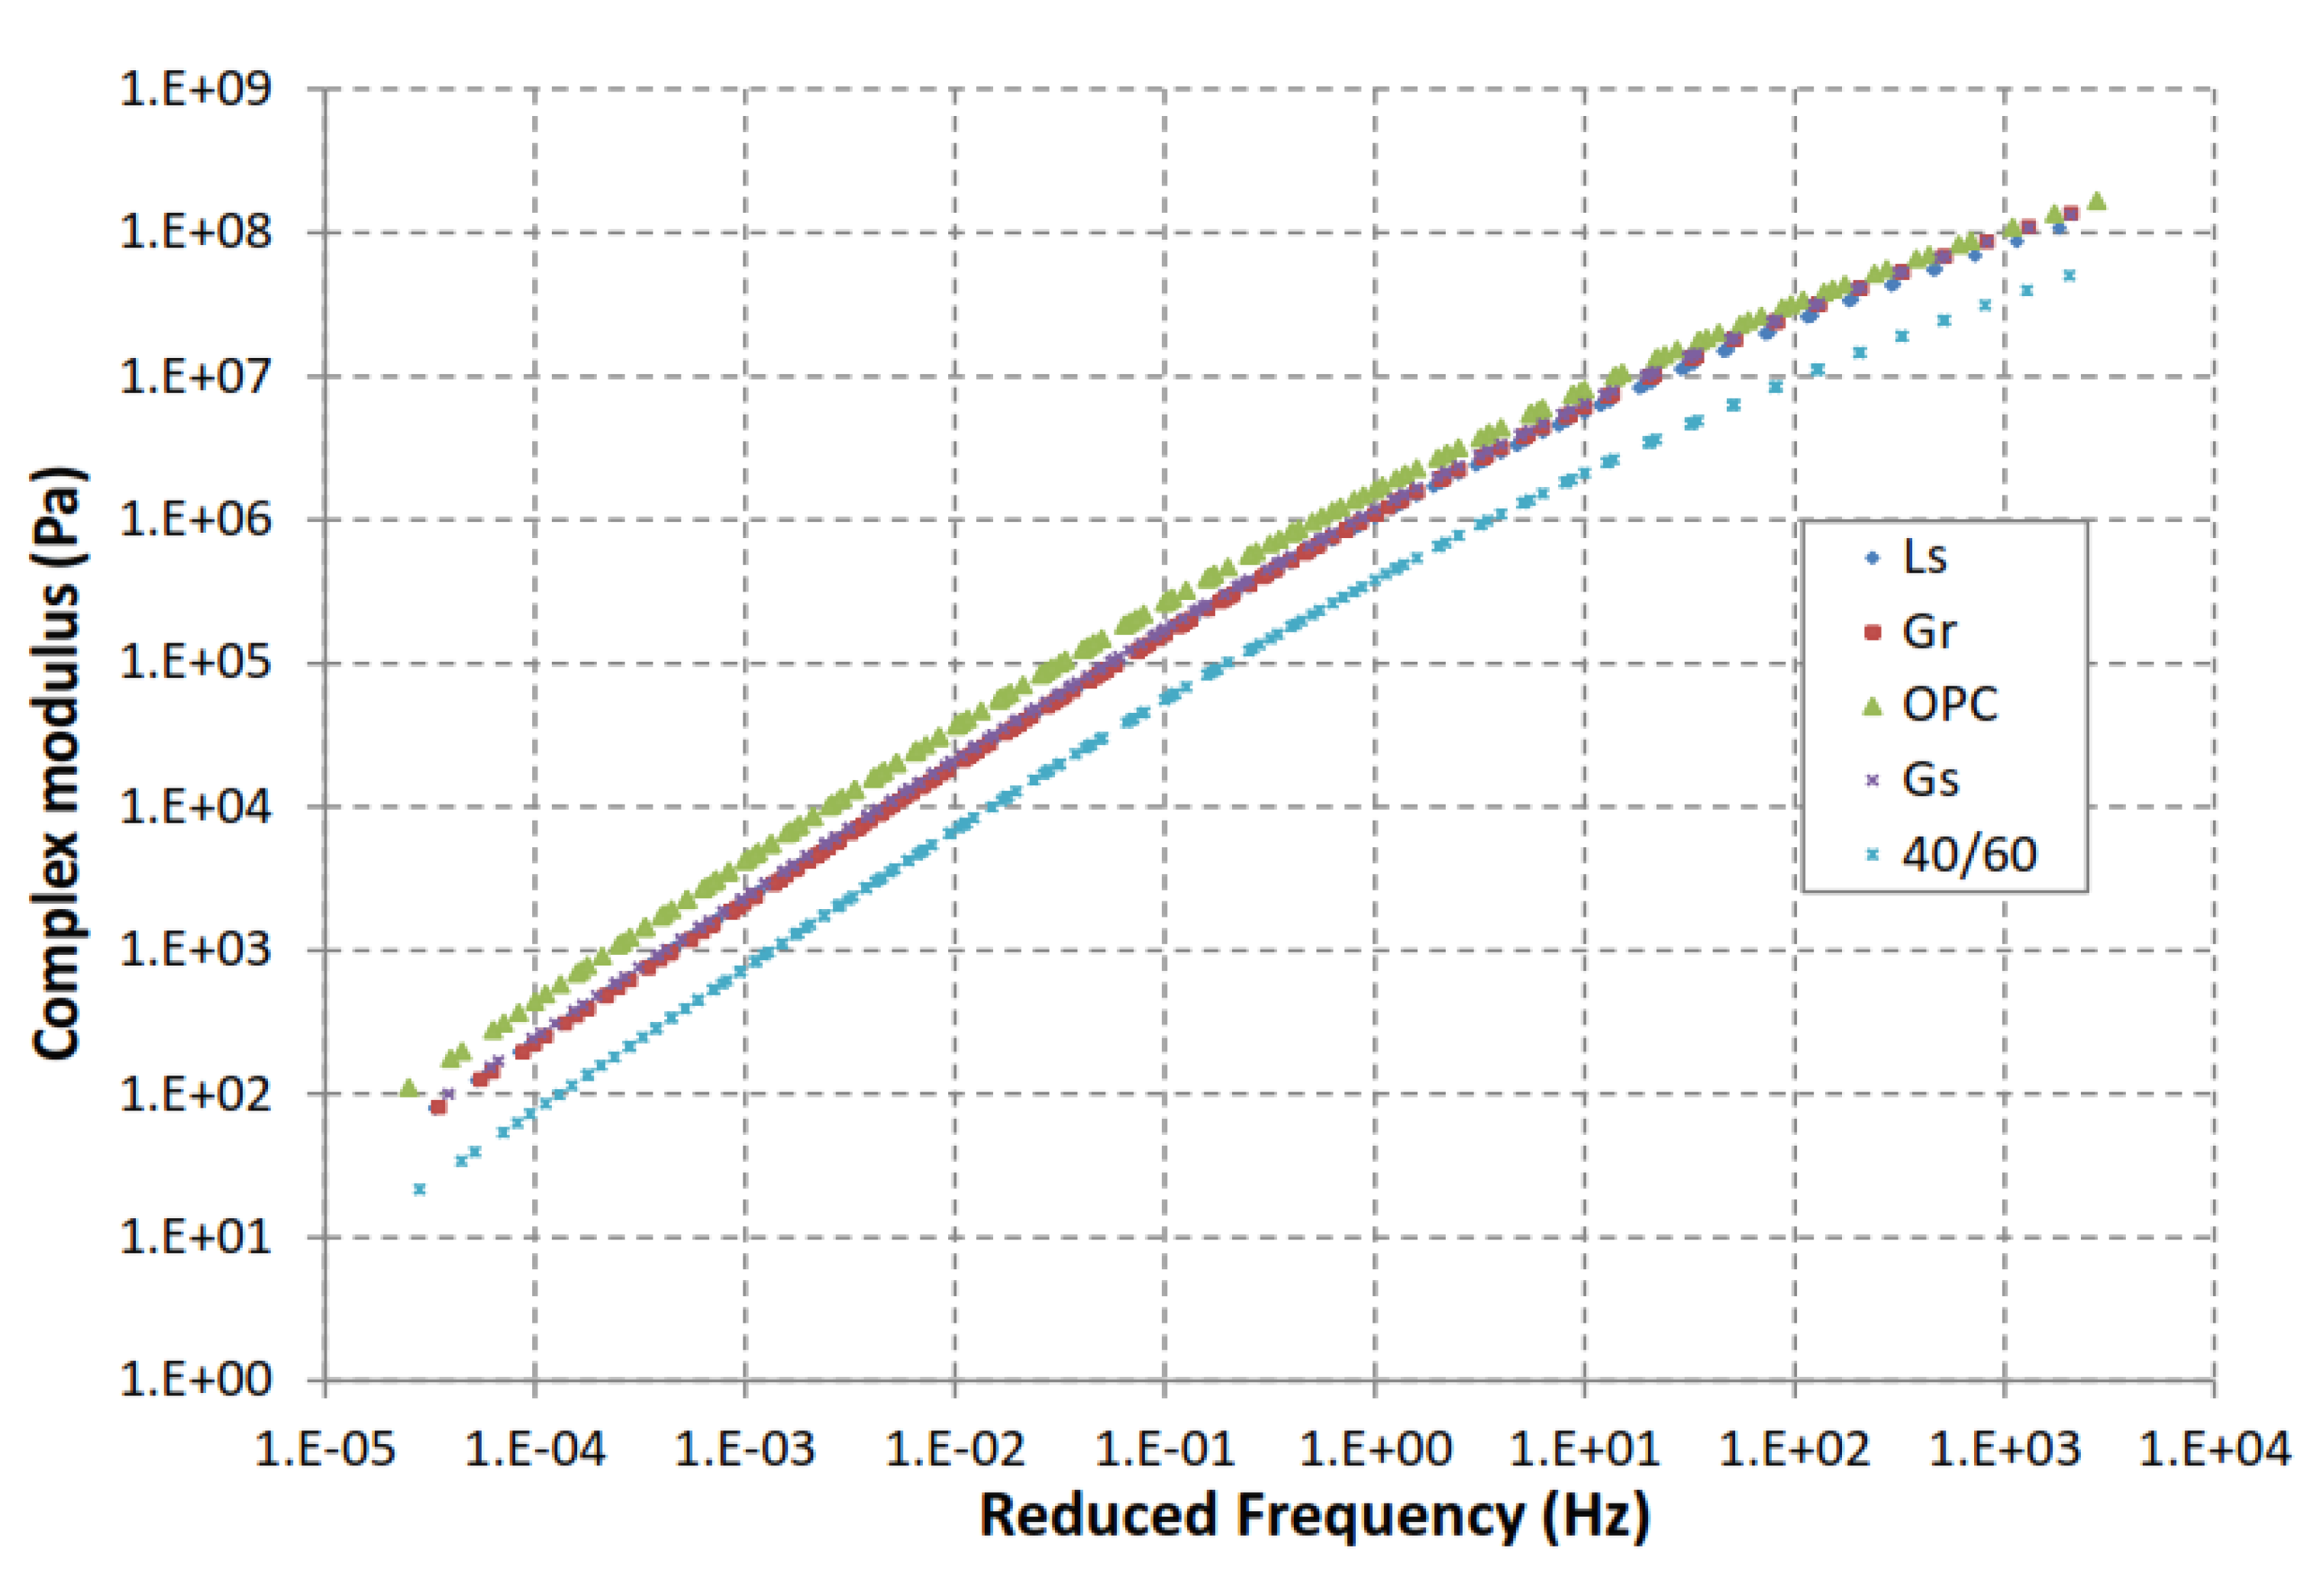
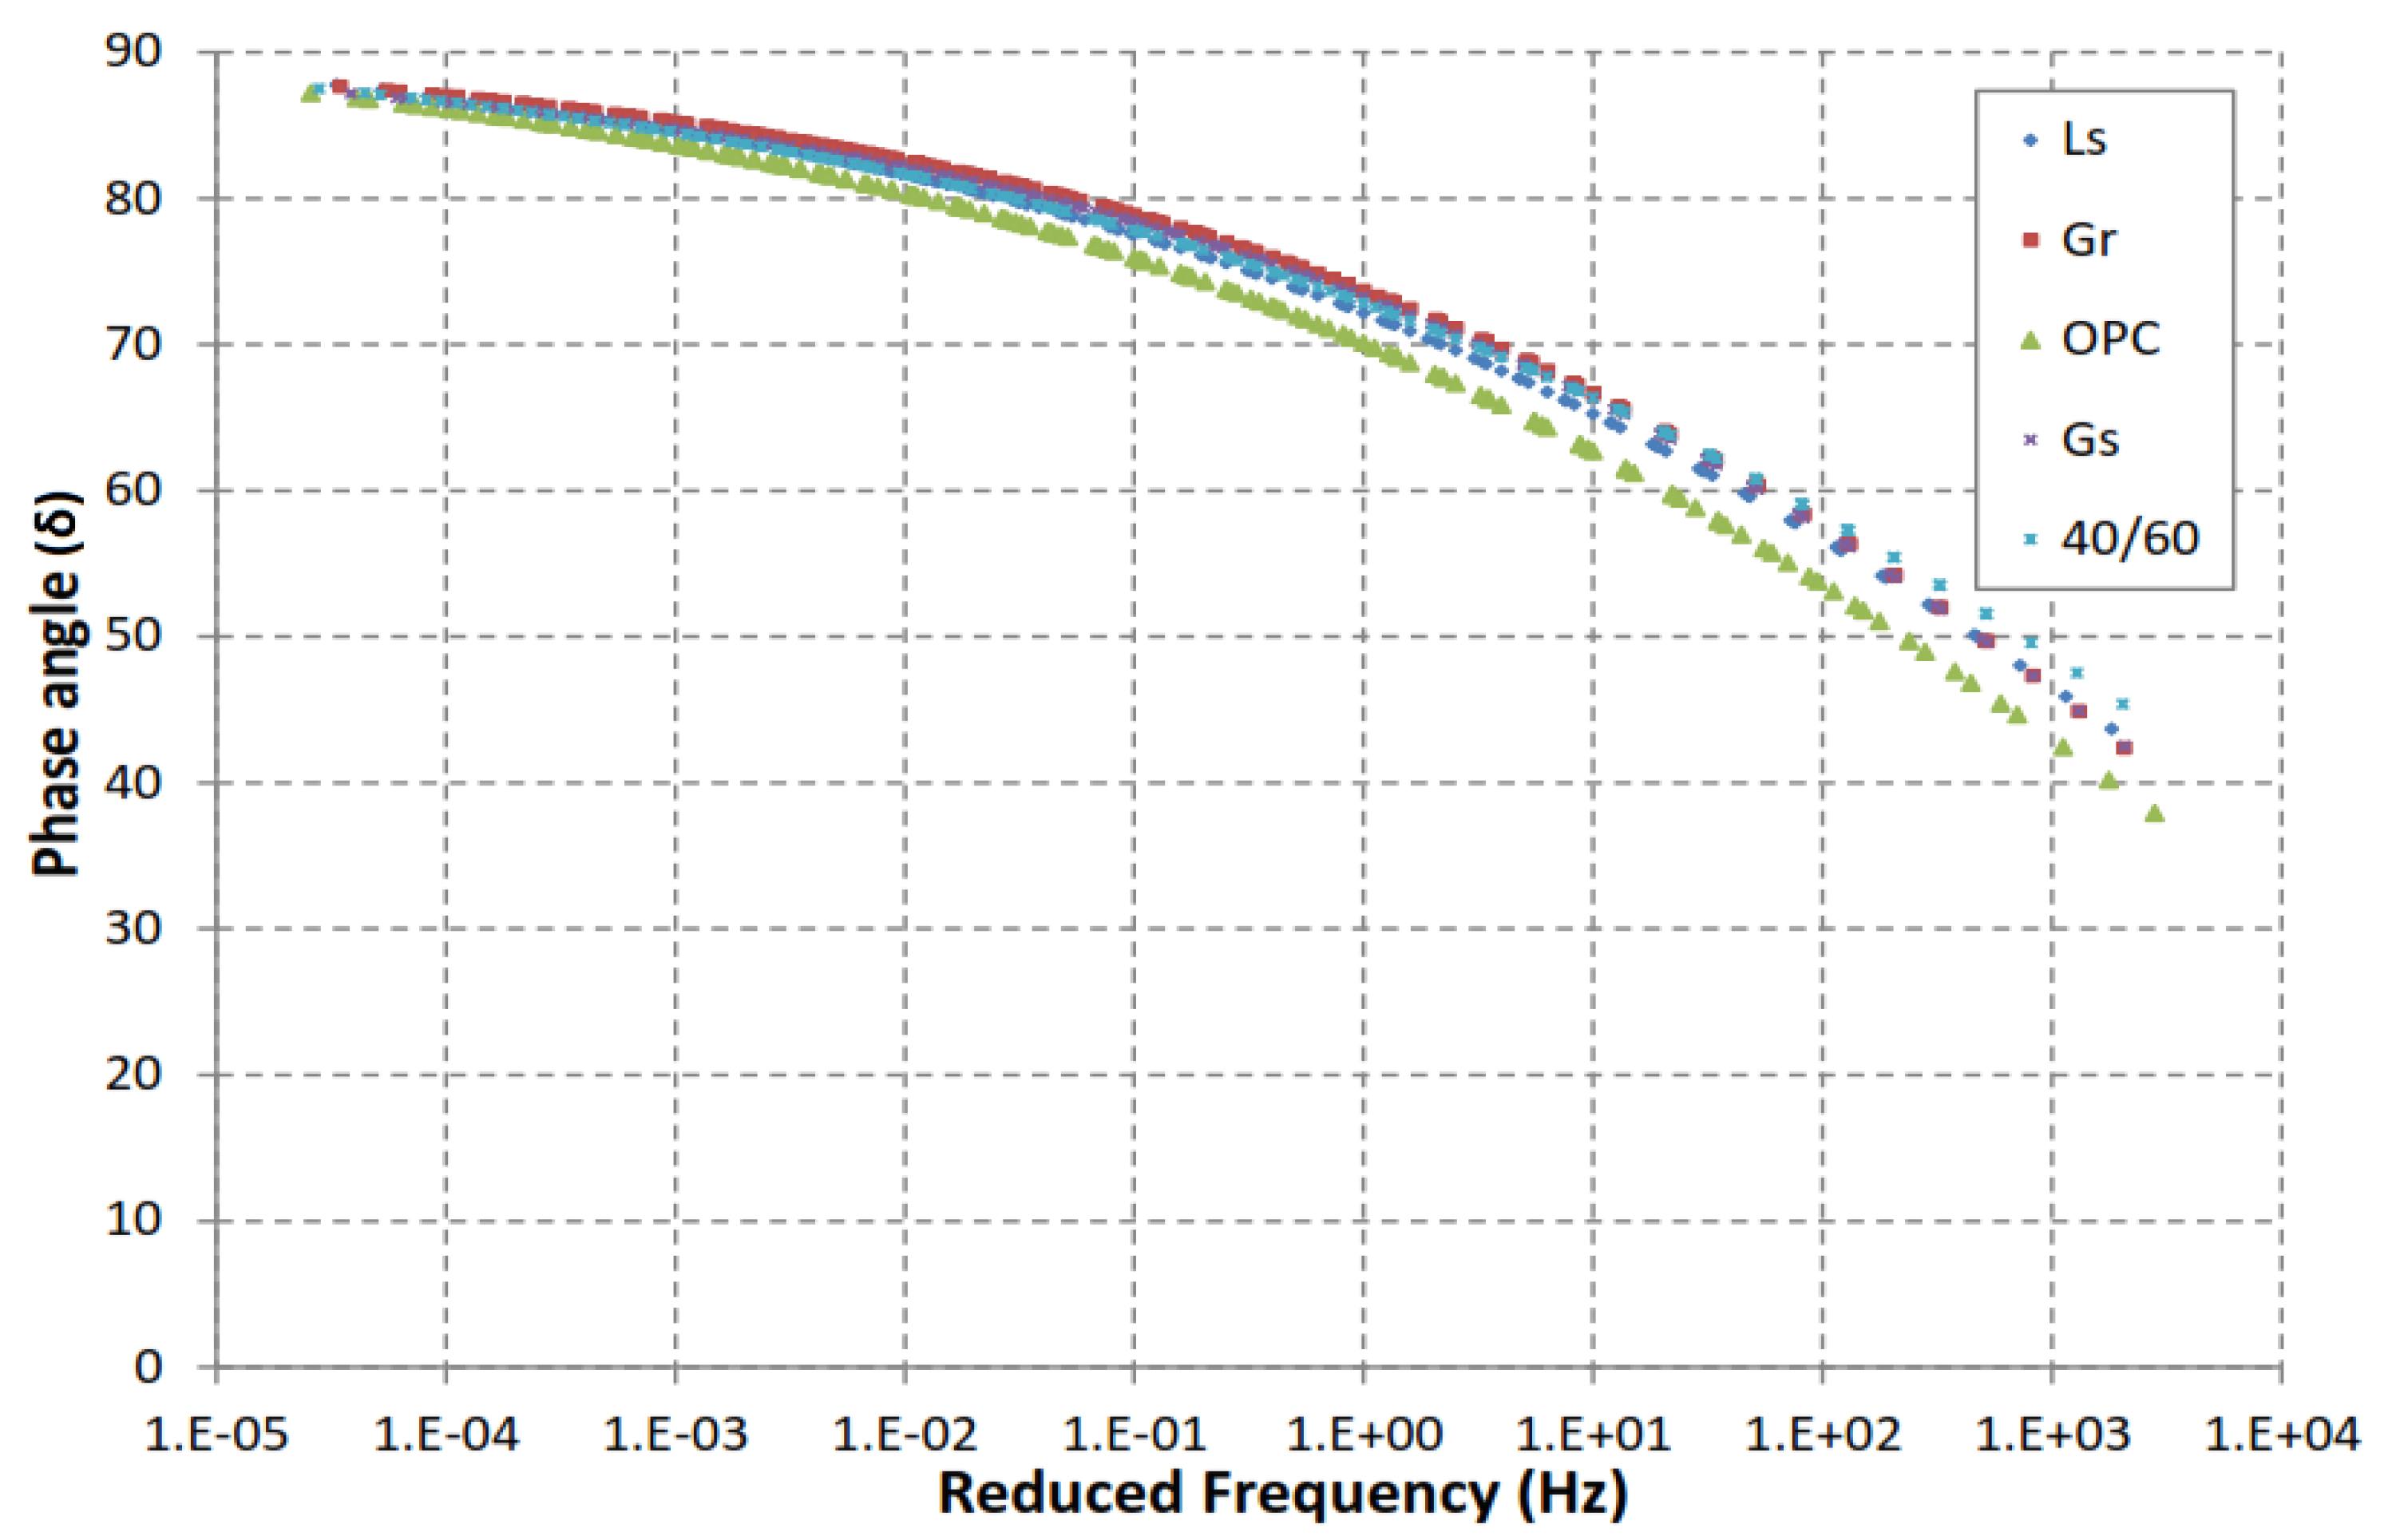
3.4. Rheological Properties

The effect of filler packing on mastic was studied in terms of master curves, as shown in Figure 5 and Figure 6. The results indicated that filler acts as a stiffening agent to increase the stiffening effect of the composite. The penetration grade 40/60 has considerably lower stiffness as compared to all mastics. This effect is more apparent at high temperatures, as shown in Figure 5. The dynamic shear modulus of mastic is dependent on the moduli of both bitumen and filler. In these results of relatively high filler compositional volume (29%) mastics, the effective volume concentrations were 44, 54, 49, and 47% for limestone, ordinary Portland cement (OPC), gritstone, and granite, respectively. These values correspond to 33, 45, 40, and 38% Rigden voids, respectively. The granite and gritstone fillers have similar effective volume and packing, so their behaviour is identical. The phase angle is sensitive to the compliance of the machine, so it may not be able to provide reliable information for very stiff binders. For this reason, shift factor plots were made to evaluate the fitting of master curves (Figure 7).
The addition of ordinary Portland cement (OPC) has a considerable effect on the mastic stiffening potential of mastics (Figure 5). Similar behaviour is observed from phase angle master curves (Figure 6). The stiffness of OPC is attributed to its effective volume in this mastic. OPC mastics have more Rigden voids in the same volume and subsequently more fine particles. The limestone filler has a lower effective volume as compared to gritstone and granite. It is expected to have a less stiffening effect in comparison with the two fillers. However, limestone has a similar stiffening effect. A possible explanation is that limestone is a basic filler. It is thus expected to increase the stiffening as per Winniford when compared to gritstone and granite (acidic fillers) [43]. The acidic fillers result in lower viscosity, while basic filler results in a higher viscosity of mastic. The theory that basic fillers have more stiffening potential explains the behaviour seen in the phase angle master curves.
It is concluded that the fractional void theory of Rigden does not provide a full picture of bitumen–filler interaction. Several studies support this observation, such as Hashin, Anderson and Goetz, and Ishai and Craus [16,19,44]. The discussion of this study is consistent with various works about the different reinforcement effect of different types of fillers in the mastic. Additionally, the stiffening also depends on the type of bitumen [9,16,45]. We recommend studying the effect of packing of fillers in terms of its role in oxidative ageing through bitumen–aggregate interaction.
In the next discussion, we have measured the stiffening effect of two fillers with increasing filler content based on rheology tests. Then, we selected the micromechanics models with the use of KE and maximum packing fraction (ϕm) to predict the stiffening effect of mastics.

3.5. Stiffening Effects

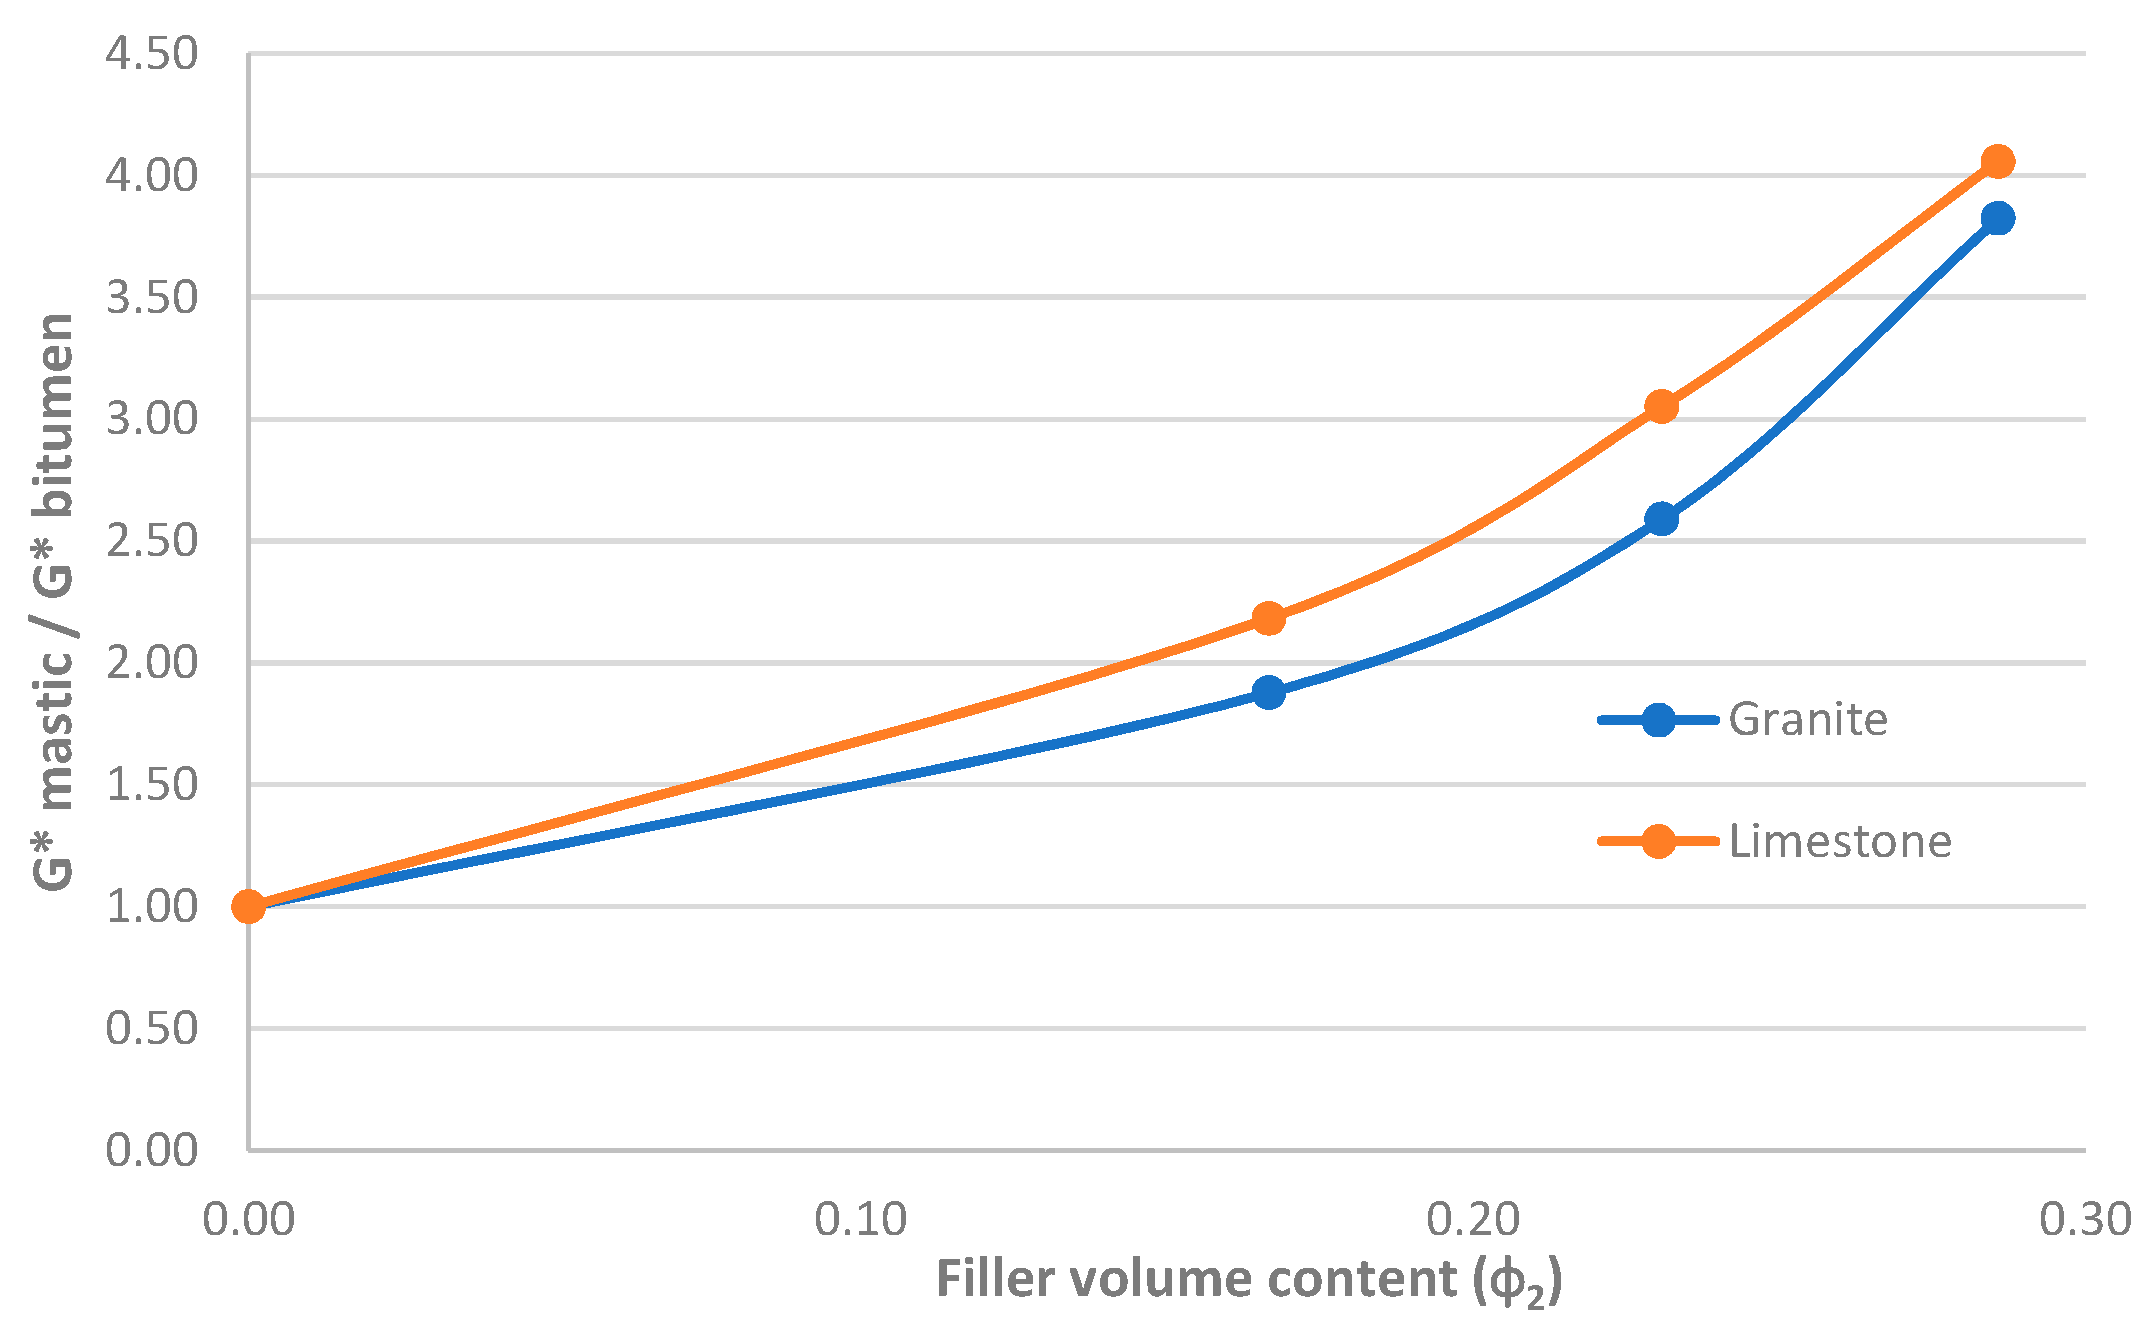
3.5.1. Stiffening Effects Based on Laboratory Testing

The limestone (basic) and granite (acidic) fillers were selected to measure and predict the stiffening effect of fillers. In Figure 8, constructed using the data of research, mastic stiffness modulus increases with the increase in filler content. The filler content is defined as φ2 = V 1 V 1 + V 2 , where V1 is filler volume while V2 is bitumen volume. A discussion on the effect of variables on stiffening potential in the models can be found elsewhere [8].

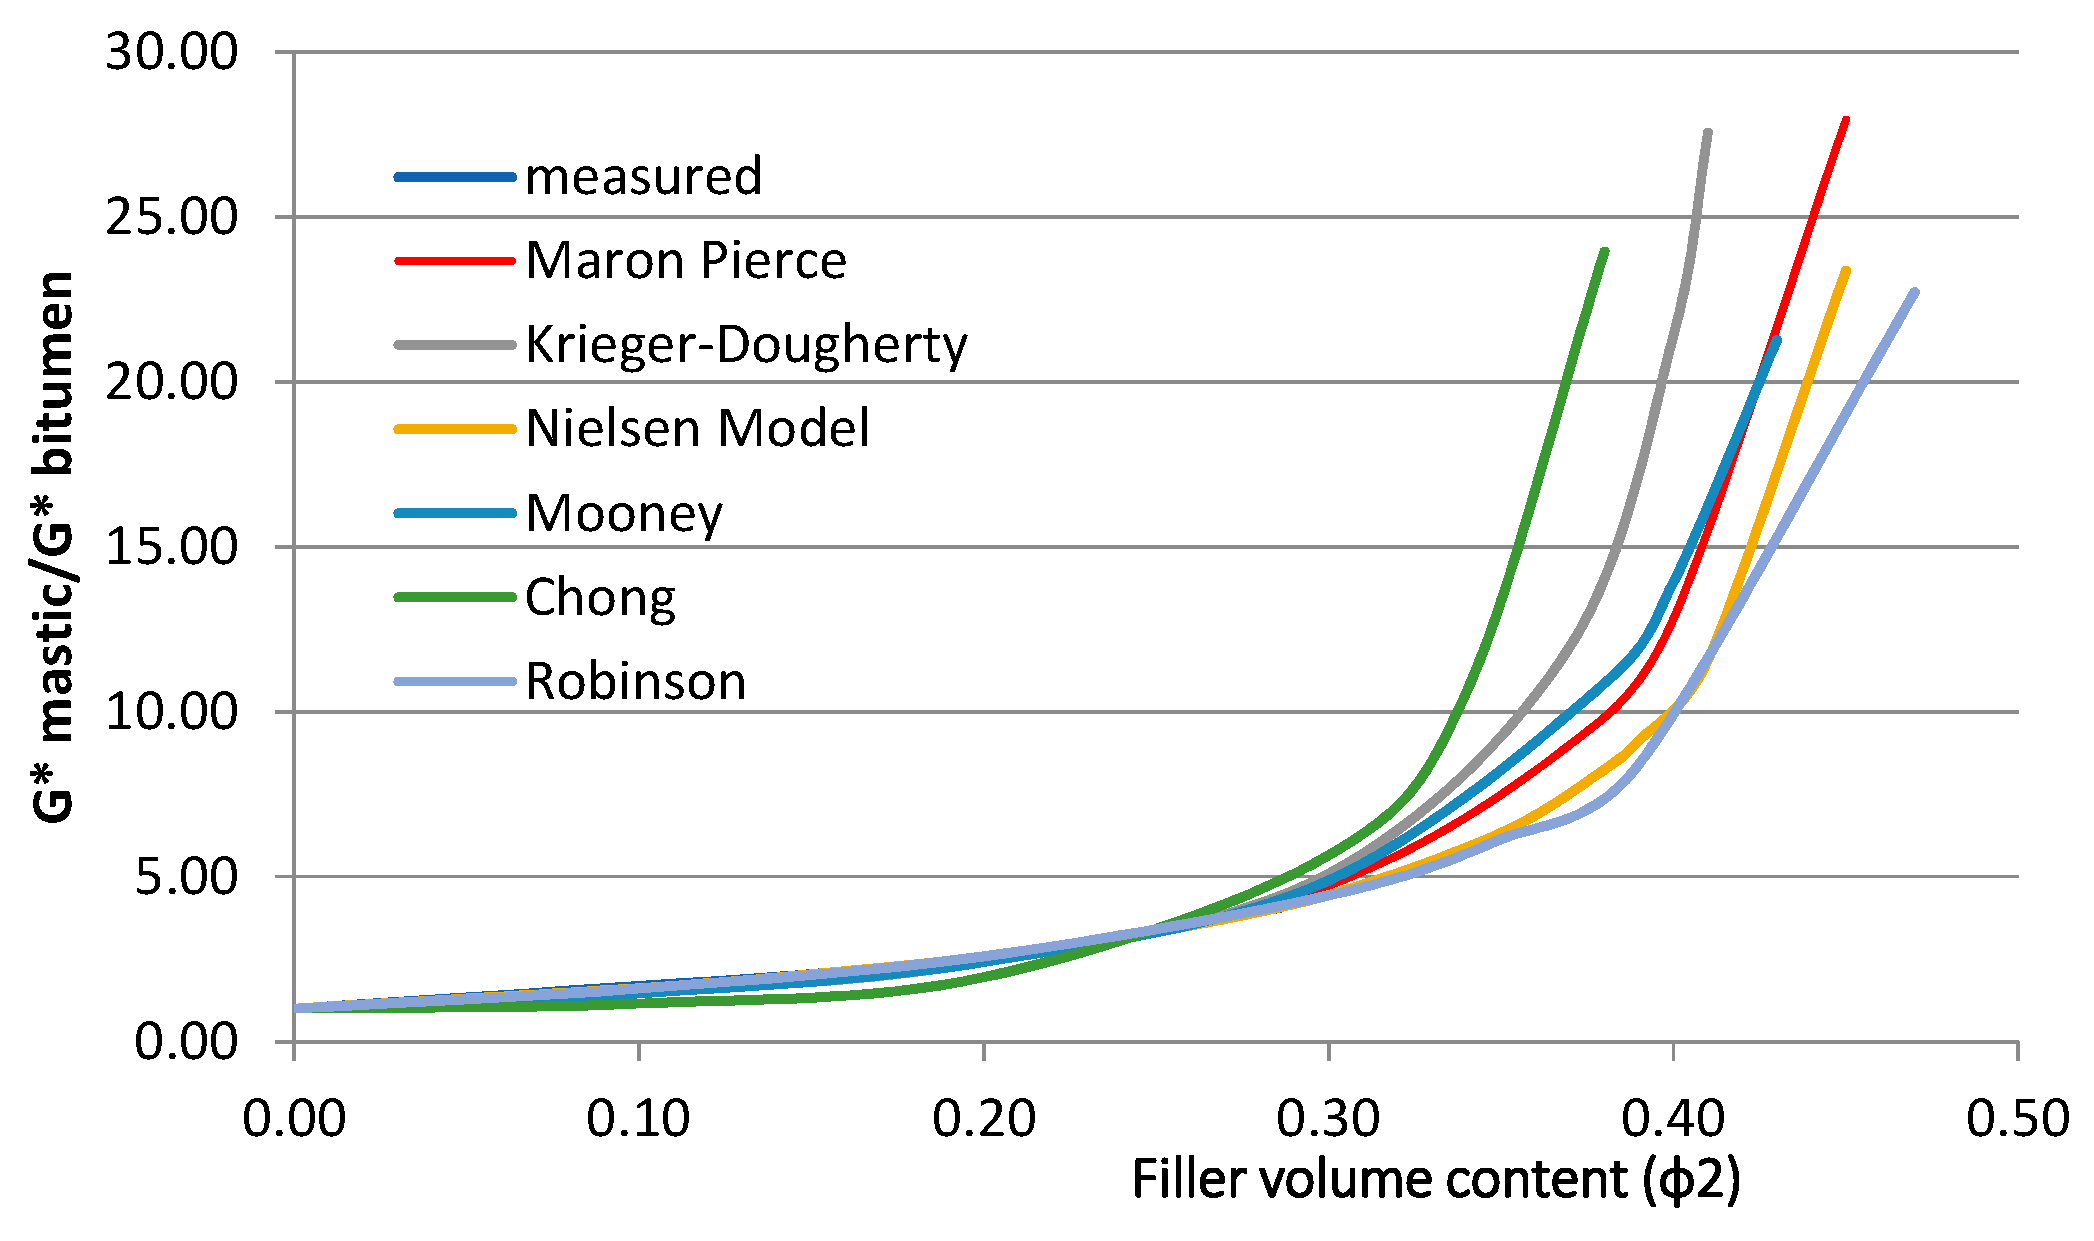
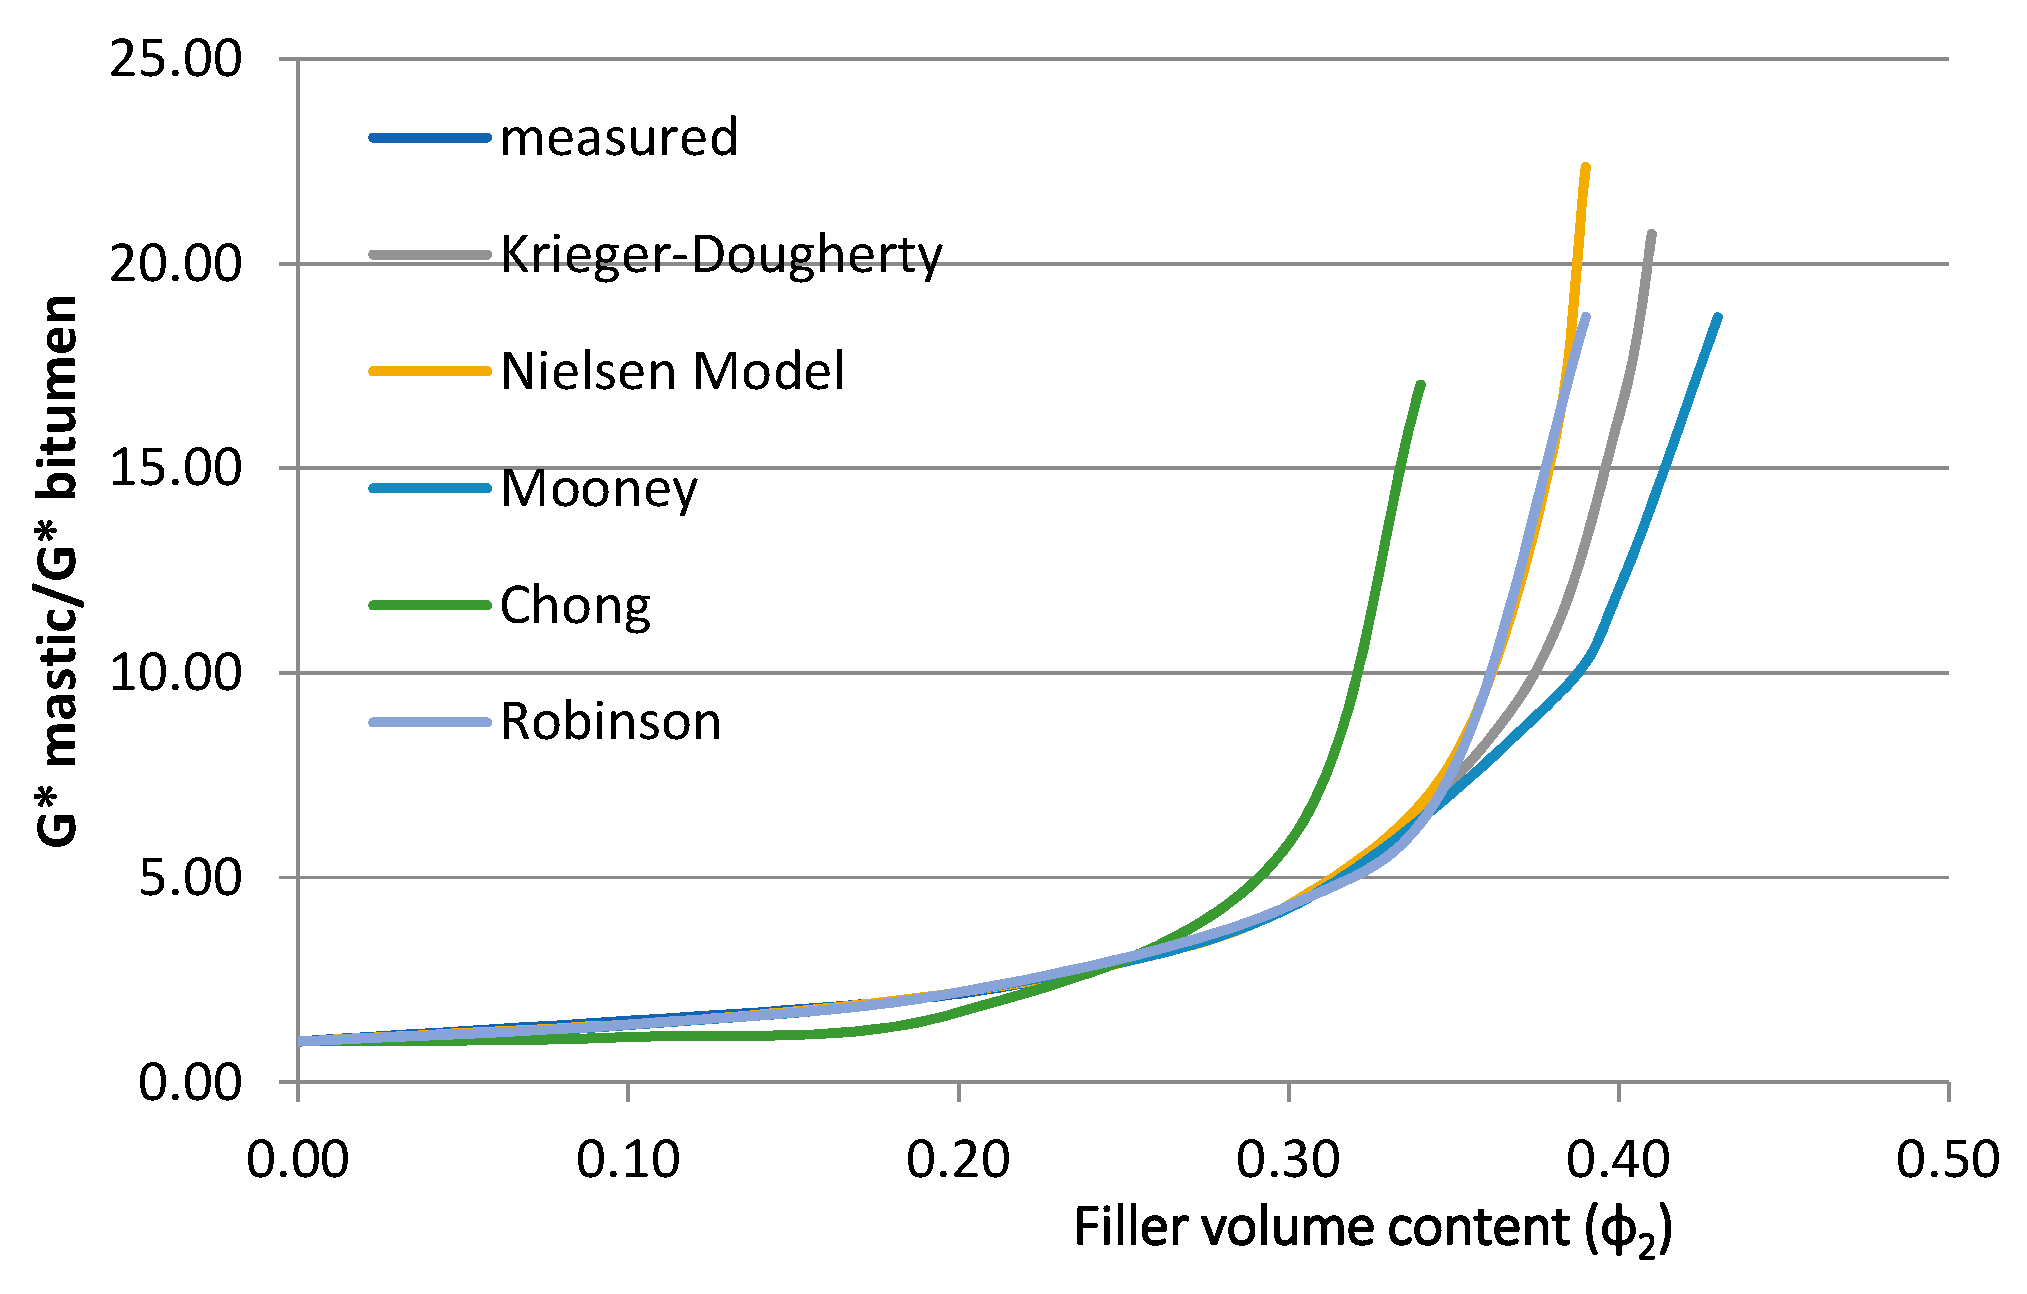
3.5.2. Micromechanics Modelling Based on Laboratory Testing

The results show that these models reasonably predict the stiffening potential of fillers (Figure 9 and Figure 10). Moreover, most models show an accurate stiffening effect at lower concentrations with the exception of the Chong model. This model underestimates the stiffening at lower concentrations and overestimates the stiffening effect at higher concentrations. The Maron–Pierce model under-estimates the stiffening potential for granite mastic at higher concentrations. The deviations are noticeably more apparent beyond the 30% filler volume fraction. The advantage of models is the reasonable prediction of maximum packing as well as the stiffening potential of fillers.
The curve of the measured value of stiffening ratio is not clearly visible in Figure 9 and Figure 10. This curve extends up to 0.29% filler volume content, and it is overlapped by the curves of different models. The stiffening ratios of different models are close to each other at lower volume fractions of fillers.
Abbas et al. also studied some of the micromechanics-based models for mastics, and according to them, these models are not sensitive to DSR results and underestimate the stiffening of mineral fillers [46]. It is difficult to precisely model the mastic data with any single model at higher filler content due to the presence of complex stiffening effects beyond volume filling. The presence of physicochemical interactions between the filler and bitumen as well as the adsorption layer around the particles increase the effective volume and maximum packing. These subsequently affect the stiffening potential of fillers.

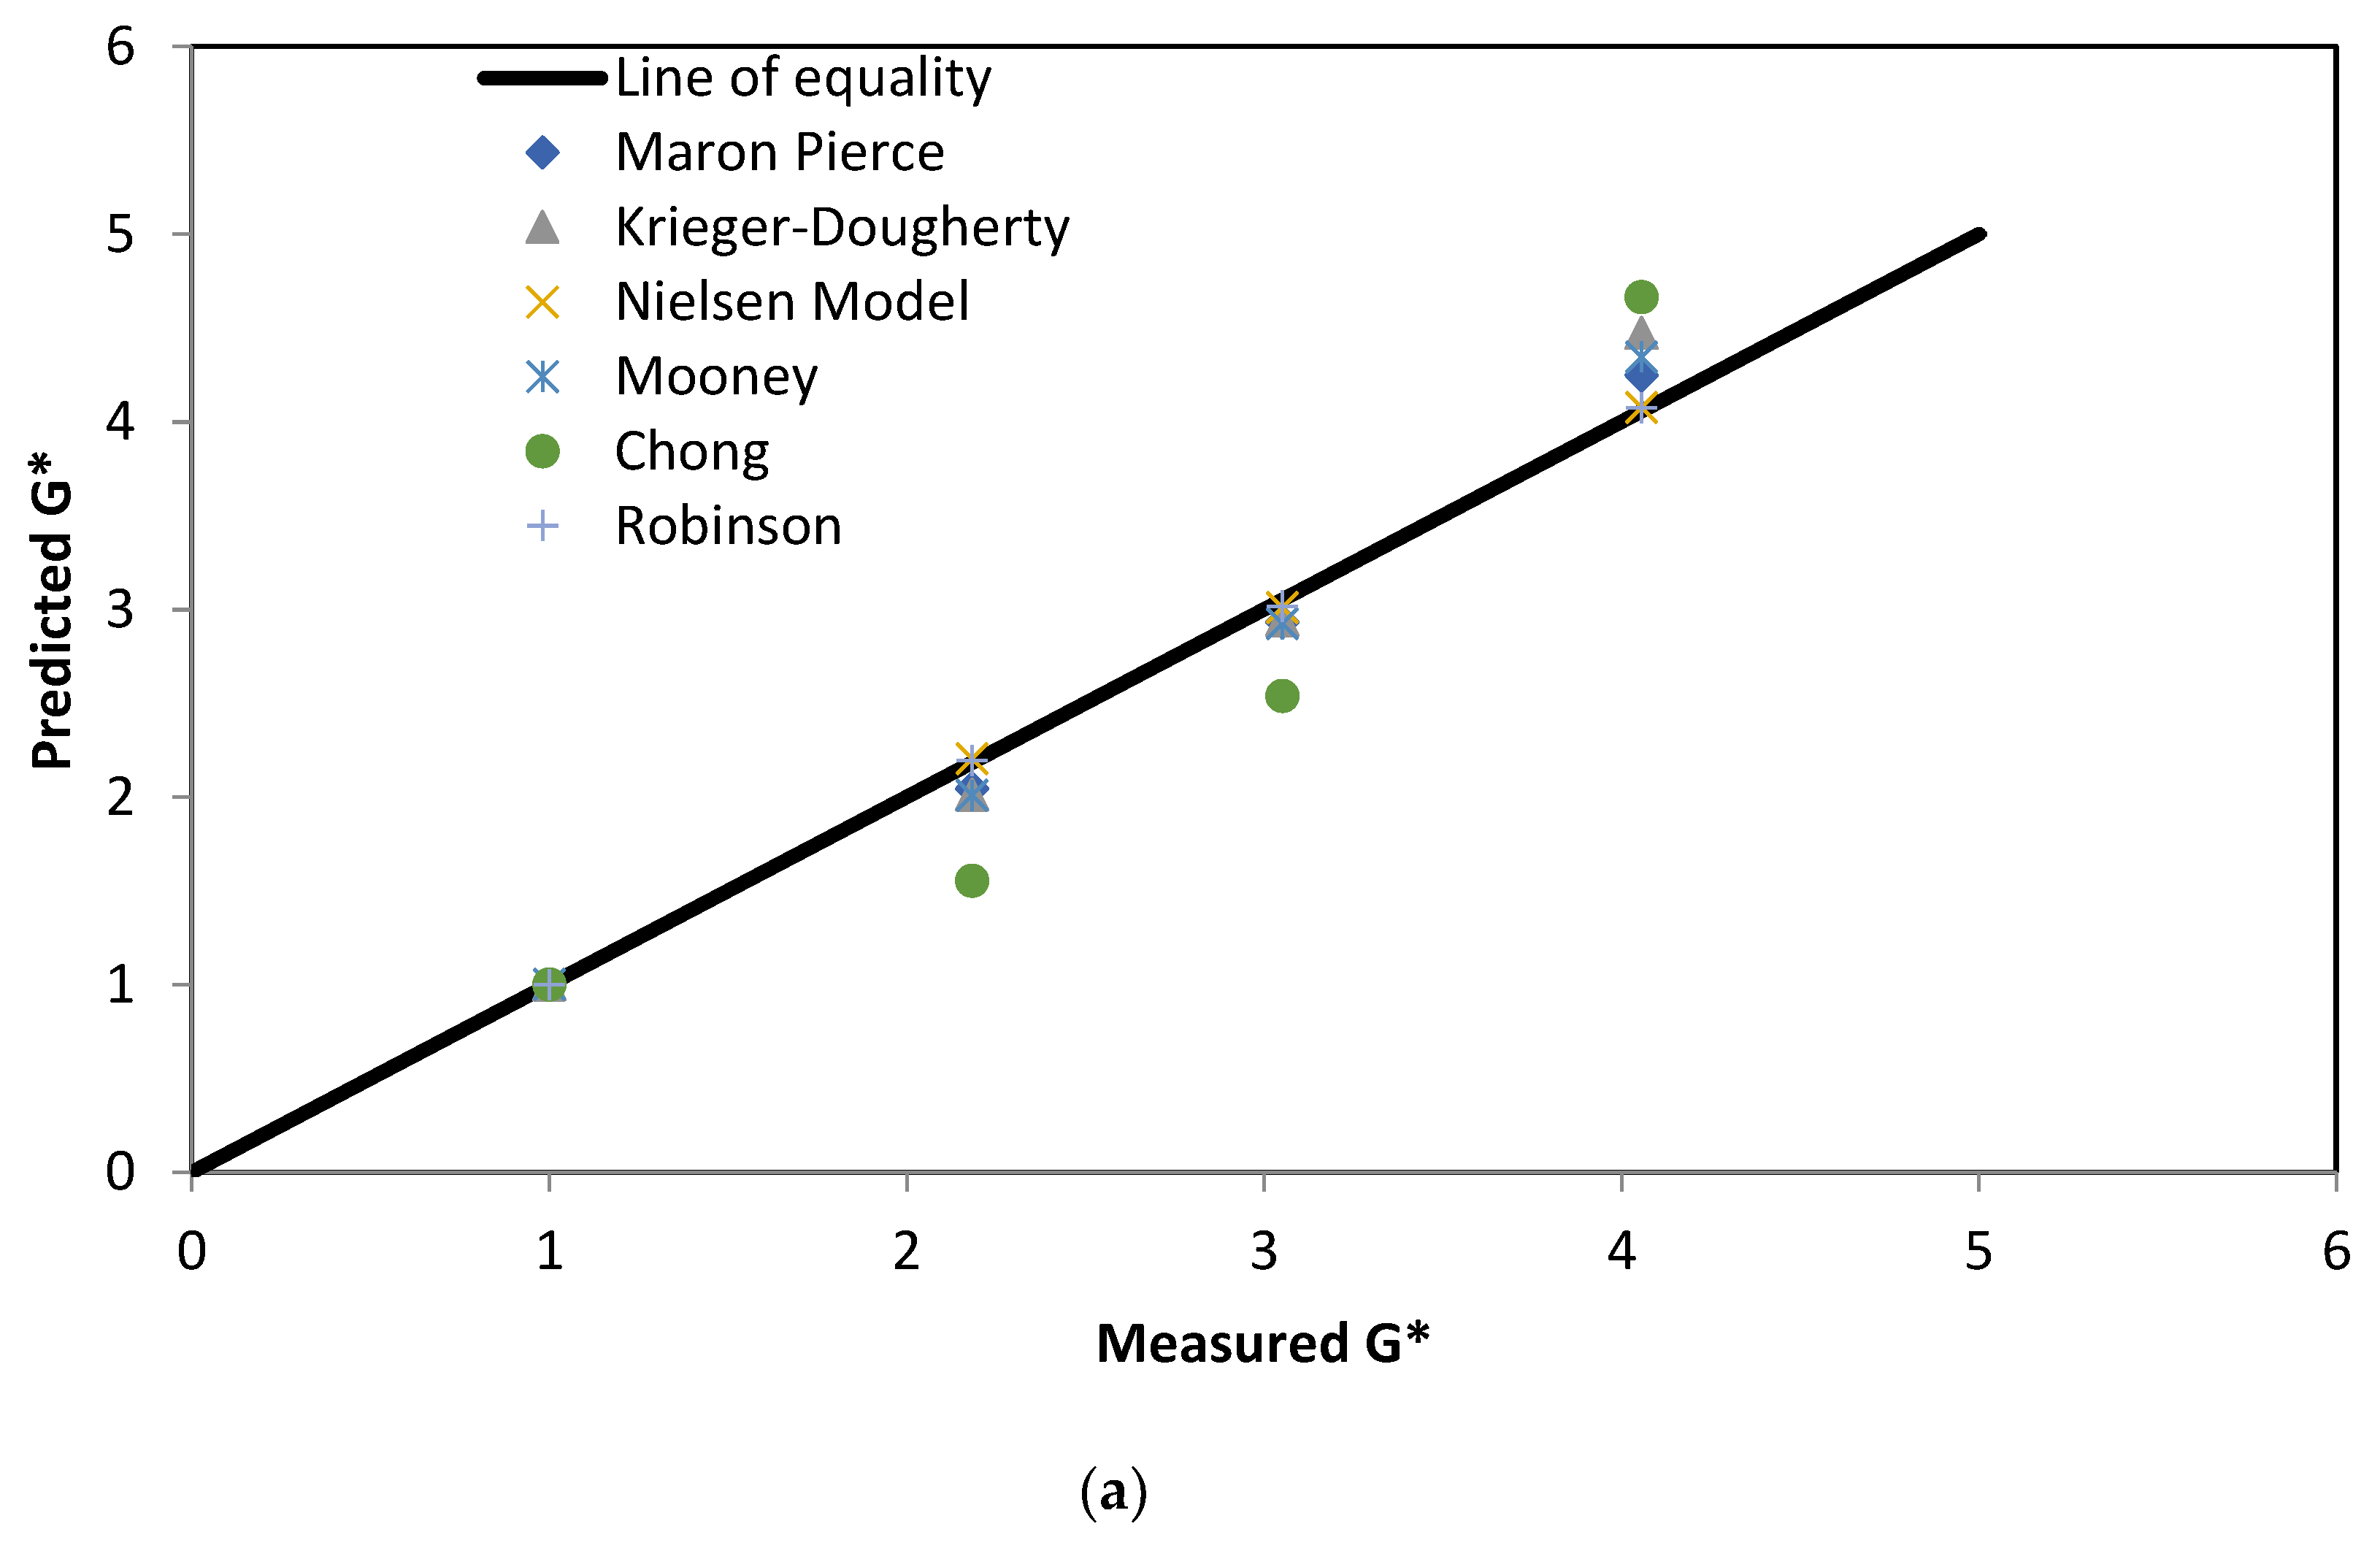
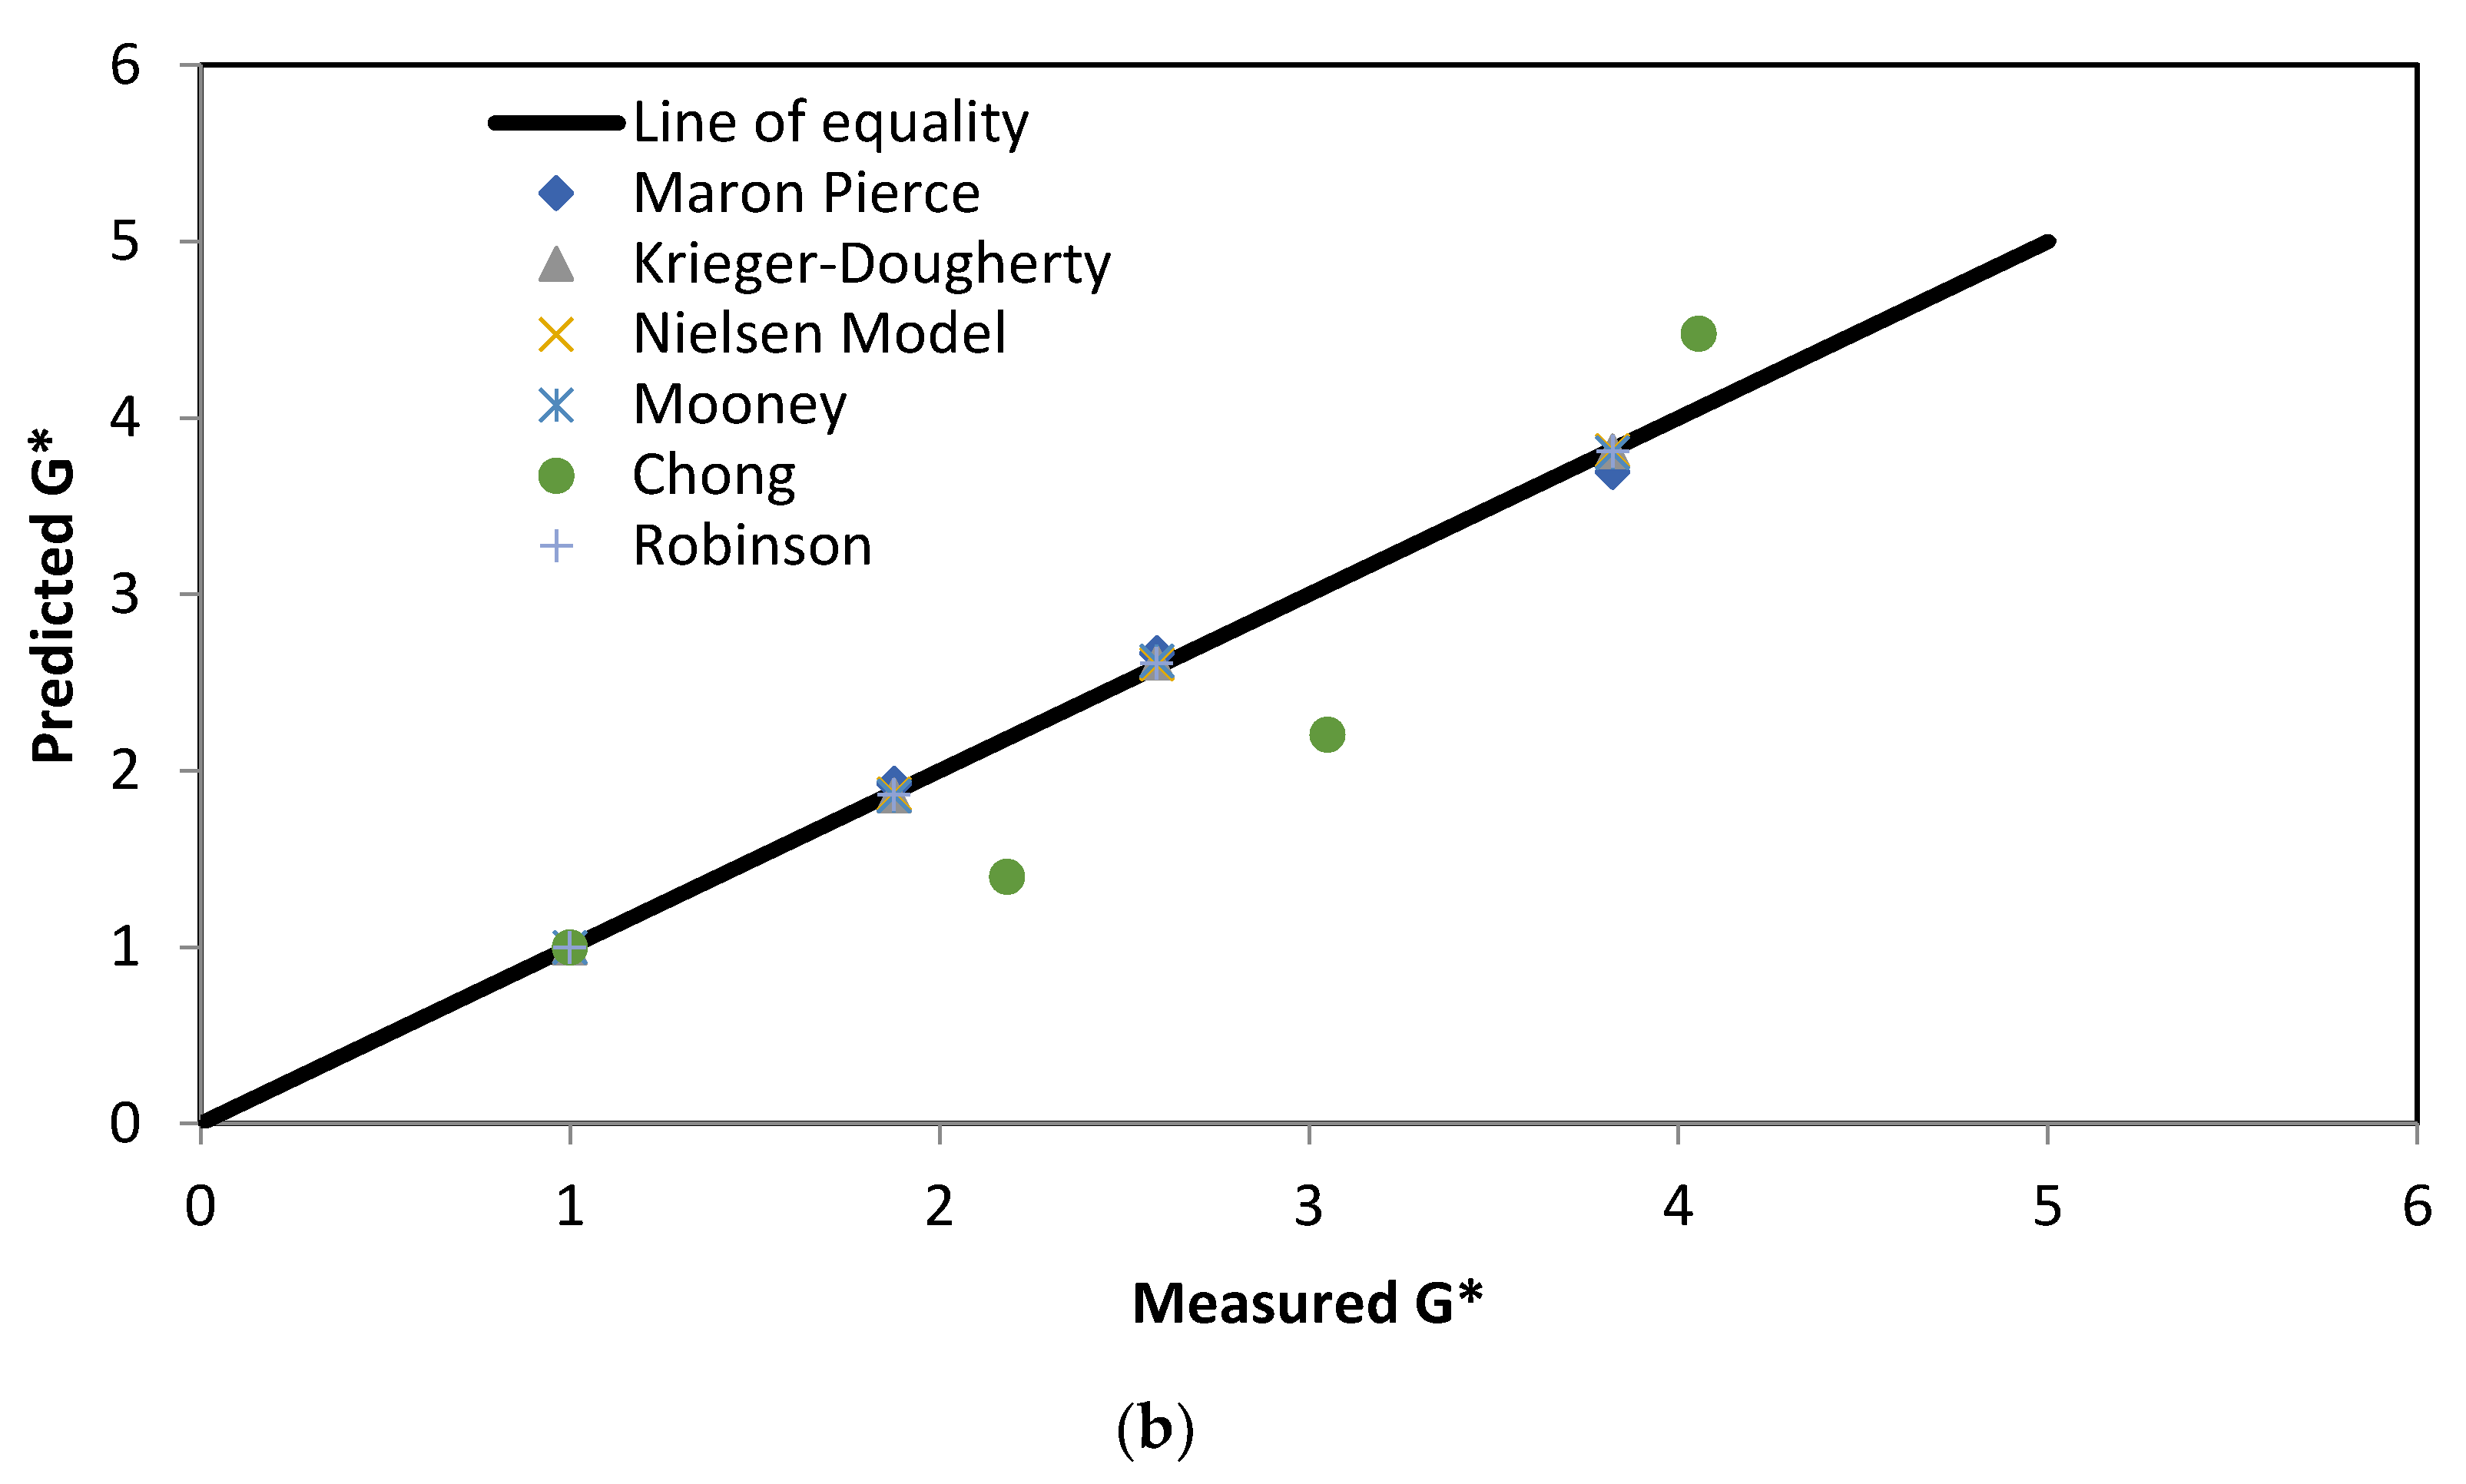
3.5.3. Goodness-of-Fitting

The stiffening potential differences of micromechanics models are further elaborated with the line of equality graph [39]. Figure 11 shows the good correlation of measured and predicted stiffness except for the Chong model.
In Table 5, the maximum packing fraction (φm) for limestone in the Mooney model is significantly higher than Krieger–Dougherty, Lewis Nielsen, Chong, and Robinson models. KE is significantly lower for granite in the same model as compared to Krieger–Dougherty, Lewis Nielsen, Chong, and Robinson models. Moreover, Krieger–Dougherty, Lewis Nielsen, Chong, and Robinson models seem to be in good agreement for limestone and granite. The increased value of KE than 2.5 indicated is probably due to a number of factors such as particle shape, size, and surface roughness. The value 2.5 is corresponding to rigid, spherical, and smooth particles.
In this research, the particle shape was assumed to be spherical. We recommend that KE and ϕm should be adjusted for real systems in future studies. These adjusted values will improve the prediction of the stiffening effect. For example, the agglomeration of roughly spherical particles will affect the packing and can be incorporated by adjusting KE and ϕm.
We recommend comparing the stiffening effects based on rheology, micromechanics, and approaches based on morphology and physical tests, etc. An example is the work of Antunes et al. [46]. The researchers studied the filler–bitumen interaction based on SEM, and simple tests of a specific surface, fractional voids and the bitumen number.

4. Conclusions and Recommendations

In this research, the stiffening effect of fillers was investigated based on mastic rheology and the application of micromechanics models. The rheological properties were measured with a dynamic shear rheometer (DSR). The models include the Maron–Pierce Model, Nielsen Model, Mooney Equation, Krieger–Dougherty Model, Chong et al. Model, and Robinson Model.
The results show that the same volume content of the filler has a different effective volume in mastic. This will result in different stiffening effects. The fillers increase the stiffening effect of the composite, especially at high temperatures. The fillers with similar effective volume and packing show similar behaviour. The acidic fillers result in lower viscosity, while basic filler results in higher viscosity in mastic. The stiffening effect is dependent on the filler type.
Micromechanics-based models can predict stiffening potential from the properties of the individual ingredient properties. The models produced good results at low volume concentrations with the exception of the Chong model. Maron–Pierce model underestimated the stiffening potential of granite mastic at higher concentrations. In comparison to other models, the values ϕm and KE in the Mooney model are significantly different for limestone and granite, respectively. In future studies, we recommend adjusting the KE and ϕm to account for variations of particle shape, size, surface texture, dispersion, and agglomeration, etc.
It is difficult to precisely model the mastic data with any single model due to the presence of complex stiffening effects beyond volume filling. The stiffening effect is complicated by the presence of the adsorption layer. This increases the effective volume of filler and will eventually reduce the maximum packing ϕm in suspension. Although models somewhat accurately predicted the stiffening potential of fillers, they only account for volume filling and exclude the physicochemical interactions.

Author Contributions

Conceptualisation, A.R.; formal analysis, A.R. and A.M.; investigation, A.R. and A.M.; resources, A.R. and A.M.; writing—original draft preparation, A.R., A.M. and N.I.M.Y.; writing—review and editing, A.R., G.A., N.T. and N.I.M.Y.; supervision, G.A. and N.T.; funding acquisition, N.I.M.Y. All authors have read and agreed to the published version of the manuscript.

Funding

Universiti Kebangsaan Malaysia supported paying the Article Processing Charges (APC) of this publication (DIP-2020-003 and Dana Pecutan Penerbitan FKAB 2021).

Institutional Review Board Statement

Not applicable.

Informed Consent Statement

Informed consent was obtained from all subjects involved in the study.

Data Availability Statement

All data used in this research can be provided upon request.

Acknowledgments

The authors would like to thank Universiti Kebangsaan Malaysia for their financial support.

Conflicts of Interest

The authors declare no conflict of interest.

References

  1. Hamim, A.; Md Yusoff, N.I. The Use of Stabilisation Materials in Cold-in Place Recycling of Flexible Pavement. J. Kejuruter. 2013, 25, 1–9. [Google Scholar] [CrossRef]
  2. Li, F.; Yang, Y.; Wang, L. Evaluation of physicochemical interaction between asphalt binder and mineral filler through interfacial adsorbed film thickness. Constr. Build. Mater. 2020, 252, 119135. [Google Scholar] [CrossRef]
  3. Milad, A.A.; Ali, A.S.B.; Yusoff, N.I.M. A review of the utilisation of recycled waste material as an alternative modifier in asphalt mix-tures. Civ. Eng. J. 2020, 6, 42–60. [Google Scholar] [CrossRef]
  4. Chen, J.-S. Rheological Properties of Asphalt-Mineral Filler Mastics. Doboku Gakkai Ronbunshu 1997, 571, 269–277. [Google Scholar] [CrossRef] [Green Version]
  5. Haider, S.; Hafeez, I.; Zaidi, S.B.A.; Nasir, M.A.; Rizwan, M. A pure case study on moisture sensitivity assessment using tests on both loose and compacted asphalt mixture. Constr. Build. Mater. 2020, 239, 117817. [Google Scholar] [CrossRef]
  6. Liao, M.-C. Small and Large Strain Rheological and Fatigue Characterisation of Bitumen-Filler Mastics. Ph.D. Thesis, The University of Nottingham, Nottingham, UK, 2007. [Google Scholar]
  7. Liu, G.; Yang, T.; Li, J.; Jia, Y.; Zhao, Y.; Zhang, J. Effects of aging on rheological properties of asphalt materials and asphalt-filler interaction ability. Constr. Build. Mater. 2018, 168, 501–511. [Google Scholar] [CrossRef]
  8. Shashidhar, N.; Romero, P. Factors Affecting the Stiffening Potential of Mineral Fillers. Transp. Res. Rec. 1998, 1638, 94–100. [Google Scholar] [CrossRef]
  9. Taylor, R. Surface Interactions between Bitumen and Mineral Filler and Their Effects on the Rheology of Bitumen-Filler Mastics. Ph.D. Thesis, The University of Nottingham, Nottingham, UK, 2007. [Google Scholar]
  10. Wu, J.; Han, W.; Aiiey, G.; Yusoff, M.; Izzi, N. The Influence of Mineral Aggregates on Bitumen Ageing. Int. J. Pavement Res. Technol. 2014, 7, 115–123. [Google Scholar]
  11. Lesueur, D.; Little, D.N. Effect of Hydrated Lime on Rheology, Fracture, and Aging of Bitumen. Transp. Res. Rec. 1999, 1661, 93–105. [Google Scholar] [CrossRef]
  12. Anderson, D.A.; Bahia, H.U.; Dongre, R. Rheological Properties of Mineral Filler-Asphalt Mastics and Its Importance to Pavement Per-formance. In Effects of Aggregates and Mineral Fillers on Asphalt Mixture Performance; Meininger, R.C., Ed.; ASTM International: West Conshohocken, PA, USA, 1992; pp. 131–153. ISBN 978-0-8031-5204-5. [Google Scholar]
  13. Chen, Y.; Xu, S.; Tebaldi, G.; Romeo, E. Role of mineral filler in asphalt mixture. Road Mater. Pavement Des. 2020, 1–40. [Google Scholar] [CrossRef]
  14. Richardson, C. The Theory of the Perfect Sheet Asphalt Surface. J. Ind. Eng. Chem. 1915, 7, 463–465. [Google Scholar]
  15. Rigden, P.J. The use of fillers in bituminous road surfacings. A study of filler-binder systems in relation to filler characteristics. J. Soc. Chem. Ind. 1947, 66, 299–309. [Google Scholar] [CrossRef]
  16. Anderson, D.A.; Goetz, W.H. Mechanical Behavior and Reinforcement of Mineral Filler-Asphalt Mixtures; Technical Paper, FHWA/IN/JHRP-73/05; Joint Highway Research Project, Indiana Department of Transportation and Purdue University: West Lafayette, IN, USA, 1973. [Google Scholar]
  17. Faheem, A.F.; Bahia, H.U. Conceptual Phenomenological Model for Interaction of Asphalt Binders with Mineral Fillers. J. Assoc. Asph. Paving Technol. 2009, 78, 679–720. [Google Scholar]
  18. Heukelom, O.; Wijga, P.W.O. Viscosity of Dispersions as Governed by Concentration and Rate of Shear. J. Assoc. Asph. Paving Technol. 1971, 40, 418–437. [Google Scholar]
  19. Hashin, Z. The Elastic Moduli of Heterogeneous Materials. J. Appl. Mech. 1962, 29, 143–150. [Google Scholar] [CrossRef]
  20. Christensen, R.; Lo, K. Solutions for effective shear properties in three phase sphere and cylinder models. J. Mech. Phys. Solids 1979, 27, 315–330. [Google Scholar] [CrossRef]
  21. Huang, B.; Shu, X.; Chen, X. Effects of mineral fillers on hot-mix asphalt laboratory-measured properties. Int. J. Pavement Eng. 2007, 8, 1–9. [Google Scholar] [CrossRef]
  22. Hesami, E.; Jelagin, D.; Kringos, N.; Birgisson, B. An empirical framework for determining asphalt mastic viscosity as a function of mineral filler concentration. Constr. Build. Mater. 2012, 35, 23–29. [Google Scholar] [CrossRef]
  23. Gubler, R.; Liu, Y.; Anderson, D.; Partl, M. Investigation of the System Filler and Asphalt Binders by Rheological Means. J. Assoc. Asph. Paving Technol. 1999, 68, 284–302. [Google Scholar]
  24. Yusoff, N.I.M.; Ibrahim Alhamali, D.; Ibrahim, A.N.H.; Rosyidi, S.A.P.; Abdul Hassan, N. Engineering characteristics of nanosili-ca/polymer-modified bitumen and predicting their rheological properties using multilayer perceptron neural network model. Constr. Build. Mater. 2019, 204, 781–799. [Google Scholar] [CrossRef]
  25. Mooney, M. The viscosity of a concentrated suspension of spherical particles. J. Colloid Sci. 1951, 6, 162–170. [Google Scholar] [CrossRef]
  26. Nielsen, L.E. Generalized Equation for the Elastic Moduli of Composite Materials. J. Appl. Phys. 1970, 41, 4626–4627. [Google Scholar] [CrossRef]
  27. Maron, S.H.; Pierce, P.E. Application of ree-eyring generalized flow theory to suspensions of spherical particles. J. Colloid Sci. 1956, 11, 80–95. [Google Scholar] [CrossRef]
  28. Lewis, T.B.; Nielsen, L.E. Dynamic mechanical properties of particulate-filled composites. J. Appl. Polym. Sci. 1970, 14, 1449–1471. [Google Scholar] [CrossRef]
  29. Halpin, J. Stiffness and Expansion Estimates for Oriented Short Fiber Composites. J. Compos. Mater. 1969, 3, 732–734. [Google Scholar] [CrossRef]
  30. Tsai, S.W. US Government Dept. of Commerce, Rep. 1968. Available online: https://apps.dtic.mil/sti/citations/AD0834851 (accessed on 1 May 2021).
  31. Krieger, I.M.; Dougherty, T.J. A Mechanism for Non-Newtonian Flow in Suspensions of Rigid Spheres. Trans. Soc. Rheol. 1959, 3, 137–152. [Google Scholar] [CrossRef]
  32. Chong, J.S.; Christiansen, E.B.; Baer, A.D. Rheology of concentrated suspensions. J. Appl. Polym. Sci. 1971, 15, 2007–2021. [Google Scholar] [CrossRef]
  33. Robinson, J.V. The Viscosity of Suspensions of Spheres. J. Phys. Colloid Chem. 1949, 53, 1042–1056. [Google Scholar] [CrossRef]
  34. Robinson, J.V. The Viscosity of Suspensions of Spheres. III. Sediment Volume as a Determining Parameter. Trans. Soc. Rheol. 1957, 1, 15–24. [Google Scholar] [CrossRef]
  35. Rutgers, I.R. Relative viscosity and concentration. Rheol. Acta 1962, 2, 305–348. [Google Scholar] [CrossRef]
  36. Kim, Y.-R.; Little, D.N. Linear Viscoelastic Analysis of Asphalt Mastics. J. Mater. Civ. Eng. 2004, 16, 122–132. [Google Scholar] [CrossRef]
  37. Yusoff, N.I.M.; Chailleux, E.; Airey, G.D. A Comparative Study of the Influence of Shift Factor Equations on Master Curve Construction. Int. J. Pavement Res. Technol. 2011, 4, 324–336. [Google Scholar]
  38. Yusoff, N.I.M.; Shaw, M.T.; Airey, G. Modelling the linear viscoelastic rheological properties of bituminous binders. Constr. Build. Mater. 2011, 25, 2171–2189. [Google Scholar] [CrossRef] [Green Version]
  39. Yusoff, N.I.M.; Jakarni, F.M.; Nguyen, V.H.; Hainin, M.R.; Airey, G. Modelling the rheological properties of bituminous binders using mathematical equations. Constr. Build. Mater. 2013, 40, 174–188. [Google Scholar] [CrossRef]
  40. Heukelom, W. The Role of Filler in Bitumen Mixes. J. Assoc. Asph. Paving Technol. 1965, 34, 396–429. [Google Scholar]
  41. Diba, F.S.; Boden, A.; Thissen, H.; Bhave, M.; Kingshott, P.; Wang, P.-Y. Binary colloidal crystals (BCCs): Interactions, fabrication, and applications. Adv. Colloid Interface Sci. 2018, 261, 102–127. [Google Scholar] [CrossRef] [PubMed]
  42. Antunes, V.; Freire, A.C.; Quaresma, L.; Micaelo, R. Influence of the geometrical and physical properties of filler in the filler–bitumen interaction. Constr. Build. Mater. 2015, 76, 322–329. [Google Scholar] [CrossRef]
  43. Winniford, R.S. The Rheology of Asphalt-Filler Systems as Shown by the Microviscometer. ASTM Spec. Tech. Publ. 1961, 309, 109–120. [Google Scholar]
  44. Ishai, I.; Craus, J. Effects of Some Aggregate and Filler Characteristics on Behavior and Durability of Asphalt Paving Mixtures. Transp. Res. Rec. J. Transp. Res. Board 1996, 1530, 75–85. [Google Scholar] [CrossRef]
  45. Faheem, A.F.; Bahia, H.U. Modelling of Asphalt Mastic in Terms of Filler-Bitumen Interaction. Road Mater. Pavement Des. 2010, 11, 281–303. [Google Scholar] [CrossRef]
  46. Abbas, A.; Masad, E.; Papagiannakis, T.; Shenoy, A. Modelling asphalt mastic stiffness using discrete element analysis and micromechanics-based models. Int. J. Pavement Eng. 2005, 6, 137–146. [Google Scholar] [CrossRef]
Figure 1. Measurement of (a) particle density; (b) Rigden voids.
Applsci 11 06521 g001aApplsci 11 06521 g001b
Figure 2. Dynamic shear rheometer.
Applsci 11 06521 g002
Figure 3. Master curves for complex modulus and phase angle.
Applsci 11 06521 g003
Figure 4. SEM image of limestone filler.
Applsci 11 06521 g004
Figure 5. Complex modulus master curves.
Applsci 11 06521 g005
Figure 6. Phase angle master curves of mastics.
Applsci 11 06521 g006
Figure 7. Shift factor plots of mastics.
Applsci 11 06521 g007
Figure 8. Stiffening ratios for limestone and granite.
Applsci 11 06521 g008
Figure 9. Micromechanics models for limestone mastic.
Applsci 11 06521 g009
Figure 10. Micromechanics models for granite.
Applsci 11 06521 g010
Figure 11. Line of equality graph for (a) limestone (b) granite.
Applsci 11 06521 g011aApplsci 11 06521 g011b
Table 1. Bulk mass properties of bitumen.
Bitumen.Penetration (dmm)Softening Point (°C)Density (g/cm3)
40/605350.41.030
Table 2. Physical properties of fillers.
FillerAbbreviation of MasticParticle Density (g/cm3)Rigden Voids
(%)
LimestoneLs2.6233
OPCOPC3.0245
GritstoneGs2.8140
GraniteGr2.7138
Table 3. Compositional and effective volume calculation.
FillerMass of FillerSpecific GravityMass of BitumenCompositional VolumeRigden VoidsEffective VolumeFree Bitumen Volume Content
MfSfMbVfεVeFBV
Limestone (Ls)209.842.62320029334456
OPC241.63.0220029455347
Gritstone (Gs)224.642.80820029404951
Granite (Gr)216.482.70620029384753
Table 4. XRD analysis for mineralogical composition.
LimestoneGranite
Mineral%Mineral%
Calcite72.8Quartz68.8
Dolomite20.2Calcite23.7
Quartz4.7Vandendriesscheite5.1
Colusite1.4Cuprite2.4
Table 5. Micromechanics models parameters.
ModelLimestone MasticGranite Mastic
φmKEφmKE
Maron–Pierce0.77-0.82-
Krieger–Dougherty0.473.390.463.01
Mooney0.792.020.491.43
Lewis Nielsen0.495.240.413.27
Chong0.485.660.403.01
Robinson0.534.910.423.13
Publisher’s Note: MDPI stays neutral with regard to jurisdictional claims in published maps and institutional affiliations.

