Abstract
We examine the plausibility of aerial transmission of pathogens (including the SARS-CoV-2 virus) through respiratory droplets that might be carried by exhaled e-cigarette aerosol (ECA). Given the lack of empiric evidence on this phenomenon, we consider available evidence on cigarette smoking and respiratory droplet emission from mouth breathing through a mouthpiece as convenient proxies to infer the capacity of vaping to transport pathogens in respiratory droplets. Since both exhaled droplets and ECA droplets are within the Stokes regime, the ECA flow acts effectively as a visual tracer of the expiratory flow. To infer quantitatively the direct exposure distance, we consider a model that approximates exhaled ECA flow as an axially symmetric intermittent steady starting jet evolving into an unstable puff, an evolution that we corroborate by comparison with photographs and videos of actual vapers. On the grounds of all this theoretical modeling, we estimate for low-intensity vaping (practiced by 80–90% of vapers) the emission of 6–210 (median 39.9, median deviation 67.3) respiratory submicron droplets per puff and a horizontal distance spread of 1–2 m, with intense vaping possibly emitting up to 1000 droplets per puff in the submicron range with a distance spread over 2 m. The optical visibility of the ECA flow has important safety implications, as bystanders become instinctively aware of the scope and distance of possible direct contagion through the vaping jet.
PACS:
47.27.wg; 47.60.Kz; 47.63.Ec; 82.70.Rr
1. Introduction
The evolution of bioaerosols spreading disease contagion through respiratory droplets has been widely studied, as can be appreciated in reviews on generic pathogens by Gralton et al. [1] and Zhang et al. [2], the influenza and SARS viruses [3,4] and in spread risk modeling [5] (see the chapter on bioaerosols and cited references therein in [6]). As expected, the current COVID-19 pandemic has motivated the study of direct and indirect aerial transmission of the SARS-CoV-2 virus through various expiratory activities.
There is currently a broad consensus, endorsed by the WHO [7] and the CDC [8], that contagion of the SARS-CoV-2 virus occurs either by close range exposure to relatively large droplets emitted by infectious individuals or through indirect exposure to smaller submicron droplets denoted by the term “aerosols” (see, e.g., [9,10,11,12]), although the scope and relevance of each contagion route depend on local factors (volume, occupancy and ventilation regimes of inner spaces) [13,14,15,16,17,18]. The m cut-off separating larger droplets and “aerosols” is merely a convention that artificially simplifies droplet dynamics that vary along a continuous spectrum of diameters into two mutually exclusive modalities; thus, we avoid as much as possible the binary “droplets” vs. “aerosols” terminology.
The purpose of the present paper is to fill an important gap in the above-mentioned body of literature on pathogen (including SARS-CoV-2) spread through respiratory droplets, namely to examine the plausibility, scope and risks of this transmission taking place through a different expiratory route: exhaled e-cigarette aerosol (ECA). While there is no factual evidence or proper elaborate research (a search of the literature revealed three opinion pieces [19,20,21] that offer a very limited argumentation) on pathogen transmission through this vehicle, we hypothesize that it is entirely plausible that it occurs, simply because vaping (usage of e-cigarettes) is an expiratory activity (as well as smoking). To fulfill this task, we need to develop a comprehensive and interdisciplinary theoretical modeling of this phenomenon, proceeding along the following methodological steps:
- 1.
- The wide variety of vaping styles and puffing protocols bears influence on respiratory parameters. We follow a practical and convenient simplification of this intensity spectrum by considering two principal modes: a low-intensity style (“mouth to lung”) style and a high-intensity one (“direct to lung”)
- 2.
- Available evidence on the physical and physicochemical properties of ECA show that its particulate phase (submicron liquid droplets) evolves within the Stokes regime, in which viscous forces dominate over inertial forces, so that particle Reynold numbers are negligible (). As a consequence, the particles trace the fluid flow (basically exhaled air) roughly as tracer gases or molecular contaminants.
- 3.
- To infer the respiratory dynamical parameters that can be associated with vaping, we need to estimate the volume of exhaled ECA aerosol per puff (vaping tidal volume) and its exhalation velocity. We use for this purpose available data on a very useful proxy: cigarette smoking. Since vaping involves suction through a mouthpiece, we also need to look at the effects of these instruments on respiratory parameters.
- 4.
- Given the outcomes of the previous step, we estimate a range of exhalation velocities that can associated with vaping. Comparing this velocity range with exhalation velocity data for various respiratory activities, we infer that mouth breathing through a mouthpiece provides an appropriate proxy for estimating the size and numbers of respiratory droplets that should be transported by exhaled ECA.
- 5.
- Considering available observational and experimental data on droplet emission from mouth breathing, we infer that ECA flow should be overwhelmingly carrying submicron desiccated droplets of the type known as “aerosols”. Just as ECA droplets, these “aerosols” lie in the Stokes regime, so that the exhaled ECA flow provides an accurate visual tracing to infer how far they can be transported to produce direct exposure to bystanders located in the direction of this flow.
Given these estimations and inferences, we model the exhaled ECA flow in an indoor space with natural ventilation as a turbulent isothermal starting jet evolving into an unstable puff, evaluating the maximal distance for direct exposure to respiratory droplets potentially carried by vaping exhalations. This theoretical jet/puff model seems to provide a reasonable approximation to real life vaping jet/puff systems seen in photographs and videos of actual vapers vaping (see Section 5.3 and the Supplementary Material SM(3)). We do not consider in this paper indirect exposure to desiccated respiratory droplets (“aerosols”) that might remain extended times in the environment after this jet evolves into an unstable puff and disperses, as the dynamics of these particles depends on indoor air currents and not on the vaping jet.
The relevance of the present paper follows from the fact that the current COVID-19 pandemic has forced millions of vapers, smokers and non-users surrounding them into sharing indoor spaces under various degrees of home confinement. Objective research on COVID-19 transmission through exhaled ECA can serve to guide evidence-based public policies to address public health concerns and risk management and minimization to address this phenomenon. Given the relevance of safety assessment in the context of the COVID-19 pandemic, we elaborated two articles related to (but fully independent from) the present article: one is a full risk analysis of vaping emissions in shared indoor spaces [22], while the other is a short article [23] discussing their public health and public policy implications, as well as reviewing available evidence on the relations between COVID-19 and smoking and vaping.
It is necessary to issue the following important disclaimer: The present article is concerned only with the plausibility, scope and risks of pathogen (including SARS-CoV-2) transmission through exhaled ECA, not with vaping as a possible risk factor for becoming infected by the virus or for any evolution or stage of adverse health outcomes associated with COVID-19 (these issues are examined in [23]). In addition, we are not concerned with possible health hazards by users’ exposure to inhaled ECA or bystanders to exhaled ECA derived from the usage of e-cigarettes as substitute of tobacco smoking. Readers are advised to consult the available literature on these subjects (see extensive reviews [24,25,26,27,28]).
Another important disclaimer: this paper does not address potential COVID-19 contagion through respiratory droplets carried by environmental tobacco smoke, although smoking can serve as a useful proxy for understanding the respiratory and dynamical parameters of low-intensity (‘mouth to lung’) puffing style practiced by 80–90% of vapers. However, most of the results we obtain are applicable to “mainstream” smoke exhalations emitted by smokers, not to sidestream emissions from the burning/smouldering tip of cigarettes, cigars and pipes that make the bulk of environmental tobacco smoke.
In what follows, we provide a quick section by section summary of the paper following the methodological structure outlined above. Background material is presented Section 2: vaping styles and demographics (Section 2.1); a brief review of physical and physicochemical properties of inhaled and exhaled ECA (Section 2.2); and exhaled ECA as a tracer of expiratory fluid flow (Section 2.3). Section 3 (Methods) provides the material needed to infer respiratory mechanics and possible respiratory droplet emission for vaping: the effects of suction (Section 3.1) and mouthpieces (Section 3.2), and then evidence on droplet emission from mouth breathing that should provide an appropriate proxy for vaping (Section 3.3). In Section 4, we present a model of a turbulent starting jet with finite injection evolving into an unstable puff to infer the horizontal distance that respiratory droplets potentially carried exhaled ECA flow should be transported. The results obtained from these sections are summarized in Section 5. Droplet emission (Section 5.1): Low-intensity vaping should exhale 700–900 per puff, carrying 6–200 droplets (median 39.9, median deviation 67.3), overwhelmingly in the submicron range, while high-intensity vaping should exhale a tidal volume of 1000–3000 per puff carrying possibly several hundreds and up to over 1000 droplets also in the submicron range. The predictions of the jet/puff hydrodynamical model presented in Section 4 yield (Section 5.2) a horizontal distance spread between 0.5 and 2 m (low-intensity vaping) and over 2 m (high-intensity vaping) in the direction of the exhaled jet. In Section 5.3, we validate the jet/puff model by comparison with photographs and videos of actual vapers. We conclude the paper by presenting in Section 6 its limitations, together with a final thorough discussion.
2. Background
2.1. Vaping Styles and Demographics
2.1.1. Puffing Topography
Vaping is characterized by a wide range of distinct and individualized usage patterns loosely described by the parameters of puffing topography: puff and inter puff duration, puff volume and flow (see [29,30,31,32]). This style diversity complicates the study and evaluation of e-cigarette aerosol (ECA) emissions, more so given the need to upgrade standardization of vaping protocols, especially for the appropriate configuration of vaping machines used for research and regulation.
To simplify the description of vaping style, we consider two vaping topographies, MTL and DTL, described as follows
- Low-intensity “Mouth-To-Lung” (MTL). It consists of three stages: (1) “puffing”, where ECA is sucked orally while breathing through the nose; (2) the puffed ECA is withdrawn from the mouth and held in the oropharyngeal cavity without significant exhalation; and (3) inhalation into the lungs of the ECA bolus by tidal volume of air from mouth and nose inspiration. It is a low-intensity regime involving mostly low-powered devices (mostly starting kits, closed systems and recent “pods”) roughly similar to the topography of cigarette smoking.
- High-intensity “Direct-To-Lung” (DTL). Step 1 is the same as in MTL, but it bypasses Step 2. The ECA bolus diluted in tidal volume is inhaled directly into the lung without mouth retention. It is mostly a high-intensity regime associated with advanced-tank systems.
The topography parameters characterizing these styles are listed in Table 1. It is important to remark that these parameters change when vaping ad libitum in natural environments instead of doing so in a laboratory setting. This was reported by Spindle et al. [31]: for example, average puff duration was about 20% longer ad libitum, 5 s vs. 4 s in a laboratory setting.

Table 1.
Parameters of vaping topography for vaping styles. Puff topography parameters: are, respectively, mass (mg) (aerosol yield), volume (mL), flow (mL/s) per puff of ECA bolus (aerosol yield). Notice that tidal volume listed in the table is not the tidal volume for quiet rest breathing (400–600 mL), since vaping involves suction of ECA through a mouthpiece (see Section 3.1 and Section 3.2). Puff time (s) is . Values taken from from rough representative averages from data in Figures 1 and 3 of Spindle et al. [31] and also from Soulet et al. [32].
A third puffing topography not included in Table 1 is “Mouth Puffing”: it shares Step 1 of MTL but without Step 3, with the ECA bolus diluted in tidal volume air being exhaled without lung inhalation. It is a low-intensity regime but involving higher exhaled aerosol density, since less than 5% of aerosol mass is deposited in the mouth (see [33]). Very few vapers and cigarette smokers use this style, but most smokers of prime cigars and tobacco pipes do.
2.1.2. Demographics and Markets
It is crucial to examine how representative among vapers are the different puff topographies and levels of intensity, something that has varied with time depending on the popularity and availability of different devices. Currently, low-powered devices (mostly but not exclusively closed) are the most representative in the largest and most established markets. As shown in Figure S1 (with credit to [34]), consumer surveys reveal that the overwhelming majority of vapers (90% in the USA and 80% in the UK) utilize low-powered devices (mostly kits for beginners and closed systems) that operate with the low-intensity MTL style, while only a minority use advanced open-tank systems appropriate for the intense DTL style.
2.2. Inhaled and Exhaled E-Cigarette Aerosol (ECA)
ECA is generated by various physicochemical processes: self-nucleated condensation in a super saturated medium initiates immediately once the e-liquid vapor leaves the coil, and the nucleated centers generate small nanometer-scale droplets that grow through coagulation and diffusion (see detailed explanation in [35]). The particulate phase is made of liquid droplets whose chemical composition closely matches that of the e-liquid: propylene glycol (PG), vegetable glycerin or glycerol (VG), nicotine and water [36], together with a trace level contribution of nanometer-sized metal particles [37]. The gas phase is chemically similar. The aerosol contains nicotine and residues produced from the pyrolysis of the glycols and the flavorings (mainly carbonyls), which can be in either the gas or particulate phase depending on their vapor pressure and volatility [38], with most of the PG evaporating into the gas phase and VG tending to remain in the droplets [36].
Count mean diameter (CMD) distributions of mainstream ECA droplets vary depending on the device, puffing style of users, flavors and nicotine content [35,39]. Droplet number count is heavily dominated by submicron droplets with CMD distributions having either single modes below 100 nm or bimodal forms (one mode well below 100 nm and one in the range 100–300 nm) [35,39,40,41,42,43]. However, particle size grows with increasing coil power [39] and even in low-powered devices the mass distribution is dominated by droplets larger than 600 nm [35]. In fact, Floyd et al. [35] found a third mode around 1 m that becomes more prominent at increasing power of the tested device while the nanometer-sized modes decrease, likely because higher power involves larger vaporized mass that favors coagulation and scavenging of nanometer-sized droplets by larger droplets.
The inhaled aerosol mass yield depends on the topography parameters given in Table 1. At inhalation of mainstream ECA, instrument measured droplet density numbers are in the range (see [39,40,41,42,43]). Total average ECA droplet numbers of were reported by Manigrasso et al. [44] for a tank system using e-liquids with high nicotine content in a 2 s machine puff regime with mL puff volume ( decreases 25% with nicotine-free e-liquids). (These machine puff time lapses are different from those reported in Table 1. The former correspond only to inhalation times as instruments aim at simulation of a mouth inhalation, the latter are time lapses in human vapers and thus include inhalation and exhalation.) Using the same experimental design, Fuoco et al. [43] reported an increase of up to 30% for the 4 s machine puff regime. The estimation 10–10 is reasonable given a particle number concentration of and = 20–100 mL of low-intensity vaping, with for high-intensity vaping with mL.
Data on the gas/particle phase partition of the aerosol mass yield that is roughly Total Particulate Matter (TPM), PG/VG gas phase, water vapor and < nicotine [45], roughly a similar gas/particulate phase partition to that of tobacco smoke [46]. As shown in [36,38], the presence of compounds in gas or PM form depends on their vapor pressure, with PG tending to be gaseous, VG in PM, for nicotine it depends on its Ph, while some aldehydes (e.g., formaldehyde) are most likely in the gas phase.
Values of particle numbers and densities for the exhaled ECA can be estimated by considering its retention by the respiratory system. Compound specific retention percentages were reported by St. Helen et al. [47] for a wide variety of devices and e-liquids: 86% VG, 92% PG and 94% nicotine. Samburova et al. [48] reported 97% total aldehyde retention. These high retention percentages are consistent with the mass distribution of inhaled ECA dominated by larger micron-sized droplets which tend to be efficiently deposited in the upper respiratory tracts [35]. Assuming equal retention rate for the particulate and gas phases, we take as total mass of exhaled aerosol and total numbers of exhaled ECA droplet to be 10% of the values of listed in Table 1 and 10% of the values of reported in [44] for a 2 s machine inhalation puff and 50 mL puff volume. Droplet number density of ECA as it is exhaled can be estimated from these values of bearing in mind that the exhaled ECA is now diluted in tidal volumes listed in Table 1 for the various vaping topographies. This yields number densities in the approximate range = 10–10 (lower to higher vaping intensities).
Exhaled ECA dilutes and disperses very fast. Its chemical composition is similar to that of inhaled ECA, in both the gas phase and the droplets [35], with PG and water in the latter evaporating rapidly. Since hyperfine nanometer-sized droplets deposit efficiently by diffusion in the alveolar region and larger micron-sized droplets (which tend to grow from hygroscopic coagulation [33,35]) deposit by impaction in the upper respiratory tracts [33,39,41,44], the CMD distribution of ECA as it is exhaled should be dominated by modes in intermediate ranges 0.1–0.5 m. Since there are no ECA measurements at the exhalation point (the vaper’s mouth), we can estimate the representative droplet diameter by a rough order of magnitude calculation: assuming an aerosol mass yield of 5 mg of inhaled ECA for a low-powered device and a 90% retention of aerosol mass with 50% made of PM, the total droplet mass of exhaled ECA should be around mg. Assuming a 90% retention of inhaled droplets, the total number of exhaled droplets should be droplets (from inhaled numbers in [44]), leading to a median droplet mass of , where is the droplets density that we can assume to be close to VG density , leading to m. Similar order of magnitude values are obtained for the parameters of high-intensity vaping.
The fact that CMD chamber measurements are in the range = 0.1–0.2 m can be explained by the fact that detectors are located 1–2 m from the exhalation source, thus measured ECA droplets have already undergone significant degree of dilution and evaporation (as shown in [36], droplets’ mass can decrease by one third in just 1 s by evaporation of its PG content). This is consistent with droplet number densities dropping at least two orders of magnitude from 10–10 as they are exhaled to 10–10 at 1 m distance from the emission and further dropping to near background levels at 2 m [49,50,51].
2.3. Exhaled ECA as a Visual Tracer of Respiratory Fluid Flow
The overwhelmingly submicron droplets that form the particulate phase of ECA have negligible influence on its fluid dynamics, acting essentially as visible tracers or (to a good approximation) as molecular contaminants carried by the fluid. This follows from its basic fluid dynamical characteristic: it is a “single-phase fluid flow” (SFF) system [52,53]. As a consequence, ECA droplets visually mark the actual expiratory flow associated with vaping exhalations (we discuss the optical properties that allow for its visualization in [22]).
Exhaled ECA is just one among numerous gas markers and aerosols in a SFF regime that serve (and are widely used) to visualize expired air [54,55]. This also applies to mainstream exhaled tobacco smoke, whose particulate matter is also made of submicron liquid and solid droplets. In fact, there are studies that have directly used cigarette smoke as a tracer to visualize respiratory airflows [56,57,58]. Respiratory droplets potentially carried by exhaled ECA would not change its possible role as a tracer of expiratory flows, since, as we show in Section 3.3, these droplets are also overwhelmingly in the submicron range and their numbers are several orders of magnitude fewer than ECA droplets.
Submicron ECA droplets are carried by a fluid made of the gas phase of ECA strongly diluted in exhaled air (in practice, we can think of the carrier fluid as exhaled air at mouth temperature ∼30–35 C and 80–100% relative humidity). Under such conditions, ECA droplets essentially follow the fluid flow because of their little inertia, as they are well within the Stokes regime with Reynolds numbers and negligibly small relaxation times , the response time of an aerosol particle to adjust to external forces. For , we get [59]
where (close to VG density), the dynamic viscosity of air at 35 C and is the Cunningham slip factor with the mean molecular free path of air.
The relaxation time (1) provides the time scale for a particle released into a fluid with velocity U along a horizontal stream to settle into the fluid velocity (neglecting gravity). In this case (see Chapter 3 of [59]), the velocity of the particle becomes practically identical to U in about s (instantaneously in practical terms), thus justifying the notion of particles simply following the fluid flow with (practically) no influence on its dynamics, (effects that characterize the Stokes regime).
This behavior also occurs for the larger ECA droplets of whose relaxation times are (since ). Evidently, these relaxation times are much smaller than macroscopic characteristic times of the carrier fluid (e.g., a 2 s inhalation time or even the tenths of a second the ECA stays in the mouth cavity [33]). The Stokes number is defined as , where is a characteristic fluid time, hence for the exhaled ECA we have , which is another criterion to define the Stokes regime and is characteristic of SFF systems.
Evidently, larger droplets (diameters larger than a few m) are present in particle diameter distributions (of both ECA and respiratory droplets) and such particles should contain a significant portion of the aerosol mass [35], but they are too few in numbers and deviate from the flow following ballistic trajectories, thus do not affect the dynamics of the carrier fluid to consider ECA as a biphasic fluid flow system (as is the case with violent coughs or sneezes, see [60]).
3. Methods: Inferences on Respiratory Droplets Spread by ECA
3.1. Vaping as a Respiratory Process
Tobacco smoke is a valid physical reference for ECA, as it is also an aerosol in a SFF regime characterized by a particulate phase made of predominantly submicron particles with similar particle numbers and diameter distributions [35,41,61] (although the particulate and the gas phases of each aerosol have very different chemical properties). This fact, together with the fact that most vapers are either cigarette smokers or ex-smokers of cigarettes, justifies inferring the respiratory parameters of vaping (especially exhaled volume) from the respiratory parameters of smoking reported in the literature (see reviews in [62,63]; see also a summary of studies in Table S2).
3.1.1. Respiratory Parameters of Smoking
While there is a wide individual diversity in respiratory parameters among smokers, roughly the same three puffing topography patterns identified in Section 2.1 for vaping occur in smoking (with tobacco smoke instead of ECA) [64]. As with vaping, the most common cigarette smoking topography is MTL, an expected outcome since most vapers are either ex-smokers or current smokers of cigarettes. While a sizeable minority of 10–20% of vapers (see Section 2.1.2) follow the DLT style, the vast majority of smokers avoid direct lung inhalation because it is too irritant [65] (and is consistently associated with airways narrowing [64]). In fact, avoidance of the direct lung inhalation of DTL style is very likely an organic response to minimize to a tolerable level the irritant quality of tobacco smoke [64,65,66].
Regarding its respiratory parameters, cigarette smoking involves a larger percentage of vital capacity than rest breathing at 20–25% [62], although low-intensity inhalators might use on average only 14% [66]. It is extremely likely that these figures apply at least to MTL vaping. Other parameters such as expired tidal volume, puff times and volumes obtained in observational studies are listed in Table S2 (Supplementary Materials), where we use outcomes from references cited in two comprehensive reviews [62,63]. The summary of these outcomes is roughly:
- Puff Volume (volume of the smoke bolus drawn from the cigarette) is 20–70 mL.
- Puffing Time (time to draw the smoke bolus from the cigarette) is ∼2 s.
- Total smoking time lapse (inhalation, breath hold and exhalation) is ∼4–7 s.
- Tidal volume (the volume of the total inhaled/exhaled smoke mixed with air, in Table 1) varies widely between 500 and 1500 mL (with some outliers reaching as low as 300 mL or as high as 2000 mL), but typically group averages are between 700 and 900 mL.
It is worth remarking that puffing times are slightly shorter but roughly comparable to those of MTL vapers, while tidal volumes are 25–30% larger than rest tidal volumes (400–600 mL), although the measurement of these volumes is subject to at least a 10% error [67] and not all air drawn with the purpose of inhaling smoke is actually inhaled. Most studies report inhaled volumes, but exhalation volumes are roughly comparable (see Table S2), as smoke is highly diluted in air and its retention barely affects volume measurement.
3.1.2. Suction
As opposed to rest breathing, smoking and vaping involve suction: the inward force needed to draw smoke (or ECA) associated with the negative/positive pressure gradient generated by the diaphragm driven expansion/contraction of the lungs. Airflow resistance follows from the relation between the flow of air volume and this pressure gradient, a relation that can be modeled by the following power law (see [68,69])
where are determined empirically. This power law can be related to fluid dynamics (see discussion in [69]): the constants a and b correlate with fluid density, while the exponent b can be referred to the “classical” flow regimes: corresponds to laminar flow with Reynolds numbers (Pouseuille law), to turbulent flow with 10,000 (Blasius law) and to the “orifice” flow characterized by turbulent flow in narrow pipes and containers.
The theoretical connection with fluid mechanics has motivated airflow resistance measurements in the upper respiratory system that yield values around [68,69] for resting oral and nasal breathing. An excellent fit of this power law relation to the classical orifice flow was found for a conventional cigarette and two second-generation e-cigarettes by [61], with the e-cigarettes flow resistance a being 3–4 times larger than the conventional cigarette. As a consequence, given the same suction effort (same ), a conventional cigarette yields a puffing flow 3–4 times larger than the tested e-cigarettes (second generation). However, vapers can compensate for the higher flow resistance of ECA and draw relatively large aerosol mass with the same suction effort by puffing for longer times (as shown by topography studies). In addition, the laboratory measurements of Sosnowski and Kramek-Romanowska [61] were conducted under idealized conditions and are very likely to vary among the many e-cigarette devices in natural usage conditions.
A factor that distinguishes cigarette smoking from vaping is that the latter involves suction of ECA through a mouthpiece. However, in most of the studies listed in Table S2, the subjects smoked through cigarette holders that are part of the laboratory instrumentation. This makes the listed outcomes more useful to infer respiratory parameters for vapers, at least for those vaping in the MTL style, since these holders are of similar size and shape as the narrow e-cigarette mouthpieces. However, usage of cigarette holders does not seem to introduce significant changes in tidal volume, as can be seen by comparing outcomes from studies that used holders with those who did not in Table S2 (we comment further on the effect of mouthpieces in Section 3.2).
Since MTL is the most common topography among smokers and vapers (most of whom are ex-smokers or current smokers), we can assume that MTL style vaping is characterized by qualitatively similar puffing and respiratory parameters to those listed in Table S2. While some smokers inhale without a mouth hold as in DTL style, this does not seem to involve in them a significantly higher tidal volume, most likely because it can be too irritant [64,66]. The lesser irritant nature of ECA is a plausible explanation for a larger proportion of vapers that can tolerate DTL topography, which means suction of a much larger aerosol mass [32,70] and thus significantly larger puffing and tidal volumes than in MTL style (made easier by usage of high-powered devices). A puff volume of 500 mL can yield under idealized laboratory conditions an inhalation tidal volume close to 3 L [71], which justifies the more plausible values listed in Table 1.
3.2. Mouthpieces, Nose-Clips and the Breathing Route
Mouthpieces (MP) and nose-clips (NC) (to block nasal inspiration) are standard instruments in observational studies, not only those aimed at studying droplet emission, but of respiratory patterns and flows in human subjects. Since the results of these studies can serve as appropriate proxy values to infer droplet emission in vaping, it is important to assess the effects of these instruments in respiratory mechanics. For the purpose of the present article, this issue is interesting because ECA is inhaled in e-cigarettes through mouthpieces (although without obstruction of nasal breathing).
3.2.1. Observational Data on Breathing Through Mouthpieces and Noseclips
Several studies conducted in the 1970s and 1980s [72,73,74,75,76] showed that breathing through MPs and NCs affect all respiratory parameters with respect to unencumbered nose breathing: while tidal volume increases roughly 20% with respect to its normal rest value of 400–600 mL in all studies, inhalation and exhalation times and respiratory frequency are much less affected. It was shown by Weissman et al. [76] that a NC without a MP produces a similar increase of tidal volume but also significant increases of inhalation times (15%) and exhalation times (22%). In two of the studies [73,76], the subjects were in supine position, which yields slightly smaller tidal volumes but does not modify inspiration/expiration times [77].
Besides possible reasons such as the psychological sensorial stimulation of receptors by colder air in mouth inspiration and the stress of breathing through instruments, another possible explanation for the observed change in respiratory parameters of MPs is the change of airflow resistance, for example a 70–90% reduction seen by Weissman et al. [76] brought by the large added mouthpiece dead space (up to 80 mL), while the larger airflow resistance from the standard 17 mm to a narrower 9 mm MP (closer in size to mouthpieces used in vaping) reduced the increase of tidal volume to 11% and inhalation/exhalation times to 9% [76]. Therefore, the MPs of e-cigarettes should produce similar modifications of respiratory parameters as with the narrower MP.
3.2.2. Effects of the Breathing Route
In the studies discussed above, there was no separation between usage of instruments (MP and NC) and oral breathing. Rodenstein, Mercenier and Stanescu [78] conducted several experiments with 14 healthy subjects with the aim of looking separately at the effects of MPs and an NC. Their main result is that changes of respiratory parameters (rough 20% and 10% increase of tidal volume and inhalation/exhalation cycle) are entirely due to the forced oral breathing induced by the NC; in fact, nose occlusion is not even necessary to produce these changes: it is sufficient to simply instruct the subjects to breath through the mouth to observe an increase the tidal volume by a similar proportion as with the use of a NC, from to mL, although inhalation/exhalation times and other parameters remain almost the same (likely because of breathing without instrumentation).
The physiology behind the effects of the breathing route is similar to the one discussed in the study of pipe and cigarette smokers [79]: changes of respiratory parameters depend on the degree with which subjects are able to maintain air flowing through the nose. These parameters exhibit minor variation as long as this air flow is not occluded and the oropharyngeal isthmus remains closed. The parameters change significantly when nose occlusion separates the soft palate and the tongue and opens the oropharyngeal isthmus to allow air to flow entirely through the mouth. However, after the initial puffing, air flows through both nose and mouth in smoking and vaping (except the mouth puffing style), with the soft palate closing and rising enough to control the oral or nasal flow. While vaping involves usage of a MP, it does not involve nasal occlusion, hence the increase of expired tidal volume with respect to rest breathing (and puffing times with respect to smoking) should be primarily due to suction of ECA.
3.3. Likely Characteristics of Respiratory Droplets Carried by ECA
The discussion in the previous sections has allowed us to infer the characteristics and parameters of the respiratory mechanics of vaping. We need now to identify among respiratory processes the ones that most closely fit these parameters in order to use their available experimental data to infer the capacity of vaping for respiratory droplets emission.
3.3.1. The Right Respiratory Proxy: Mouth Breathing
Intuitively, vaping as a respiratory process should be close to mouth breathing, as both involve a roughly time-symmetric cycle of inspiration/expiration (as opposed to vocalizing, coughing or sneezing). Given the fact that exhaled ECA is a single phase flow (SFF) system (see Section 2.3), another good criterion to relate vaping to mouth breathing is the comparison between their fluid exhalation velocity and measured analogous velocities in other respiratory processes.
The exhalation velocity can be roughly inferred qualitatively by considering an exhaled tidal volume of fluid flowing through the respiratory tracts. Considering the respiratory parameters discussed in the previous sections (summarized in Table 1), we can use the simple approximate formula
where is the expiration tidal volume (in ), is the exhalation time in seconds and A is the combined mouth and nose area (in ), as the fluid carrier of both ECA and tobacco smoke is exhaled through the mouth and nose. From the values listed in Table 1 and Table S2, we have:
- MTL vaping and smoking: = 500–1500 mL and = 2–3 s, while values for the combined mouth/nose area have been measured as A = 2–3 [57].
- DTL Vaping: = 1500–3000 mL with 3–4 s and . Given the large amount of exhaled fluid, we assume longer exhalation times and larger mouth opening area.
From the combination of the parameter values mentioned above, we have
which reinforces the intuitive notion that mouth breathing is the appropriate respiratory proxy for MTL and DTL vaping (and also cigarette smoking), since these estimated exhalation velocities are well within the range of those of exhaled breath in mouth breathing without nose occlusion by NCs [80,81,82], which have been estimated and measured by various techniques (including Schlieren photography). Exhalation velocities in the most intense DTL vaping regime approach in their upper end the velocities of vocalizing but fall short of those of coughing and sneezing. As a reference, measurements of using particle image velocimetry resulted in averages of 3.9 m/s for speaking and 11.7 m/s for coughing [83] (measurements in [84] resulted in 6–22 m/s with an average of 11.2 m/s for coughing), while 35 m/s has been estimated for sneezing [85,86,87].
3.3.2. Data on Droplet Emission from Mouth Breathing
There is an extensive literature on respiratory droplets emitted by mouth breathing at different levels of lung capacity, including rest tidal volume breathing (<20% of vital capacity). We list a selection of these studies in Table 2, as they are the ones that can serve as proxies for vaping and smoking (at least MTL style). In practically all the listed studies, subjects breathed through MPs and NCs, which, as discussed in Section 3.2, involves occlusion of nasal air flow that implies a slightly modified mechanics and about 20–25% larger tidal volume with respect to normal unencumbered breathing.
Table 2.
Droplet emissions for mouth breathing and tidal volume. The symbols and stand for respiratory particle (droplet or nuclei) number per exhalation and average number density (). LE, HE, BH, L, and “exh” are Low Emitters, High Emitters, Breath Hold, L and exhalation, while OPC, EM, APS, SMPS and CNC are optical particle counter, electron microscopy, aerodynamic particle sizer, scanning mobility particle sizer and condensation nucleus counter, respectively. Table and figure numbers (4th column) correspond to articles cited in the Table. The subjects in all studies (save possibly the study by Johnson and Morawska [93]) breathed through a mouthpiece wearing a nose clip.
The fact that emitted respiratory droplets in tidal volumes close to rest breathing are overwhelmingly in the submicron range (as shown by Table 2) implies a very rapid evaporation (0.01 s) that in practice can be considered as instantaneous, with the emitted droplets being overwhelmingly desiccated droplet nuclei made of salt crystals and lypoproteins and being about roughly half their original diameter (see [88]). The exhaled breath will also contain some larger respiratory particles (droplets or nuclei) with 1–3 that evaporate in timescales of 0.1 s so that (given the exhalation velocities in (4)) they become desiccated nuclei at horizontal distances of 10–30 cm. As a consequence, relative humidity bears negligible influence on the evolution of the bulk of emitted droplets.
While some of the studies in Table 2 were motivated by investigating droplet emission in the context of airborne pathogen contagion (e.g., [89,90,91,92]), the motivation of others is to probe various mechanisms of droplet formation [93,94,95,96,97,98] (see comprehensive discussions and reviews in [86,99,100]), specifically the airway reopening hypothesis of small peripheral airways that normally close following a deep expiration, which was further tested by computerized modeling by Haslbeck et al. [100], who simulated this mechanism of particle formation by rupture of surfactant films involving surface tension. The mechanism was probed by Johnson and Morawska [93] by showing that concentrations of exhaled particles significantly increase with breathing intensities higher than rest tidal volume, but also for fast exhalations but not fast inhalation, while droplet numbers increased up to two orders of magnitude: from ∼ in tidal volume (0.7 L) to over 1200/L in a breathing maneuver from fractional residual capacity to total lung capacity (see [95]).
The difference in droplet formation between breathing and speaking was examined by Johnson et al. [101]: normal and deep tidal breathing produced submicron distributions related to those of other studies probing the airway reopening mechanism, while speech and cough produced larger diameter modes (m) with particle formation associated with vocal cord vibrations and aerosolization in the laryngeal region. A third mode of median diameter of m was associated with the presence of saliva between the epiglottis and the lips.
Breath holding between inspiration and expiration was found by Johnson and Morawska [93] to significantly reduce concentrations of exhaled droplets in proportion to the breath hold time. The same outcome was found by Holmgren et al. [102] for inspiration to total lung capacity, but droplet numbers increased when the breath hold occurs before inspiration. These outcomes fit predicted effects of gravitational settling in the alveolar region. Since the observations of Johnson and Morawska [93] and Holmgren et al. [102] involved breathing intensity well above tidal volume up to total vital capacity, it is not possible to compare them quantitatively with the breath hold of the MTL style. However, gravitational settling of larger droplets must also occur in the bucal cavity under normal vaping conditions (see [33]), so it is reasonable to assume that reduction of exhaled droplet numbers should also occur at lower intensity in MTL style vaping.
4. Hydrodynamical Modeling of Direct Exposure
In the previous sections, we infer the submicron characteristics and rate of emission of respiratory droplets expected to be carried by exhaled ECA. We need to estimate now how far can these respiratory droplets be carried to evaluate the distance for direct exposure of bystanders to pathogens potentially carried by these droplets
Exhaled ECA is injected into surrounding air a given horizontal distance roughly in the direction of the exhaled flow. Since it involves a finite fluid mass of a SFF aerosol during a finite injection time (exhalation time), the appropriate dynamical model for it is a turbulent puff with a starting momentum dominated jet that lasts while the fluid injection is on (see [103,104,105,106,107,108,109]). A schematic description of this system is furnished by Figure 1. We are not concerned with the few larger ECA or respiratory particles (diameters 1–5 m and over) that initially follow the fluid stream but (depending on their size) exit the main flow to follow ballistic trajectories until they either deposit on surfaces, settle on the ground or evaporate (see [60,86]).
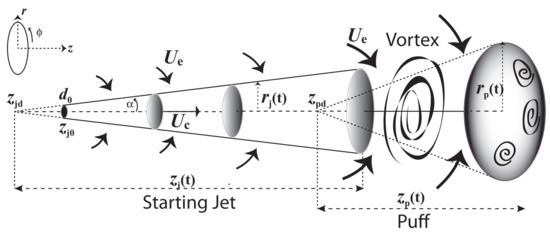
Figure 1.
Puff and initial Jet with axial symmetry. The starting jet is propelled by linear momentum parallel to the centerline velocity ; the arrows above and below represent the entrainment velocity mixing surrounding air with the carrier fluid. As the fluid injection terminates (end of exhalation), the entrained air makes about 40% of the fluid mass transition into an ellipsoidal puff through highly turbulent vortex structures. At this point, the puff is likely to disperse rapidly as horizontal displacement velocities are comparable to velocity fluctuations characterizing high turbulence and thermal buoyancy.
Given the distance and time dispersion scales (<3 m and <2–3 min), we can approximate the ECA as an airflow at constant atmospheric pressure, air density and dynamical viscosity and . For a jet source (vaper’s mouth) approximated as an orifice of 1.5–3 area [57] (diameter = 1.25–1.75 cm) and initial velocities given by (4), exhalation fluid Reynolds numbers = 600–4400 are in the transition between laminar and turbulent, values well below the high Reynolds numbers expected near a jet source [103,104], but we are mostly concerned with the jet evolution and displacement (penetration) along horizontal distances . Other parameters to consider are the injection time = 2–5 s and a temperature gradient from exhalation (initial) T = 30–35 °C (mouth temperature) into an assumed T = 20 °C for the surrounding air. For such values and scales, the starting jet can be regarded as isothermal with thermal buoyancy becoming relevant only in the puff stage (see [107,108]).
It is well known (see [103,104,110,111]) that statistically steady and unsteady jet/puff systems can be well approximated by analytic solutions of the Navier–Stokes and conservation equations (assuming incompressible fluids) with axial symmetry and a self similar profile for the average centerline and radial components of the velocity field in cylindrical coordinates (see Figure 1)
where are empiric Gaussian or polynomial functions of the self similar variable , while the centerline velocity is for along the z axis, hence must satisfy and at . In fact, for statistically steady jets (as we are assuming) the axial and radial similarity functions and satisfy [111]
so that can be obtained from an empiric choice for (see examples in [86,103,104,105,106,107,108,109]). The assumptions we make (statistically steady and axially symmetric self similar profile) imply that the jet/puff system fulfills the conservation of linear specific momentum (puff) and force (jet) where is the penetration volume [103,109], hence for an initial time . The stream wise centerline penetration distance and velocity for the jet and puff stages can be given by [109]:
where the constants are empirically determined, is the z coordinate value of the ejection orifice and is the virtual origins of the puff (see Figure 2), which is an appropriate parameter to separate the starting jet and puff stages even though it lies within the starting jet region (see the detailed explanation in [109]). In addition, notice that the direct proportionality of the radial and axial displacements, and , for the jet and puff regimes (through ) implies the conical shape depicted in Figure 1, with a distinct, but constant, radial dispersion angle for each stage.

Figure 2.
Jet/Puff horizontal displacement and centerline velocity. (a) The displacement of the staring jet (blue) and of the puff (red) as functions of time (Equations (7)–(10)), for the three vaping topographies described in Section 2.1: DTL (Direct to Lung), MTL (Mouth to Lung) and MP (Mouth Puffing). We assumed as injection (exhalation times) 3, 4 and 5 s. The initial velocities from bottom to top are cm/s. (b) The centerline velocities for the starting jet (Equation (8)), as functions of the horizontal displacement during the injection times and initial velocities of (a) (green for MP, blue for MTL and red for DTL). Notice that once injection stops the jet has reached velocities ∼15–20 cm/s comparable to those of indoor air currents (bottom rectangle in (b)) and evolves into a puff. Computations and graphs were made with the software package Maple [112]. Worksheets are available through email request to the corresponding author.
For the axial geometry of the jet/puff system under consideration, we have and . Following the distinction in Table 1 and Table 2 of [109] (see also [109]) between starting and interrupted jets that are, respectively, applicable to our jet and puff stages, we choose the following numerical values for the constants in (7)–(10):
where the time and position of the puff virtual origin are determined numerically from (7) by the condition (see [109]).
The values of above indicate for the jet stage a highly collimated directional evolution with a narrow angle of radial dispersion , while for the puff stage we have a wider radial dispersion (these angles roughly fit observational data on radial dispersion of mouth breathing, see [57,80,81,82]). Therefore, since the jet stage is better approximated by an axially symmetric statistically steady jet, this collimated shape implies that the axial displacement is far more relevant than the narrow radial displacement to assess the distance and direction of direct exposure to possibly transported pathogens through vaping exhalations. From the dynamical Equations (7)–(10) with the parameter values in (11)–(12), we display in Section 5.2 the horizontal distance and jet/puff velocities characterizing direct exposure.
Vapers often exhale at a downward angle, typically ), thus reducing the horizontal penetration scope of the starting jet by a factor . However, it is this downward exhalation angle (and not so much the radial dispersion) that (under normal natural ventilation) can expose children to the exhaled jet due to their smaller height, but only if they are located in a direction close to that of the jet (see Section 5.3). For the puff stage, the radial dispersion angle is much wider, but at this stage the simple axially symmetric steady state model begins to break down due to thermal buoyancy, turbulence and large flow of surrounding air entrainment, all of which causes a slow puff motion and a rapid dispersion of ECA and the droplets or respiratory particles it might carry. As we show in Section 5.3, the qualitative description of the sharp directional collimation of the jet stage and wider dispersion of a slow unstable puff are corroborated by photographs and videos of actual vaping exhalations by human vapers.
5. Results
5.1. Respiratory Droplets Emission
From the evidence and data examined in Section 3, it is plausible to assume that droplet emission in smoking and vaping (at least MTL style) can be reasonably inferred from outcomes of studies in Table 2 with comparable exhaled tidal volumes (see Table S2), including outcomes of studies mentioned previously that examined breath holds.
The studies we summarized and listed in Table 2 only involve mouth breathing, but they share some common respiratory features with vaping and smoking: oral inspiration with usage of MPs (in vaping), as well as qualitatively similar exhalation velocities and respiratory parameters, namely inhalation/exhalation times and tidal volumes. However, there are also differences: smoking and vaping do not involve the nose occlusion of these experiments, but involve suction which the subjects of the latter experiments did not experience. While the absence of NCs would imply a tidal volume very close to rest values in MTL smoking and vaping, this absence is compensated by the increase due to the need to overcome airflow resistance through suction. The decrease of droplet emission from the mouth/oropharynx hold in MTL topography (absent in normal breathing) was a detected outcome in two of the studies listed in Table 2. We have then the following inferences regarding emission of respiratory droplets:
- MTL vaping and smoking (and even DTL vaping not involving deep inspiration). The outcomes displayed in Table S2 and Table 2 suggest that exhaled respiratory particles (droplets or nuclei) in mean tidal volumes = 700–900 are overwhelmingly in the submicron range (typically peaking at = 0.3–0.8 ), with respiratory particle number densities well below and a small rate of droplet emission. Assuming L, we have = 6–200 per exhalation. Since the distribution of in the 10 outcomes listed in Table 2 is strongly skewed towards the range with only three studies reporting , the median value and median deviation provide a more representative description than the mean value and standard deviation 74.66. We also assume that the wide individual variation reported in these respiratory studies should also apply to vaping, including the existence of a small minority of outlier individuals that can be thought of as “super emitters” reaching over 500–1000 per exhalation.
- DTL vaping. It involves a spectrum of deeper respiratory intensity than MTL vaping and thus should involve a higher rate of droplet emission. A reasonable estimation of emitted droplets in the DTL regime is furnished by the intense DTL (2–3 L exhalation) breathing at fractional residual capacity in [95] and by high end emitters in [90,98], leading to possible emission rates approaching 1000/L. However, this style of vaping is practiced by a small minority of vapers (roughly 10–20%, see Figure S1), while extreme vaping with big clouds (the so-called “cloud chasers”) is even less frequently practiced in competitions or exhibitions. Evidently, this type of extreme vaping cannot be sustained for long periods and is not representative even of DTL vapers.
While the inferred droplet numbers in the upper end of high-intensity DTL vaping can be comparable with low end numbers for vocalizing, the latter involves modes with larger mean droplet diameters because of distinct droplet generation processes (see [92,94,101]).
5.2. Distance for Direct Exposure
Direct exposure to respiratory droplets carried by exhaled ECA can be inferred from the horizontal displacement or penetration distance of the jet/puff system whose dynamics follows from Equations (7)–(10) with the parameter values in (11)–(12). We used the algebraic computing package Maple [112] to plot in Figure 2 the analytic expressions for the displacement distances and centerline velocities for assorted values of initial exhalation velocities corresponding to the vaping intensities we considered (the Maple worksheets used for the graphs are available through email request to the corresponding author).
Notice that the maximal penetration goes beyond that afforded by the momentum thrust of the starting jet, with the puff further evolving at lesser speeds. Horizontal penetration varies from 0.5 m for Mouth Puffing ( m/s) through the range 0.6–2.0 m for the MTL regime ( = 0.5–3.75 m/s) to beyond 2 m for the higher-intensity DTL regime ( = 1.5–5 m/s). Centerline velocity drops to about 0.2 m/s at different times and distances when fluid injection stops in all cases.
Given its short time duration and close distance scope of the momentum thrusted staring jet, the analytic model (7)–(8) remains a reasonably good approximation to infer the necessary distance to minimize the risk of direct exposure of bystanders to respiratory droplets. As the jet evolves while fluid is injected, there is increasing entrainment from the surrounding air at velocity , with entrained air reaching about 40% of the jet mass at the end of injection in the transition towards the puff (around its virtual origin, see [107,108]). Since there are airflow currents of ∼10 cm/s (and up to 25 cm/s) even in still air in home environments with natural ventilation [113,114], at this stage the puff formation can be easily destabilized by vortex motion generated through turbulent mixing from the large velocity fluctuations produced by the entrainment (see details in [115,116]).
Turbulence and thermal buoyancy become important factors when there is human motion or walking [117], or in microenvironments with mechanical ventilation (mixed or displaced), resulting in a faster disruption and dispersion of the slow moving puff, carrying the submicron ECA and respiratory droplets along the air flow. In general, submicron droplets exhaled at the velocities under consideration can remain buoyant for several hours, with mixing ventilation tending to uniformly spread them, whereas directed ventilation tends to stratify them along different temperature layers (see comprehensive treatment in [118,119,120]). In all cases, there is a risk of indirect contagion by exposure to these droplets. The detailed description of droplet dispersion after the puff is disrupted is a complicated process that requires computational techniques that are beyond the scope of this paper (see comprehensive analysis in [116]).
5.3. Comparison with Human Vapers
It is important to examine if real life vaping jet/puff systems are well described by the approximation afforded by the simplified hydrodynamical model introduced in Section 4, whose characteristics and distance spread predictions are discussed in Section 5.2 and plotted in Figure 2. To look at this matter, we examine in this section photographs of vaping jet/puff systems produced by actual vapers. These photographs are frames of videoclips available as Supplementary Material SM(3).
5.3.1. DTL Vaping
The evolution of a vaping jet/puff system for a vaper following the DTL style can be appreciated in the sequence of frames displayed in Figure 3. While this style is followed by a minority of vapers (see Section 2.1.2), its large volume of exhaled air and ECA and large distance spread make it suitable to illustrate the evolution of the jet/puff system associated with vaping. Figure 3 contains five images corresponding to the stages of jet/puff formation and evolution in a sequence given by the following time frames from top to bottom (the filmed sequence is available in Supplementary Material SM(3))
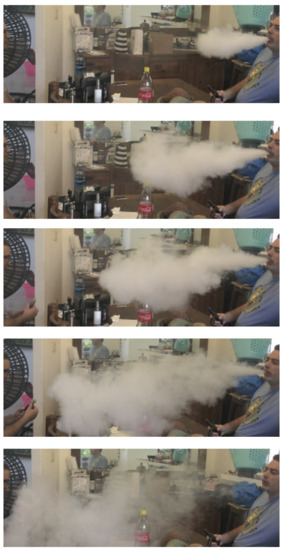
Figure 3.
Formation and evolution of the vaping jet/puff system. The images denote from top to bottom a sequence of time frames of a vaping jet/puff system associated with the intense DTL style. Each frame is explained in the main text. The video footage is available in SM(3).
- First Frame
- The starting jet thrusted by the linear momentum of the exhalation has a rough conical shape with dispersion angle comparable to , as described in Section 5.2 and depicted in Figure 1.
- Second Frame
- As more ECA and exhaled air are injected, the shape of the frontal development of the starting jet becomes deformed by entrainment of surrounding air, which initiates the formation of a turbulent vortex. The jet areas close to the injection source (vaper’s mouth) remains close to the initial conical shape.
- Third Frame
- Entrainment from surrounding air generates more turbulent mixing, giving rise to the slow formation of a puff as a deformed ellipsoidal shape that slowly separates from the fully developed stating jet, since fluid and ECA injection continues.
- Fourth Frame
- As the injection wanes, the starting jet weakens, gradually losing its straight conical shape. The puff becomes fully developed and evolves forward, giving rise to more air entrainment and turbulent mixing.
- Fifth Frame
- As injection stops, the starting jet is gone and the puff structure begins to disperse.
As shown by the frames depicted in Figure 3 and in the video from where this sequence was taken (see video DTL1 in SM(3)), the simple hydrodynamical model presented and discussed in Section 4 and Section 5.2 provides a reasonably good approximation to real life vaping, at least up the fourth frame before the final dispersion of the puff when injection ends (this is also true for MTL vaping with a tank device as we show further ahead). Evidently, the horizontally thrusted jet/puff system generated by this vaper (following DTL vaping style) reaches over 2 m of horizontal displacement, which up the puff dispersion final stage remains quite directionally collimated. This corresponds to the upper displacement curves in Figure 2, indicating a probable exhalation velocity of 4–5 m/s and total fluid injection of over 2 L. However, not all vapers doing DTL style thrust the jet/puff system such large distance spreads and injected fluid volumes, since these parameters should also depend on the lung capacity of the vaper, which varies in direct proportion to body size. The vaper of Figure 3 has a large lung capacity, as he is 1.86 m tall and weighs 110 kg. In the video DTL2 in SM(3), his vaping exhalation is compared to that of a vaper 1.70 m tall weighing 74 kg, whose jet/puff system has a much shorter spread barely surpassing 1.5 m, corresponding (from the results in Figure 2) to probable exhalation velocity m/s and total fluid injection of 1.5 L.
5.3.2. MTL Vapers
The jet/puff system exhaled by vapers following the MTL styles exhibits the same stage evolution described in Figure 3, although exhalations produced by low-powered devices involve significantly less fluid injection (and typically lower injection times), thus producing smaller horizontal distance spread, as well as more affectation by external air entrainment that produces a smaller and easier to dispersed puff. All this is corroborated by Figure 4 and Figure 5, which, respectively, depict the horizontal and downward thrusted exhalations by MTL vaping with two electronic cigarettes: an open-tank device (Geekvape Aegis X, 40–60 watts) and a low-powered closed “pod” device (Innokin Endura, 10 watts).
Figure 4.
The vaping jet/puff system: MTL style, horizontal exhalation. Top and bottom figures, respectively, depict the jet/puff system exhaled by the same vaper using a tank system and a low-powered pod. Turbulent vortex is marked in red. The frames correspond to an evolution stage equivalent to the fourth frame (top down) of Figure 3. Video footage corresponding to these frames is available in the Supplementary Materials SM(3). See details in the main text.
Figure 5.
The vaping jet/puff system: MTL style, downward exhalation. Similar to Figure 4 with the jet/puff system thrusted downward. See details in the main text. Notice that because of their shorter height children or pets standing at 1 m distance from the vaper using a tank device might be exposed to ECA.
Figure 4 depicts the evolution stage for horizontal exhalation of MTL vaping, in a stage equivalent to the fourth frame of Figure 3 (top down), for the tank (top) and pod devices (bottom); both are frames taken from the video MTL1 available in Supplementary Material SM(3). The exhalation produced by the tank device (top) is a smaller scale version of the DTL exhalation depicted in Figure 3 and videos DTL1 and DTL2 of SM(3) (the same tank device can also be used for DTL vaping), displaying a fully formed puff with a waning fluid injection, reaching horizontal distance spread under 1.2 m, thus probably corresponding to approximately m/s and total fluid injection of 1 L. As shown by the first exhalation in video MTL1 of SM(3), the distance extension of the film is sufficient to capture how the puff disperses upwards due to thermal buoyancy (while the camera was unable to capture this upward thrust in video DTL1 of SM(3)).
In the exhalation produced by the low-powered device displayed at the bottom of Figure 4, only the starting jet is visible, reaching about 0.7 m, corresponding to lower displacement curves in Figure 3 (likely m/s and total fluid injection of 0.7 L). As shown in the second and third exhalation of video MTL1 of SM(3), as the fluid injection wanes, external air entrainment rapidly disperses the incipient puff. Figure 5 considers the same devices as in Figure 4, but for an exhalation thrusted downwards (however, video footage MTL2 of SM(3) is only available for the tank system). As the puff forms, it rapidly settles on the ground without dispersing upwards, most likely because of the deposition of most ECA droplets. The downward exhalation for the low-powered device (not displayed in video) is practically identical to that of the horizontal one, with an even more rapid dispersion of the puff at the end of the fluid injection.
6. Limitations, Final Discussion and Conclusions
We present in this paper a comprehensive analysis and theoretical modeling of the plausibility, scope and risk for pathogen (including SARS-CoV-2 virus) contagion through direct and indirect exposure to respiratory droplets that would be carried by ECA (e-cigarette aerosol) exhaled by vapers. A summary that outlines the methodological structure and obtained results of the article is provided in the Introduction.
6.1. Limitations
6.1.1. Lack of Empiric Data
It is important to openly recognize the main limitation of this study: the lack of experimental and observational data on respiratory droplets carried by exhaled ECA. It is quite plausible that emission of these droplets should occur, as exhaled ECA is an expiratory activity, but without empiric data any quantitative assessment of its nature and scope must necessarily be inferred or estimated indirectly, either through theoretical speculation from the physical and chemical properties of ECA or through extrapolation from available data on other expiratory activities that can serve as reasonable proxies for vaping. The need to provide the best possible and self consistent inference on this missing data explains and justifies the length of the present study: data availability would render several sections (for example, Section 3.1, Section 3.2 and Section 3.3) redundant or drastically shortened and kept only for comparative reference.
6.1.2. Simplification of Vaping Styles
The classification of puffing topographies in two separate mutually exclusive categories (MTL and DTL) that we present in Section 2.1 roughly conveys the two main vaping styles, but e-cigarettes are a rapidly changing technology and thus this simplified approach cannot capture the full range and scope of individual vaping habits.
6.1.3. Oversimplification of Infective Parameters and Individual Variability
We remark that the ranges of numerical values we obtained of emitted droplets possibly emitted by vaping are rough average estimates gathered from outcomes reported in breathing studies (listed in Table 2) involving a wide variety of subjects, including both healthy subjects and individuals affected by respiratory conditions (not by SARS-CoV-2). We did not consider the small minority of outlier individuals who are super spreaders emitting significantly larger numbers of droplets [92]. We also simply considered droplet emission, disregarding the specification of a specific pathogen. Evidently, this oversimplification disregards important known facts, for example droplet characteristics vary among pathogens and between healthy and infected subjects [90,91].
In fact, numerous aspects associated with the spreading and infection details of the SARS-CoV-2 virus remain uncertain and subject to large (often unexplained) individual and environmental variability (a good summary of these uncertainties is found in [13,14,15,16]). However, in order to be able to model a possible (previously unexplored) route of droplet transmission and possible infection, it is necessary and unavoidable to simplify this complexity and lack of data to obtain plausible order of magnitude estimates that can be verified once empiric evidence is available.
6.1.4. Oversimplification of Droplet Dynamics
Since respiratory droplets carried by exhaled ECA are expected to be overwhelmingly submicron, and thus carried by the fluid flow, the simple dynamical modeling of a starting jet followed by an unstable puff (Section 4) is sufficient to estimate direct exposure distances (this is corroborated in Section 5.3 by comparison with photographs and videos of actual vapers). However, we recognize its limitations: it is strictly valid for a jet/puff system emitted by a motionless vaper in typical indoor conditions with idealized natural ventilation. Evidently, estimating the fluid flows that determine this exposure (and indirect exposure by dispersing droplets) in less idealized conditions requires a more realistic description using computational methods of fluid mechanics to incorporate effects of turbulence and thermal bouyance, as well as air currents from ventilation or motion. Rather, we examined global volume exposure in a separate article through a risk model not involving fluid dynamics described [22]. It is important to mention that this simplification of the dynamics is harder to justify for expiratory activities such as coughing or sneezing, as the latter involve larger ejection velocities and a much wider spectrum of droplet diameters that includes significant number of large supermicron droplets (significant numbers of droplets with diameters 1–10 and even >100 ) whose effect on the dynamics of the carrier fluid cannot be neglected (these are strictly speaking multiphasic flows [52,60,87]).
6.2. Safety Considerations
6.2.1. Respiratory Flow Visualization
As opposed to other respiratory activities (speaking, singing, coughing and sneezing), the involved respiratory flow of ECA is visible because the carried submicron droplets (ECA and respiratory) act effectively as visual tracers of the carrier fluid (see Section 2.3 and further details in [22]). Besides the evident psychological dimension of this flow visualization, there are safety implications: vapers and those surrounding them have a clear, instinctive and immediate delineation of the flow’s horizontal distance reach and spreading direction along the exhaled jet. From the outcomes of our hydrodynamical analysis (Section 5.2), we can recommend as a basic safety measure to avoid direct exposure (irrespective of face mask wearing) by keeping a 2 m distance away from the vaper (when vaping) in the direction of the visible jet. In other directions, the exposure would be indirect, but nevertheless it is prudent to maintain 2 m of separation in all directions from anyone vaping when not wearing a face mask. Notice that these recommended safety measures coincide with the standard social separation recommendations adopted worldwide [121]. Since vapers often thrust their jets in varying downward angles, children and pets might be exposed (because of their shorter height) at distances and positions that could be safe for adults. While vaping starting jets are quite collimated, and thus involve direct exposure mostly in the jet direction, ventilation and motion of the vapers might disperse the emissions in other directions. However, as emphasized above, the fact that these emissions are visible is a valuable safety feature that allows bystanders to avoid exposure.
6.2.2. Final Conclusions
This article is the first comprehensive attempt (as far as we are aware) to assess the plausibility and distance range of possible transport by exhaled ECA of respiratory droplets potentially carrying pathogens (including the SARS-CoV-2 virus). Given the lack of empiric data on this phenomenon, we utilized data from respiratory parameters of cigarette smoking and droplet emission from mouth breathing, both considered as valid proxies for vaping exhalations. As far as we are aware, this is the first study that examines vaping exhalations as hydrodynamical flows. Our results can provide useful guidelines to address the possible scope of vaping exhalations in assessing risks of contagion of infectious disease in shared indoor spaces. In other studies, we examined actual contagion risks and public policy implications (see [22,23]). Setting aside harms from environmental tobacco smoke unrelated to COVID-19, these results also apply to sharing an indoor space with a smoker.
Supplementary Materials
The following are available at https://www.mdpi.com/article/10.3390/app11146355/s1, Figure SM(1), Usage of different classes of e-cigarette devices in the US and UK markets. Table SM(2), Respiratory parameters of cigarette smoking. SM(3) contains videoclips DTL1, DTL2 for Figure 3 and MTL1, MTL2 for Figure 4 and Figure 5.
Author Contributions
Conceptualization, R.A.S., E.G. and R.P.; Formal Analysis, R.A.S., E.G. and R.P.; Investigation, R.A.S., E.G. and R.P.; Methodology, R.A.S., E.G. and R.P.; Software, R.A.S.; Writing—Original Draft, R.A.S.; and Writing—Review and Editing, R.A.S., E.G. and R.P. All authors have read and agreed to the published version of the manuscript.
Funding
This research did not receive any specific grant from funding agencies in the public, commercial, or not-for-profit sector. Publication fees were covered by the Department of Clinical and Experimental Medicine (University of Catania). Myriad Pharmaceuticals did not fund the contribution of E.G. to this article. Her contribution was entirely on her own initiative and was undertaken outside her normal working schedule for her employer.
Informed Consent Statement
Informed consent was obtained from all subjects involved in the study.
Acknowledgments
The authors wish to thank Carlos Gálvez González and Yinley Álvarez Mustaky for their help in filming the video clips where they appear vaping. Both Gálvez González and Álvarez Mustaky gave their permission and consent to utilize the video clips for scientific purposes.
Conflicts of Interest
R.A.S. has no competing interests to declare.
List of Abbreviations and Symbols
| Acronyms and Abbreviations | |
| ECA, | E-Cigarette Aersosol |
| SARS-CoV-2 | Severe acute respiratory syndrome coronavirus 2 |
| COVID-19 | Coronavirus disease 2019 |
| WHO | World Health Organization |
| CDC | Centers for Disease Control and Prevention of the USA |
| MTL | Mouth to Lung (vaping style) |
| DTL | Direct to Lung (vaping style) |
| PG | Propylene Glycol |
| VG | Glycerol or Vegetable Glycerine |
| SFF | Single-Phase Fluid Flow |
| PM | ECA Particulate Matter |
| TPM | ECA Total Particulate Matter |
| MP | Mouth Piece |
| NC | Nose Clip |
| Units | |
| L | liters |
| mL | milliliters |
| m | meters |
| cm | centimeters |
| mm | millimeters |
| m | micrometers |
| nm | nanometers |
| mg | milligrams |
| g | micrograms |
| s | seconds |
| h | hour |
| Variables (ECA droplets) | |
| CMD | Count mean diameter (m) |
| Mass of ECA yield bolus (mg) | |
| Volume of ECA yield bolus (mL) | |
| Flow of ECA yield bolus (mL/s) | |
| Exhalation Tidal volume (mL) | |
| Puff time (s) | |
| Number of particles | |
| Diameter of particles (m or nm) | |
| Particle number density (number per ) | |
| Particle mass density (grams per ) | |
| Particle velocity () | |
| Particles Reynolds number (dimensionless) | |
| Particles relaxation time (s) | |
| Cunningham slip factor (dimensionless) | |
| Mean molecular free path of air (m) | |
| U | Fluid (air) velocity () |
| Stokes number (dimensionless) | |
| Characteristic fluid (air) time (s) | |
| Airflow volume () | |
| V | Fluid (air) volume () |
| T | Fluid (air) temperature ( C) |
| Pressure gradient (gm ) | |
| Fluid Reynolds number (dimensionless) | |
| Exhalation velocity () | |
| Exhalation time (s) | |
| Variables (Respiratory particles: droplets and nuclei) | |
| Diameter (m or nm) | |
| Numbers | |
| Number density (numbers per ) | |
| Variables (Vaping jet/puff system) | |
| Orifice diameter (cm) | |
| air mass density () | |
| air dynamical viscosity (gm /s) | |
| Components of jet velocity in cylindrical coordinates (cm/s) | |
| Centerline jet velocity (cm/s) | |
| Centerline puff velocity (cm/s) | |
| Entrainment jet velocity (cm/s) | |
| Q | Linear specific momentum of jet (gm cm/s) |
| Linear specific momentum of jet at the orifice (gm cm/s) | |
| Linear specific force of jet (gm cm/) | |
| Linear specific force of jet at the orifice (gm cm/) | |
| Penetration volume () | |
| Horizontal jet displacement (cm) | |
| Horizontal jet displacement at the orifice (cm) | |
| Horizontal puff displacement (cm) | |
| Virtual origin of puff displacement (cm) | |
| Time at virtual origin of puff displacement (s) | |
References
- Gralton, J.; Tovey, E.; McLaws, M.L.; Rawlinson, W.D. The role of particle size in aerosolised pathogen transmission: A review. J. Infect. 2011, 62, 1–13. [Google Scholar] [CrossRef] [PubMed]
- Zhang, H.; Li, D.; Xie, L.; Xiao, Y. Documentary research of human respiratory droplet characteristics. Procedia Eng. 2015, 121, 1365–1374. [Google Scholar] [CrossRef] [PubMed] [Green Version]
- Weber, T.P.; Stilianakis, N.I. Inactivation of influenza A viruses in the environment and modes of transmission: A critical review. J. Infect. 2008, 57, 361–373. [Google Scholar] [CrossRef]
- Yu, I.T.; Li, Y.; Wong, T.W.; Tam, W.; Chan, A.T.; Lee, J.H.; Leung, D.Y.; Ho, T. Evidence of airborne transmission of the severe acute respiratory syndrome virus. N. Engl. J. Med. 2004, 350, 1731–1739. [Google Scholar] [CrossRef] [PubMed] [Green Version]
- Sze To, G.N.; Wan, M.; Chao, C.Y.H.; Wei, F.; Yu, S.; Kwan, J. A methodology for estimating airborne virus exposures in indoor environments using the spatial distribution of expiratory aerosols and virus viability characteristics. Indoor Air 2008, 18, 425–438. [Google Scholar] [CrossRef] [PubMed]
- Ruzer, L.S.; Harley, N.H. Aerosols Handbook: Measurement, Dosimetry, and Health Effects; CRC Press: Boca Raton, FL, USA, 2012. [Google Scholar]
- WHO. Transmission of SARS-CoV-2: Implications for Infection Prevention Precautions: Scientific Brief, 09 July 2020; Technical Report; World Health Organization: Geneva, Switzerland, 2020; Available online: https://www.who.int/publications/i/item/modes-of-transmission-of-virus-causing-covid-19-implications-for-ipc-precaution-recommendations (accessed on 30 May 2021).
- CDC. SARS-CoV-2 and Potential Airborne Transmission; Scientific Brief; CDC: Updated 7 May 2021. Available online: https://www.cdc.gov/coronavirus/2019-ncov/science/science-briefs/sars-cov-2-transmission.html (accessed on 30 May 2021).
- Liu, Y.; Ning, Z.; Chen, Y.; Guo, M.; Liu, Y.; Gali, N.K.; Sun, L.; Duan, Y.; Cai, J.; Westerdahl, D.; et al. Aerodynamic analysis of SARS-CoV-2 in two Wuhan hospitals. Nature 2020, 582, 557–560. [Google Scholar] [CrossRef] [PubMed]
- Li, Y.; Qian, H.; Hang, J.; Chen, X.; Hong, L.; Liang, P.; Li, J.; Xiao, S.; Wei, J.; Liu, L.; et al. Evidence for probable aerosol transmission of SARS-CoV-2 in a poorly ventilated restaurant. MedRxiv 2020. [Google Scholar] [CrossRef]
- Lu, J.; Gu, J.; Li, K.; Xu, C.; Su, W.; Lai, Z.; Zhou, D.; Yu, C.; Xu, B.; Yang, Z. COVID-19 outbreak associated with air conditioning in restaurant, Guangzhou, China, 2020. Emerg. Infect. Dis. 2020, 26, 1628. [Google Scholar] [CrossRef] [PubMed]
- Shen, Y.; Li, C.; Martinez, L.; Chen, Z. Airborne Transmission of COVID-19: Epidemiologic Evidence from Two Outbreak Investigations. 2020. Available online: https://duurzaam.d66.nl/content/uploads/sites/102/2020/05/Shen-2020-Airborne-transmission-of-COVID-19-epidemiologic-evidence-from-two-outbreak-investigations-budhists.pdf (accessed on 8 May 2021).
- Klompas, M.; Baker, M.A.; Rhee, C. Airborne transmission of SARS-CoV-2: Theoretical considerations and available evidence. JAMA 2020, 324, 441–442. [Google Scholar] [CrossRef]
- Morawska, L.; Milton, D.K. It Is Time to Address Airborne Transmission of Coronavirus Disease 2019 (COVID-19). Clin. Infect. Dis. 2020, 71, 2311–2313. [Google Scholar] [CrossRef]
- Morawska, L.; Cao, J. Airborne transmission of SARS-CoV-2: The world should face the reality. Environ. Int. 2020, 139, 105730. [Google Scholar] [CrossRef]
- National Academies of Sciences, Engineering, and Medicine. Airborne Transmission of SARS-CoV-2: Proceedings of a Workshop in Brief; The National Academies Press: Washington, DC, USA, 2020. [Google Scholar] [CrossRef]
- Jayaweera, M.; Perera, H.; Gunawardana, B.; Manatunge, J. Transmission of COVID-19 virus by droplets and aerosols: A critical review on the unresolved dichotomy. Environ. Res. 2020, 188, 109819. [Google Scholar] [CrossRef]
- Shiu, E.Y.; Leung, N.H.; Cowling, B.J. Controversy around airborne versus droplet transmission of respiratory viruses: Implication for infection prevention. Curr. Opin. Infect. Dis. 2019, 32, 372–379. [Google Scholar] [CrossRef]
- Ahmed, N.; Maqsood, A.; Abduljabbar, T.; Vohra, F. Tobacco smoking a potential risk factor in transmission of COVID-19 infection. Pak. J. Med. Sci. 2020, 36, S104. [Google Scholar] [CrossRef]
- Sifat, A.E.; Nozohouri, S.; Villalba, H.; Vaidya, B.; Abbruscato, T.J. The Role of Smoking and Nicotine in the Transmission and Pathogenesis of COVID-19. J. Pharmacol. Exp. Ther. 2020, 375, 498–509. [Google Scholar] [CrossRef]
- Mahabee-Gittens, E.M.; Merianos, A.L.; Matt, G.E. Letter to the editor regarding: “An imperative need for research on the role of environmental factors in transmission of novel coronavirus (COVID-19)”-secondhand and thirdhand smoke as potential sources of COVID-19. Environ. Sci. Technol. 2020, 54, 5309–5310. [Google Scholar] [CrossRef] [Green Version]
- Sussman, R.A.; Golberstein, E.; Polosa, R. Analytic Modeling and Risk Assessment of Aerial Transmission of SARS-CoV-2 Virus through Vaping Expirations in Shared Micro-Environments. 2021. Available online: https://osf.io/8vxag (accessed on 24 June 2021).
- Sussman, R.A.; Golberstein, E.; Polosa, R. Aerial transmission of the SARS-CoV-2 virus through environmental e-cigarette aerosols: Implications for public policies. Int. J. Environ. Res. Public Health 2021, 18, 1437. [Google Scholar] [CrossRef]
- Farsalinos, K.E.; Polosa, R. Safety evaluation and risk assessment of electronic cigarettes as tobacco cigarette substitutes: A systematic review. Ther. Adv. Drug Saf. 2014, 5, 67–86. [Google Scholar] [CrossRef] [Green Version]
- RCP. Nicotine without Smoke Tobacco Harm Reduction; Royal College of Physicians of London: London, UK, 2016. [Google Scholar]
- McNeill, A.; Brose, L.S.; Calder, R.; Bauld, L.; Robson, D. Evidence Review of E-Cigarettes and Heated Tobacco Products 2018; A Report Commissioned by Public Health England; Public Health England: London, UK, 2018; Volume 6. [Google Scholar]
- NASEM. Public Health Consequences of E-Cigarettes: A Consensus Study Report of the National Academies of Sciences, Engineering, and Medicine; Springer: Berlin/Heidelberg, Germany, 2018. [Google Scholar]
- Polosa, R.; O’Leary, R.; Tashkin, D.; Emma, R.; Caruso, M. The effect of e-cigarette aerosol emissions on respiratory health: A narrative review. Expert Rev. Respir. Med. 2019, 13, 899–915. [Google Scholar] [CrossRef] [Green Version]
- Dautzenberg, B.; Bricard, D. Real-time characterization of e-cigarettes use: The 1 million puffs study. J. Addict. Res. Ther. 2015, 6, 4172. [Google Scholar] [CrossRef]
- Farsalinos, K.; Poulas, K.; Voudris, V. Changes in puffing topography and nicotine consumption depending on the power setting of electronic cigarettes. Nicotine Tob. Res. 2018, 20, 993–997. [Google Scholar] [CrossRef]
- Spindle, T.R.; Hiler, M.M.; Breland, A.B.; Karaoghlanian, N.V.; Shihadeh, A.L.; Eissenberg, T. The influence of a mouthpiece-based topography measurement device on electronic cigarette user’s plasma nicotine concentration, heart rate, and subjective effects under directed and ad libitum use conditions. Nicotine Tob. Res. 2017, 19, 469–476. [Google Scholar] [CrossRef]
- Soulet, S.; Duquesne, M.; Toutain, J.; Pairaud, C.; Mercury, M. Impact of Vaping Regimens on Electronic Cigarette Efficiency. Int. J. Environ. Res. Public Health 2019, 16, 4753. [Google Scholar] [CrossRef] [Green Version]
- Asgharian, B.; Price, O.T.; Rostami, A.A.; Pithawalla, Y.B. Deposition of inhaled electronic cigarette aerosol in the human oral cavity. J. Aerosol Sci. 2018, 116, 34–47. [Google Scholar] [CrossRef]
- ECig Intelligence: Databases-Key Global Analysis of the Vapour Sector. 2020. Available online: https://ecigintelligence.com/content_types/database/ (accessed on 28 October 2020).
- Floyd, E.L.; Queimado, L.; Wang, J.; Regens, J.L.; Johnson, D.L. Electronic cigarette power affects count concentration and particle size distribution of vaping aerosol. PLoS ONE 2018, 13, e0210147. [Google Scholar] [CrossRef] [Green Version]
- Grégory, D.; Parmentier, E.A.; Irene, T.; Ruth, S. Tracing the composition of single e-cigarette aerosol droplets in situ by laser-trapping and Raman scattering. Sci. Rep. 2020, 10, 1–8. [Google Scholar]
- Mikheev, V.B.; Brinkman, M.C.; Granville, C.A.; Gordon, S.M.; Clark, P.I. Real-time measurement of electronic cigarette aerosol size distribution and metals content analysis. Nicotine Tob. Res. 2016, 18, 1895–1902. [Google Scholar] [CrossRef] [PubMed] [Green Version]
- Pankow, J.F. Calculating compound dependent gas-droplet distributions in aerosols of propylene glycol and glycerol from electronic cigarettes. J. Aerosol Sci. 2017, 107, 9–13. [Google Scholar] [CrossRef] [PubMed]
- Lechasseur, A.; Altmejd, S.; Turgeon, N.; Buonanno, G.; Morawska, L.; Brunet, D.; Duchaine, C.; Morissette, M.C. Variations in coil temperature/power and e-liquid constituents change size and lung deposition of particles emitted by an electronic cigarette. Physiol. Rep. 2019, 7, e14093. [Google Scholar] [CrossRef] [PubMed]
- Scungio, M.; Stabile, L.; Buonanno, G. Measurements of electronic cigarette-generated particles for the evaluation of lung cancer risk of active and passive users. J. Aerosol Sci. 2018, 115, 1–11. [Google Scholar] [CrossRef] [Green Version]
- Sosnowski, T.R.; Odziomek, M. Particle size dynamics: Toward a better understanding of electronic cigarette aerosol interactions with the respiratory system. Front. Physiol. 2018, 9, 853. [Google Scholar] [CrossRef]
- Zhao, T.; Shu, S.; Guo, Q.; Zhu, Y. Effects of design parameters and puff topography on heating coil temperature and mainstream aerosols in electronic cigarettes. Atmos. Environ. 2016, 134, 61–69. [Google Scholar] [CrossRef] [Green Version]
- Fuoco, F.C.; Buonanno, G.; Stabile, L.; Vigo, P. Influential parameters on particle concentration and size distribution in the mainstream of e-cigarettes. Environ. Pollut. 2014, 184, 523–529. [Google Scholar] [CrossRef]
- Manigrasso, M.; Buonanno, G.; Fuoco, F.C.; Stabile, L.; Avino, P. Aerosol deposition doses in the human respiratory tree of electronic cigarette smokers. Environ. Pollut. 2015, 196, 257–267. [Google Scholar] [CrossRef]
- McAdam, K.; Davis, P.; Ashmore, L.; Eaton, D.; Jakaj, B.; Eldridge, A.; Liu, C. Influence of machine-based puffing parameters on aerosol and smoke emissions from next generation nicotine inhalation products. Regul. Toxicol. Pharmacol. 2019, 101, 156–165. [Google Scholar] [CrossRef]
- Martonen, T. Deposition patterns of cigarette smoke in human airways. Am. Ind. Hyg. Assoc. J. 1992, 53, 6–18. [Google Scholar] [CrossRef]
- St. Helen, G.; Havel, C.; Dempsey, D.A.; Jacob, P., III; Benowitz, N.L. Nicotine delivery, retention and pharmacokinetics from various electronic cigarettes. Addiction 2016, 111, 535–544. [Google Scholar] [CrossRef]
- Samburova, V.; Bhattarai, C.; Strickland, M.; Darrow, L.; Angermann, J.; Son, Y.; Khlystov, A. Aldehydes in exhaled breath during e-cigarette vaping: Pilot study results. Toxics 2018, 6, 46. [Google Scholar] [CrossRef] [Green Version]
- Zhao, T.; Nguyen, C.; Lin, C.H.; Middlekauff, H.R.; Peters, K.; Moheimani, R.; Guo, Q.; Zhu, Y. Characteristics of secondhand electronic cigarette aerosols from active human use. Aerosol Sci. Technol. 2017, 51, 1368–1376. [Google Scholar] [CrossRef] [Green Version]
- Martuzevicius, D.; Prasauskas, T.; Setyan, A.; O’Connell, G.; Cahours, X.; Julien, R.; Colard, S. Characterization of the spatial and temporal dispersion differences between exhaled e-cigarette mist and cigarette smoke. Nicotine Tob. Res. 2019, 21, 1371–1377. [Google Scholar] [CrossRef]
- Palmisani, J.; Di Gilio, A.; Palmieri, L.; Abenavoli, C.; Famele, M.; Draisci, R.; de Gennaro, G. Evaluation of Second-Hand Exposure to Electronic Cigarette Vaping under a Real Scenario: Measurements of Ultrafine Particle Number Concentration and Size Distribution and Comparison with Traditional Tobacco Smoke. Toxics 2019, 7, 59. [Google Scholar] [CrossRef] [Green Version]
- Yeoh, G.H.; Tu, J. Computational Techniques for Multiphase Flows; Butterworth-Heinemann: Oxford, UK, 2019. [Google Scholar]
- Elghobashi, S. On predicting particle-laden turbulent flows. Appl. Sci. Res. 1994, 52, 309–329. [Google Scholar] [CrossRef]
- Ai, Z.; Mak, C.M.; Gao, N.; Niu, J. Tracer Gas is a Suitable Surrogate of Exhaled Droplet Nuclei for Studying Airborne Transmission in the Built Environment; Building Simulation; Springer: Berlin/Heidelberg, Germany, 2020; pp. 1–8. [Google Scholar]
- Nazaroff, W.W. Indoor particle dynamics. Indoor Air 2004, 14, 175–183. [Google Scholar] [CrossRef]
- Gupta, J.; Lin, C.H.; Chen, Q. Flow dynamics and characterization of a cough. Indoor Air 2009, 19, 517–525. [Google Scholar] [CrossRef] [PubMed]
- Gupta, J.K.; Lin, C.H.; Chen, Q. Characterizing exhaled airflow from breathing and talking. Indoor Air 2010, 20, 31–39. [Google Scholar] [CrossRef] [PubMed]
- Ivanov, M. Exhaled air speed measurements of respiratory air flow, generated by ten different human subjects, under uncontrolled conditions. In E3S Web of Conferences; EDP Sciences: Les Ulis, France, 2019; Volume 111. [Google Scholar]
- Hinds, W.C. Aerosol Technology: Properties, Behavior, and Measurement of Airborne Particles; John Wiley & Sons: Hoboken, NJ, USA, 1999. [Google Scholar]
- Bourouiba, L.; Dehandschoewercker, E.; Bush, J.W. Violent expiratory events: On coughing and sneezing. J. Fluid Mech. 2014, 745, 537–563. [Google Scholar] [CrossRef]
- Sosnowski, T.R.; Kramek-Romanowska, K. Predicted deposition of e-cigarette aerosol in the human lungs. J. Aerosol Med. Pulm. Drug Deliv. 2016, 29, 299–309. [Google Scholar] [CrossRef]
- Bernstein, D.M. A review of the influence of particle size, puff volume, and inhalation pattern on the deposition of cigarette smoke particles in the respiratory tract. Inhal. Toxicol. 2004, 16, 675–689. [Google Scholar] [CrossRef]
- Marian, C.; O’Connor, R.J.; Djordjevic, M.V.; Rees, V.W.; Hatsukami, D.K.; Shields, P.G. Reconciling human smoking behavior and machine smoking patterns: Implications for understanding smoking behavior and the impact on laboratory studies. Cancer Epidemiol. Prev. Biomark. 2009, 18, 3305–3320. [Google Scholar] [CrossRef] [Green Version]
- Higenbottam, T.; Feyeraband, C.; Clark, T. Cigarette smoke inhalation and the acute airway response. Thorax 1980, 35, 246–254. [Google Scholar] [CrossRef] [Green Version]
- Tobin, M.J.; Schneider, A.W.; Sackner, M.A. Breathing pattern during and after smoking cigarettes. Clin. Sci. 1982, 63, 473–483. [Google Scholar] [CrossRef] [Green Version]
- Tobin, M.J.; Jenouri, G.; Sackner, M.A. Subjective and objective measurement of cigarette smoke inhalation. Chest 1982, 82, 696–700. [Google Scholar] [CrossRef]
- Herning, R.I.; Hunt, J.S.; Jones, R.T. The importance of inhalation volume when measuring smoking behavior. Behav. Res. Methods Instrum. 1983, 15, 561–568. [Google Scholar] [CrossRef]
- Wheatley, J.; Amis, T.; Engel, L. Nasal and oral airway pressure-flow relationships. J. Appl. Physiol. 1991, 71, 2317–2324. [Google Scholar] [CrossRef]
- Jaeger, M.J.; Matthys, H. The pattern of flow in the upper human airways. Respir. Physiol. 1968, 6, 113–127. [Google Scholar] [CrossRef]
- Cahours, X.; Prasad, K. A Review of Electronic Cigarette Use Behaviour Studies. Beiträge Tab. Int./Contrib. Tob. Tob. Res. 2018, 28, 81–92. [Google Scholar] [CrossRef] [Green Version]
- Vas, C.A.; Yurteri, C.Ü.; Dickens, C.J.; Prasad, K. Development and characterisation of a smoking behaviour measurement system. Beiträge Tab. Int./Contrib. Tob. Tob. Res. 2015, 26, 219–231. [Google Scholar] [CrossRef] [Green Version]
- Gilbert, R.; Auchincloss, J., Jr.; Brodsky, J.; Boden, W.A. Changes in tidal volume, frequency, and ventilation induced by their measurement. J. Appl. Physiol. 1972, 33, 252–254. [Google Scholar] [CrossRef]
- Askanazi, J.; Silverberg, P.; Foster, R.; Hyman, A.; Milic-Emili, J.; Kinney, J. Effects of respiratory apparatus on breathing pattern. J. Appl. Physiol. 1980, 48, 577–580. [Google Scholar] [CrossRef]
- Hirsch, J.; Bishop, B. Human breathing patterns on mouthpiece or face mask during air, CO2, or low O2. J. Appl. Physiol. 1982, 53, 1281–1290. [Google Scholar] [CrossRef]
- Douglas, N.; White, D.; Weil, J.; Zwillich, C. Effect of breathing route on ventilation and ventilatory drive. Respir. Physiol. 1983, 51, 209–218. [Google Scholar] [CrossRef]
- Weissman, C.; Askanazi, J.; Milic-Emili, J.; Kinney, J.M. Effect of respiratory apparatus on respiration. J. Appl. Physiol. 1984, 57, 475–480. [Google Scholar] [CrossRef]
- Kera, T.; Maruyama, H. The effect of posture on respiratory activity of the abdominal muscles. J. Physiol. Anthropol. Appl. Hum. Sci. 2005, 24, 259–265. [Google Scholar] [CrossRef] [Green Version]
- Rodenstein, D.O.; Mercenier, C.; Stănescu, D.C. Influence of the respiratory route on the resting breathing pattern in humans. Am. Rev. Respir. Dis. 1985, 131, 163–166. [Google Scholar]
- Rodenstein, D.O.; Stănescu, D.C. Pattern of inhalation of tobacco smoke in pipe, cigarette, and never smokers. Am. Rev. Respir. Dis. 1985, 132, 628–632. [Google Scholar]
- Xu, C. Characterizing Human Breathing and Its Interactions with Room Ventilation. Ph.D. Thesis, Hunan University, Changsha, China, 2018. [Google Scholar] [CrossRef]
- Xu, C.; Nielsen, P.; Gong, G.; Liu, L.; Jensen, R. Measuring the exhaled breath of a manikin and human subjects. Indoor Air 2015, 25, 188–197. [Google Scholar] [CrossRef]
- Xu, C.; Nielsen, P.V.; Liu, L.; Jensen, R.L.; Gong, G. Human exhalation characterization with the aid of schlieren imaging technique. Build. Environ 2017, 112, 190–199. [Google Scholar] [CrossRef]
- Chao, C.Y.H.; Wan, M.P.; Morawska, L.; Johnson, G.R.; Ristovski, Z.; Hargreaves, M.; Mengersen, K.; Corbett, S.; Li, Y.; Xie, X.; et al. Characterization of expiration air jets and droplet size distributions immediately at the mouth opening. J. Aerosol Sci. 2009, 40, 122–133. [Google Scholar] [CrossRef] [Green Version]
- Zhu, S.; Yang, J.H.; Kato, S. Investigation into Airborne Transport Characteristics of Airflow Due to Coughing in a Stagnant Indoor Environment. ASHRAE Trans. 2006, 112, 123–133. [Google Scholar]
- Chen, C.; Zhao, B. Some questions on dispersion of human exhaled droplets in ventilation room: Answers from numerical investigation. Indoor Air 2010, 20, 95–111. [Google Scholar] [CrossRef] [PubMed]
- Wei, J.; Li, Y. Airborne spread of infectious agents in the indoor environment. Am. J. Infect. Control 2016, 44, S102–S108. [Google Scholar] [CrossRef] [PubMed]
- Scharfman, B.; Techet, A.; Bush, J.; Bourouiba, L. Visualization of sneeze ejecta: Steps of fluid fragmentation leading to respiratory droplets. Exp. Fluids 2016, 57, 24. [Google Scholar] [CrossRef] [PubMed]
- Nicas, M.; Nazaroff, W.W.; Hubbard, A. Toward understanding the risk of secondary airborne infection: Emission of respirable pathogens. J. Occup. Environ. Hygiene 2005, 2, 143–154. [Google Scholar] [CrossRef] [PubMed]
- Papineni, R.S.; Rosenthal, F.S. The size distribution of droplets in the exhaled breath of healthy human subjects. J. Aerosol Med. 1997, 10, 105–116. [Google Scholar] [CrossRef]
- Fabian, P.; Brain, J.; Houseman, E.A.; Gern, J.; Milton, D.K. Origin of exhaled breath particles from healthy and human rhinovirus-infected subjects. J. Aerosol Med. Pulm. Drug Deliv. 2011, 24, 137–147. [Google Scholar] [CrossRef] [Green Version]
- Wurie, F.; de Waroux, O.L.P.; Brande, M.; DeHaan, W. Characteristics of Exhaled Particle Production in Healthy Volunteers: Possible Implications for Infectious Disease. 2013. Available online: https://www.ncbi.nlm.nih.gov/pmc/articles/PMC3901511/ (accessed on 20 October 2020).
- Asadi, S.; Wexler, A.S.; Cappa, C.D.; Barreda, S.; Bouvier, N.M.; Ristenpart, W.D. Aerosol emission and superemission during human speech increase with voice loudness. Sci. Rep. 2019, 9, 1–10. [Google Scholar] [CrossRef] [Green Version]
- Johnson, G.R.; Morawska, L. The mechanism of breath aerosol formation. J. Aerosol Med. Pulm. Drug Deliv. 2009, 22, 229–237. [Google Scholar] [CrossRef] [Green Version]
- Morawska, L.; Johnson, G.; Ristovski, Z.; Hargreaves, M.; Mengersen, K.; Corbett, S.; Chao, C.Y.H.; Li, Y.; Katoshevski, D. Size distribution and sites of origin of droplets expelled from the human respiratory tract during expiratory activities. J. Aerosol Sci. 2009, 40, 256–269. [Google Scholar] [CrossRef] [Green Version]
- Almstrand, A.C.; Bake, B.; Ljungström, E.; Larsson, P.; Bredberg, A.; Mirgorodskaya, E.; Olin, A.C. Effect of airway opening on production of exhaled particles. J. Appl. Physiol. 2010, 108, 584–588. [Google Scholar] [CrossRef] [Green Version]
- Holmgren, H.; Ljungström, E.; Almstrand, A.C.; Bake, B.; Olin, A.C. Size distribution of exhaled particles in the range from 0.01 to 2.0 μm. J. Aerosol Sci. 2010, 41, 439–446. [Google Scholar] [CrossRef]
- Schwarz, K.; Biller, H.; Windt, H.; Koch, W.; Hohlfeld, J.M. Characterization of exhaled particles from the healthy human lung-a systematic analysis in relation to pulmonary function variables. J. Aerosol Med. Pulm. Drug Deliv. 2010, 23, 371–379. [Google Scholar] [CrossRef]
- Schwarz, K.; Biller, H.; Windt, H.; Koch, W.; Hohlfeld, J.M. Characterization of exhaled particles from the human lungs in airway obstruction. J. Aerosol Med. Pulm. Drug Deliv. 2015, 28, 52–58. [Google Scholar] [CrossRef]
- Bake, B.; Larsson, P.; Ljungkvist, G.; Ljungström, E.; Olin, A. Exhaled particles and small airways. Respir. Res. 2019, 20, 8. [Google Scholar] [CrossRef] [Green Version]
- Haslbeck, K.; Schwarz, K.; Hohlfeld, J.M.; Seume, J.R.; Koch, W. Submicron droplet formation in the human lung. J. Aerosol Sci. 2010, 41, 429–438. [Google Scholar] [CrossRef]
- Johnson, G.; Morawska, L.; Ristovski, Z.; Hargreaves, M.; Mengersen, K.; Chao, C.Y.H.; Wan, M.; Li, Y.; Xie, X.; Katoshevski, D.; et al. Modality of human expired aerosol size distributions. J. Aerosol Sci. 2011, 42, 839–851. [Google Scholar] [CrossRef]
- Holmgren, H.; Gerth, E.; Ljungström, E.; Larsson, P.; Almstrand, A.C.; Bake, B.; Olin, A.C. Effects of breath holding at low and high lung volumes on amount of exhaled particles. Respir. Physiol. Neurobiol. 2013, 185, 228–234. [Google Scholar] [CrossRef]
- Pope, S.B. Turbulent Flows; IOP Publishing Ltd.: London, UK, 2001. [Google Scholar]
- Rajaratnam, N. Turbulent Jets; Elsevier: Amsterdam, The Netherlands, 1976. [Google Scholar]
- Abani, N.; Reitz, R.D. Unsteady turbulent round jets and vortex motion. Phys. Fluids 2007, 19, 125102. [Google Scholar] [CrossRef]
- Abraham, J. Entrapment characteristics of transient gas jets. Numer. Heat Transf. Part A Appl. 1996, 30, 347–364. [Google Scholar] [CrossRef]
- Ghaem-Maghami, E. The Passive Scalar Concentration and Velocity Fields of Isolated Turbulent Puffs. Ph.D. Thesis, Worcester Polytechnic Institute, Worcester, MA, USA, 2006. [Google Scholar]
- Ghaem-Maghami, E.; Johari, H. Velocity field of isolated turbulent puffs. Phys. Fluids 2010, 22, 115105. [Google Scholar] [CrossRef] [Green Version]
- Sangras, R.; Kwon, O.; Faeth, G. Self-preserving properties of unsteady round nonbuoyant turbulent starting jets and puffs in still fluids. J. Heat Transfer 2002, 124, 460–469, Erratum in 2003, 125, 204–205. [Google Scholar] [CrossRef]
- Morton, B.; Nguyen, K.; Cresswell, R. Similarity and self-similarity in the motion of thermals and puffs. In Recent Research Advances in the Fluid Mechanics of Turbulent Jets and Plumes; Springer: Berlin/Heidelberg, Germany, 1994; pp. 89–116. [Google Scholar]
- Shin, D.H.; Aspden, A.; Richardson, E.S. Self-similar properties of decelerating turbulent jets. J. Fluid Mech. 2017, 833. [Google Scholar] [CrossRef] [Green Version]
- Maple (Release 2021). Maple is a Trademark of Waterloo Maple Inc. 2021. Available online: https://www.maplesoft.com/index.aspx?L=E (accessed on 24 June 2021).
- Matthews, T.; Thompson, C.; Wilson, D.; Hawthorne, A.; Mage, D. Air velocities inside domestic environments: An important parameter in the study of indoor air quality and climate. Environ. Int. 1989, 15, 545–550. [Google Scholar] [CrossRef]
- Berlanga, F.; Olmedo, I.; Ruiz de Adana, M. Experimental analysis of the air velocity and contaminant dispersion of human exhalation flows. Indoor Air 2017, 27, 803–815. [Google Scholar] [CrossRef]
- Wei, J.; Li, Y. Enhanced spread of expiratory droplets by turbulence in a cough jet. Build. Environ. 2015, 93, 86–96. [Google Scholar] [CrossRef]
- Vuorinen, V.; Aarnio, M.; Alava, M.; Alopaeus, V.; Atanasova, N.; Auvinen, M.; Balasubramanian, N.; Bordbar, H.; Erästö, P.; Grande, R.; et al. Modelling aerosol transport and virus exposure with numerical simulations in relation to SARS-CoV-2 transmission by inhalation indoors. Saf. Sci. 2020, 130, 104866. [Google Scholar] [CrossRef]
- Wang, J.; Chow, T.T. Numerical investigation of influence of human walking on dispersion and deposition of expiratory droplets in airborne infection isolation room. Build. Environ. 2011, 46, 1993–2002. [Google Scholar] [CrossRef]
- He, Q.; Niu, J.; Gao, N.; Zhu, T.; Wu, J. CFD study of exhaled droplet transmission between occupants under different ventilation strategies in a typical office room. Build. Environ. 2011, 46, 397–408. [Google Scholar] [CrossRef]
- Gao, N.; Niu, J. Modeling particle dispersion and deposition in indoor environments. Atmos. Environ. 2007, 41, 3862–3876. [Google Scholar] [CrossRef]
- Gao, N.; Niu, J.; Morawska, L. Distribution of respiratory droplets in enclosed environments under different air distribution methods. Building Simulation; Springer: Berlin/Heidelberg, Germany, 2008; Volume 1, pp. 326–335. [Google Scholar]
- Hsiang, S.; Allen, D.; Annan-Phan, S.; Bell, K.; Bolliger, I.; Chong, T.; Druckenmiller, H.; Huang, L.Y.; Hultgren, A.; Krasovich, E.; et al. The effect of large-scale anti-contagion policies on the COVID-19 pandemic. Nature 2020, 584, 262–267. [Google Scholar] [CrossRef] [PubMed]
Short Biography of Authors
Roberto A. Sussman is tenured researcher of Theoretical Physics at the Institute for Nuclear Sciences, National Autonomous University of Mexico (ICN-UNAM).
Eliana Golberstein is currently employed by Myriad Pharmaceuticals, an independent company that manufactures e-liquids and vaping devices in New Zealand. She also provides consultancy work on research and development, regulatory affairs support and formulation to several independent vaping companies in the Pacific Region. In the past, she has worked for several pharmaceutical companies, including GlaxoSmithKline and Genomma Lab. She is also a member of the standards committee of the VTANZ and UKVIA.
Riccardo Polosa is full tenured professor of Internal Medicine at the University of Catania (Italy) and Medical Director of the Institute for Internal Medicine and Clinical Immunology at the same university. In relation to his recent work in the area of respiratory diseases, clinical immunology and tobacco control, RP has received lecture fees and research funding from Pfizer, GlaxoSmithKline, CV Therapeutics, NeuroSearch A/S, Sandoz, MSD, Boehringer Ingelheim, Novartis, Duska Therapeutics and Forest Laboratories. Lecture fees from a number of European EC industry and trade associations (including FIVAPE in France and FIESEL in Italy) were directly donated to vaper advocacy non-profit organizations. RP has also received grants from European Commission initiatives (U-BIOPRED and AIRPROM) and from the Integral Rheumatology & Immunology Specialists Network (IRIS) initiative. He has also served as a consultant for Pfizer, Global Health Alliance for treatment of tobacco dependence, CV Therapeutics, Boehringer Ingelheim, Novartis, Duska Therapeutics, ECITA (Electronic Cigarette Industry Trade Association, in the UK), Arbi Group Srl. and Health Diplomats. RP has served on the Medical and Scientific Advisory Board of Cordex Pharma, Inc., CV Therapeutics, Duska Therapeutics Inc, Pfizer and PharmaCielo. RP is also founder of the Center for Tobacco prevention and treatment (CPCT) at the University of Catania and of the Center of Excellence for the acceleration of Harm Reduction (CoEHAR) at the same university, which has received support from the Foundation for a Smoke Free World to conduct eight independent investigator-initiated research projects on harm reduction. RP is also currently involved in the following pro bono activities: scientific advisor for LIAF, Lega Italiana Anti Fumo (Italian acronym for Italian Anti-Smoking League), the Consumer Advocates for Smoke-free Alternatives (CASAA) and the International Network of Nicotine Consumers Organizations (INNCO). RP is the Chair of the European Technical Committee for standardization on “Requirements and test methods for emissions of electronic cigarettes” (CEN/TC 437; WG4).
Publisher’s Note: MDPI stays neutral with regard to jurisdictional claims in published maps and institutional affiliations. |
© 2021 by the authors. Licensee MDPI, Basel, Switzerland. This article is an open access article distributed under the terms and conditions of the Creative Commons Attribution (CC BY) license (https://creativecommons.org/licenses/by/4.0/).