
Field Investigation and Rapid Deterioration Analysis of Heavy Haul Corrugation


Abstract
:1. Introduction
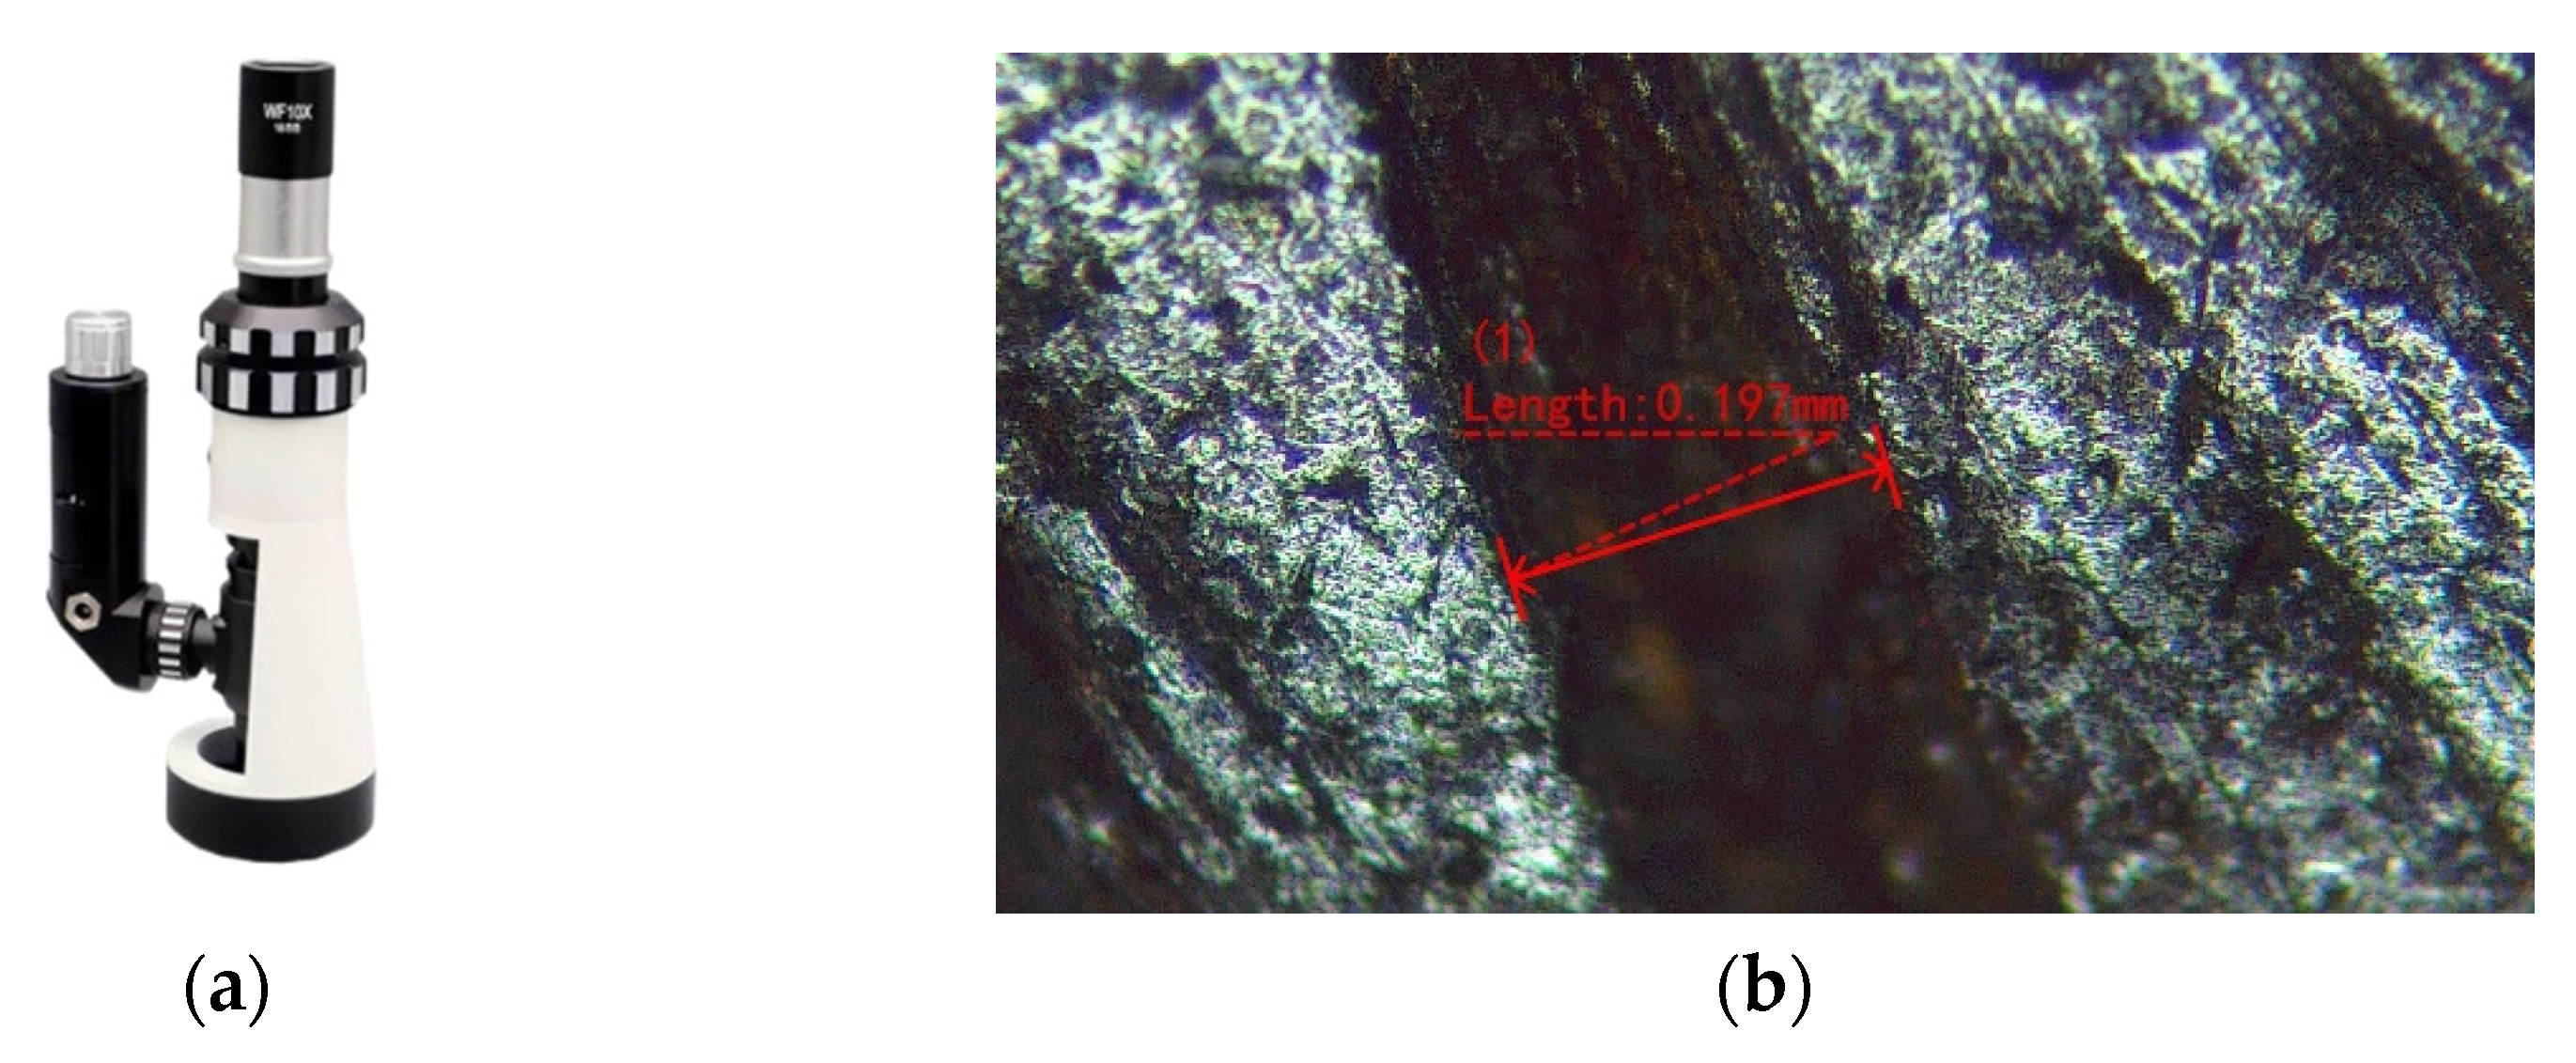
2. Field Tests
2.1. Experimental Setup
2.2. Field Testing Methodology
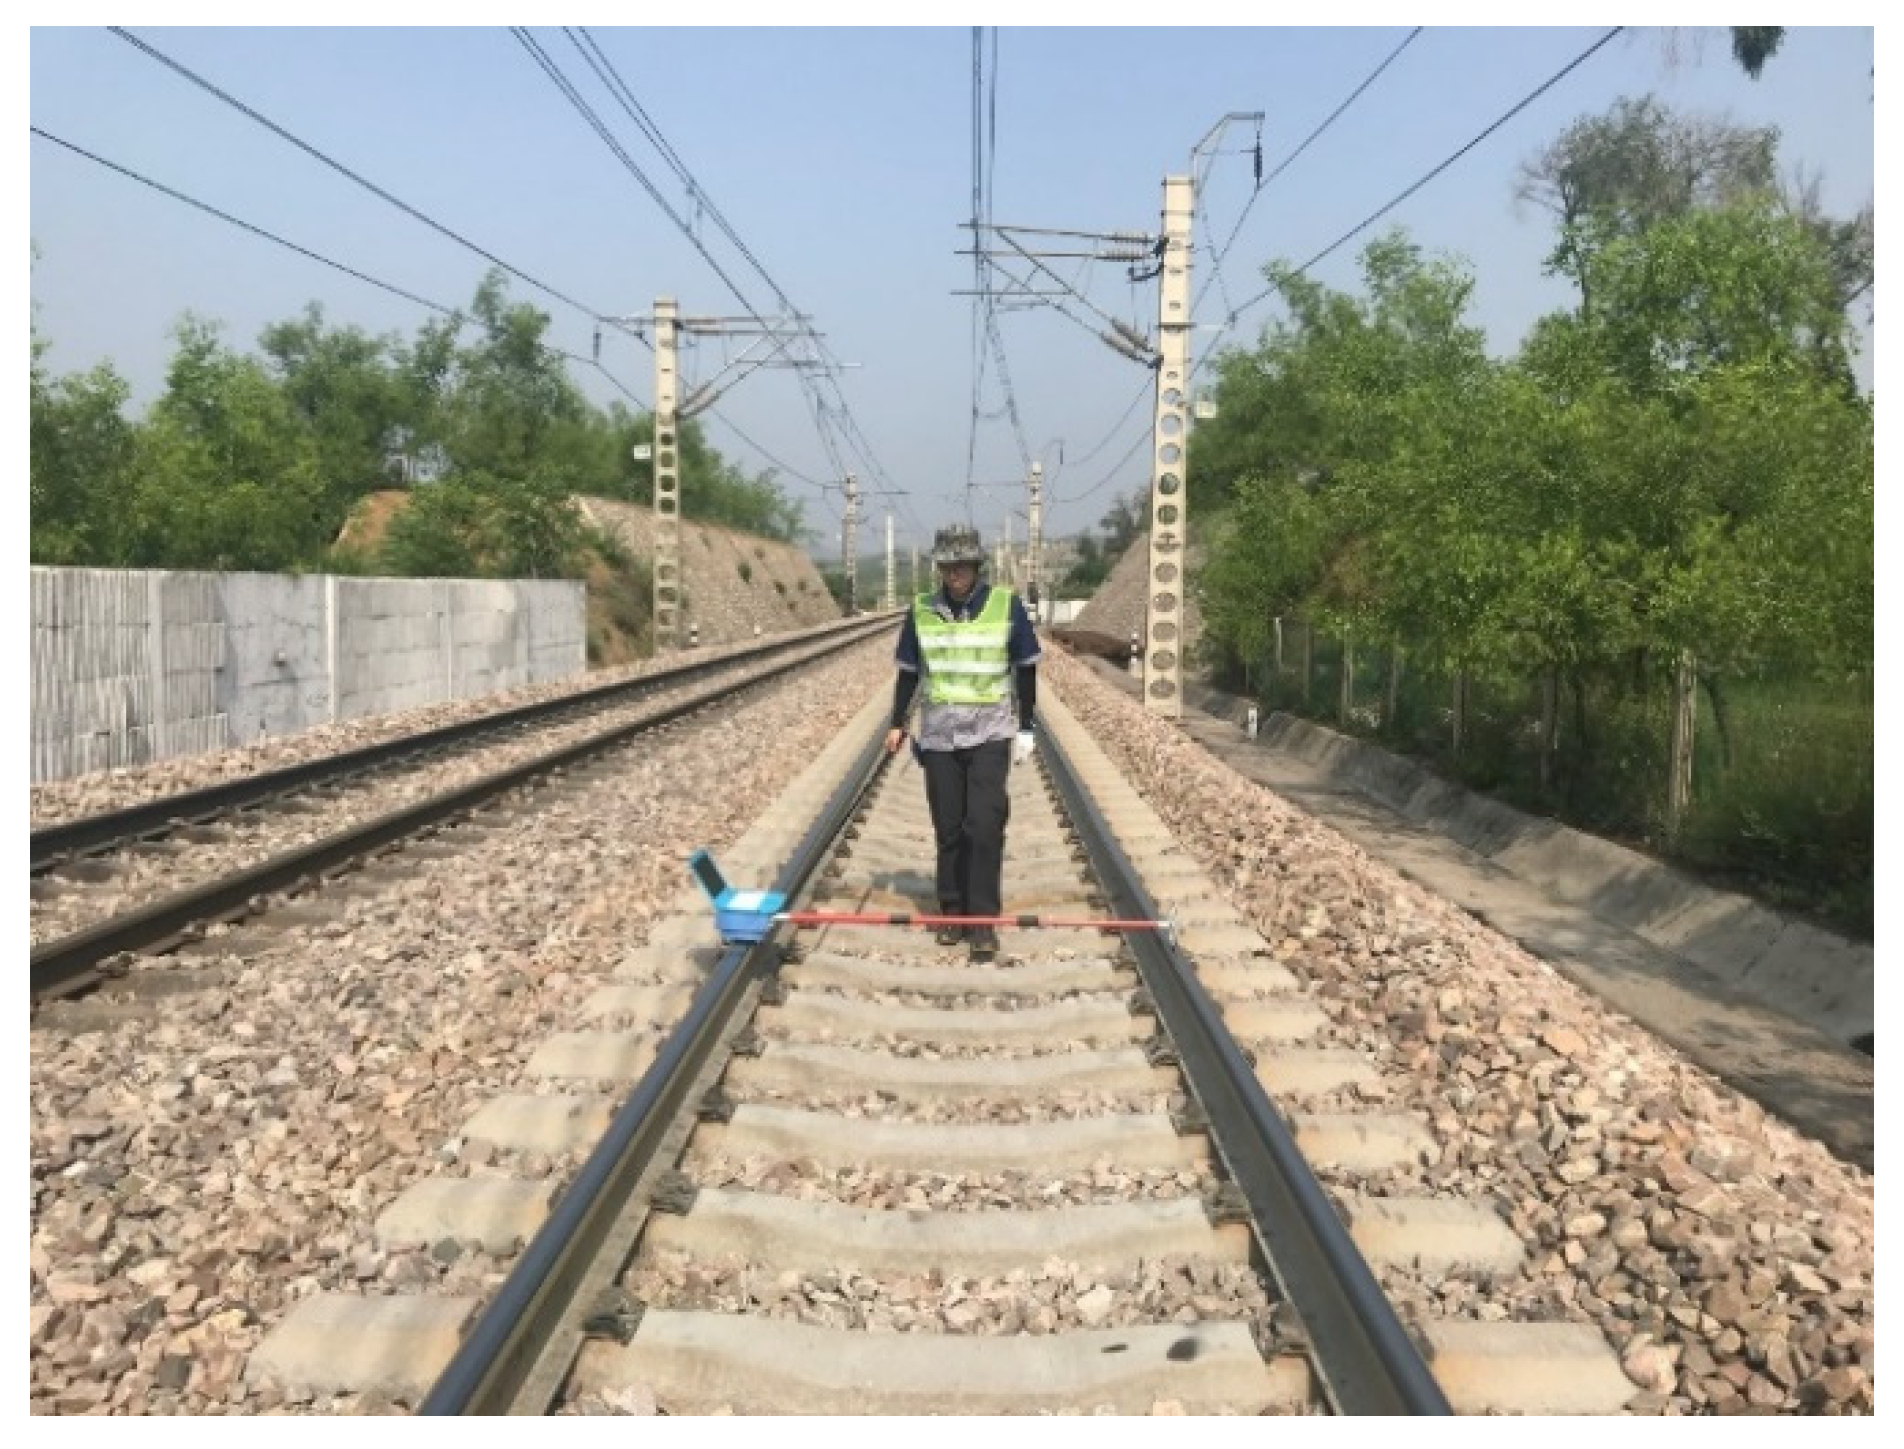
2.2.1. Testing Setup
2.2.2. Evaluation Indicators
- 1.
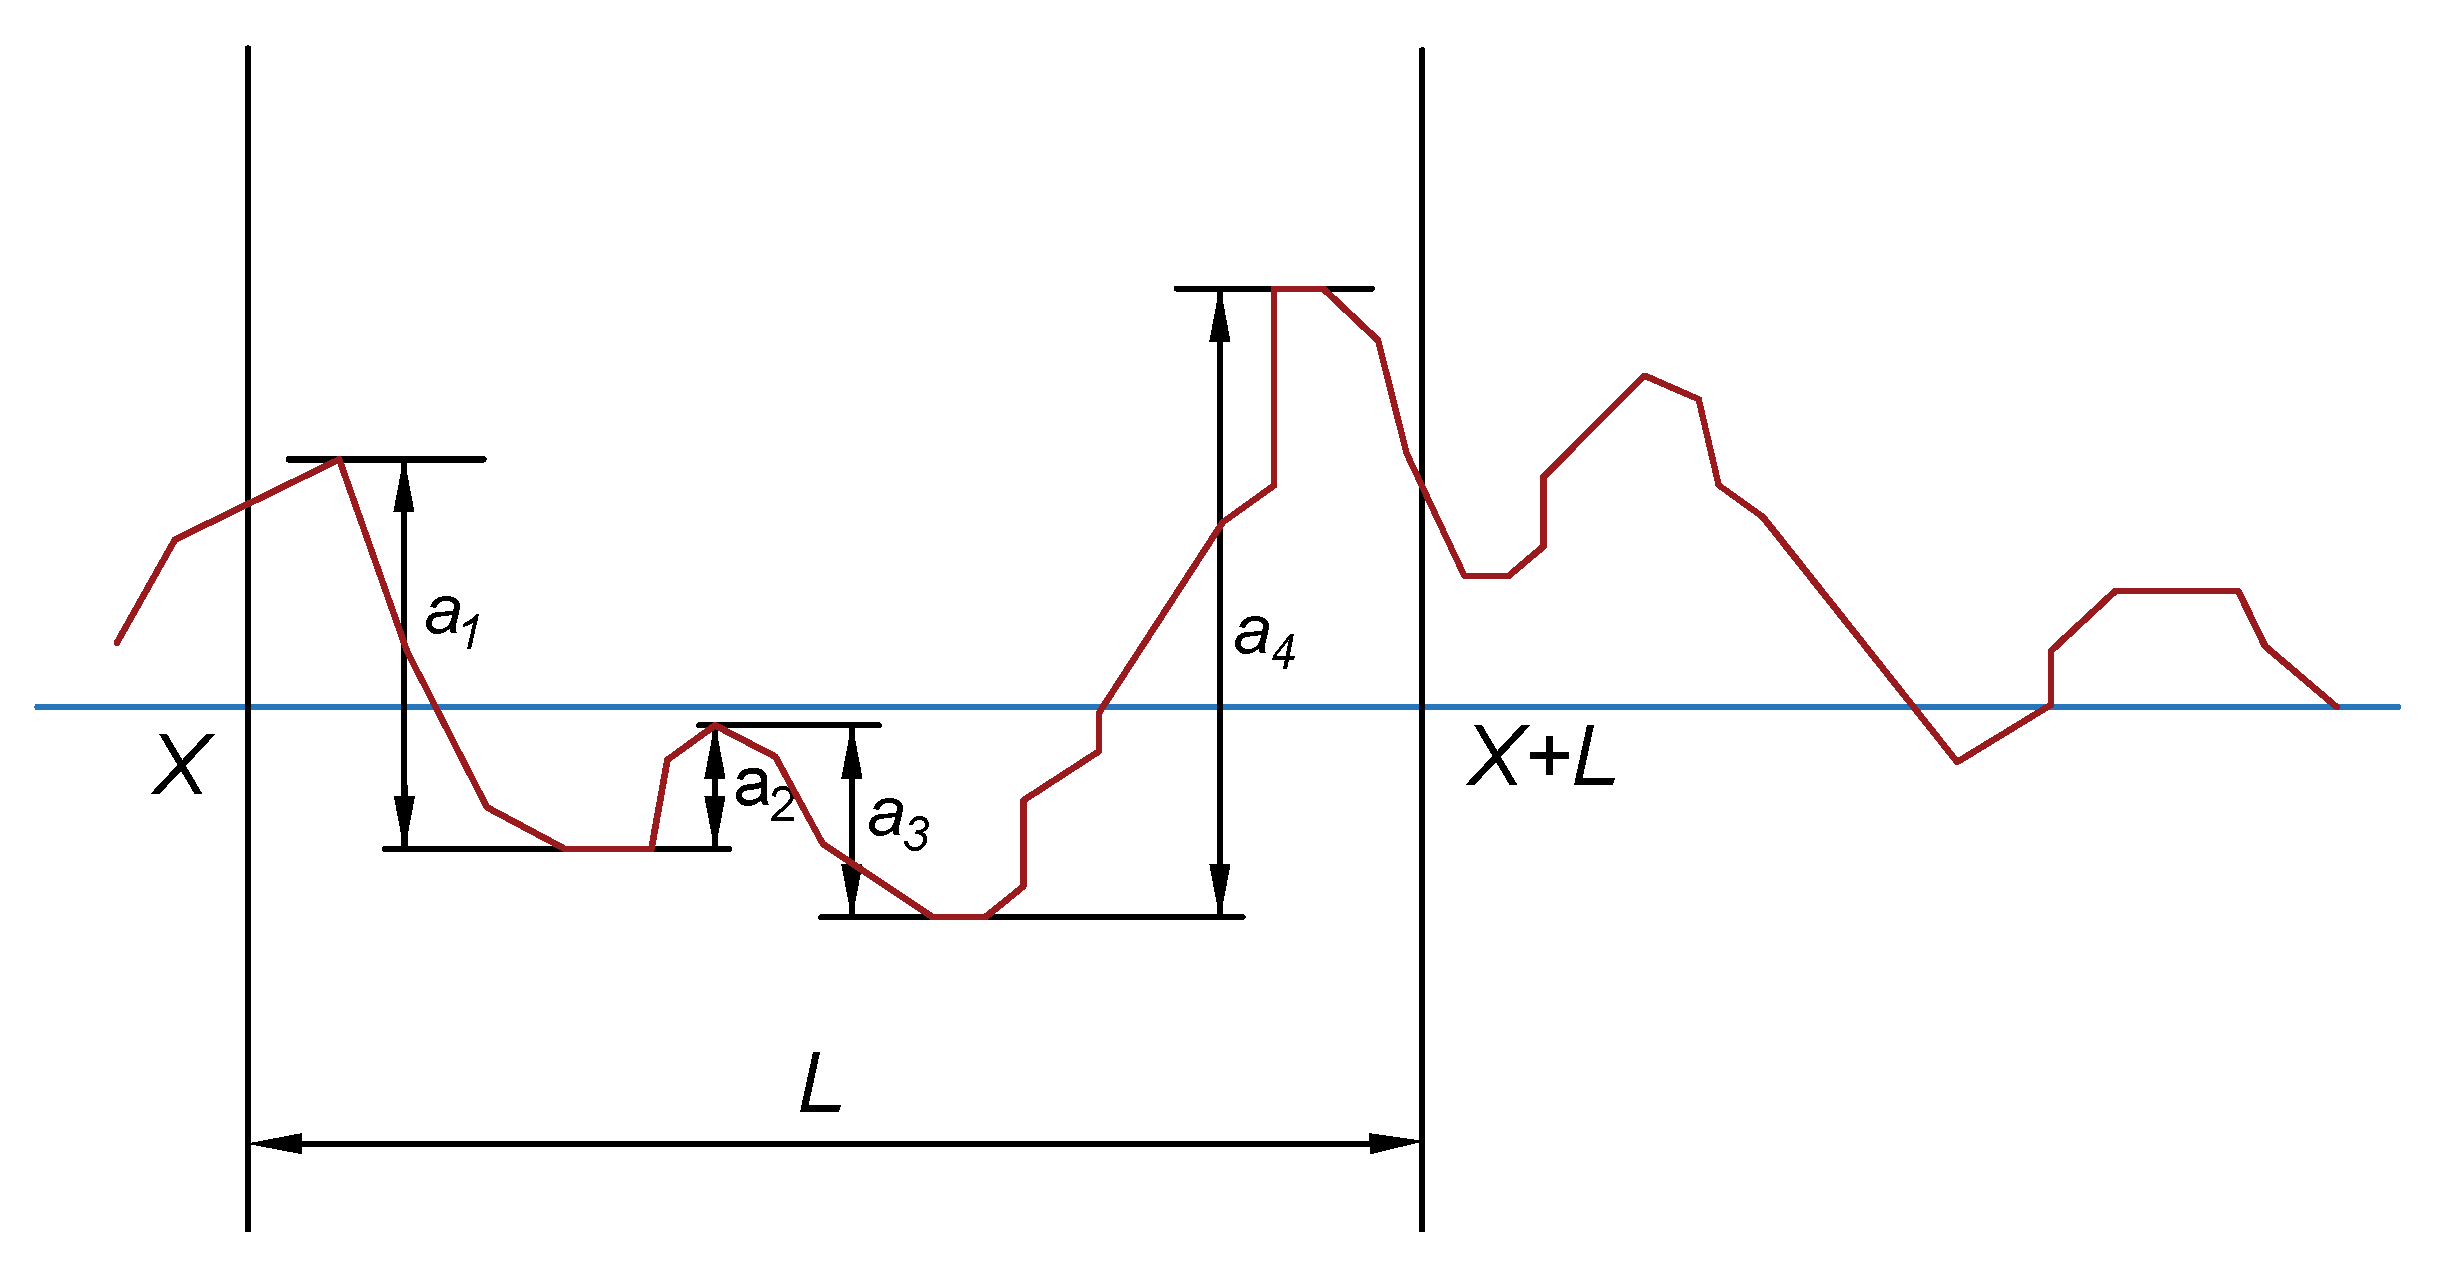
- Peak-to-peak values and allowable over-limit
- 2.
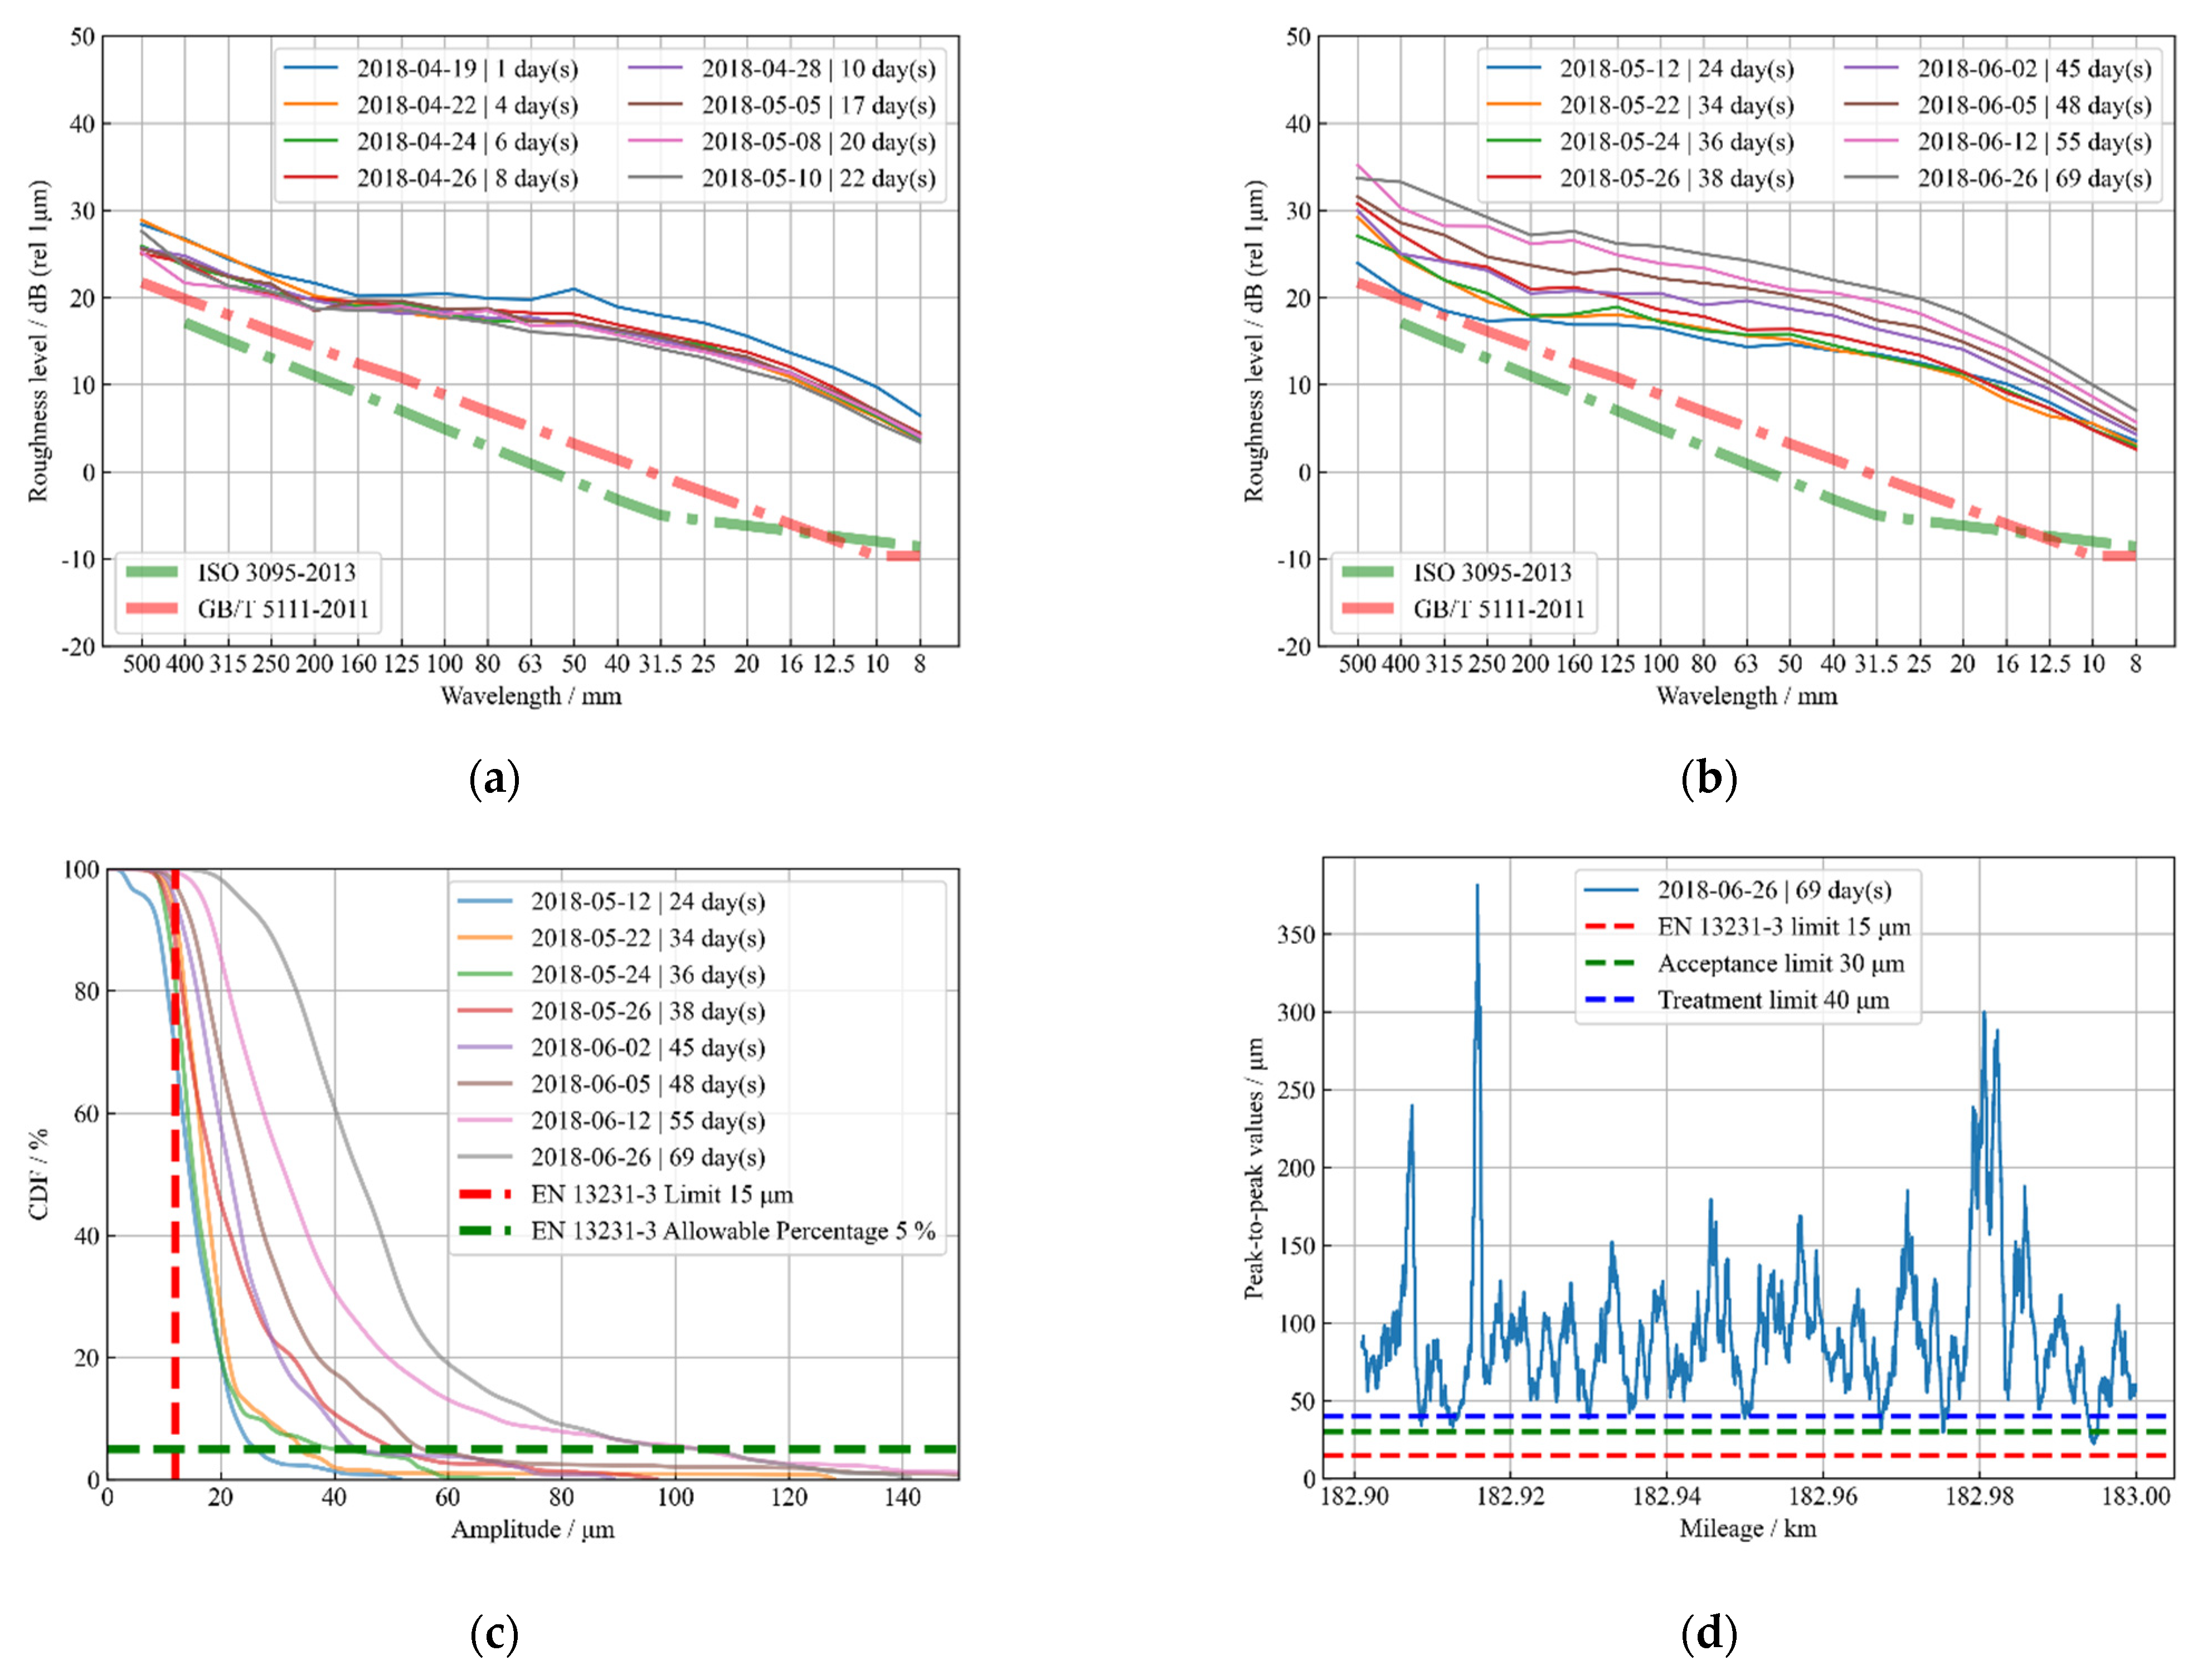
- Roughness level
- 3.
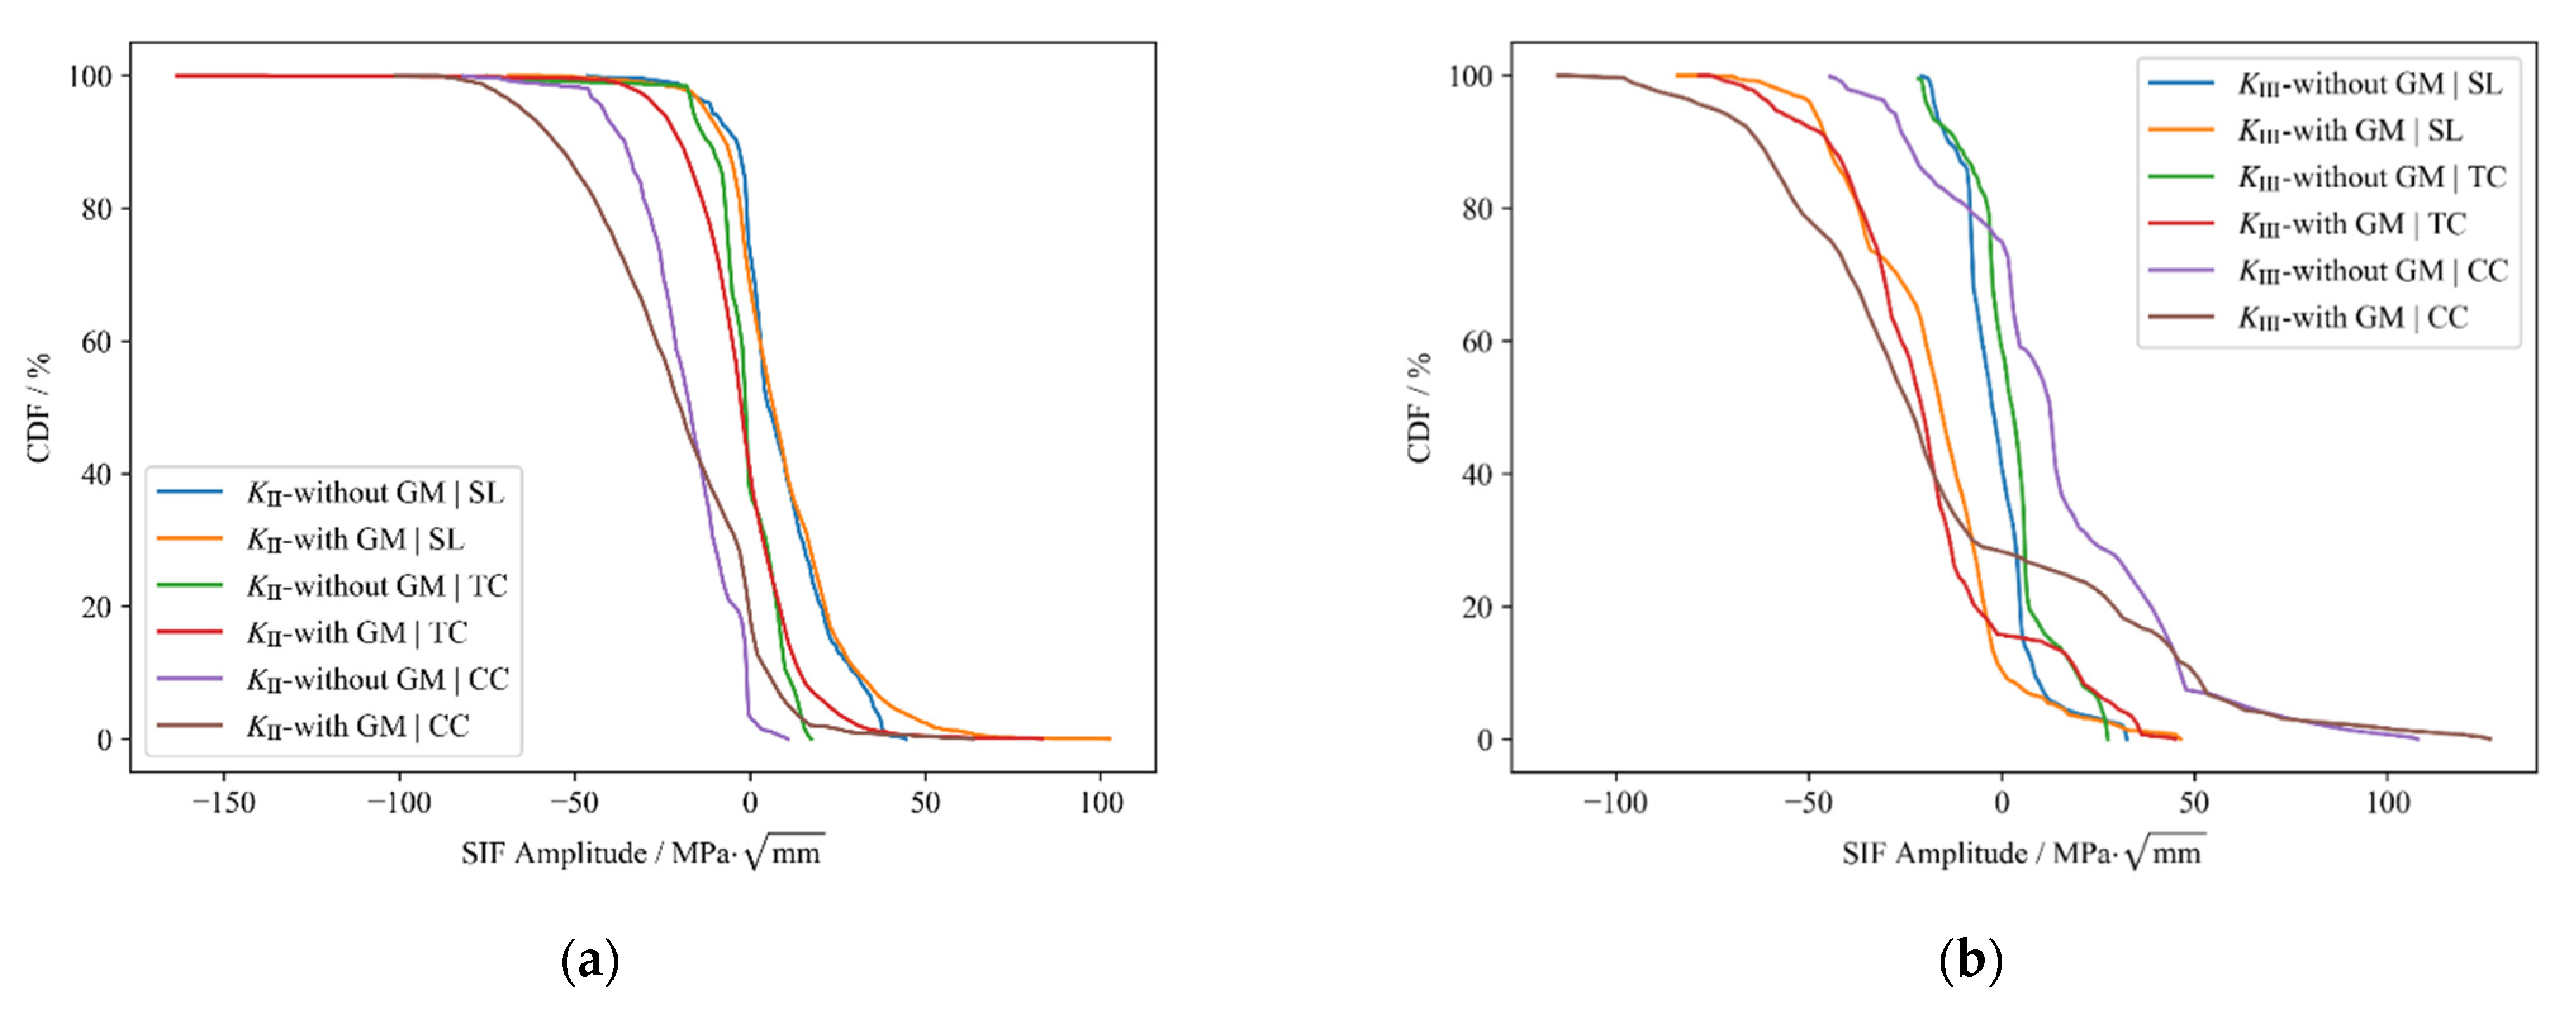
- CDF (Cumulative Distribution Function)
3. Observation of Rapid Deterioration of Rail Corrugation under Poor Grinding Quality
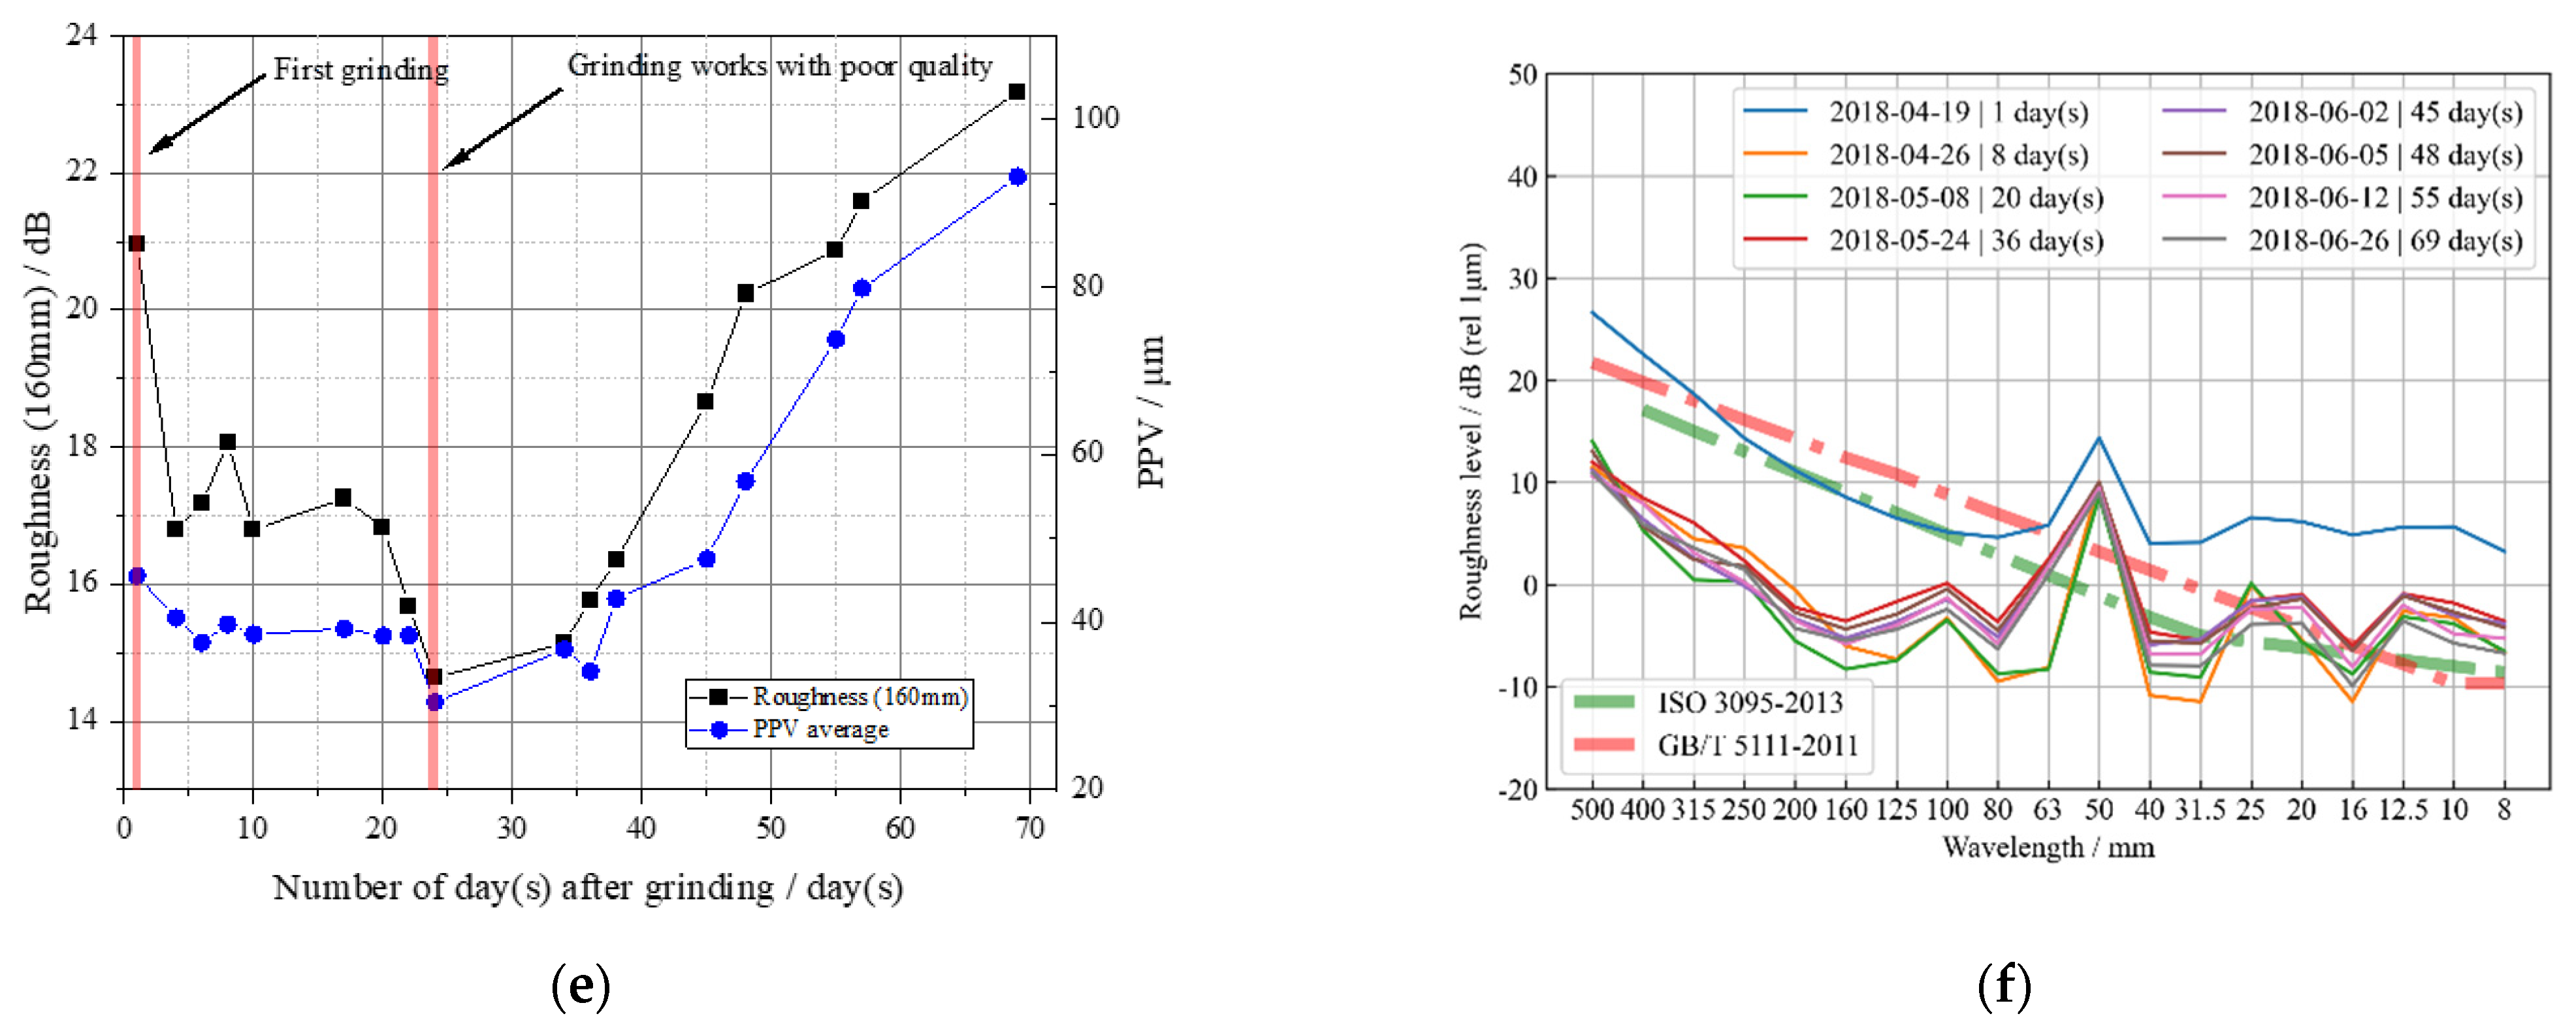
3.1. Development Charateriscs of the Rail Corrugation under Grinding Works
3.2. Reasons for the Rapid Development of Corrugation
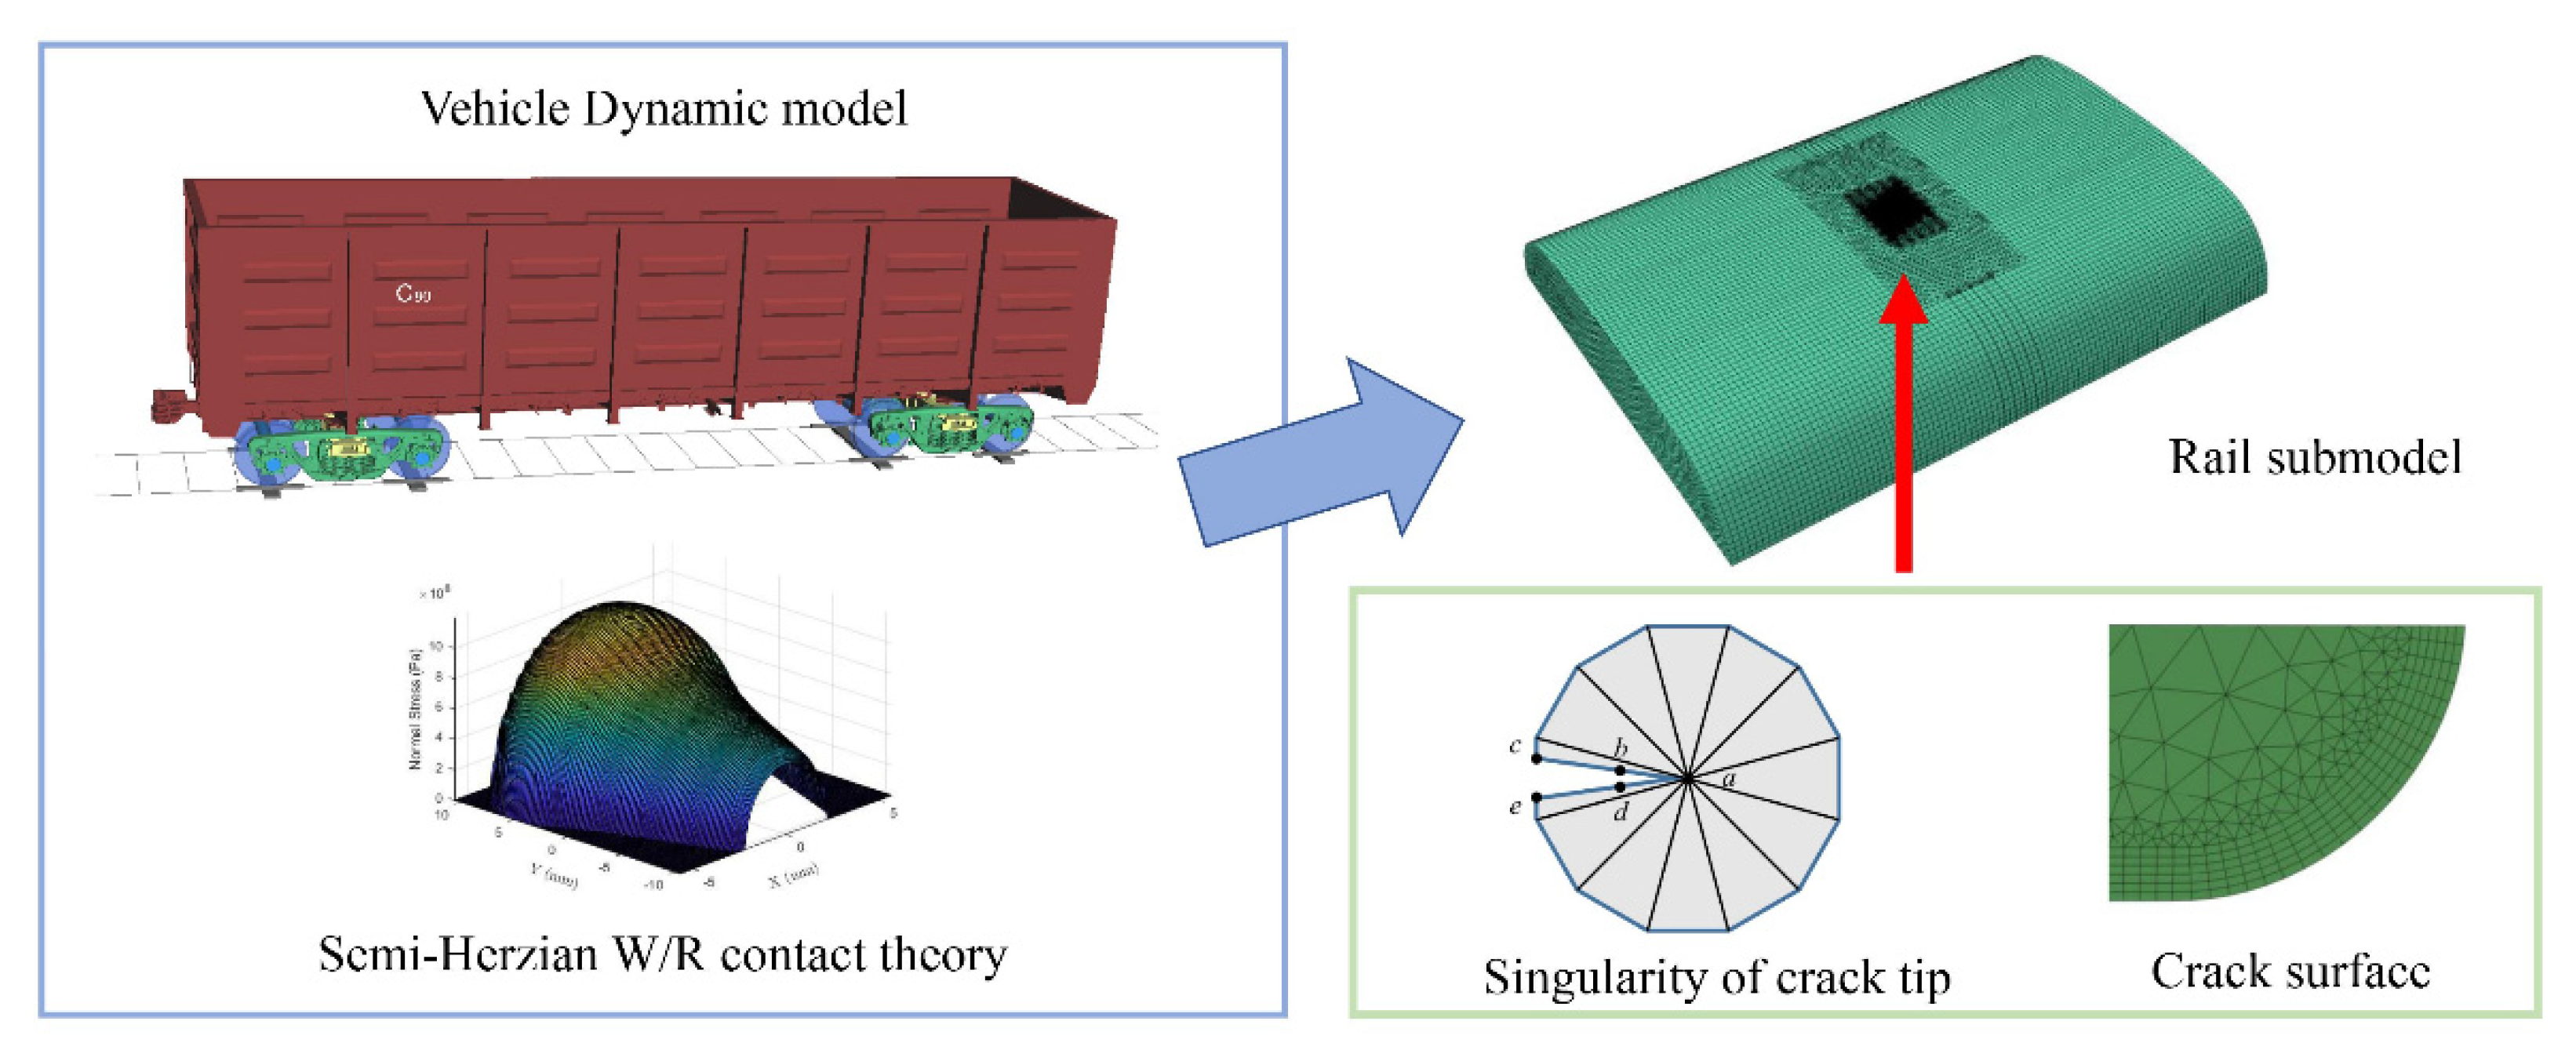
4. Multi-Crack Expansion Analysis Considering Grinding Marks
4.1. Stress Intensity Factor Calculation Based on Displacement of Singular Element
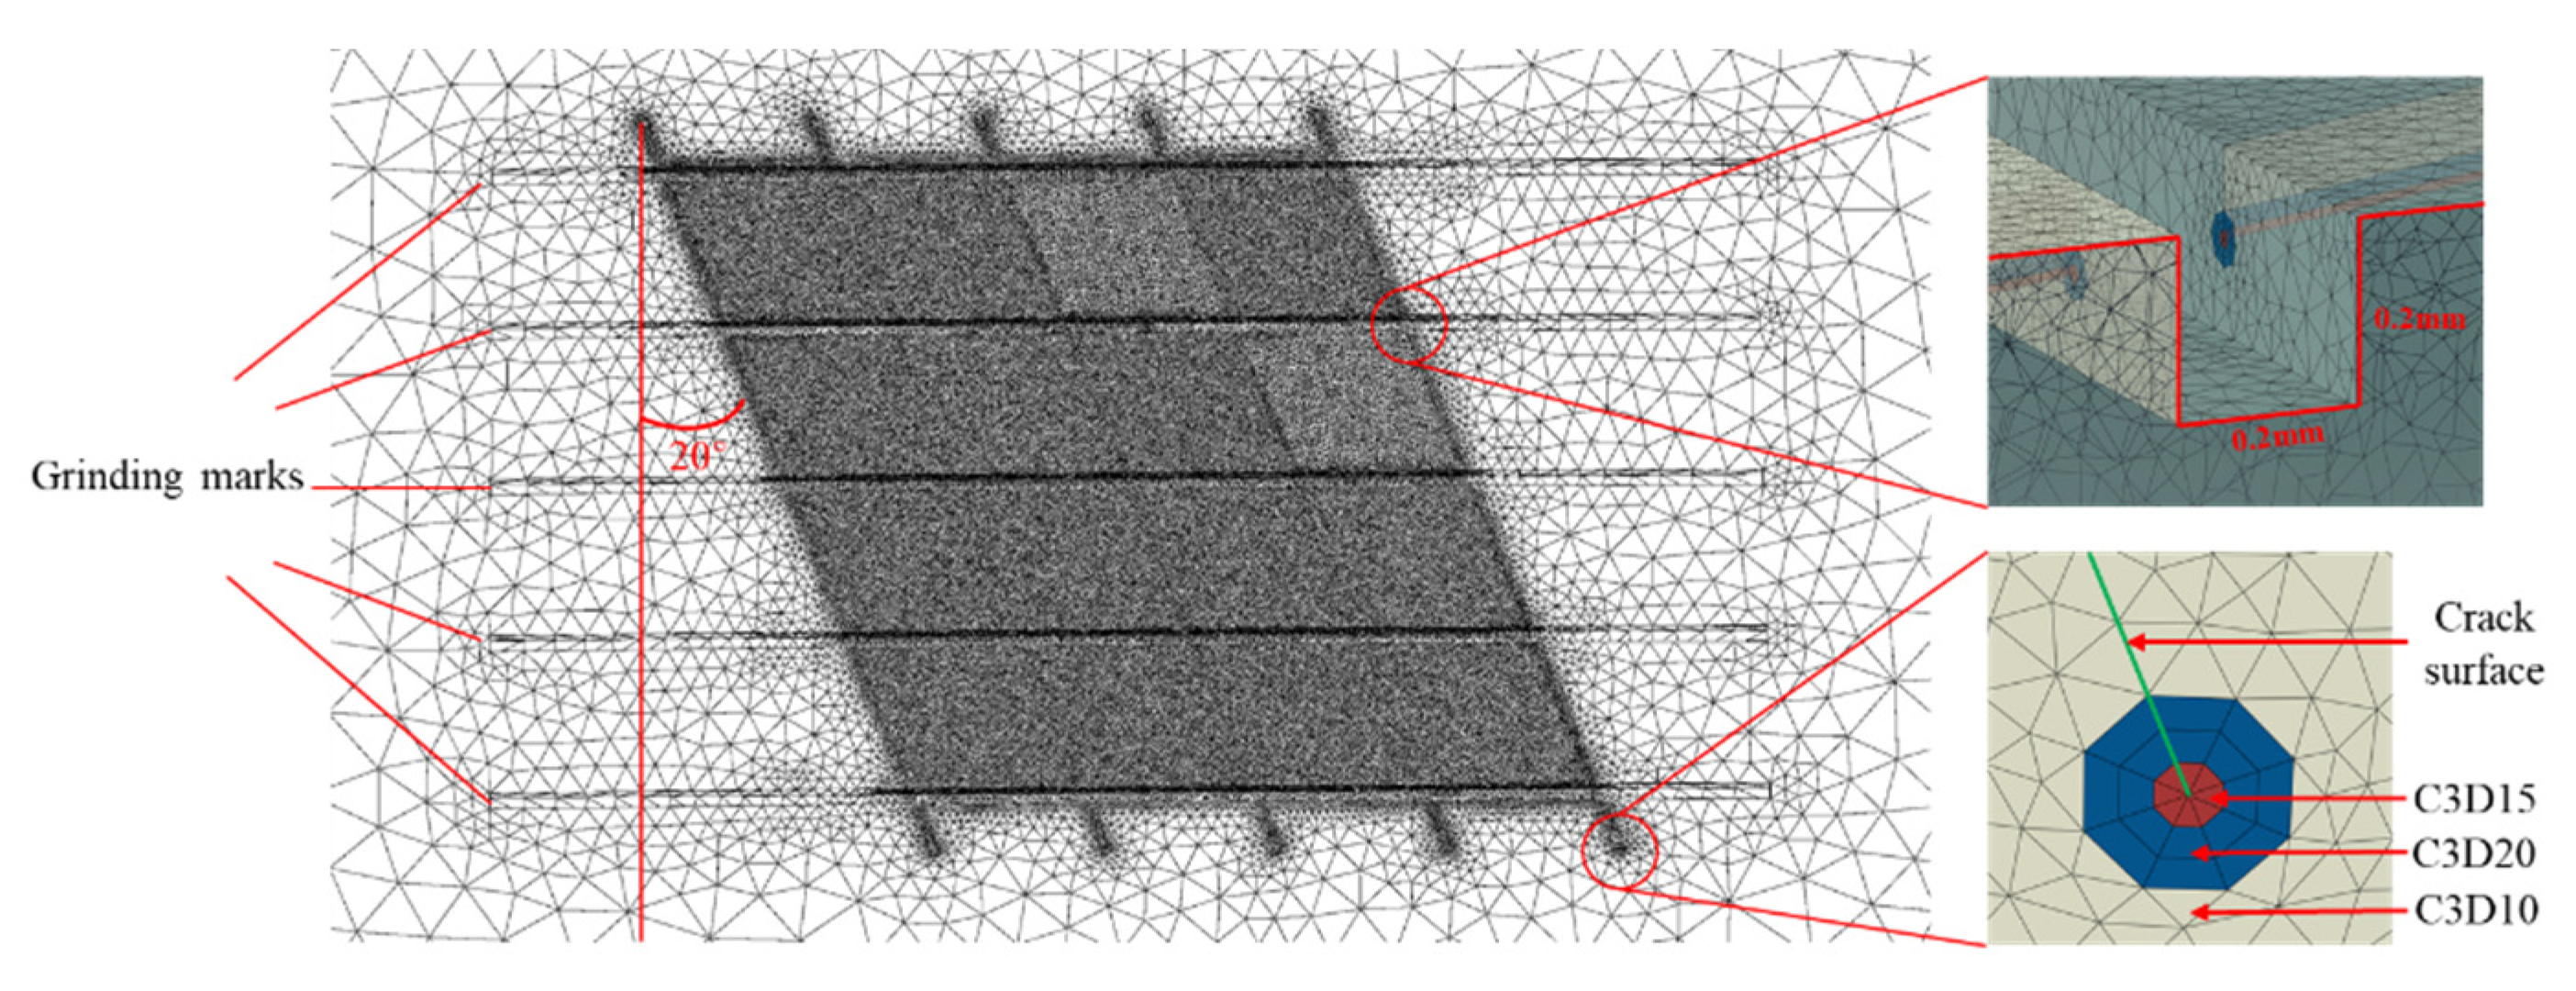
4.2. Establishment of a Multi-Crack Model
4.3. Result Analysis
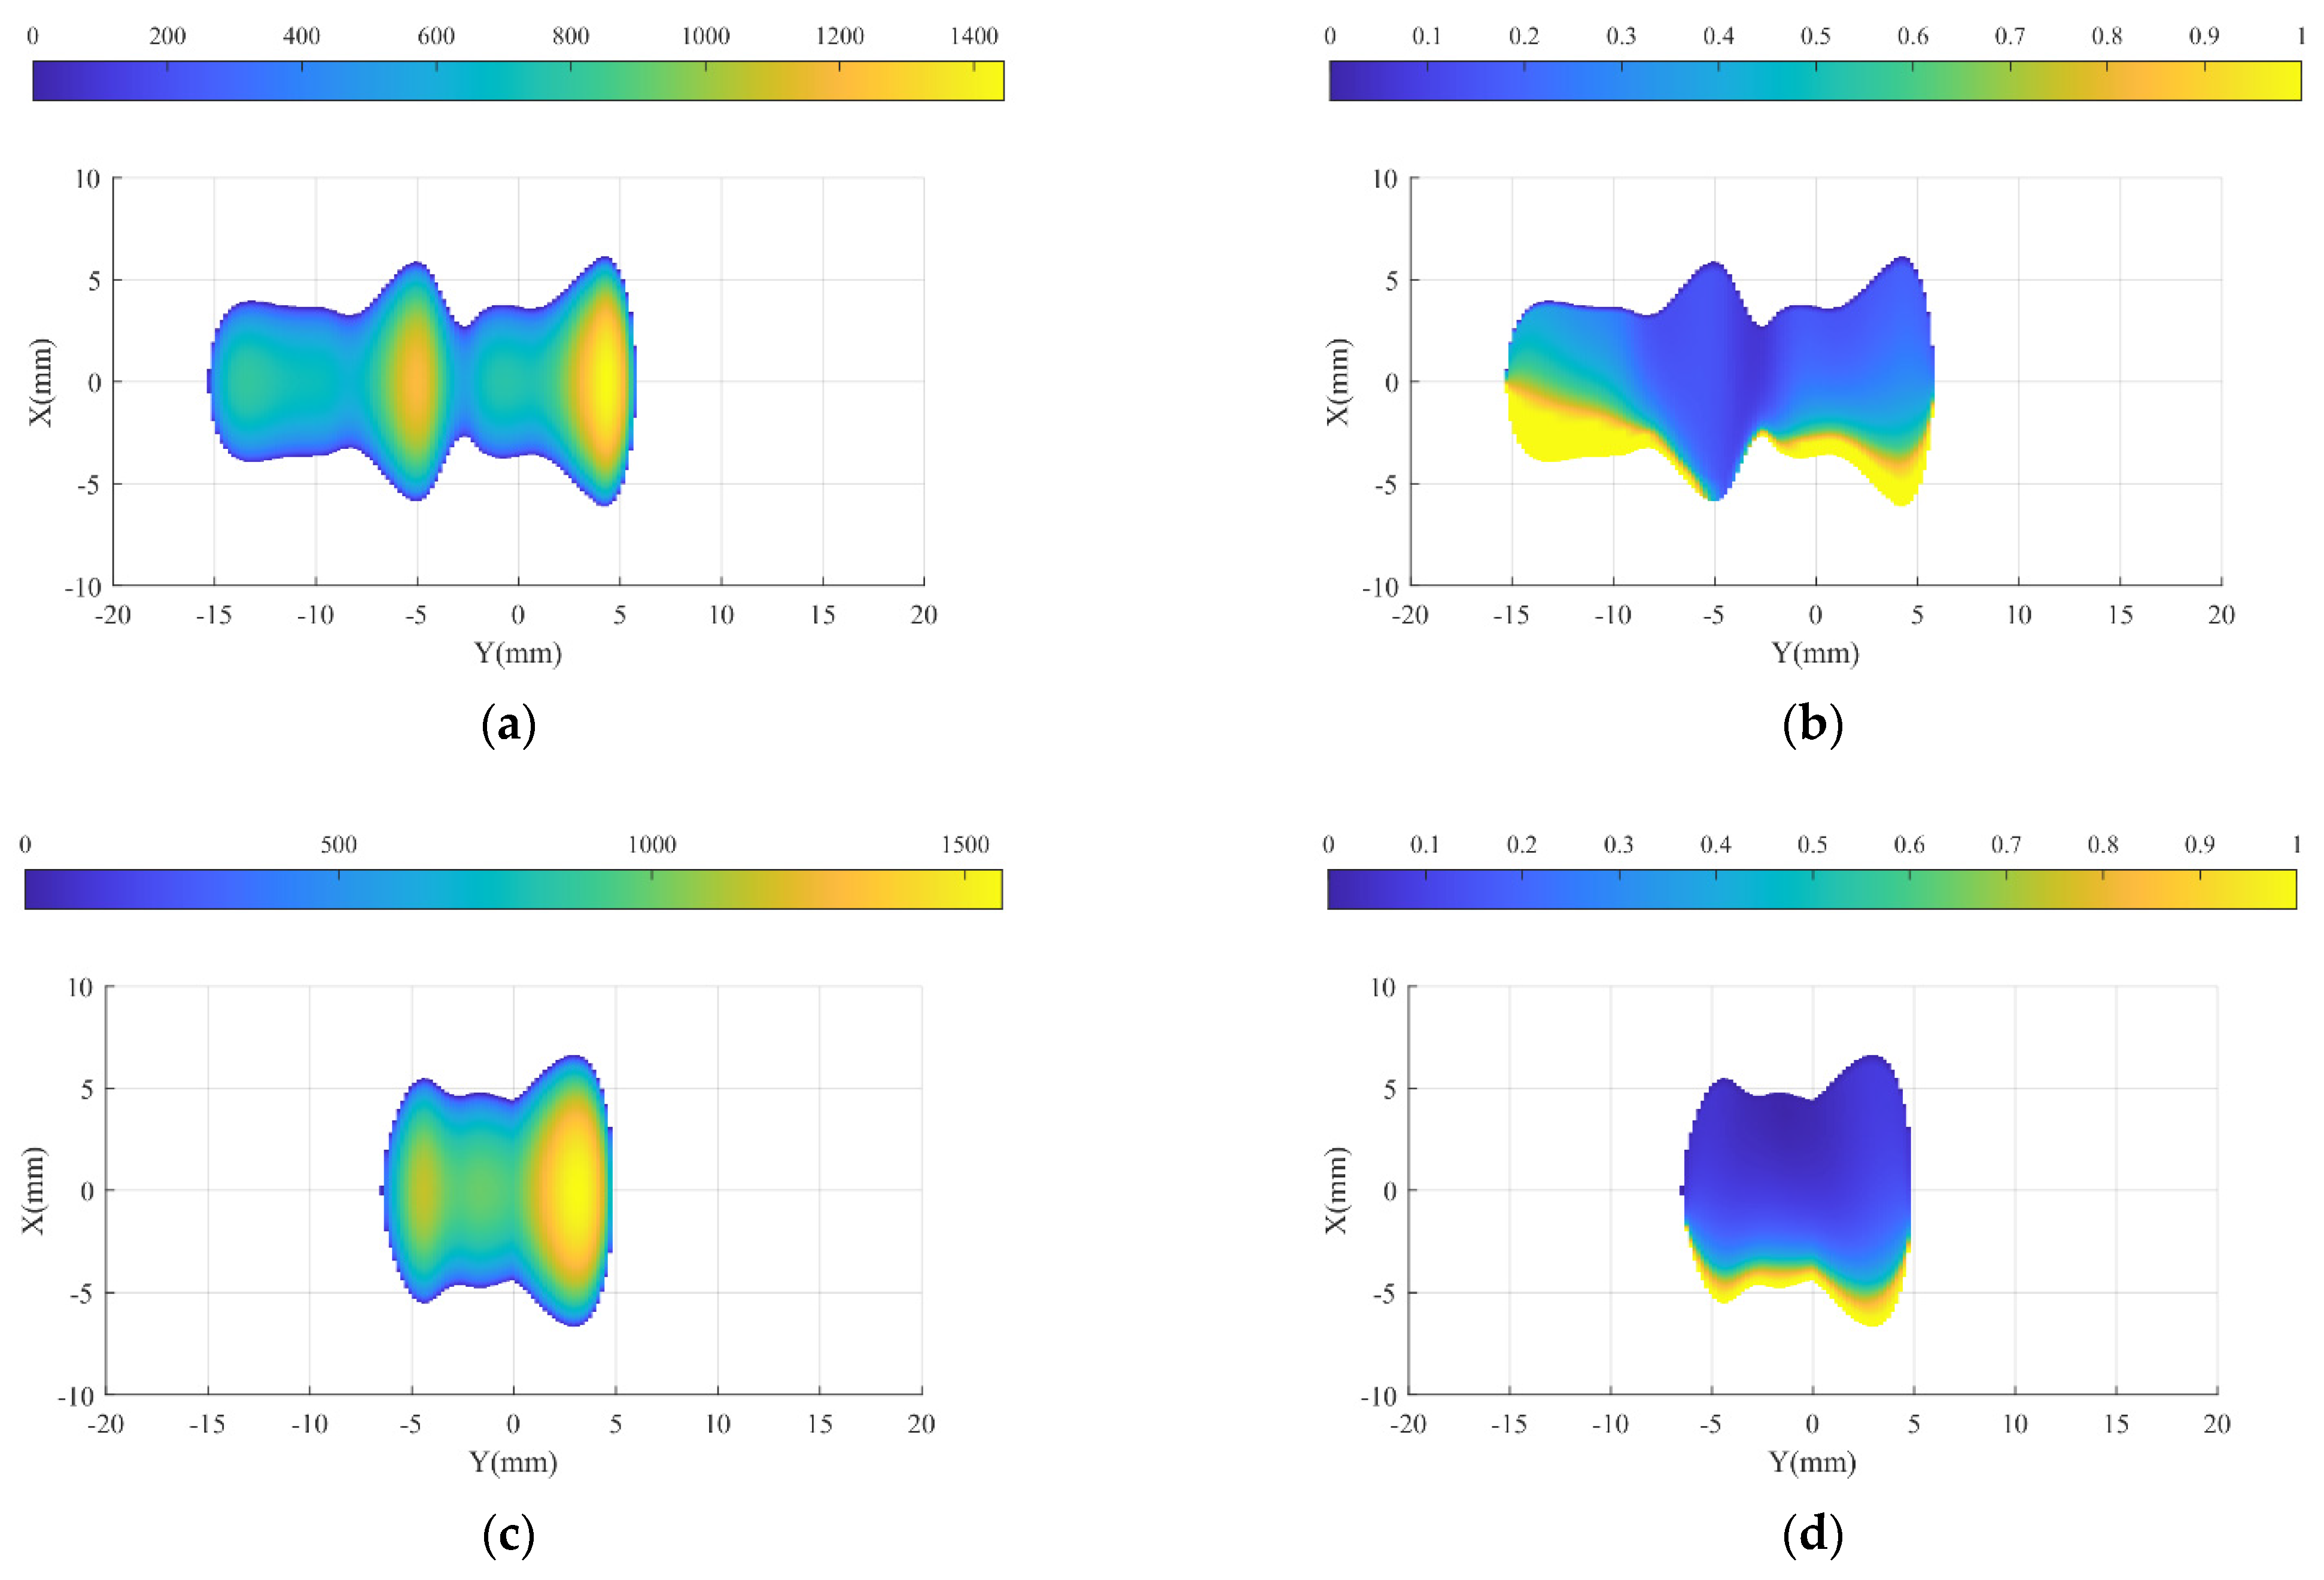
4.3.1. Straight Line
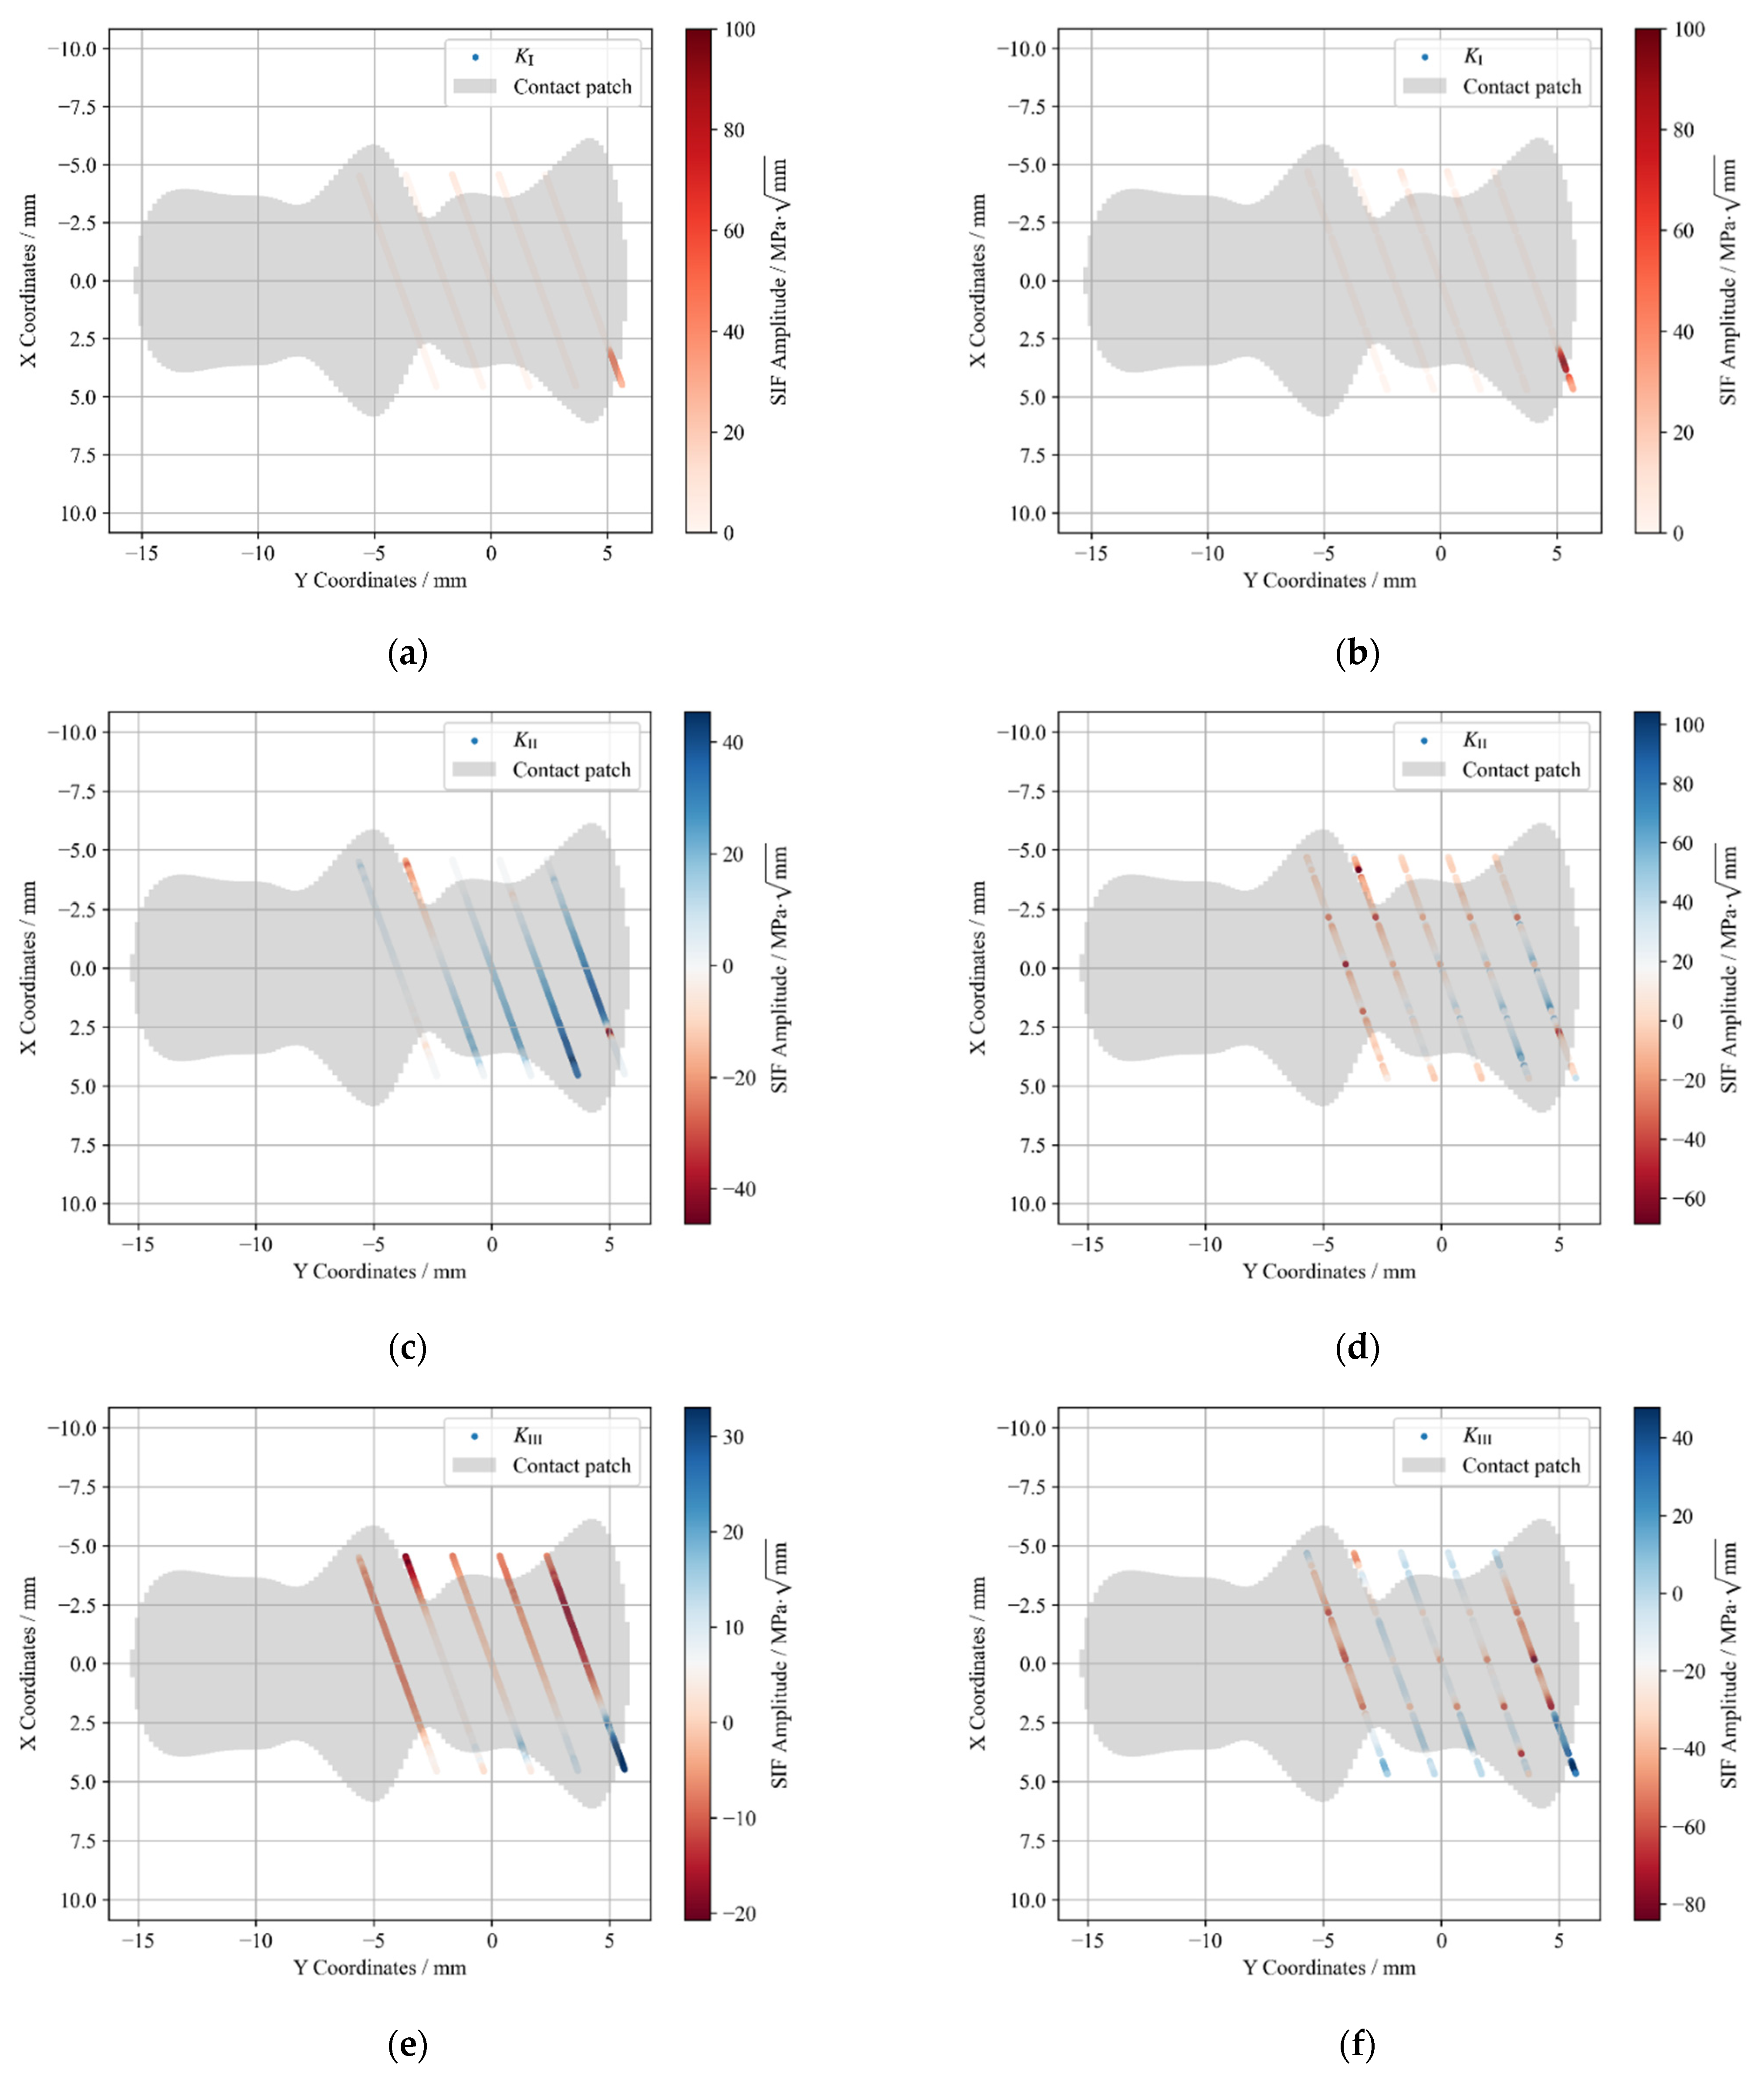
4.3.2. Transition Curve
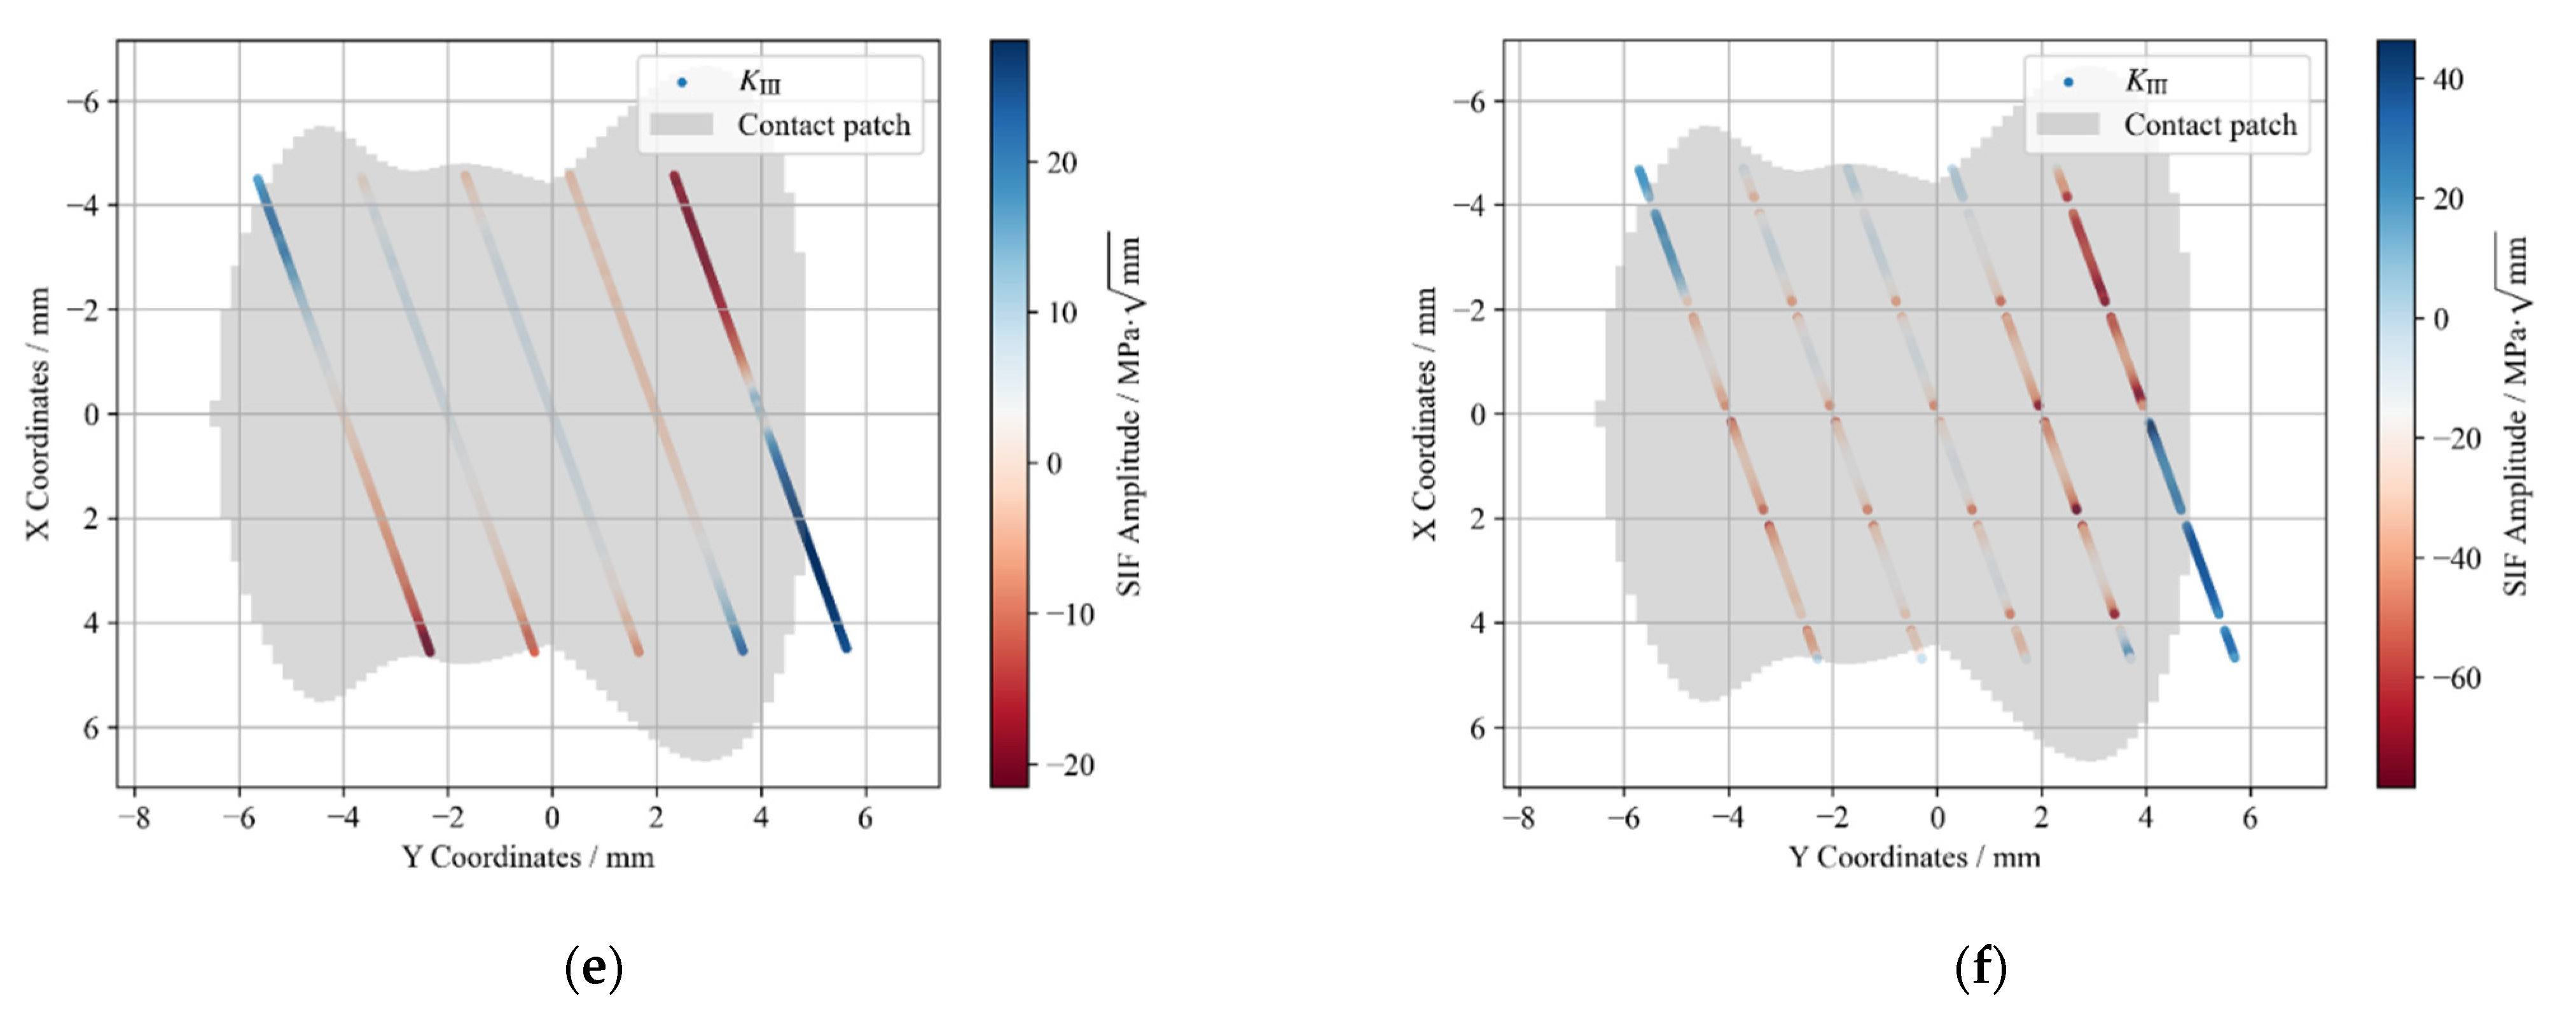
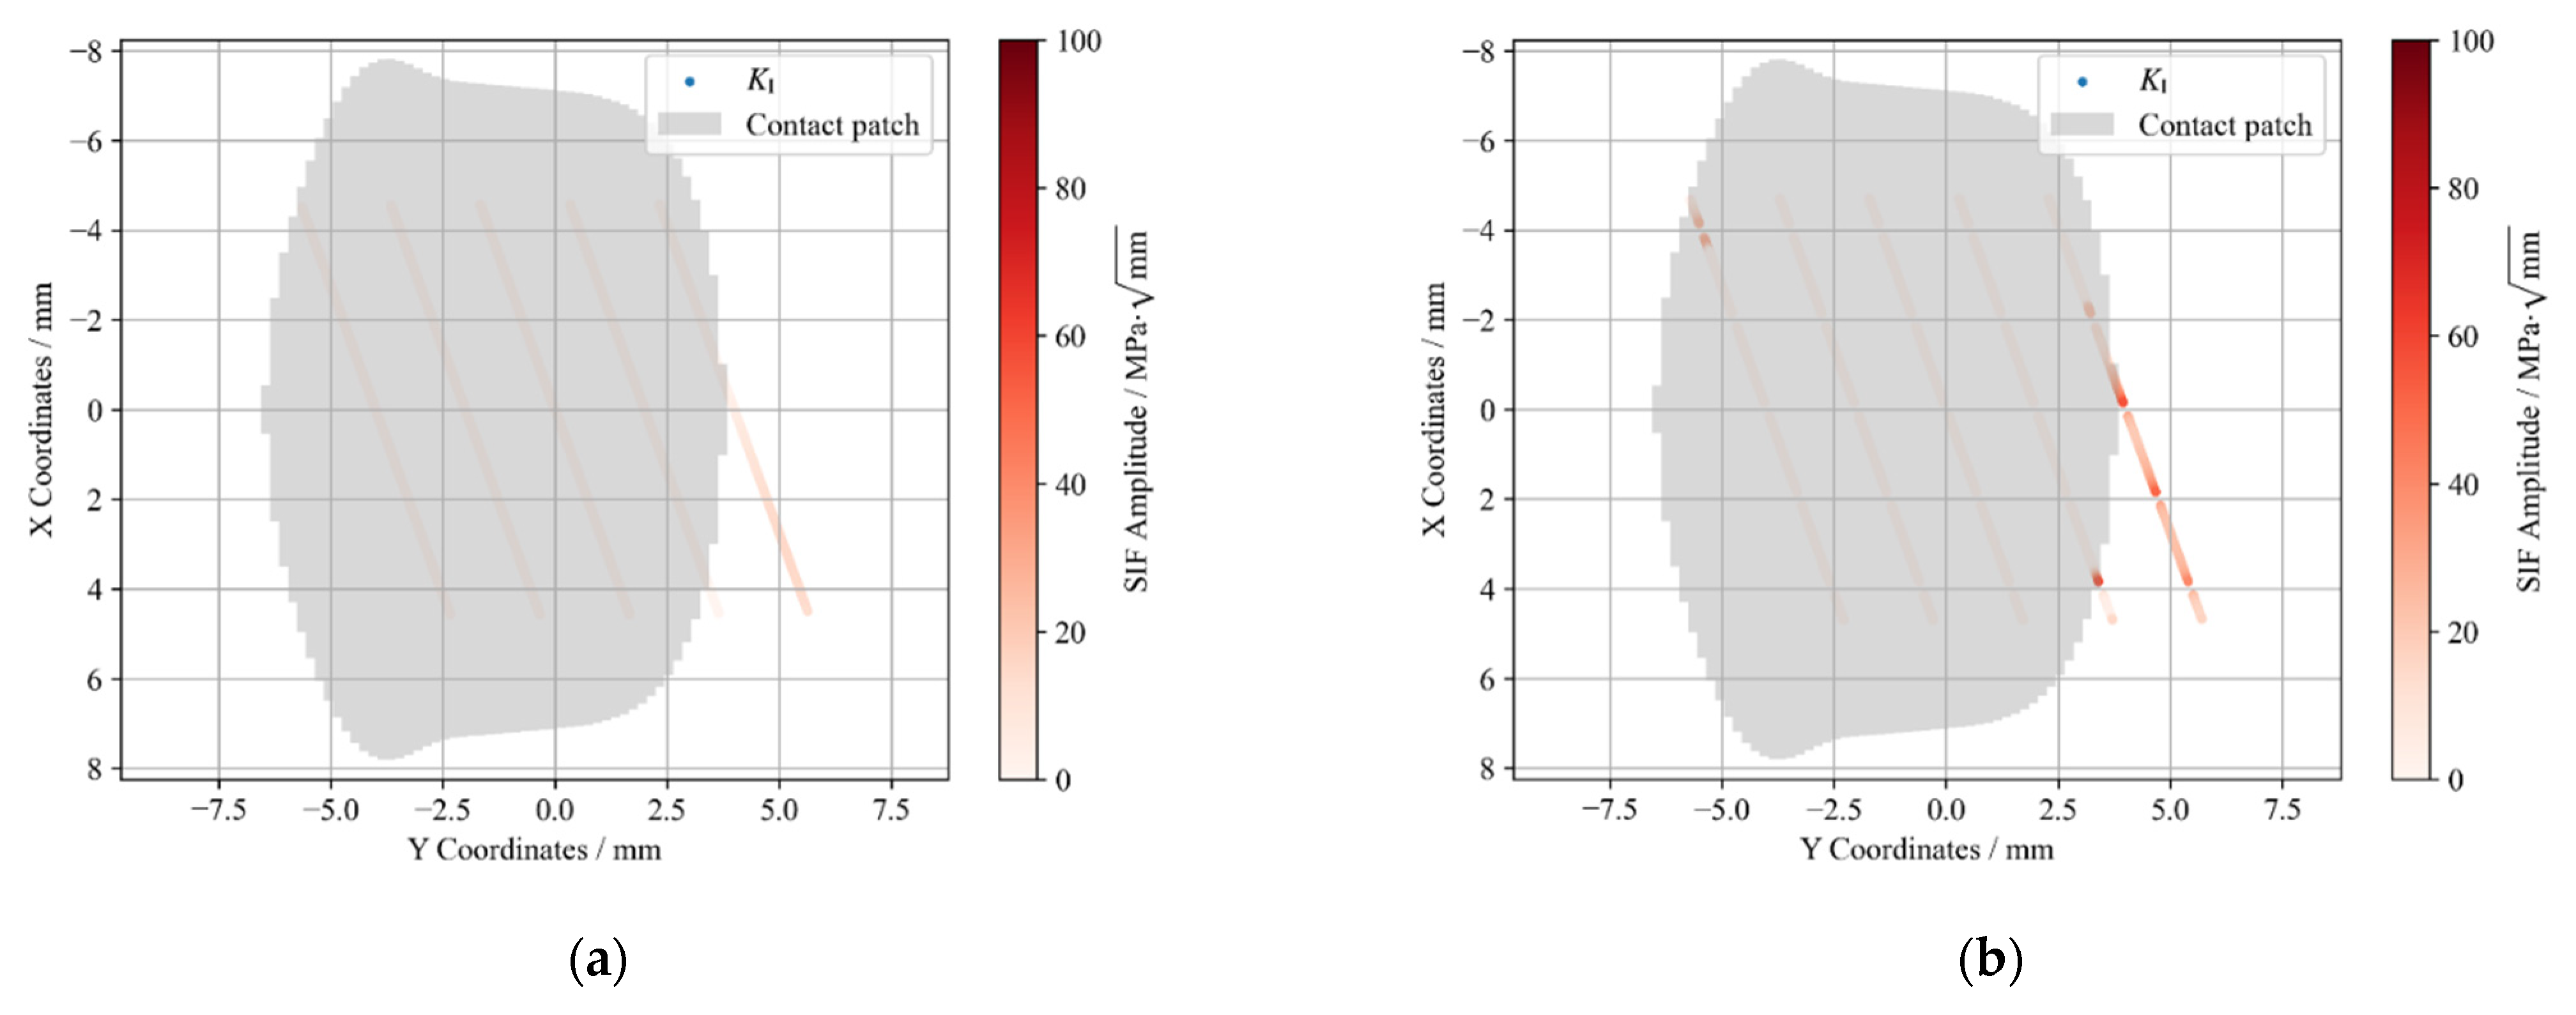
4.3.3. Circular Curve
5. Conclusions
- 1.
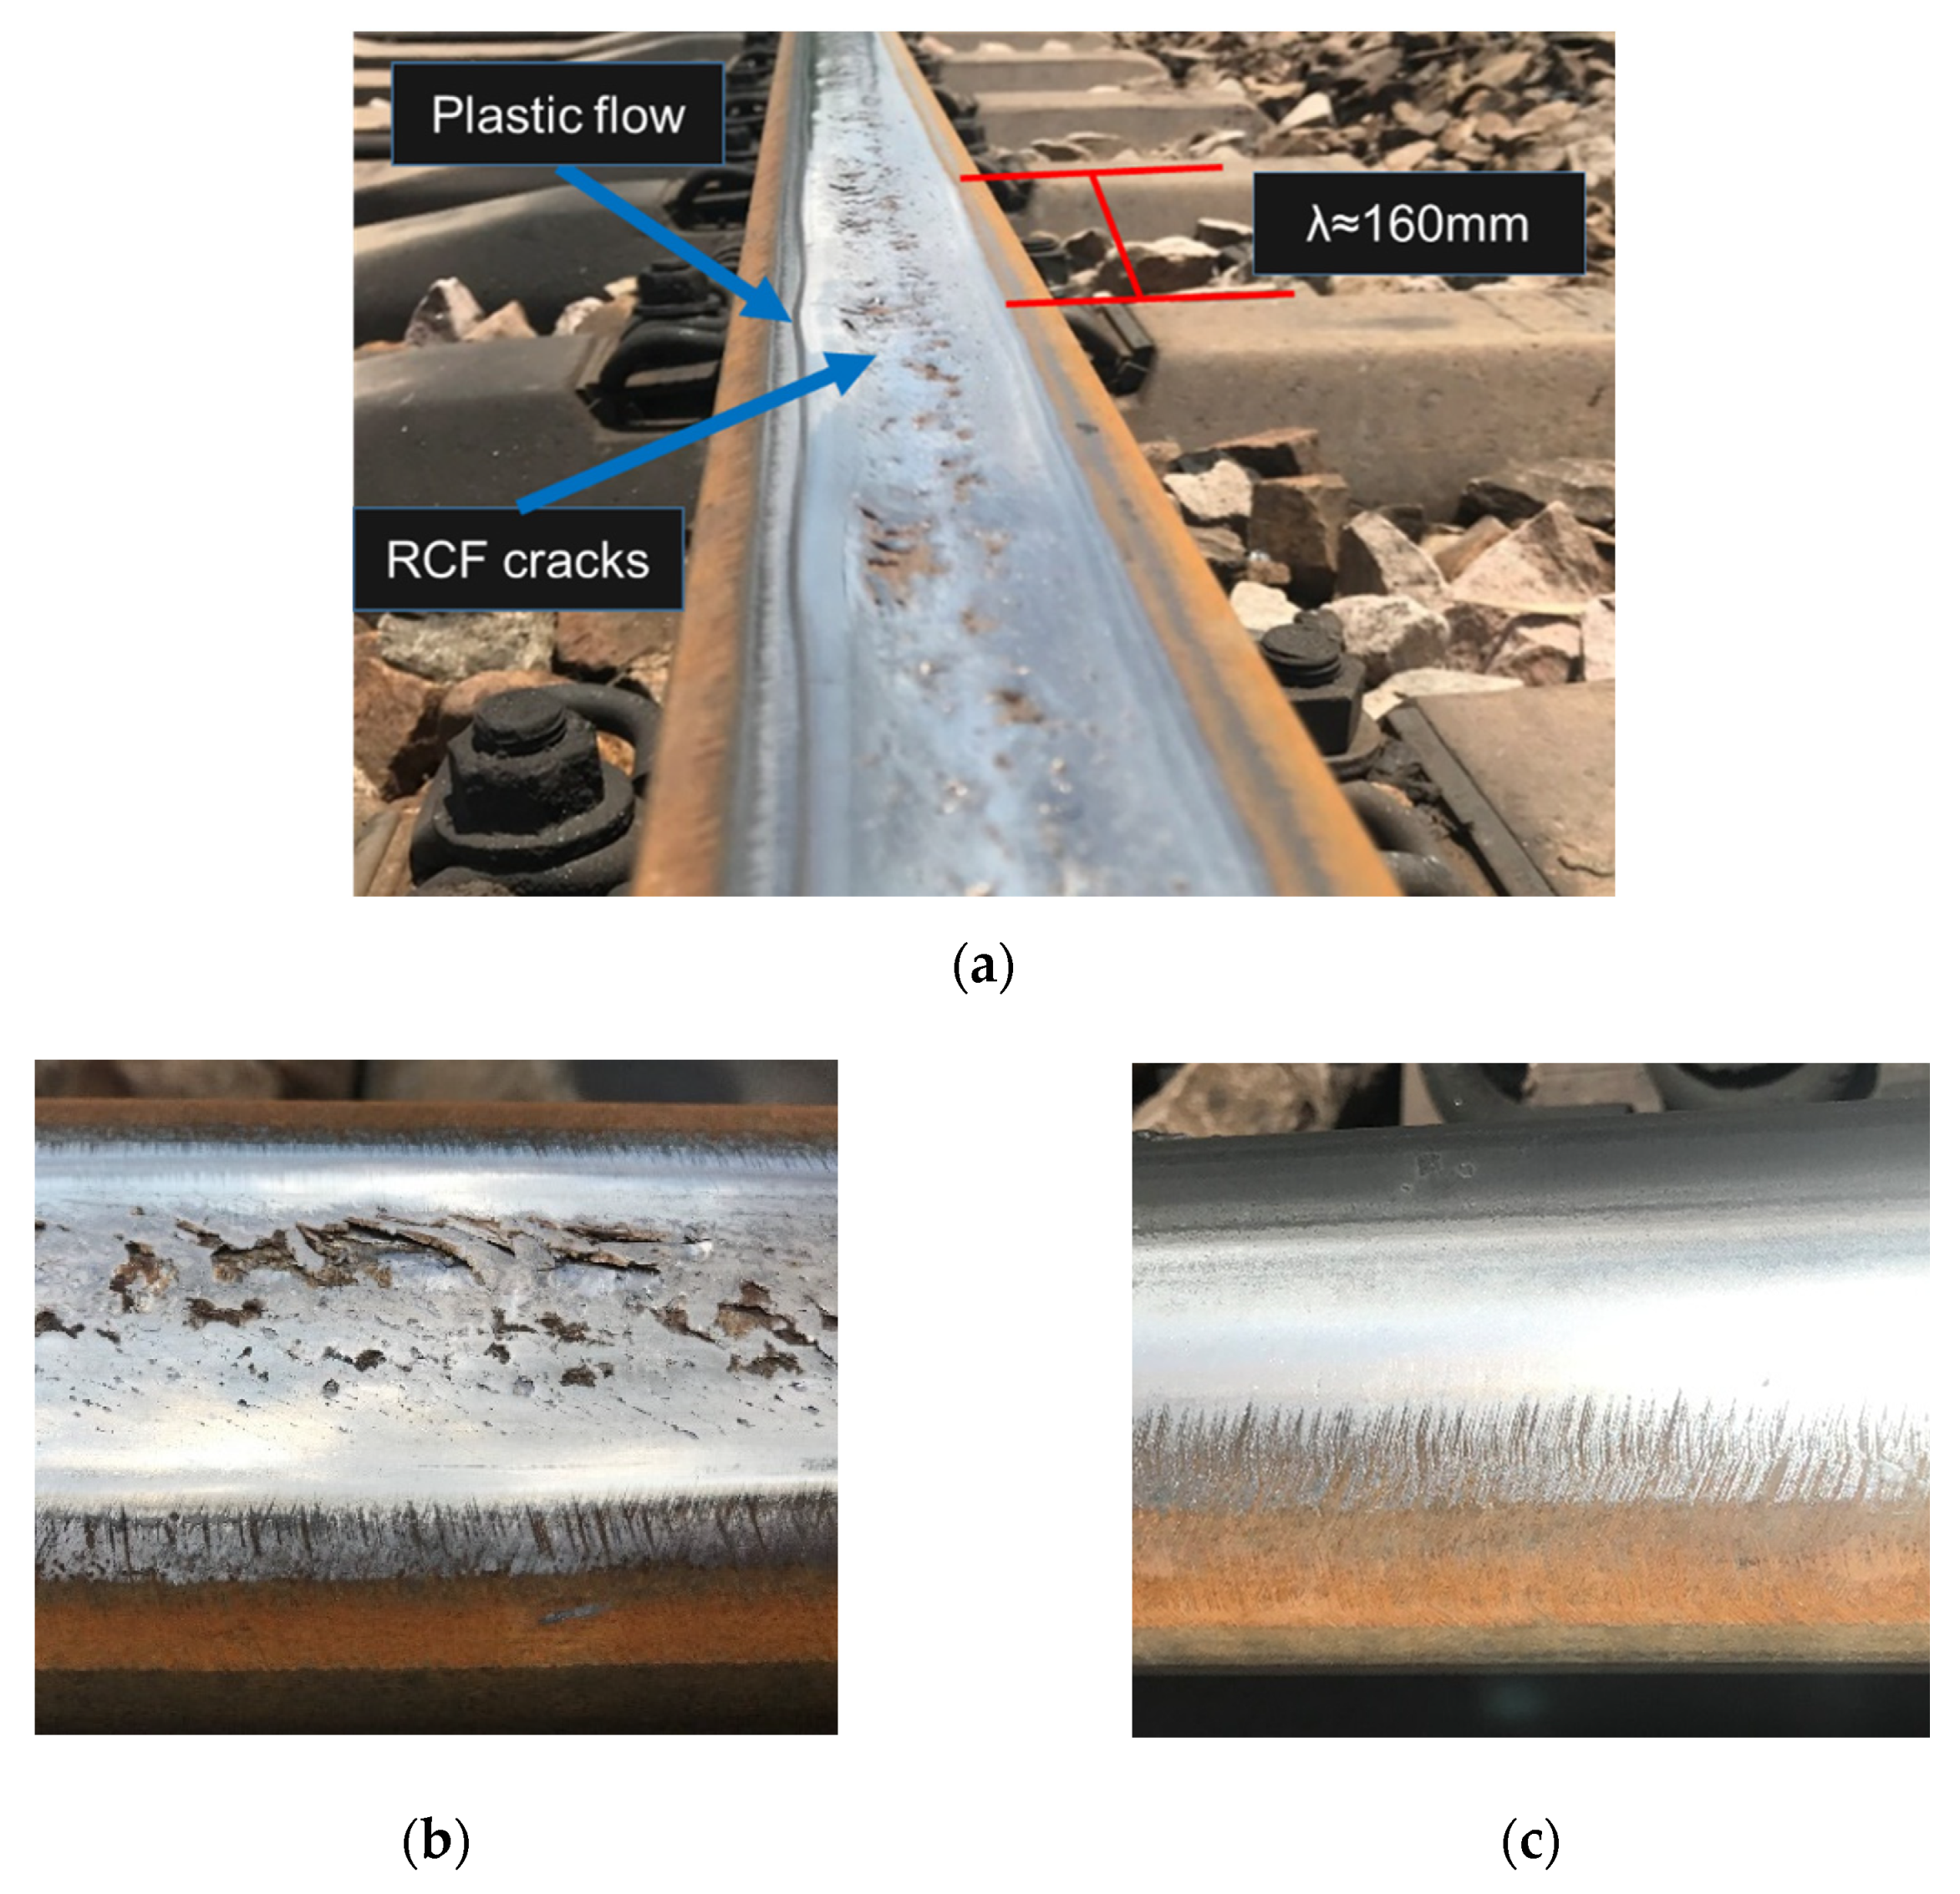
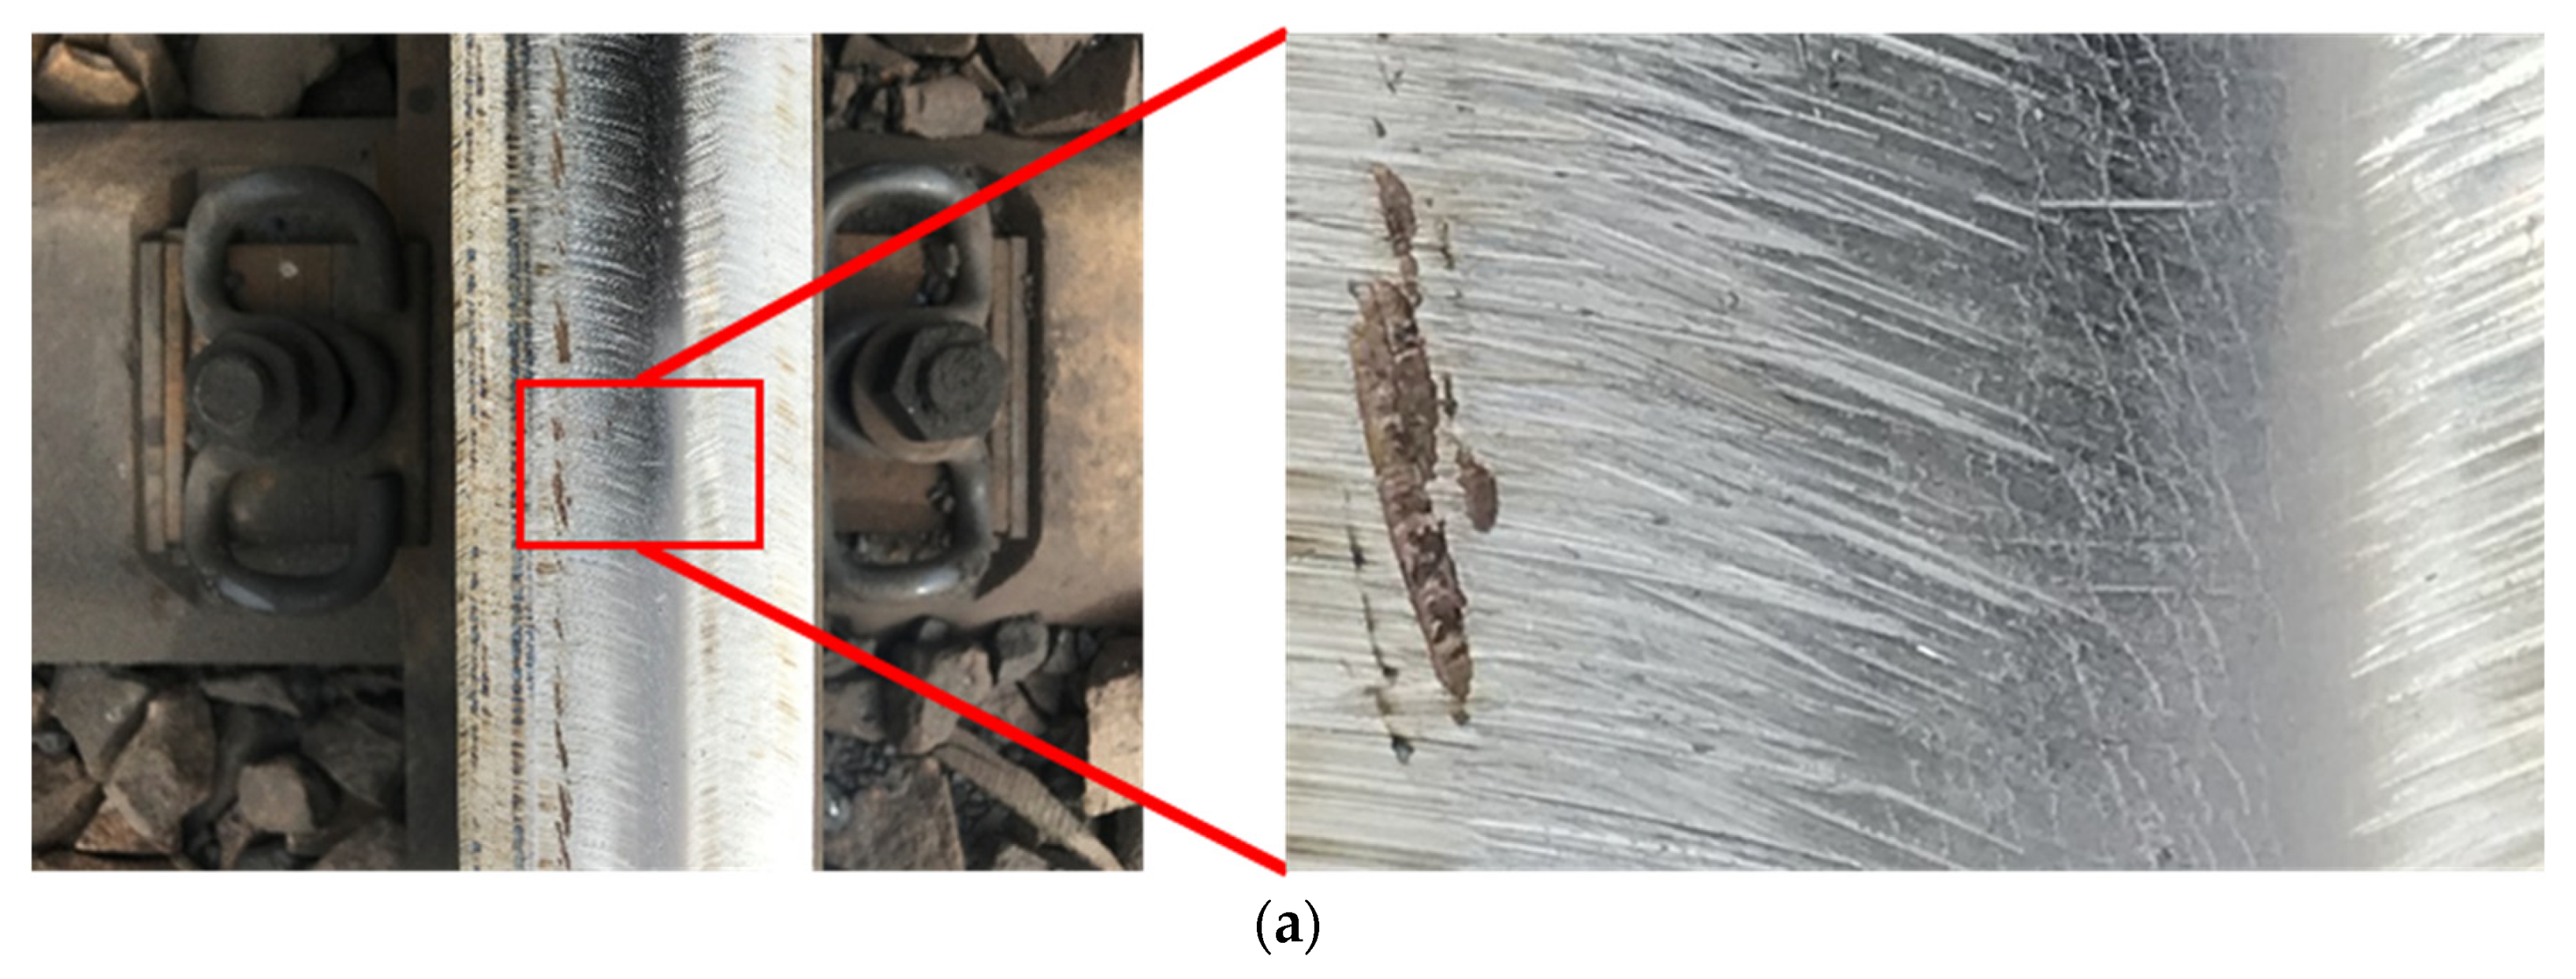
- The measured data show that the on-site rail corrugation has a significant plastic flow pattern and RCF cracks on the railhead. At the end of the field test, the maximum amplitude reached 350 μm, with the main wavelength around 160 mm.
- 2.
- After grinding, the trend in corrugation amplitude growth is moderate for a period of time. The residual surface grinding marks caused by a poor grinding process accelerate the evolution of corrugation so that the deterioration process can progress rapidly. During this process, the average peak-to-peak values can increase up to 1.4 μm/day.
- 3.
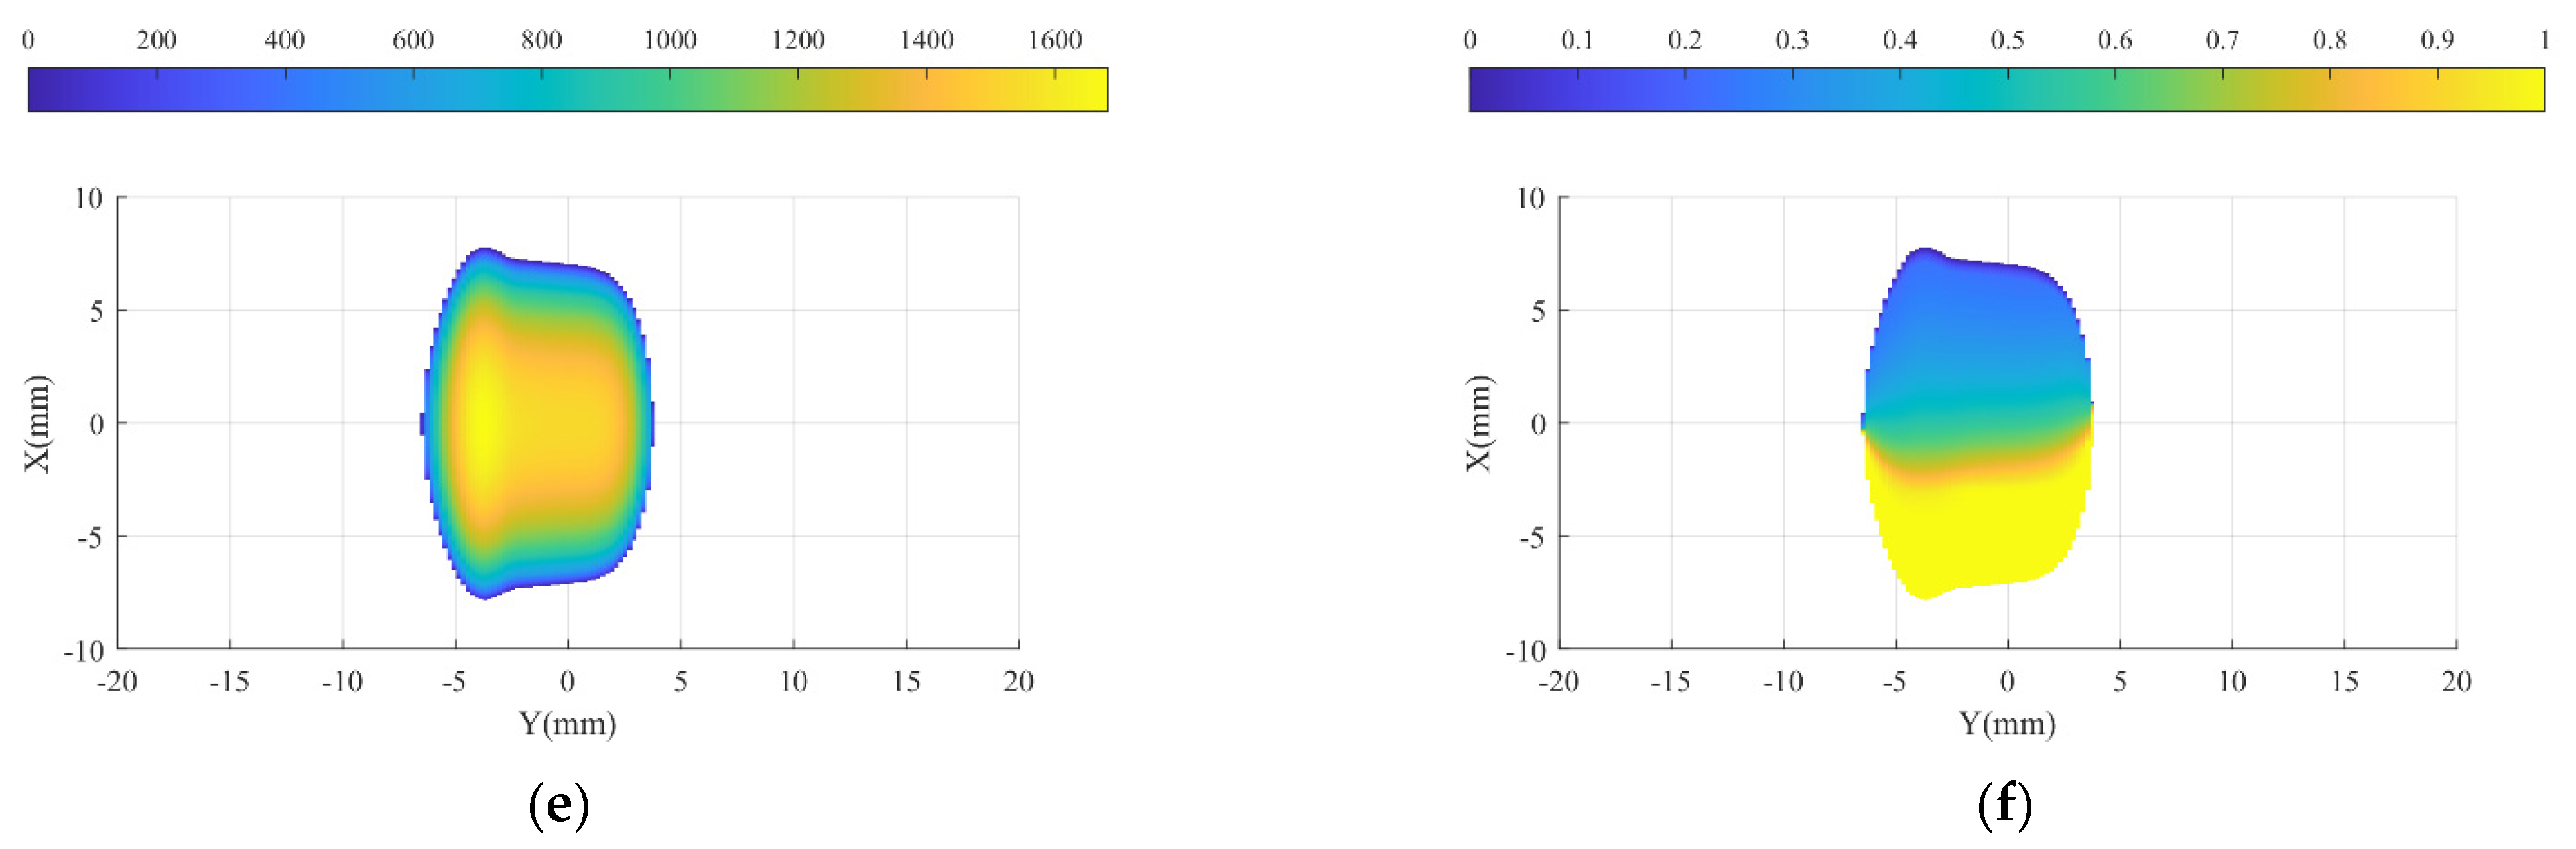
- In the circular curve section, rail surface cracks tended to expand more easily compared to those in the straight line and transition sections. A higher SIFs value appear in the intersectional area between grinding marks and cracks. Grinding marks from poor grinding works will increase the SIFs of cracks, promote the rapid expansion of surface cracks, reduce the plastic resistance of contact area of rails indirectly, and result in the rapid development of plastic flow corrugation.
Author Contributions
Funding
Conflicts of Interest
References
- Oostermeijer, K.H. Review on Short Pitch Rail Corrugation Studies. Wear 2008, 265, 1231–1237. [Google Scholar] [CrossRef]
- Jiang, Z.; Si, D.; Li, W.; Du, X. On Rail Corrugation of High Speed Railway. China Railw. Sci. 2014, 35, 9–14. [Google Scholar]
- Li, W.; Du, X.; Wang, H.; Wu, L.; Li, X.; Wen, Z.; Jin, X. Investigation into the Mechanism of Type of Rail Corrugation of Metro. Jixie Gongcheng Xuebao J. Mech. Eng. 2013, 49, 26–32. [Google Scholar] [CrossRef]
- Jin, X.; Wen, Z.; Wang, K. Theoretical Medel and Numerical Method of Rail Corrugation. J. Traffic Transp. Eng. 2005, 5, 12–18. [Google Scholar]
- Wang, K.; Liu, P.; Zhai, W.; Huang, C.; Chen, Z.; Gao, J. Wheel/rail dynamic interaction due to excitation of rail corrugation in high-speed railway. Sci. China Technol. Sci. 2015, 58, 226–235. [Google Scholar] [CrossRef]
- Xiao, H.; Yang, S.; Wang, H.; Wu, S.X. Initiation and Development of Rail Corrugation Based on Track Vibration in Metro Systems. Proc. Inst. Mech. Eng. Part F J. Rail Rapid Transit 2018, 232, 2228–2243. [Google Scholar] [CrossRef]
- Ekberg, A.; Kabo, E.; Nielsen, J.C.O.; Lundén, R. Subsurface Initiated Rolling Contact Fatigue of Railway Wheels as Generated by Rail Corrugation. Int. J. Solids Struct. 2007, 44, 7975–7987. [Google Scholar] [CrossRef] [Green Version]
- Grassie, S.L.; Kalousek, J. Rail Corrugation: Characteristics, Causes and Treatments. Proc. Inst. Mech. Eng. Part F J. Rail. Rapid Transit 1993, 207, 57–68. [Google Scholar] [CrossRef]
- Grassie, S.L. Rail Irregularities, Corrugation and Acoustic Roughness: Characteristics, Significance and Effects of Reprofiling. Proc. Inst. Mech. Eng. Part F J. Rail Rapid Transit 2012, 226, 542–557. [Google Scholar] [CrossRef]
- Meehan, P.A.; Batten, R.D.; Bellette, P.A. The Effect of Non-Uniform Train Speed Distribution on Rail Corrugation Growth in Curves/Corners. Wear 2016, 366–367, 27–37. [Google Scholar] [CrossRef] [Green Version]
- Meehan, P.A.; Bellette, P.A.; Batten, R.D.; Daniel, W.J.T.; Horwood, R.J. A Case Study of Wear-Type Rail Corrugation Prediction and Control Using Speed Variation. J. Sound Vib. 2009, 325, 85–105. [Google Scholar] [CrossRef]
- Jin, X.S.; Wen, Z.F. Effect of Discrete Track Support by Sleepers on Rail Corrugation at a Curved Track. J. Sound Vib. 2008, 315, 279–300. [Google Scholar] [CrossRef]
- Jin, X.; Wen, Z.; Wang, K.; Xiao, X. Effect of Passenger Car Curving on Rail Corrugation at a Curved Track. Wear 2006, 260, 619–633. [Google Scholar] [CrossRef]
- Matsumoto, A.; Sato, Y.; Ono, H.; Tanimoto, M.; Oka, Y.; Miyauchi, E. Formation Mechanism and Countermeasures of Rail Corrugation on Curved Track. Wear 2002, 253, 178–184. [Google Scholar] [CrossRef]
- Torstensson, P.T.; Schilke, M. Rail Corrugation Growth on Small Radius Curves—Measurements and Validation of a Numerical Prediction Model. Wear 2013, 303, 381–396. [Google Scholar] [CrossRef]
- Teng, Y.; Liu, H.; Liu, J.; Wang, C.; Ma, Z. A Rail Corrugation Measurement Method Based on Data Splicing. Measurement 2020, 156, 107560. [Google Scholar] [CrossRef]
- Egana, J.I.; Vinolas, J.; Gil-Negrete, N. Effect of Liquid High Positive Friction (HPF) Modifier on Wheel-Rail Contact and Rail Corrugation. Tribol. Int. 2005, 38, 769–774. [Google Scholar] [CrossRef]
- Daniel, W.J.T.; Cheng, C.Y.; Meehan, P.A. Modelling the Effects of Friction Modifiers on Rail Corrugation in Cornering. Veh. Syst. Dyn. 2008, 46, 845–866. [Google Scholar] [CrossRef]
- Zhang, H.; Liu, W.; Liu, W.; Wu, Z. Study on the Cause and Treatment of Rail Corrugation for Beijing Metro. Wear 2014, 317, 120–128. [Google Scholar] [CrossRef]
- Liu, W.; Zhang, H.; Liu, W.; Thompson, D.J. Experimental Study of the Treatment Measures for Rail Corrugation on Tracks with Egg Fasteners in the Beijing Metro. Proc. Inst. Mech. Eng. Part F J. Rail Rapid Transit 2018, 232, 1360–1374. [Google Scholar] [CrossRef] [Green Version]
- Xin, T.; Wang, S.; Gao, L.; Huo, H.; Ding, Y.; Wang, P.; Chen, P.; Liu, P. Field Measurement of Rail Corrugation Influence on Environmental Noise and Vibration: A Case Study in China. Measurement 2020, 164, 108084. [Google Scholar] [CrossRef]
- Satoh, Y.; Iwafuchi, K. Effect of Rail Grinding on Rolling Contact Fatigue in Railway Rail Used in Conventional Line in Japan. Wear 2008, 265, 1342–1348. [Google Scholar] [CrossRef]
- Ishida, M.; Abe, N.; Moto, T. The Effect of Preventive Grinding on Rail Surface Shellings. Railw. Tech. Res. Inst. Q. Rep. 1998, 39, 136–141. [Google Scholar]
- Asplund, M.; Famurewa, S.M.; Schoech, W. A Nordic Heavy Haul Experience and Best Practices. Proc. Inst. Mech. Eng. Part F J. Rail Rapid Transit 2017, 231, 794–804. [Google Scholar] [CrossRef]
- EN 15610:2009. Railway Applications-Noise Emission-Rail Roughness Measurement Related to Rolling Noise Generation; BSI-British Standards Institution: London, UK, 2009. [Google Scholar]
- EN 13231-3. 2012 Railway Application—Track Acceptance of Works—Part 3: Acceptance of Rail Grinding, Milling and Planning Work in Track; BSI-British Standards Institution: London, UK, 2012. [Google Scholar]
- Management Measures for Grinding of High Speed Railway; China State Railway Group Co., Ltd.: Beijing, China, 2014.
- EN ISO 3095:2013. Acoustics-Railway Applcations-Measurement of Noise Emitted by Railbound Vehicles; BSI-British Standards Institution: London, UK, 2013. [Google Scholar]
- GB/T 3449-2011. Acoustics-Mearsurement of Noise inside Railbound Vehicles; Standards Press of China: Beijing, China, 2011. [Google Scholar]
- Bower, A.F. Cyclic Hardening Properties of Hard-Drawn Copper and Rail Steel. J. Mech. Phys. Solids 1989, 37, 455–470. [Google Scholar] [CrossRef]
- Ayasse, J.B.; Chollet, H. Determination of the Wheel Rail Contact Patch in Semi-Hertzian Conditions. Veh. Syst. Dyn. 2005, 43, 161–172. [Google Scholar] [CrossRef]
- Quost, X.; Sebes, M.; Eddhahak, A.; Ayasse, J.B.; Chollet, H.; Gautier, P.E.; Thouverez, F. Assessment of a Semi-Hertzian Method for Determination of Wheel-Rail Contact Patch. Veh. Syst. Dyn. 2006, 44, 789–814. [Google Scholar] [CrossRef]


| Types | Parameters |
|---|---|
| Ambient temperature | −25.5 °C to 39.4 °C |
| Rail temperature | −25.5–59.4 °C |
| Radius | 400 m |
| Total length of curve | 414.54 m |
| Length of transition curve | 100 m |
| Cant | 1/40 |
| Gradient | 7‰ |
| Sleeper type | Type III |
| Superelevation | 105 mm |
| Average of vehicle speed | 50 km/h |
| Wavelength/mm | 10–30 | 30–100 | 100–300 | 300–1000 |
|---|---|---|---|---|
| Window/mm | 150 | 500 | 1500 | 5000 |
| Peak-to-peak limit/μm | 10 | 10 | 15 | 75 |
| Allowable percentage/% | - | 10 | 10 | - |
| Types | Parameters |
|---|---|
| Vehicle type | C80 |
| Axle load | 25 t |
| Distance between bogie centers | 8300 mm |
| Wheelbase | 1830 mm |
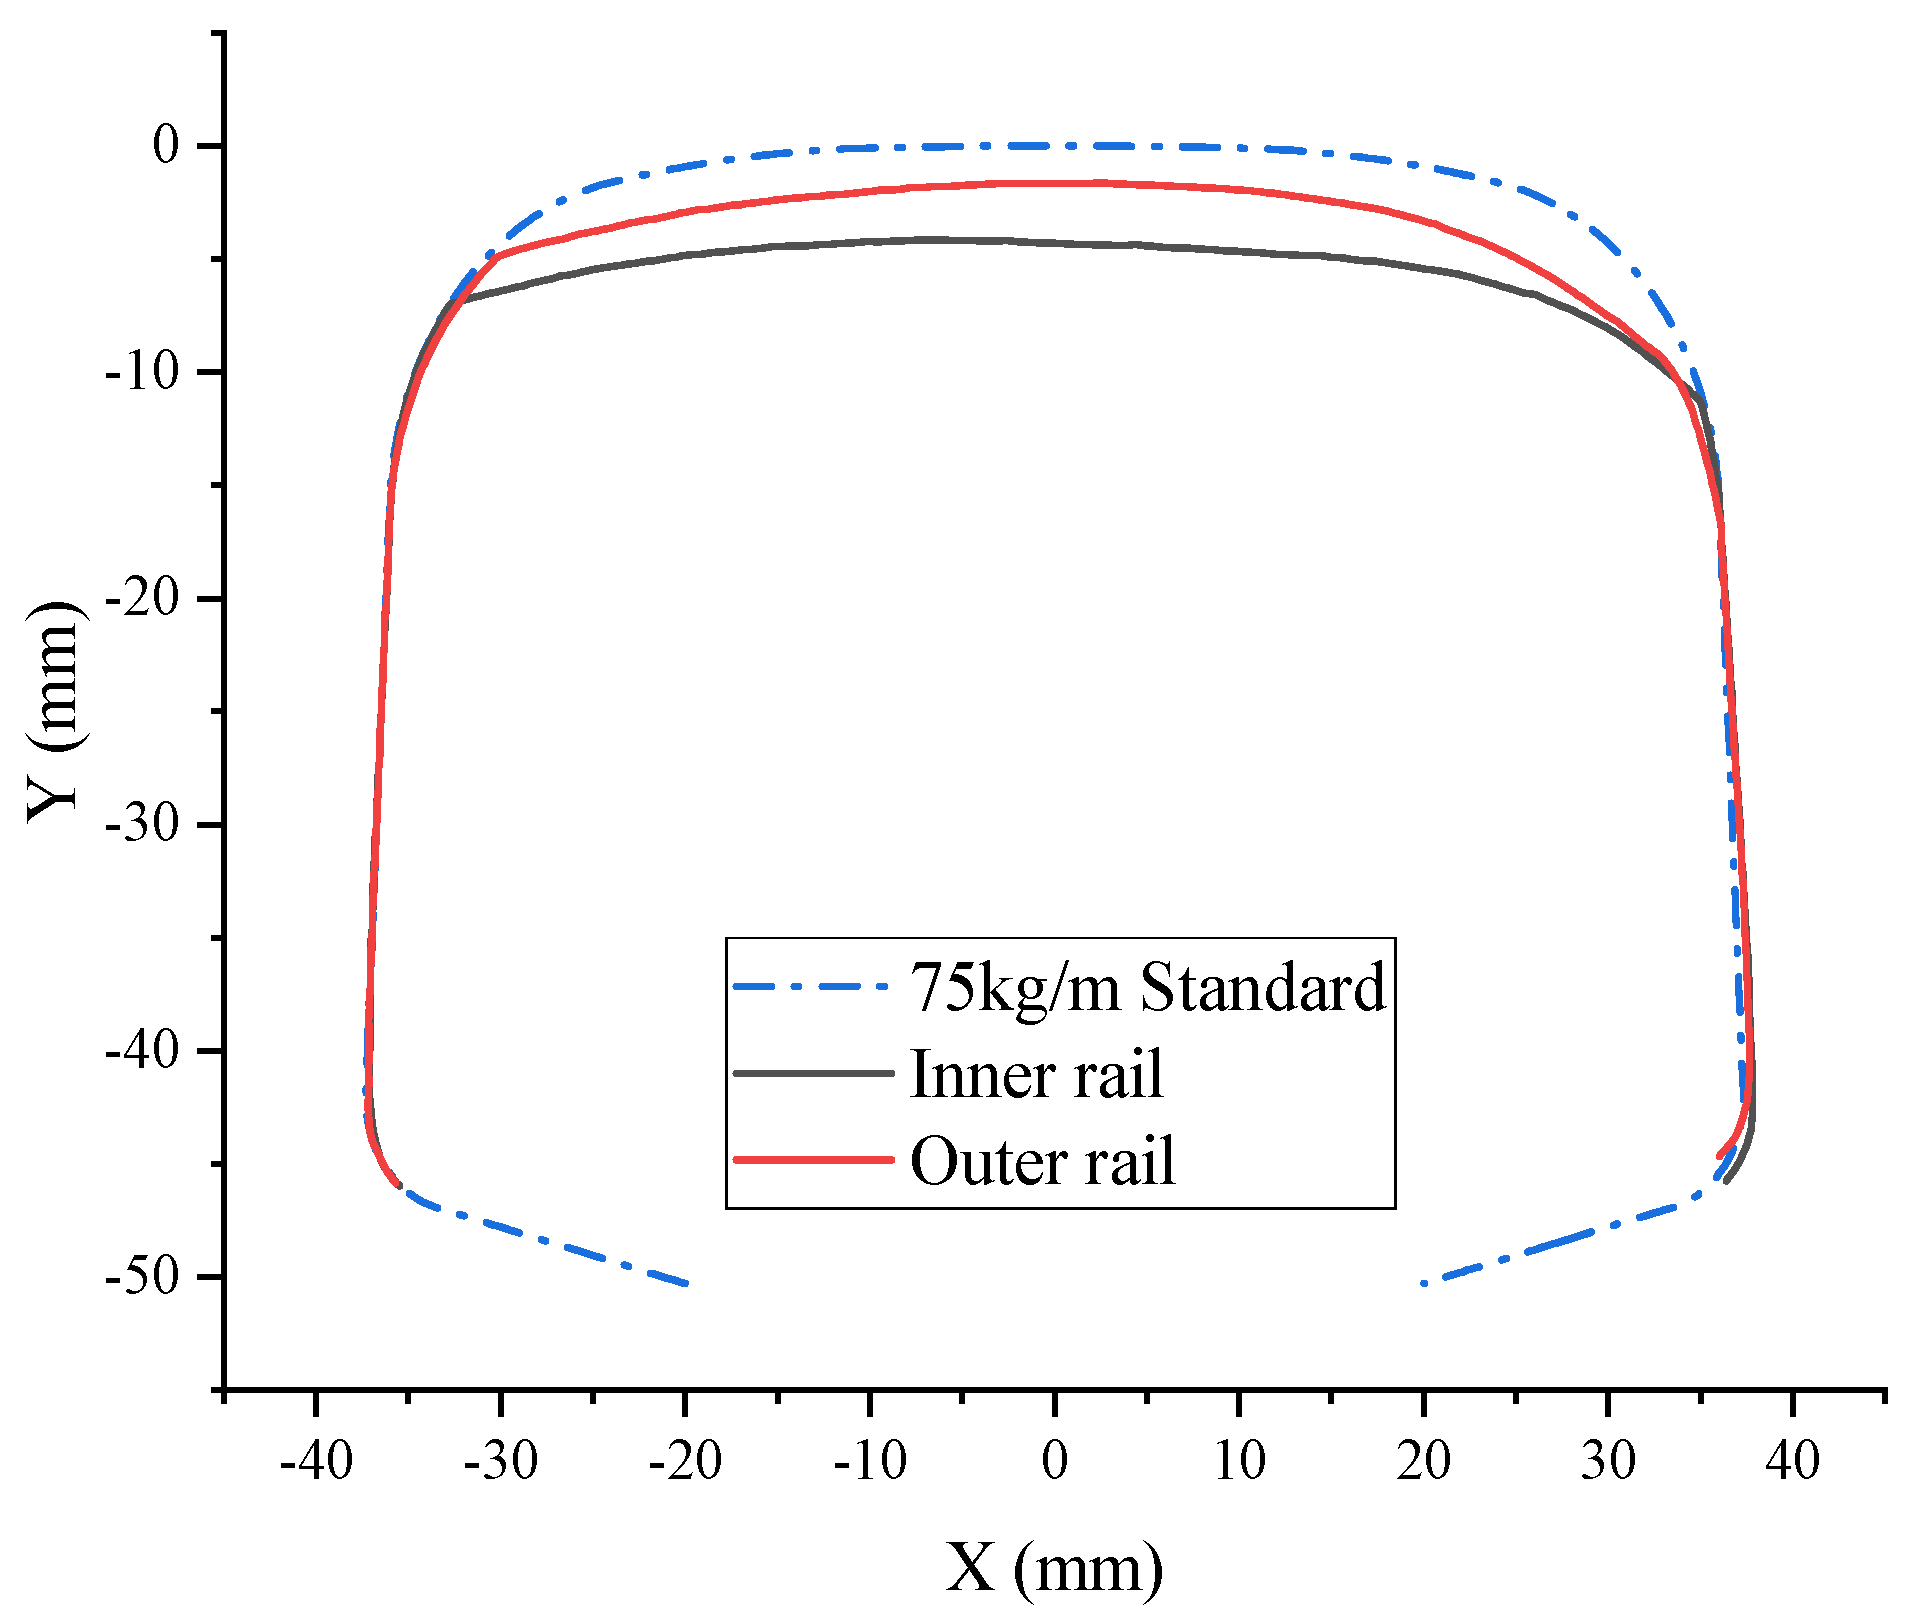
| Rail type | 75 kg/m |
| Elastic modulus of rail | 205.9 GPa |
| Wheel tread type | LM |
Publisher’s Note: MDPI stays neutral with regard to jurisdictional claims in published maps and institutional affiliations. |
© 2021 by the authors. Licensee MDPI, Basel, Switzerland. This article is an open access article distributed under the terms and conditions of the Creative Commons Attribution (CC BY) license (https://creativecommons.org/licenses/by/4.0/).
Share and Cite
Jin, F.; Xiao, H.; Nadakatti, M.M.; Yue, H.; Liu, W. Field Investigation and Rapid Deterioration Analysis of Heavy Haul Corrugation. Appl. Sci. 2021, 11, 6317. https://doi.org/10.3390/app11146317
Jin F, Xiao H, Nadakatti MM, Yue H, Liu W. Field Investigation and Rapid Deterioration Analysis of Heavy Haul Corrugation. Applied Sciences. 2021; 11(14):6317. https://doi.org/10.3390/app11146317
Chicago/Turabian StyleJin, Feng, Hong Xiao, Mahantesh M Nadakatti, Huiting Yue, and Wanting Liu. 2021. "Field Investigation and Rapid Deterioration Analysis of Heavy Haul Corrugation" Applied Sciences 11, no. 14: 6317. https://doi.org/10.3390/app11146317
APA StyleJin, F., Xiao, H., Nadakatti, M. M., Yue, H., & Liu, W. (2021). Field Investigation and Rapid Deterioration Analysis of Heavy Haul Corrugation. Applied Sciences, 11(14), 6317. https://doi.org/10.3390/app11146317