Article

Optimization of Electric Field Assisted Mining Process Applied to Rare Earths in Soils

by
Carolina M. G. Pires
1,2,*,
Jucélio T. Pereira
3,
Alexandra B. Ribeiro
2,*,
Haroldo A. Ponte
4 and
Maria José J. S. Ponte
5
1
Laboratory of Environmental Technology (LTA), Federal University of Parana, Curitiba 81530-000, Brazil
2
CENSE—Center for Environmental and Sustainability Research, Department of Environmental Sciences and Engineering, NOVA School of Science and Technology, NOVA University Lisbon, 2829-516 Caparica, Portugal
3
Department of Mechanical Engineering, Computational Solid Mechanics Laboratory (LASCOM), Federal University of Parana, Curitiba 81530-000, Brazil
4
Laboratory of Environmental Technology (LTA), Department of Chemical Engineering, Federal University of Parana, Curitiba 81530-000, Brazil
5
Laboratory of Environmental Technology (LTA), Department of Mechanical Engineering, Federal University of Parana, Curitiba 81530-000, Brazil
*
Authors to whom correspondence should be addressed.
Appl. Sci. 2021, 11(14), 6316; https://doi.org/10.3390/app11146316
Submission received: 22 June 2021 / Revised: 5 July 2021 / Accepted: 6 July 2021 / Published: 8 July 2021

Abstract

:
The extraction of rare earths has been studied worldwide, however some of these processes have a high cost and can cause negative environmental impacts. In order to mine these species from the soil, Electric Field Assisted Mining arises as an alternative to conventional mining processes. Therefore, the experimental parameters can be improved to obtain better results in the extraction of these species. The aim of this paper is to propose the optimization of the Electric Field Assisted Mining process of yttrium, to obtain the optimal experimental configuration to be applied in real soils. An optimization problem was defined to obtain the maximum extraction mass of yttrium ion (Y3+), considering the limitation for the quantity of electric current density. A hybrid optimization technique was used, based on the sequential application of genetic algorithms and non-linear programming. Different optimal process configurations were obtained, considering distinct limits for the electric current density. The best experimental configuration resulted in 0.5386 V cm−1 electric field strength and 0.10 mol L−1 electrolyte concentration. This condition was reproduced in real soil, which obtained a Y3+ electromining efficiency of 41.48%. The results showed that this technique is promising for the extraction of rare earth in real soils.

Graphical Abstract

1. Introduction

The rare earths elements (REE) form a group composed by the lanthanide series, as well as the elements yttrium and scandium. These species are distributed in the lithosphere, however some regions present higher concentrations of REE, including China, Brazil, Russia, India, and Australia [1,2,3,4].
REE are employed in several applications, such as permanent magnets, catalysts in the fluidized catalytic cracking process, automotive catalysts, ceramic materials, electronic components, lasers, and metallic alloys energy [4,5,6,7]. Additionally, the REE have an important role in the development of new technologies and in the production of clean renewable energy [5,8,9].
REE mining mainly occurs through hydrometallurgical processes, from minerals such as bastnaesite, monazite, and xenotime or through ion adsorption clays [10,11,12,13,14,15]. However, these mining processes may cause great negative environmental impacts, in addition to the high generation of wastewater and high energy expenditure from the separation and purification steps [16,17,18,19,20,21]. Another alternative for obtaining REE is from secondary resources, by the hydrometallurgical process of waste electric and electronic equipment [9,17,18]. Although this technique is efficient in removing species, the use of strong acids and the generation of non-biodegradable effluents result in an ecologically unfriendly method.
China is responsible for more than 95% of the global production of REE. This monopoly condition allowed the country to limit export quotas and raise the price of these commodities. These actions, combined with growth in the consumption of REE, resulted in the increase of the criticality of some REE [19,20,21,22,23].
Due to the possibility of interruption in the supply of REE and considering the elevated environmental impact of the hydrometallurgical processes, the search for new mining routes for these elements is essential. Thereby, the Electric Field Assisted Mining (EFAM), also known as electromining (EM), is presented as an innovative alternative for REE extraction.
The EFAM consists of the removal of the species in ionic form by the action of an electric field [19]. For this purpose, electrodes are inserted in soil that must be moistened with an ionic conductor fluid, the electrolyte [24,25,26,27]. Due to the action of an electric potential gradient, the ions migrate to the opposing charge electrode, allowing the extraction of the elements [28,29,30]. This technique is considered promising [19], as it allows the extraction of REE from soils using weak and biodegradable electrolytes. Another advantage is the low water consumption of the process. Furthermore, when applied in-situ, on a larger scale, the technique has advantages over conventional mining, as there are no excavation steps to remove the surface layers of soil. Therefore, the environmental impact for the extraction of REE via EFAM is reduced.
The extraction of yttrium ion (Y3+) from a spiked sandy soil using the EFAM technique was studied by Pires et al. [19]. Different experimental configurations were performed, evaluating the different electric field strengths and electrolyte concentrations. The authors used a biodegradable electrolyte acetic acid and obtained low values of dissipated electric current in the process. It was observed that the Y3+ extraction capacity is directly associated to the electric field applied to the system, which is the driving force to the mobility of this species. On the other hand, the increase in the electric field gradient resulted in the increase of the electric current, which contributed to the occurrence of undesired parallel reactions on the surface of the electrodes, such as water hydrolysis. In view of this problem, the aim of this paper is to apply optimization techniques to obtain the best electromining process configuration, presented by Pires et al. [19], intending to maximize the Y3+ mass extraction, considering a limited value for the electric current density in the process. Thus, from the optimal configuration obtained, the conditions were applied to a real soil containing yttrium.

2. Materials and Methods

Pires et al. [19] developed a methodology to remove Y3+ from soils applying the EFAM technique. They used a synthetic soil majorly composed of silicon oxide (SiO2—92.7%) that contained 0.033% (w/w) of yttrium, which was added posteriorly. Acetic acid was used as electrolyte for electromining. In the present work, the optimization of the EFAM process proposed by the cited authors was performed. Additionally, after obtaining the optimal configuration, these conditions were reproduced in real soil containing the same REE to evaluate the efficiency of electromining.

2.1. Characterization of the Real Soil
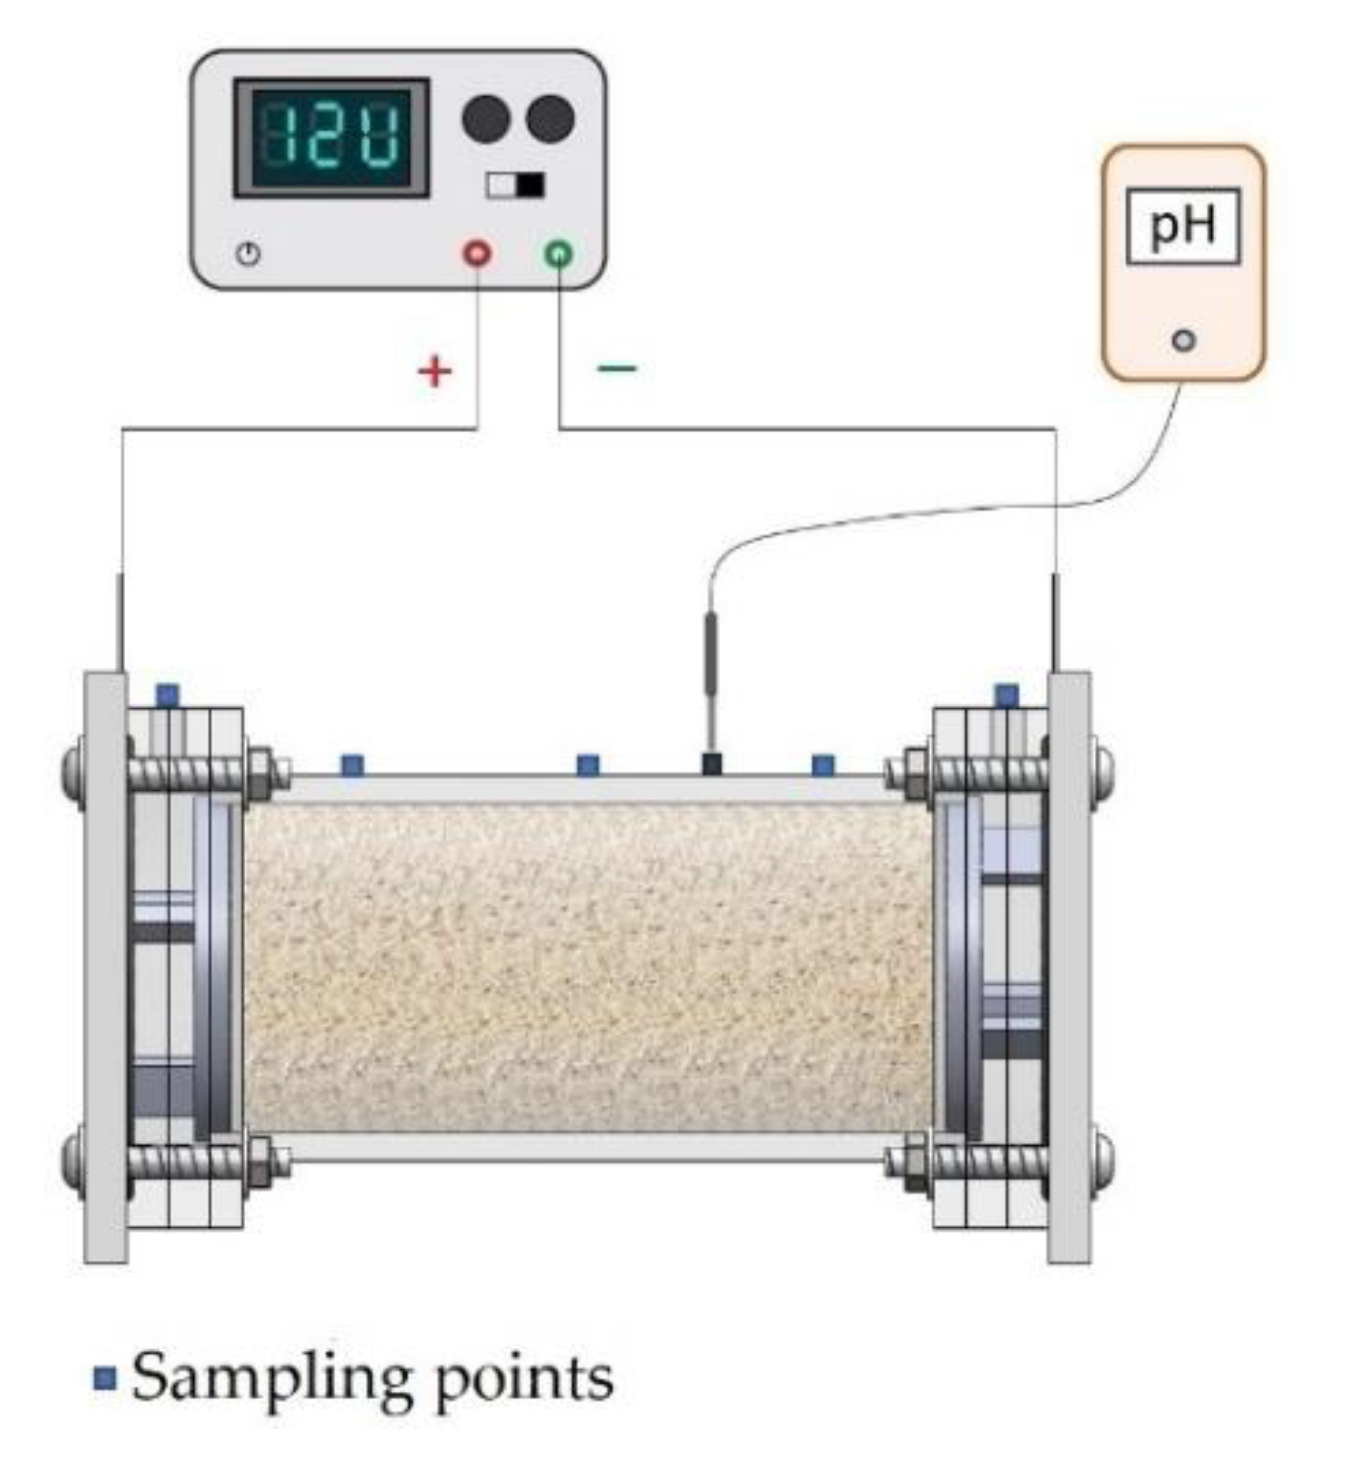
The real soil used in this paper was sampled in Brazil’s northern region, which was collected at a depth of 1.0 m. The sample characterization was performed by X-ray fluorescence (XRF). To quantify the Y3+ in the soil, the Inductively Coupled Plasma Optical Emission Spectrometry (ICP-OES) analytical method was used, according to the EPA 1351a standard [4]. The average concentration of the species resulted in 7.6 ± 0.1 mg kg−1. To obtain the moisture content and the quantity of organic compounds, the soil was submitted to a Thermal Gravimetric Analysis (TGA), resulting in 8.45% and 0.41%, respectively. Soil pH and resistivity were determined according to ISO 10390:2005 and ASTM G187-18 standards, respectively. Physical–chemical analyzes of the real soil were also performed [31]. The results of the analyses are presented in Table 1.

2.2. Electromining

The electromining performed in the real soils (EM-RS) followed the methodology of Pires et al. [19] applied to a synthetic soil, as well as the materials and chemical analyses referred to in the experimental procedure. Figure 1 presents a scheme of the experimental apparatus used for the electromining of the synthetic and real soils. The reactor used was 23 cm in length and has a cylindrical bed 16 cm in length and 8 cm in internal diameter. The electrolytic chambers have an internal volume of 150 cm3.
The real soil was not subjected to any pre-treatment. In this experiment, 1000 g of soil was used to fill the electrokinetic reactor bed and the electromining was conducted without electrolyte flow. The electrolyte injection occurred only at the beginning of the procedure to fill the reactor volume and the pumping direction was from the cathode to the anode chamber. The EFAM was conducted for 240 h, however, after 140 h of procedure, 50 mL of fresh electrolyte (acetic acid) was replaced, adding 10 mL in each sampling point of the reactor (Figure 1).

2.3. Y3+ Electromining Process Efficiency

The measurement of the electromining process efficiency (ξ) is based on the quantity of Y3+ mass, denoted as m Y , that migrates to the interior of the reactor cathodic chamber (CC) in relation to the total initial mass of the species ( m 0 = 39.35 mg Y) present in the soil. Therefore,
ξ = m Y m 0 100 %
where m Y (mg) is given by
m Y = C Y V CC
with C Y as the concentration of Y3+ in the CC and V CC as the volume of solution in the reactor CC.

2.4. Electromining Process Optimization

The optimization the EM process intends to extract the highest possible mass of Y3+, with the lowest density of dissipated electric current. This panorama is characterized as a multi-objective optimization problem. However, in this paper, the objective function to be minimized is given by the negative Y3+ extracted mass ( m Y ), considering the limit quantity for the average value of electric current density (Ilim). Thus, it is possible to formulate a constrained non-linear optimization problem, denoted as PY, that can be written in a standard form [32], as
P Y : { min   m Y =   m Y ( C ¯ ,   ε ¯ ) constraints : { I ( C ¯ ,   ε ¯ ) = I m ( C ¯ ,   ε ¯ )   I lim 0   1.0 ε ¯ 1.0   1.0 C ¯ 1.0
where C ¯ and ε ¯ are, respectively, the design variables of the electric field and electrolyte concentration, as described in the coded form. Therefore, the design variables vector is { C ¯ ,   ε ¯ } T       D , where D = [ 1.0 ,   1.0 ] 2     2 is the design space of the problem.
The extracted Y3+ mass ( m Y ) and average electric current density ( I m ) functions are defined by two response surfaces, based on the values obtained experimentally. These surfaces are obtained by a polynomial fit of a bilinear empiric model, employing the least squares method.
It is important to perform an analysis of the proposed optimization problem PY (Equation (3)). As the objective function and inequality constraint are obtained by response surfaces, it is possible to state that these functions are continuous. Furthermore, the design space is closed, thus establishing an adequate value of the limit electric current density, that guarantees a non-empty viable set; considering the Weierstrass theorem, it is possible to state that this problem has a solution [32].
An alternative for the PY solution is to use nonlinear programming techniques (NLP) [32]. It is noted that the design space of the problem is convex, as it is defined by a square region of dimension two. This characteristic favors the numeric solution of the problem. However, in general, it is not possible to guarantee that the objective and constraint functions are also convex. These properties could be satisfied if the Hessian matrices of the two evaluated functions were positive-definite in all points of the design space. If these conditions are not satisfied, the problem is not convex and the direct application of NLP is not advised, as the obtained solution depends on the optimal point initial estimative to be used in the interactive search process.
To overcome this difficulty, a viable alternative is to use heuristic optimization techniques [32,33,34]. In this paper, a hybrid optimization methodology proposed by Sousa et al. [33] as used. For this, initially, the problem was solved applying the genetic algorithm technique to obtain an approximation of the global optimal point, regardless of the non-convexity of the problem. Afterwards, a sequential quadratic programming NLP was used to refine the solution. Both methods use specific routines of the Matlab® software (ga.m and fmincon.m).

3. Results and Discussion

Five EMs experiments (EM-01 to EM-05) were conducted in the synthetic soil for 72 h, using different electrolyte concentrations (C) and different electric field strengths (ε). Table 2 presents these variables and their coded form, C ¯ and ε ¯ , respectively, which are used in the optimization problem.
The current density of the five EMs experiments was monitored a long time and the profiles are presented in Figure 2. It can be observed that the simultaneous increase of the variable’s electric field and electrolyte concentration, corresponding to experiment EM-04, resulted in the highest current density, favoring parallel reactions in the surface of the electrodes. Considering that the water hydrolysis reactions contribute to the decrease of electric potential [35], consequently, the migration of Y3+ is reduced due to the decrease in the effectivity of the electric field.

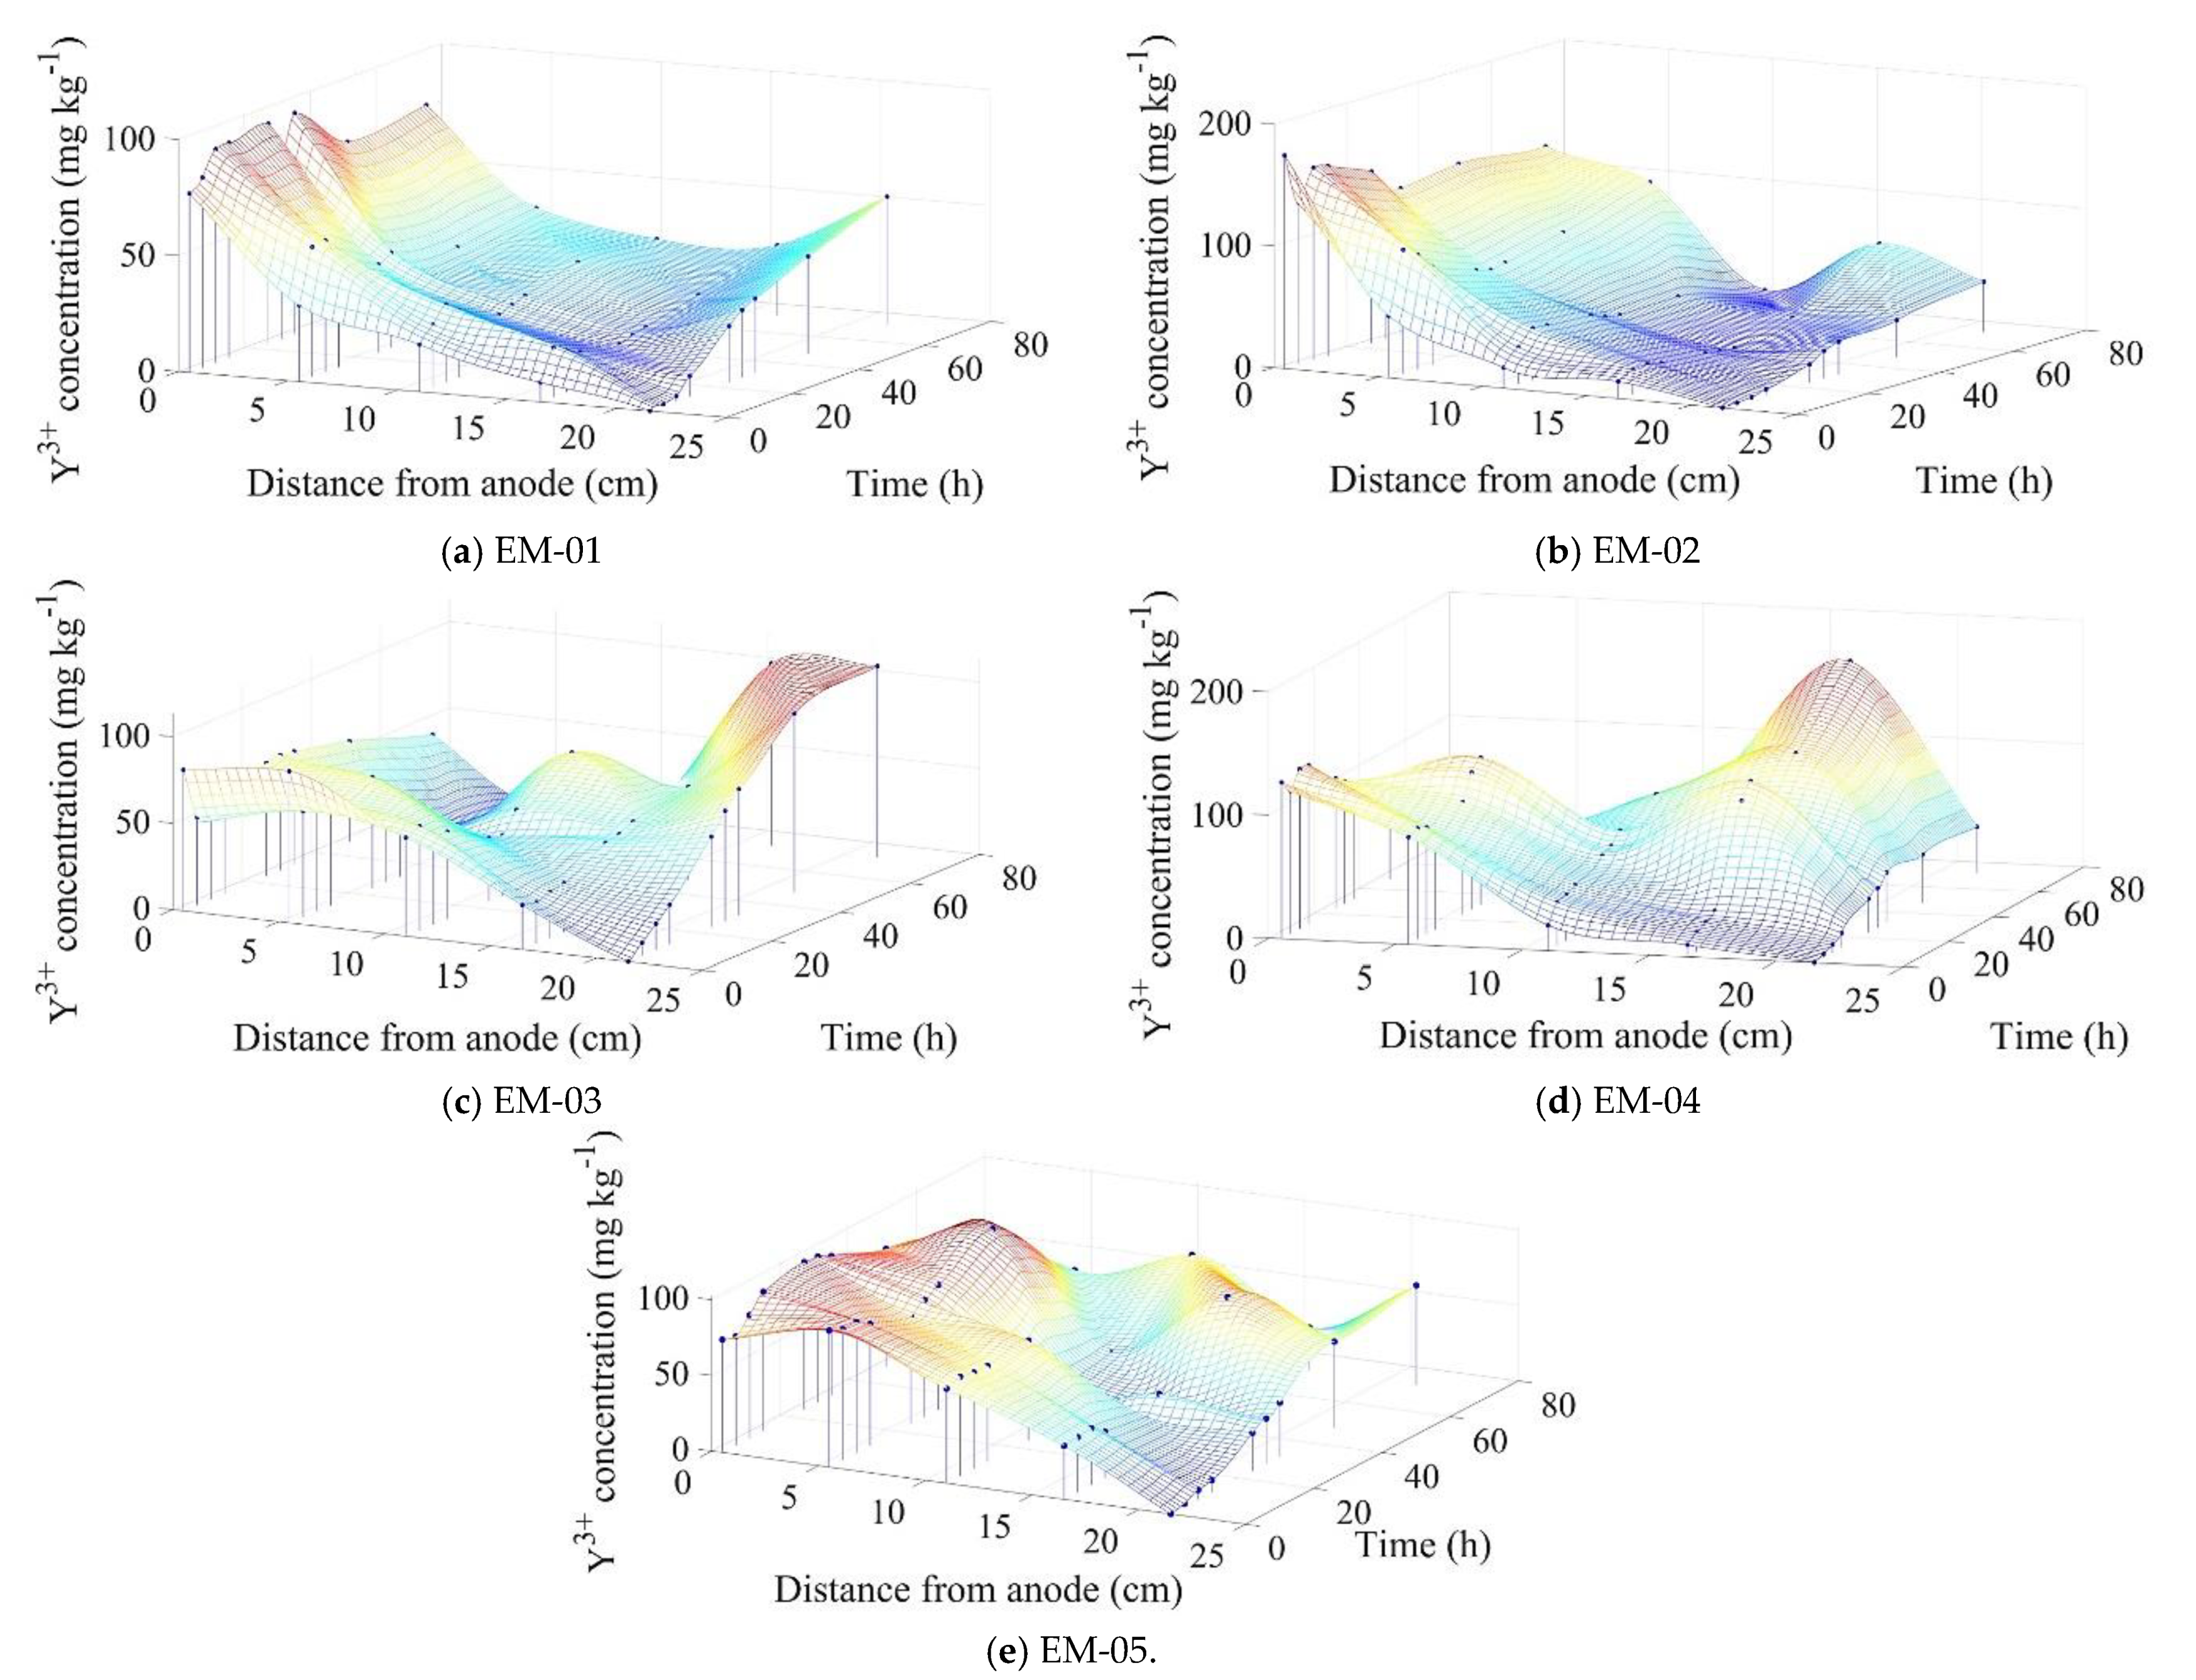
3.1. Analysis of the Migration Performance of Y3+

To obtain the Y3+ migrational profile of the EMs, electrolyte aliquots were collected from the five sampling points of the electrokinetic reactor (Figure 1). From the discrete values of the Y3+ concentration, response surfaces were constructed and fitted using the Cubic interpolation command of Matlab® software. Figure 3 shows the Y3+ migrational performance of EM-01 to EM-05.
According to Figure 3, at t = 0 h, there was the leaching of Y3+ towards the anodic chamber due to the direction of the electrolyte pumping into the system at the beginning of the procedure. Subsequently, it can be observed that Y3+ was mobilized towards the CC in all EMs. This mass transport was given by electromigration and diffusion. On the other hand, Acar and Alshawabkeh [36], Mohamadi et al. [29], and Pires et al. [19] claim that the migrational flow is the predominant mechanism to ion mass transport. Therefore, the migration was considered the only mechanism of mass transfer for all EMs, as proposed by Pires et al. [19].
Although there was migration of Y3+ in all EMs, only EM-03 (Figure 3c) presented an inversion in the concentration profile of the species. EM-04 (Figure 3d) was conducted in the same electric field strength (0.5454 V cm−1) as EM-03, however this electromining was not considered satisfactory. This behavior can be justified by the use of the electrolyte in a higher concentration (1.0 mol L−1). The increase in this variable results in the increase of the number of dissociated species originated from the acetic acid. As the experiment was conducted for 72 h, the magnitude of the electric field in EM-04 was not sufficient to supply the increase in the number of species of this experiment. Therefore, for the mining of EM-04 to be considered satisfactory, it would require more procedure time; thus, from a qualitative analysis, the EM-03 was considered to achieve the best performance regarding the Y3+ migration.
Although EM-03 has shown the best migrational profile, the tendency to reduce the Y3+ concentration in CC after 60 h of procedure was observed in this experiment. This behavior can be explained due to the increase in the concentration of Y3+ in the cathodic region, which promotes the diffusion of the ion in the opposite direction to the CC.

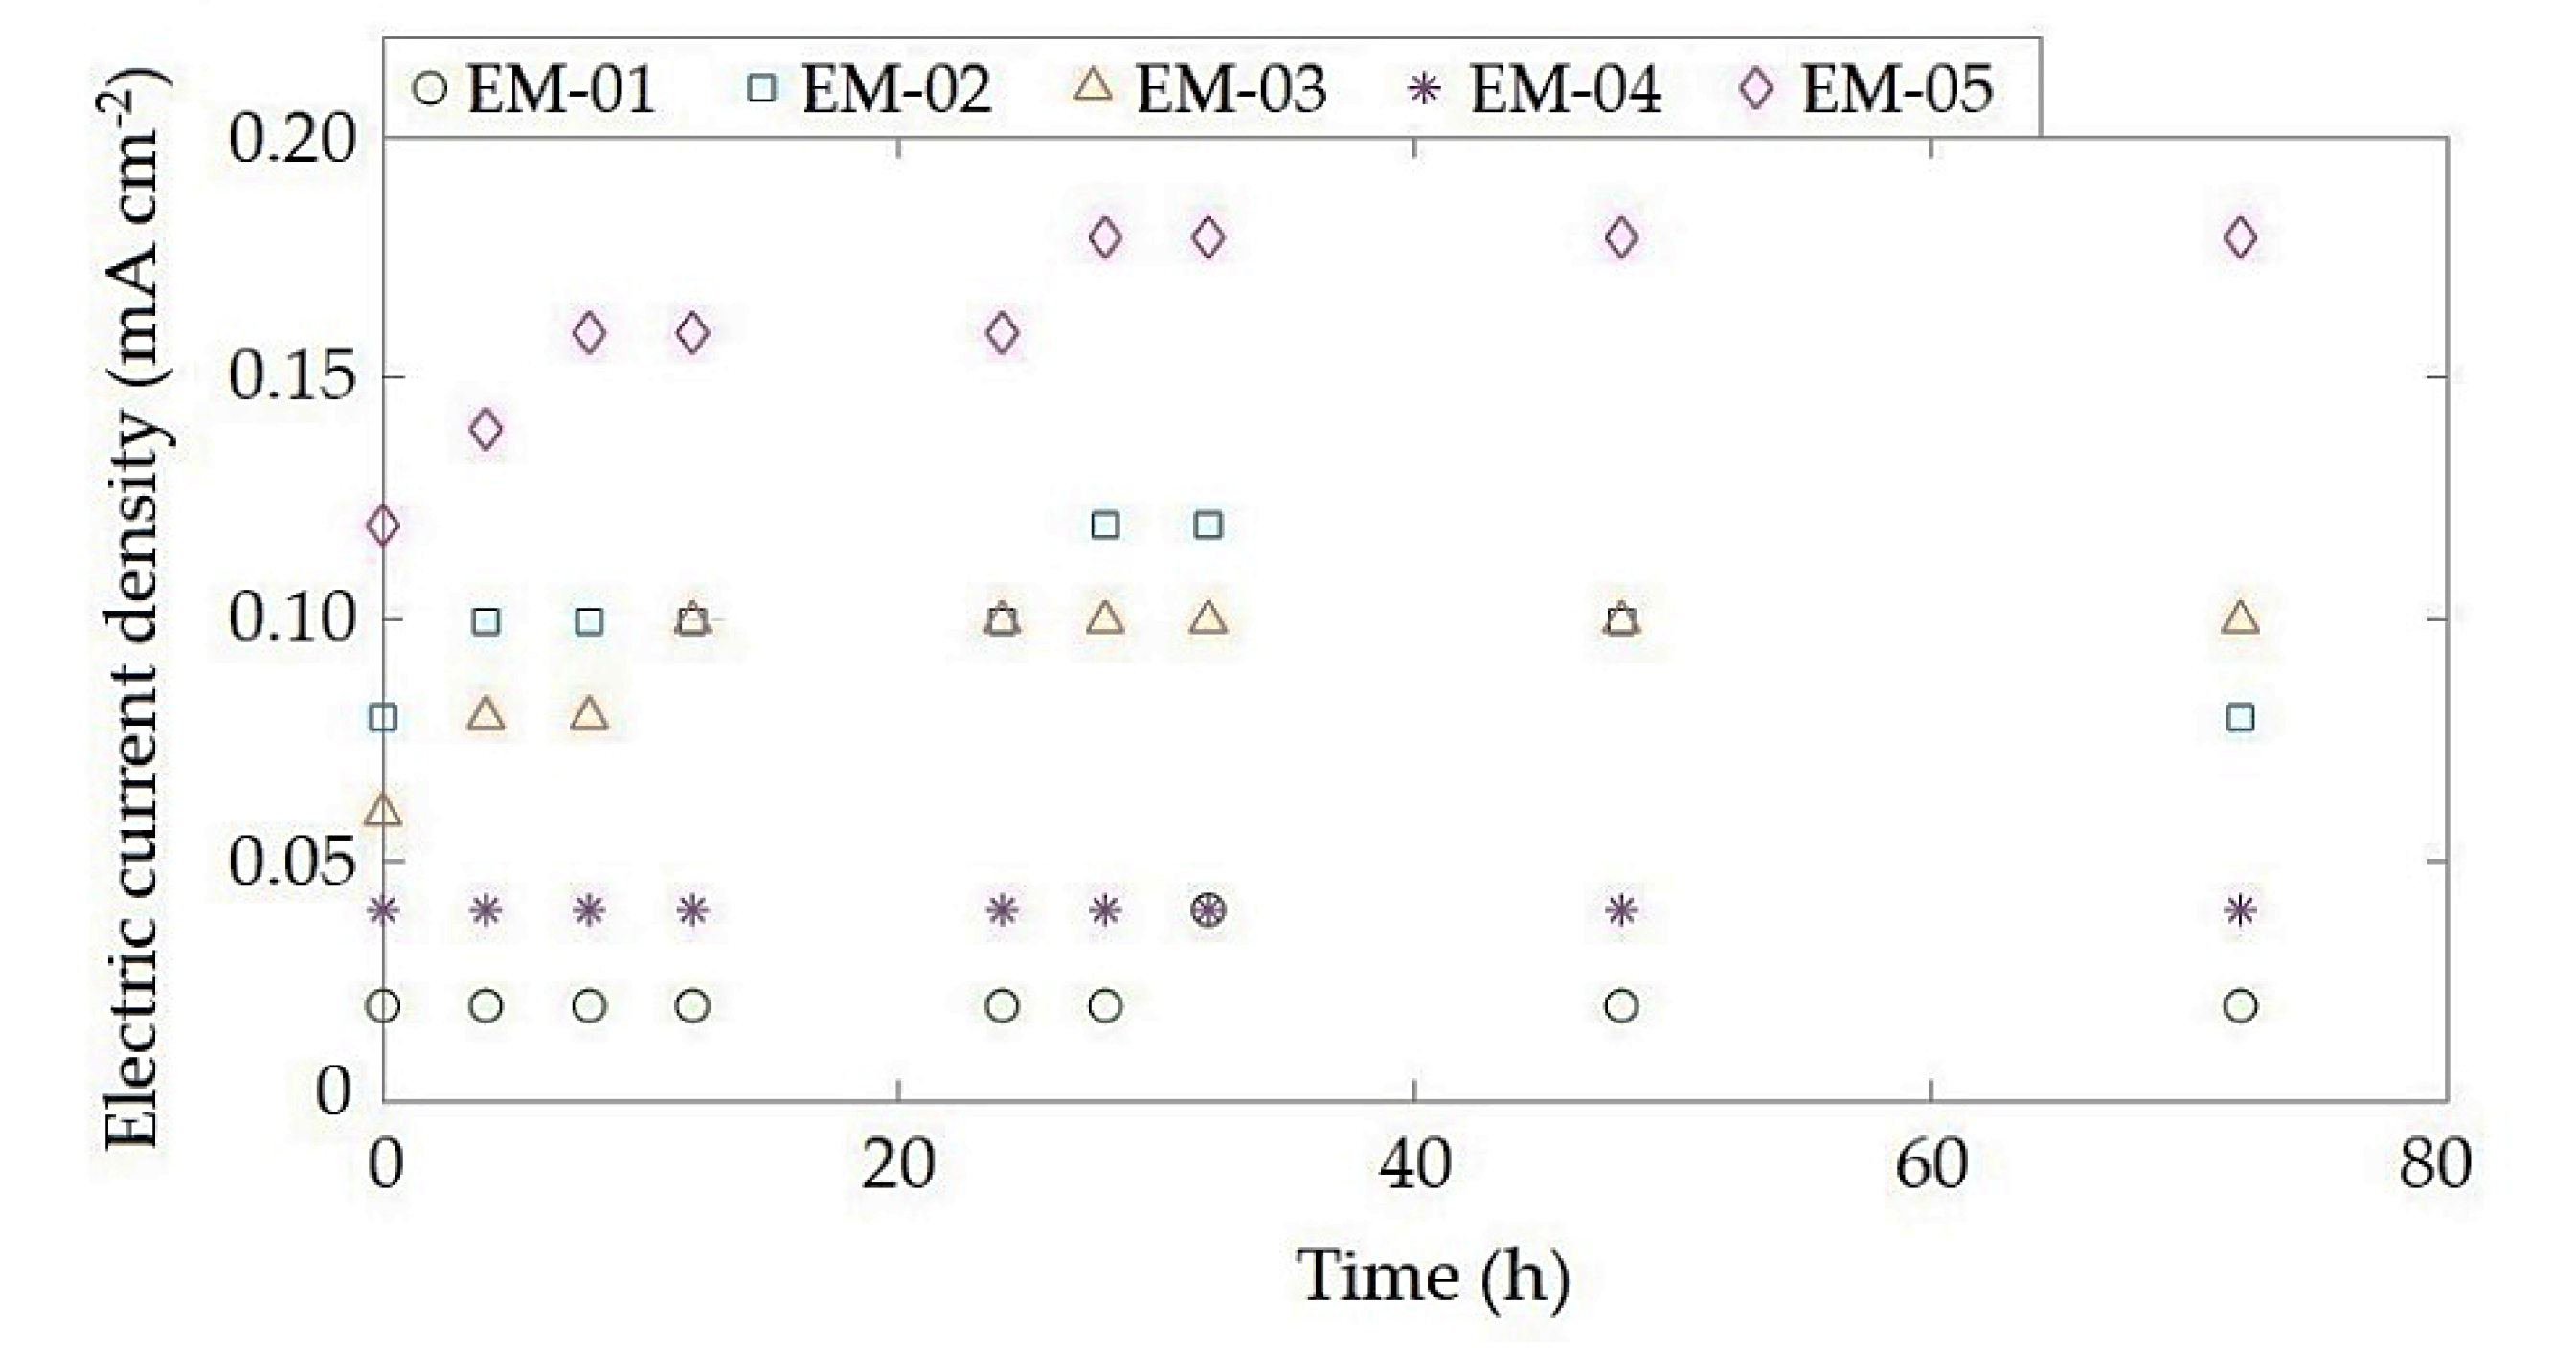
3.2. Electromining Efficiency

According to Pires et al. [19], the EM is considered satisfactory when Y3+ ions migrate into the reactor CC, this being the analysis domain for the electromining efficiency calculation. Table 3 presents the values of the average current density (Im) of the EMs, Y3+ electromining efficiency (ξ) after 72 h of process, and the extracted mass values of the species (mY), obtained by Equations (1) and (2), respectively.
EM-01 presented the lowest average current density for the analyzed cases (Table 3). However, this experimental configuration resulted in an unsatisfactory Y3+ extraction. This result can be attributed to the low electric field strength applied during this experiment (0.1818 V cm−1). EM-03 and EM-05 were the most favorable experimental configurations for the extraction of Y3+; these EMs were conducted under the two highest electric field strengths and used the two lowest electrolyte concentrations (Table 1). However, EM-03 efficiency was larger than EM-05, resulting in a 68.3% higher Y3+ mass extraction. EM-04 was the experiment that obtained the lowest electromining efficiency. This result can be attributed to the higher number of electroactive species susceptible to the electric field, becoming less effective in the extraction of Y3+. As the REE are a species that easily hydrolyze [19,37], it is reiterated that applying higher electric field strengths associated to lower electrolyte concentrations favors the migration of Y3+.

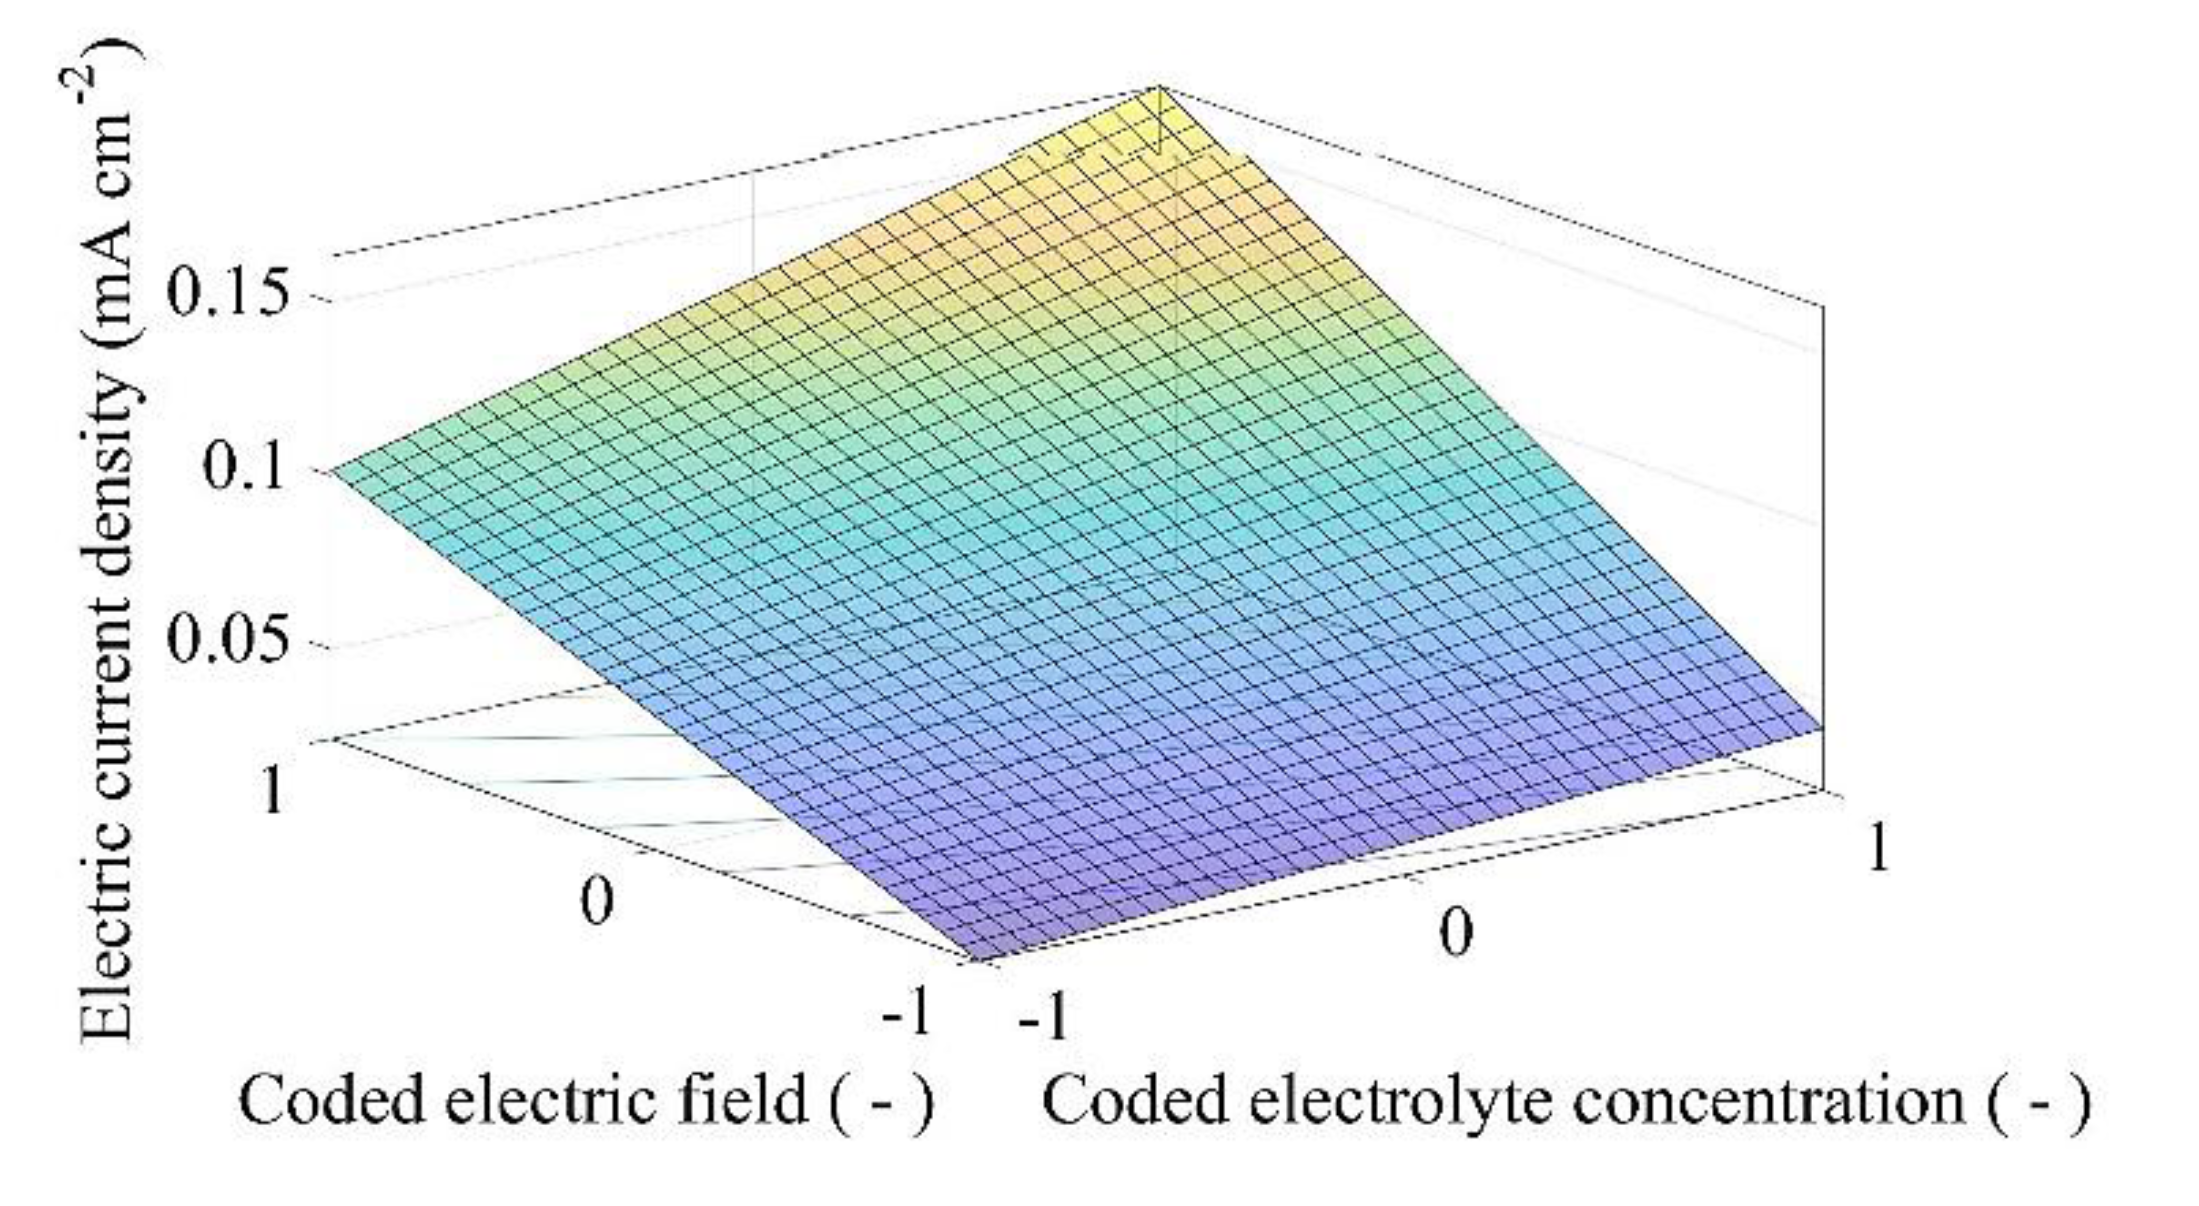
3.3. Electromining Process Optimization

The EM process optimization was performed considering the standard problem presented in Equation (3). In this problem, the objective function m Y   ( C ¯ ,   ε ¯ ) and the inequality constraint function associated with the electric current density, I ( C ¯ ,   ε ¯ ) , were obtained by a fit using the least squares method, considering the values of the variables in their coded form, C ¯ e ε ¯ .
The objective function, presented in Figure 4, can be explicitly written as:
  m Y   ( C ¯ ,   ε ¯ ) =   ( 9.31593   3.27450   C ¯ + 1.94153   ε ¯   2.23245   C ¯   ε ¯ )
Defining the vector of design variables in the form x = { C ¯ ,   ε ¯ } T , the objective function can be rewritten in matrix form as:
  m Y   ( x ) =   9.31593 + [ 3.27450   1.94153 ] x + 1 2 x t [ 0.0 2.23245 2.23245 0.0 ] x
On the other hand, the current density function presented in Figure 5, can be explicitly defined as:
I m   ( C ¯ ,   ε ¯ ) = 0.08271 + 0.01995   C ¯ + 0.04968   ε ¯ + 0.01100   C ¯   ε ¯
In matrix form, this function is written as
I m   ( x ) = 0.08271 + [ 0.01995 0.04968 ] x + 1 2 x t [ 0.0 0.01100 0.01100 0.0 ] x
It is important to highlight that, due to the model chosen to represent the objective and constraint functions, their second-order Taylor-series approximations at any point result in their own Hessian functions. Thus, to analyze the convexity of these functions it is necessary to evaluate only the principal values of their respective Hessian matrices. Solving the eigenvalues/eigenvectors problems associated with the objective and constraint function’s Hessian matrices, the principal values ± 2.23245 and ± 0.01100 were, respectively, obtained. Positive and negative eigenvalues characterize an indefinite matrix, in other words, a non-convex function. Therefore, it can be concluded that the PY optimization problem is not convex.
Aiming to analyze the EM process, six optimization problems were proposed (PY1, PY2–PY6) and characterized by different limit electric current density values (Ilim). The optimal configuration and the extracted mass value for each problem are presented in Table 4. For any Ilim value, it is observed that the best configuration always occurs with the lowest electrolyte concentration value.
In all optimization problems PYi (i = 1–6) the objective function is the same (Equation (5). Each problem PYi is characterized by the limit value of the constraint function associated to the electric current density, which redefines the viable set. The representation of the limit isolines of the constraint function and the ideal configuration points in each problem are shown in Figure 6.
From Table 4, a non-linear variation of the optimum value of Y3+ extracted mass in relation to the limit electric current density value is observed. Expanding the viable set of the optimization problem by increasing I lim increases m Y . However, for the analyzed problems, this growth tendency occurs until the maximum m Y value of 16.7644 mg is reached.
It is observed that a variation from 0.5454 V cm−1 to 0.5386 V cm−1 (1.25% decrease) in the electric field strength causes a reduction of 23.08% in the electric current density, in other words, from 0.1300 mA cm−2 to 0.1000 mA cm−2. This reduction in the current density indicates that the parallel reactions, such as water hydrolysis, were attenuated, causing the electric field to be more available for the migration of Y3+. This observation can be proved analyzing the species extracted mass variation that resulted in only a 0.94% decrease, reducing from 16.7644 mg to 16.6090 mg.

3.4. Real Soil Electromining
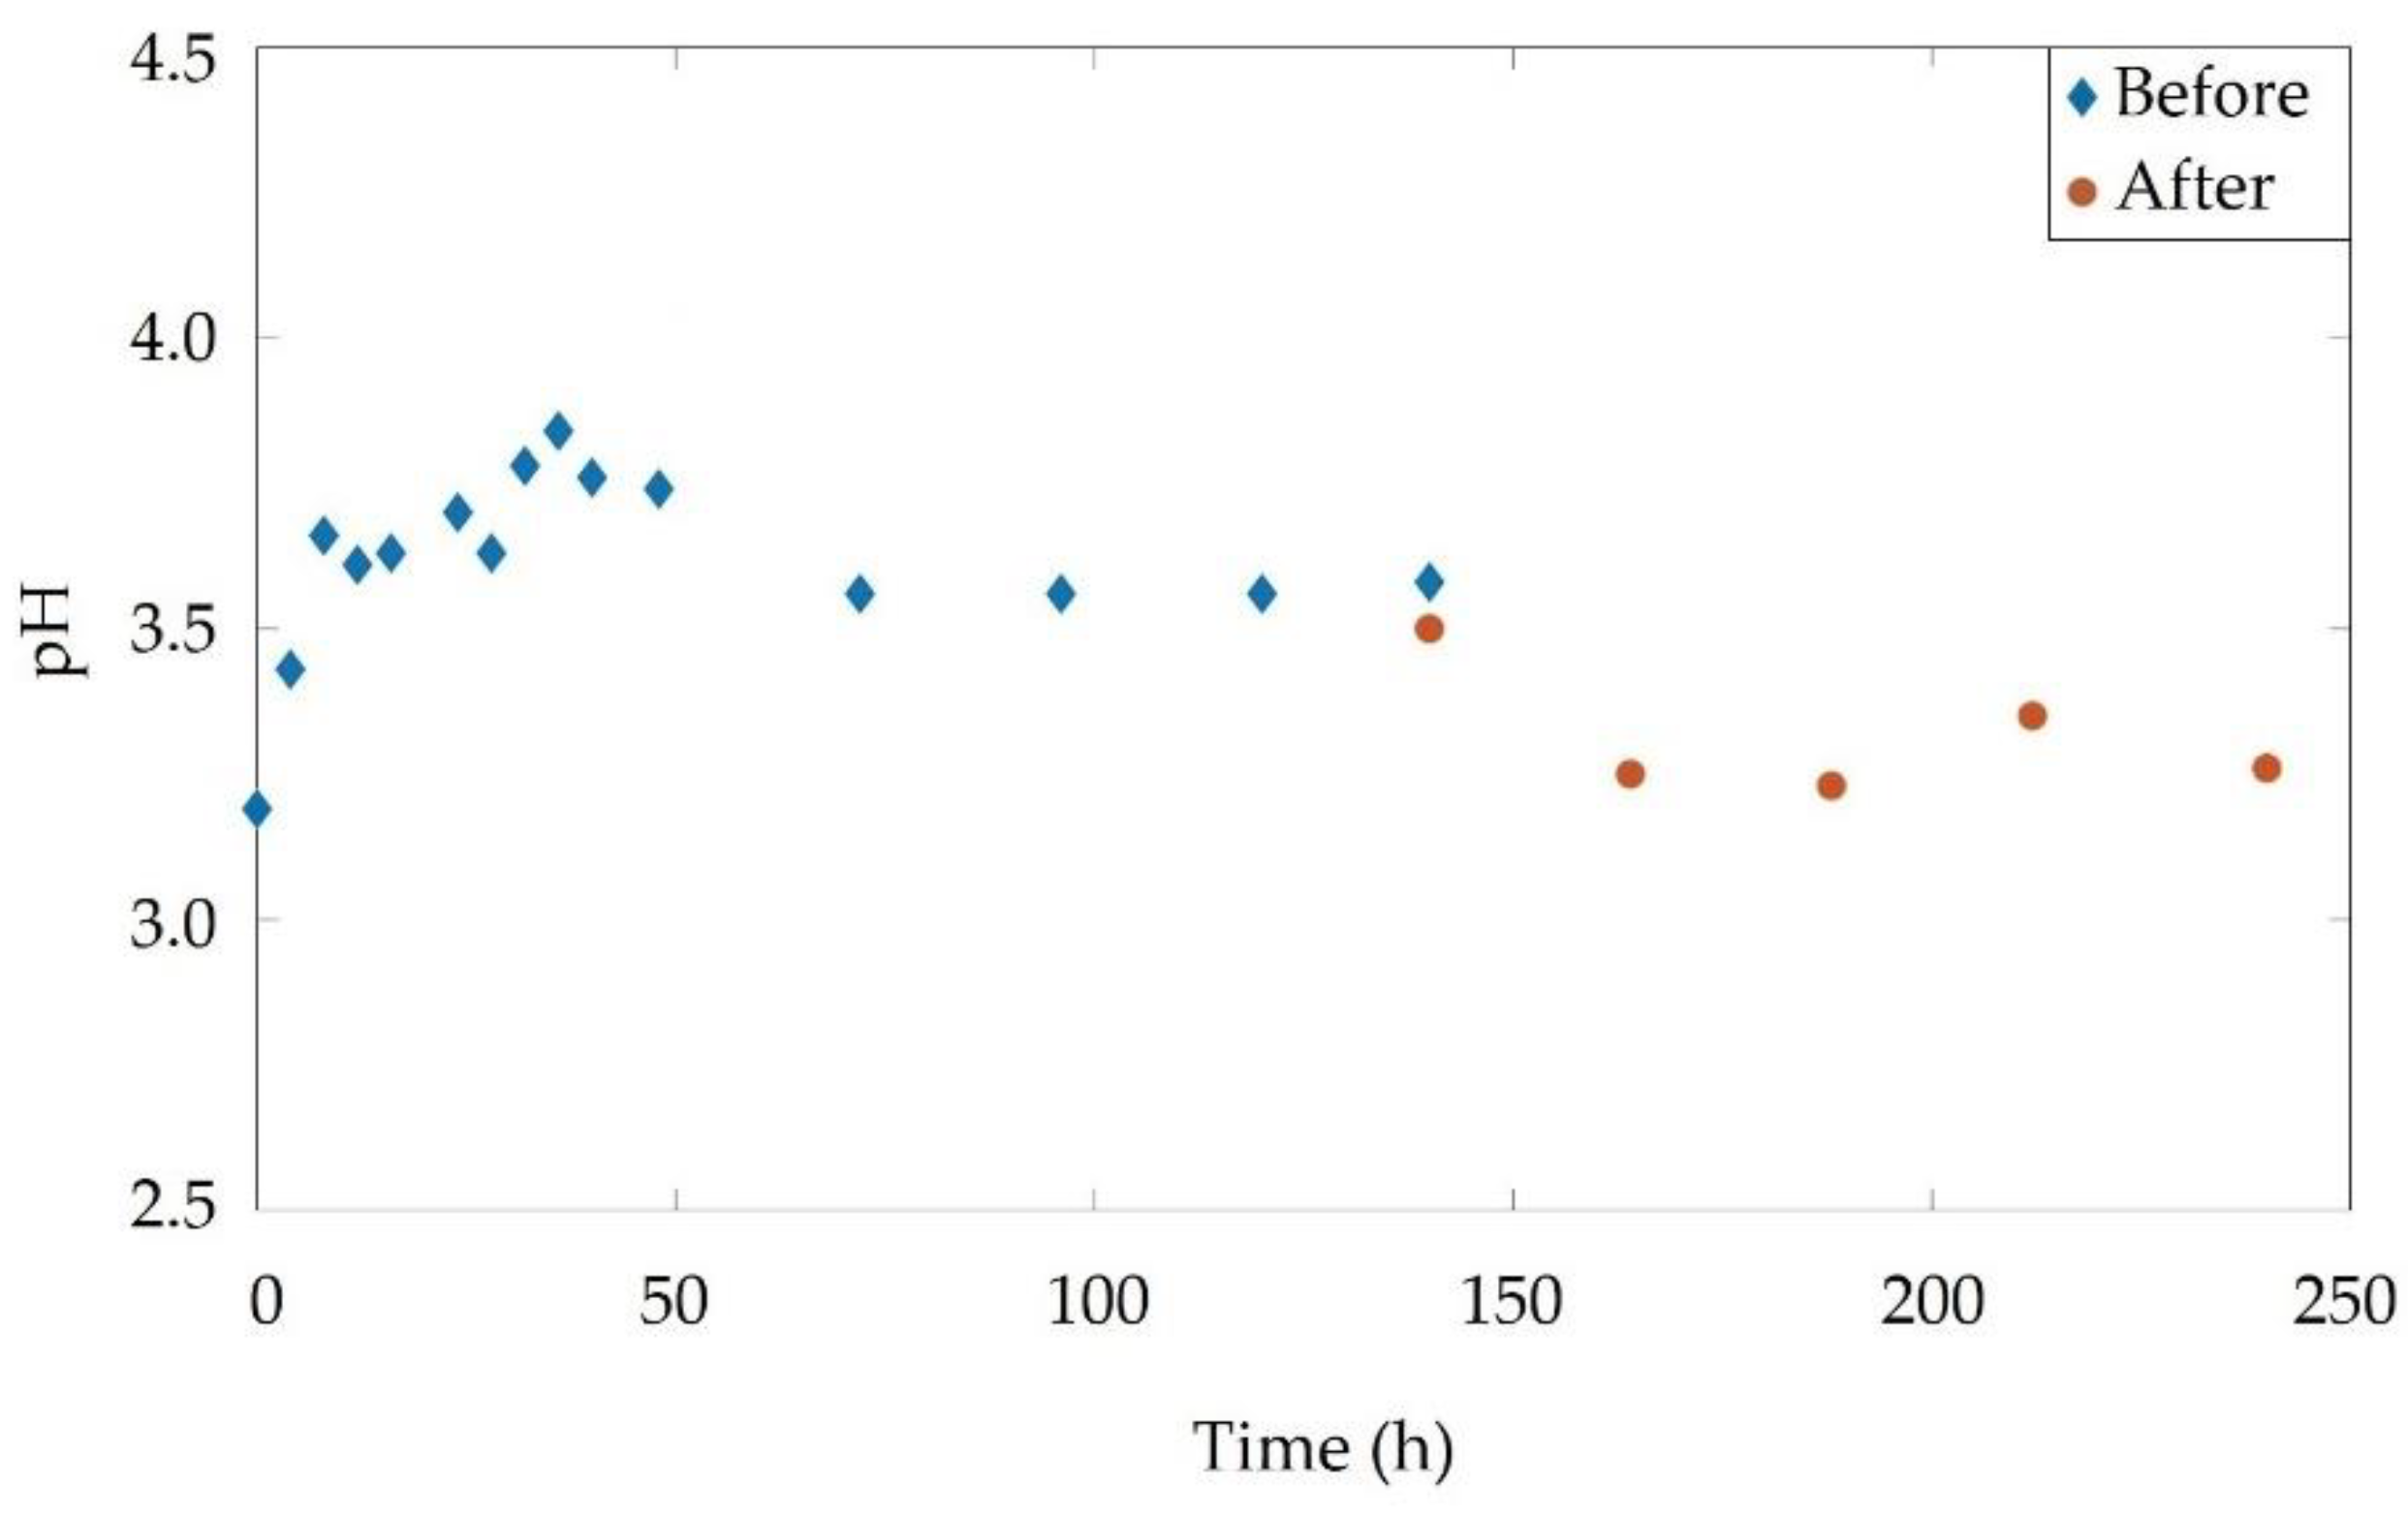
From the six proposed optimization problems, the PY3 experimental configuration, corresponding to an electric field of 0.5386 V cm−1 and electrolyte concentration of 0.1 mol L−1, was chosen to be reproduced in a real soil EM. In this experiment the Y3+ migration profiles, the pH profiles of the medium, and electromining efficiency were analyzed.
Figure 7 shows the Y3+ concentration profile in the reactor CC during the experiment, in which it was observed that the Y3+ migration in the EM-RS was slower than the EMs performed in synthetic soils (Figure 3). This behavior can be explained by some peculiarities of the real soil, such as a higher composition heterogeneity, the presence of organic matter, and the higher values of soil resistivity and pH (Table 1). This set of characteristics contributes to the inhibition of Y3+ desorption and the migration of the species through the porous medium. However, the EM-RS can be considered satisfactory, as an advance in the Y3+ migrational front through time towards the CC was observed, resulting in an electromining efficiency of 41.48% for the species.
As the EM-RS was conducted by the potentiostatic method, the electric current density presented a stable behavior with few oscillations and an average current density of 0.059 ± 0.004 mA cm−2. Although this test was performed using experimental conditions similar to EM-03, the average electric current density was lower than the majority of the EMs (Table 3). This result is considered satisfactory, as it indicates that the parallel reactions on the surface of the electrodes did not develop significantly. Thus, the electric filed is more available to the Y3+ migration. On the other hand, due to higher complexity matrix, the migration of species was slower than in the other EMs, resulting in a time approximately three times longer. However, in the EM-RS, the electrodes degradation was not observed, nor the adsorption of species in their surfaces.

3.4.1. Real Soil pH

During the EM-RS the pH of the reactional medium was monitored (Figure 1). The profile of this variable was considered stable, presenting few variations, as shown in Figure 8. However, in the first 50 h of the experiment, the highest oscillations were observed. This behavior suggests that there was a period of stabilization for the soil. After 72 h of experiment, the pH variations reduced, indicating that the parallel reactions did not develop significantly. It should also be highlighted that the addition of the fresh electrolyte after 140 h of experimentation contributed to the pH variation, resulting in the increase of the local acidity.
After the end of the experiment, the soil was submitted to a natural drying process and a new pH measurement, resulting in a value of 4.73. Although the acceptable range for agricultural soils is from 5.5 to 7.2, there are different types of soils that do not fit this range [38,39].

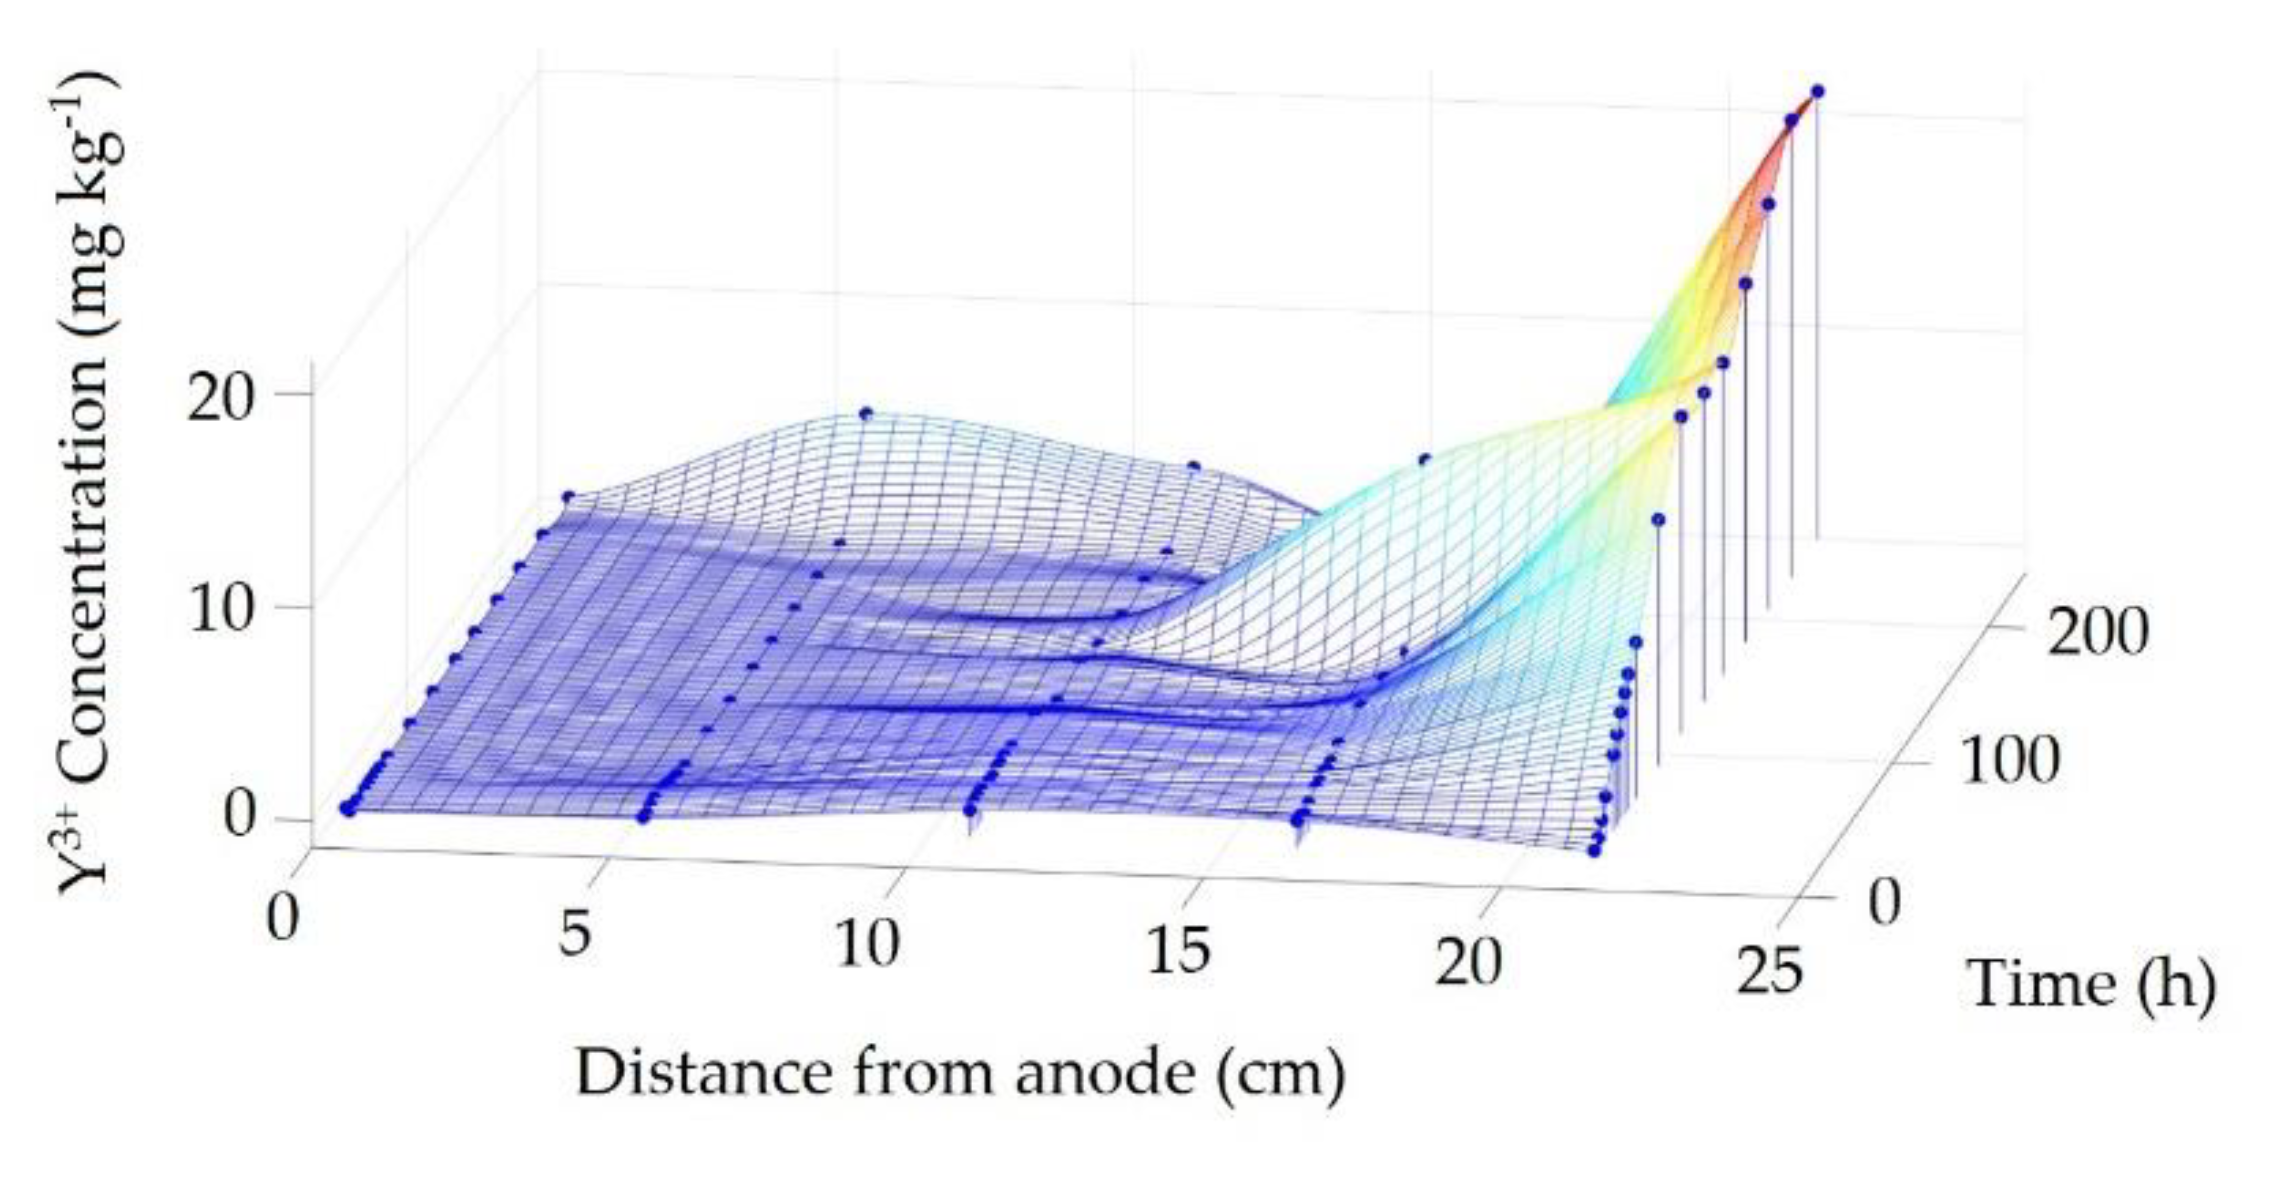
3.4.2. Y3+ Migrational Profile in the Reactor Cathodic Chamber

Figure 7 shows the concentration profile of Y3+ in the reactor CC (distance from anode = 22.5 cm), in which an advance in the Y3+ migrational front through time can be observed. However, similarly to the EM-03 behavior, seen in Figure 3c, the EM-RS also presented a tendency to reduce the Y3+ concentration in the CC. This profile happens due to an increase in the species concentration gradient in the CC, favoring Y3+ diffusion from CC to the reactor bed. After the addition of fresh electrolyte (t = 140 h), a change in the Y3+ concentration profile in the CC was observed favoring the increase in species extraction.
The migrational behavior of the Y3+ ion can be attribute to variation in electrochemical potential ( μ ¯ i ) , which is given by the species chemical potential ( μ i ) and electric potential ( μ ) [40,41], according to:
μ ¯ i = μ i + μ
being,
μ i = μ i 0 + R T   l n C i
and
μ = z i ψ
where, μ i 0 is the standard chemical potential of the species i, R (8.314 J mol−1 K−1) is the universal constant of gases, T is the temperature (K), and Ci is the concentration of the i-th species (mol L−1). The i species charge is represented by zi (3+), is the Faraday constant (96,485 C), and ψ denotes the applied electric potential (V) [41].
Considering that the EM-RS was conducted by the potentiostatic method and admitting that the electric potential (Equation (10)) is constant during the experiment, the electrolyte replacement altered only the chemical potential of Y3+. The reduction of this variable corresponds to the obtention of a more diluted solution, favoring the mass transfer of the species from the soil to the electrolyte solution.
Another consequence of the addition of fresh electrolyte was the reduction of the medium pH (Figure 8), increasing the acidity and contributing to the desorption of the species from the soil [36,42]. Thus, after the desorption step, the ion is transferred to the electrolyte solution, which presents a higher conductivity and is more susceptible to the electric field action, and following, migrates towards the CC, promoting the extraction of Y3+ [43,44].

3.4.3. Cost of Y3+ Produced

In this paper, the first study of extraction of rare earths in real soil was presented. The results obtained were similar to those found by Pires et al. [19] (Table 3). In their study, the authors also presented the calculations for obtaining the cost of Y3+ produced, in which it was observed that the current density was the main parameter that most influenced the cost of the process. Thus, the cost of Y3+ produced by EMs ranged from 7164 USD t−1 to 231,296 USD t−1.
According to the similarities between the values of current density and process efficiency obtained in the EM-RS of the present work and the EM-03 of Pires et al. [19], it is reasonable to approximate the production costs of Y3+ in real soils to the value found by the cited authors of 48,126 USD t−1.

4. Conclusions

The present paper proposed the optimization of the electric field assisted mining process for the Y3+ ion. Six optimization problems were analyzed in a synthetic soil, of which the best experimental configuration resulted in an electric field strength of 0.5386 V cm−1 and electrolyte concentration of 0.1 mol L−1. This optimal configuration was reproduced in a real soil, resulting in a Y3+ electromining efficiency of 41.48%. Although the experiment using the real soil was satisfactory, it was observed that the Y3+ electromigration was slower than in the synthetic soil. On the other hand, the development of parallel reactions in the real soil experiment, such as water hydrolysis were less evident, contributing to the advance of the Y3+ migrational front and favoring the increase in the process efficiency. Thus, it can be observed that the electric field assisted mining, using biodegradable electrolytes in low concentrations, can be considered a viable technique for the extraction of rare earths from real soils.

Author Contributions

Conceptualization, C.M.G.P.; methodology, C.M.G.P.; software, C.M.G.P. and J.T.P.; validation, J.T.P.; formal analysis, C.M.G.P. and J.T.P.; investigation, C.M.G.P.; resources, A.B.R., H.A.P. and M.J.J.S.P.; data curation, C.M.G.P. and J.T.P.; writing—original draft preparation, C.M.G.P.; writing—review and editing, J.T.P., A.B.R., H.A.P. and M.J.J.S.P.; visualization, J.T.P., A.B.R., H.A.P. and M.J.J.S.P.; supervision, A.B.R., H.A.P. and M.J.J.S.P.; project administration, H.A.P. and M.J.J.S.P.; funding acquisition, C.M.G.P. and A.B.R. All authors have read and agreed to the published version of the manuscript.

Funding

This study was partly financed by the Coordenação de Aperfeiçoamento de Pessoal de Nível Superior—Brasil (CAPES)—Finance Code 001. This study has received funding from the European Union’s Horizon 2020 research and innovation program under the Marie Skłodowska-Curie grant agreement No. 778045.

Institutional Review Board Statement

Not applicable.

Informed Consent Statement

Not applicable.

Data Availability Statement

Not applicable.

Conflicts of Interest

The authors declare no conflict of interest.

References

  1. Mishra, V.; Chakravarty, S.; Finkelman, R.B.; Varma, A.K. Geochemistry of Rare Earth Elements in Lower Gondwana Coals of the Talchir Coal Basin, India. J. Geochem. Explor. 2019, 204, 43–56. [Google Scholar] [CrossRef]
  2. Wang, L.; Huang, X.; Yu, Y.; Zhao, L.; Wang, C.; Feng, Z.; Cui, D.; Long, Z. Towards cleaner production of rare earth elements from bastnaesite in China. J. Clean. Prod. 2017, 165, 231–242. [Google Scholar] [CrossRef]
  3. Lefticariu, L.; Klitzing, K.L.; Kolker, A. Rare Earth Elements and Yttrium (REY) in coal mine drainage from the Illinois Basin, USA. Int. J. Coal Geol. 2020, 217, 103327. [Google Scholar] [CrossRef]
  4. Balaram, V. Rare earth elements: A review of applications, occurrence, exploration, analysis, recycling, and environmental impact. Geosci. Front. 2019, 10, 1285–1303. [Google Scholar] [CrossRef]
  5. Lima, A.T.; Ottosen, L. Recovering rare earth elements from contaminated soils: Critical overview of current remediation technologies. Chemosphere 2020, 265, 129163. [Google Scholar] [CrossRef]
  6. Guedes, P.; Lopes, V.; Couto, N.; Mateus, E.P.; Pereira, C.S.; Ribeiro, A.B. Electrokinetic remediation of contaminants of emergent concern in clay soil: Effect of operating parameters. Environ. Pollut. 2019, 253, 625–635. [Google Scholar] [CrossRef]
  7. Preinfalk, C.; Morteani, G. The Industrial Applications of Rare Earth Elements. In Lanthanides, Tantalum and Niobium; Möller, P., Černý, P., Saupé, F., Eds.; Special Publication No. 7 of the Society for Geology Applied to Mineral Deposits; Springer: Berlin/Heidelberg, Germany, 1989; Volume 7, pp. 359–370. [Google Scholar] [CrossRef]
  8. Khanchi, A.R.; Sedighi, H.; Ansar, S.; Fasihi, J. Preconcentration of rare earth elements from Iranian monazite ore by spiral separator using multi-response optimization method. Int. J. Min. Sci. Technol. 2014, 24, 117–121. [Google Scholar] [CrossRef]
  9. Amato, A.; Becci, A.; Birloaga, I.; De Michelis, I.; Ferella, F.; Innocenzi, V.; Ippolito, N.M.; Pillar-Jimenez-Gomez, C.; Vegliò, F.; Beolchini, F. Sustainability analysis of innovative technologies for the rare earth elements recovery. Renew. Sustain. Energy Rev. 2019, 106, 41–53. [Google Scholar] [CrossRef]
  10. Couto, N.; Ferreira, A.R.; Lopes, V.; Peters, S.; Mateus, E.P.; Ribeiro, A.B.; Pamukcu, S. Electrodialytic Recovery of Rare Earth Elements from Coal Ashes. Electrochim. Acta 2020, 136934. [Google Scholar] [CrossRef]
  11. Takehara, L.; Silveira, F.V.; Santos, R.V. Potentiality of Rare Earth Elements in Brazil. Rare Earths Ind. 2016, 57–72. [Google Scholar] [CrossRef]
  12. Swain, N.; Mishra, S.; Acharya, M.R. Hydrometallurgical route for recovery and separation of samarium (III) and cobalt (II) from simulated waste solution using tri-n-octyl phosphine oxide—A novel pathway for synthesis of samarium and cobalt oxides nanoparticles. J. Alloys Compd. 2020, 815. [Google Scholar] [CrossRef]
  13. Vahidi, E.; Navarro, J.; Zhao, F. An initial life cycle assessment of rare earth oxides production from ion-adsorption clays. Resour. Conserv. Recycl. 2016, 113, 1–11. [Google Scholar] [CrossRef] [Green Version]
  14. Vahidi, E.; Zhao, F. Environmental life cycle assessment on the separation of rare earth oxides through solvent extraction. J. Environ. Manag. 2017, 203, 255–263. [Google Scholar] [CrossRef] [PubMed]
  15. Tunsu, C.; Menard, Y.; Eriksen, D.Ø.; Ekberg, C.; Petranikova, M. Recovery of critical materials from mine tailings: A comparative study of the solvent extraction of rare earths using acidic, solvating and mixed extractant systems. J. Clean. Prod. 2019, 218, 425–437. [Google Scholar] [CrossRef]
  16. Li, J.; Li, M.; Zhang, D.; Gao, K.; Xu, W.; Wang, H.; Geng, J.; Ma, X.; Huang, L. Clean production technology of selective decomposition of Bayan Obo rare earth concentrate by NaOH. J. Clean. Prod. 2019, 236. [Google Scholar] [CrossRef]
  17. Omodara, L.; Pitkäaho, S.; Turpeinen, E.M.; Saavalainen, P.; Oravisjärvi, K.; Keiski, R.L. Recycling and substitution of light rare earth elements, cerium, lanthanum, neodymium, and praseodymium from end-of-life applications—A review. J. Clean. Prod. 2019, 236, 117573. [Google Scholar] [CrossRef]
  18. Innocenzi, V.; De Michelis, I.; Kopacek, B.; Vegliò, F. Yttrium recovery from primary and secondary sources: A review of main hydrometallurgical processes. Waste Manag. 2014, 34, 1237–1250. [Google Scholar] [CrossRef]
  19. Pires, C.M.G.; de Ponte, H.A.; Pereira, J.T.; de Ponte, M.J.J.S. Yttrium extraction from soils by electric field assisted mining applying the evolutionary operation technique. J. Clean. Prod. 2019, 227, 272–279. [Google Scholar] [CrossRef]
  20. Auerbach, R.; Bokelmann, K.; Stauber, R.; Gutfleisch, O.; Schnell, S.; Ratering, S. Critical raw materials—Advanced recycling technologies and processes: Recycling of rare earth metals out of end of life magnets by bioleaching with various bacteria as an example of an intelligent recycling strategy. Miner. Eng. 2019, 134, 104–117. [Google Scholar] [CrossRef]
  21. Mancheri, N.A. World trade in rare earths, Chinese export restrictions, and implications. Resour. Policy 2015, 46, 262–271. [Google Scholar] [CrossRef]
  22. Mancheri, N.A.; Sprecher, B.; Bailey, G.; Ge, J.; Tukker, A. Effect of Chinese policies on rare earth supply chain resilience. Resour. Conserv. Recycl. 2019, 142, 101–112. [Google Scholar] [CrossRef]
  23. Zhang, K.; Kleit, A.N.; Nieto, A. An economics strategy for criticality—Application to rare earth element Yttrium in new lighting technology and its sustainable availability. Renew. Sustain. Energy Rev. 2017, 77, 899–915. [Google Scholar] [CrossRef]
  24. Acar, Y.B.; Gale, R.J.; Alshawabkeh, A.N.; Marks, R.E.; Puppala, S.; Bricka, M.; Parker, R. Electrokinetic remediation: Basics and technology status. J. Hazard. Mater. 1995, 40, 117–137. [Google Scholar] [CrossRef]
  25. Yang, J.S.; Kwon, M.J.; Choi, J.; Baek, K.; O’Loughlin, E.J. The transport behavior of As, Cu, Pb, and Zn during electrokinetic remediation of a contaminated soil using electrolyte conditioning. Chemosphere 2014, 117, 79–86. [Google Scholar] [CrossRef] [PubMed]
  26. Baek, K.; Kim, D.H.; Park, S.W.; Ryu, B.G.; Bajargal, T.; Yang, J.S. Electrolyte conditioning-enhanced electrokinetic remediation of arsenic-contaminated mine tailing. J. Hazard. Mater. 2009, 161, 457–462. [Google Scholar] [CrossRef] [PubMed]
  27. Li, D.; Tan, X.Y.; Da Wu, X.; Pan, C.; Xu, P. Effects of electrolyte characteristics on soil conductivity and current in electrokinetic remediation of lead-contaminated soil. Sep. Purif. Technol. 2014, 135, 14–21. [Google Scholar] [CrossRef]
  28. Song, Y.; Cang, L.; Xu, H.; Wu, S.; Zhou, D. Migration and decomplexation of metal-chelate complexes causing metal accumulation phenomenon after chelate-enhanced electrokinetic remediation. J. Hazard. Mater. 2019, 377, 106–112. [Google Scholar] [CrossRef]
  29. Mohamadi, S.; Saeedi, M.; Mollahosseini, A. Enhanced electrokinetic remediation of mixed contaminants from a high buffering soil by focusing on mobility risk. J. Environ. Chem. Eng. 2019, 7, 103470. [Google Scholar] [CrossRef]
  30. Sun, Z.; Wu, B.; Guo, P.; Wang, S.; Guo, S. Enhanced electrokinetic remediation and simulation of cadmium-contaminated soil by superimposed electric field. Chemosphere 2019, 233, 17–24. [Google Scholar] [CrossRef]
  31. Kumar, A.; Pinto, M.C.; Candeias, C.; Dinis, P.A. Baseline maps of potentially toxic elements in the soils of Garhwal Himalayas, India: Assessment of their eco-environmental and human health risks. Land Degrad. Dev. 2021, 1–14. [Google Scholar] [CrossRef]
  32. Arora, J.S. Introduction to Optimum Design, 4th ed.; Elsevier: New York, NY, USA, 2017. [Google Scholar]
  33. De Sousa, T.L.; da Silva, J.; Pereira, J.T. Indirect identification of the complex poisson’s ratio in fractional viscoelasticity. Lat. Am. J. Solids Struct. 2018, 15. [Google Scholar] [CrossRef]
  34. Li, P.; Peng, D.; Tan, Z.; Deng, K. Study of probability integration method parameter inversion by the genetic algorithm. Int. J. Min. Sci. Technol. 2017, 27, 1073–1079. [Google Scholar] [CrossRef]
  35. Paz-García, J.M.; Johannesson, B.; Ottosen, L.M.; Ribeiro, A.B.; Rodríguez-Maroto, J.M. Modeling of electrokinetic processes by finite element integration of the Nernst-Planck-Poisson system of equations. Sep. Purif. Technol. 2011, 79, 183–192. [Google Scholar] [CrossRef]
  36. Acar, Y.B.; Alshawabkeh, A.N. Principles of electrokinetic remediation. Environ. Sci. Technol. 1993, 27, 2638–2647. [Google Scholar] [CrossRef]
  37. Bentouhami, E.; Bouet, G.M.; Meullemeestre, J.; Vierling, F.; Khan, M.A. Physicochemical study of the hydrolysis of Rare-Earth elements (III) and thorium (IV). Comptes Rendus Chim. 2004, 7, 537–545. [Google Scholar] [CrossRef]
  38. Scheberl, L.; Scharenbroch, B.C.; Werner, L.P.; Prater, J.R.; Fite, K.L. Evaluation of soil pH and soil moisture with different field sensors: Case study urban soil. Urban For. Urban Green. 2019, 38, 267–279. [Google Scholar] [CrossRef]
  39. Bargrizan, S.; Smernik, R.J.; Fitzpatrick, R.W.; Mosley, L.M. The application of a spectrophotometric method to determine pH in acidic (pH < 5) soils. Talanta 2018, 186, 421–426. [Google Scholar] [CrossRef]
  40. Feher, J. Electrochemical potential and free energy. Quant. Hum. Physiol. 2012, 63–68. [Google Scholar] [CrossRef]
  41. Sprocati, R.; Masi, M.; Muniruzzaman, M.; Rolle, M. Modeling electrokinetic transport and biogeochemical reactions in porous media: A multidimensional Nernst–Planck–Poisson approach with PHREEQC coupling. Adv. Water Resour. 2019, 127, 134–147. [Google Scholar] [CrossRef]
  42. Reddy, K.R. Technical challenges to in situ remediation of polluted sites. Geotech. Geol. Eng. 2010, 28, 211–221. [Google Scholar] [CrossRef]
  43. Yeung, A.T.; Datla, S. Fundamental formulation of electrokinetic extraction of contaminants from soil. Can. Geotech. J. 1995, 32, 569–583. [Google Scholar] [CrossRef]
  44. Paz-Garcia, J.M.; Baek, K.; Alshawabkeh, I.D.; Alshawabkeh, A.N. A generalized model for transport of contaminants in soil by electric fields. J. Environ. Sci. Health Part A Toxic 2012, 47, 308–318. [Google Scholar] [CrossRef] [PubMed]
Figure 1. The experimental apparatus used for the electromining of the synthetic and real soil (adapted from Pires et al. [19]).
Applsci 11 06316 g001
Figure 2. The profiles of current densities of the electromining experiments using the synthetic soil.
Applsci 11 06316 g002
Figure 3. The response surfaces to the Y3+ migration behavior for the electromining experiments in the synthetic soil.
Applsci 11 06316 g003
Figure 4. Extracted mass function considering the coded design variables.
Applsci 11 06316 g004
Figure 5. Electric current density function considering the coded design variables.
Applsci 11 06316 g005
Figure 6. Extracted mass function considering the coded design variables containing the representations of the limit electric current density isolines.
Applsci 11 06316 g006
Figure 7. Y3+ concentration profile in the real soil.
Applsci 11 06316 g007
Figure 8. The pH profile of the EM-RS reactional medium before and after the addition of the electrolyte.
Applsci 11 06316 g008
Table 1. The physicochemical analyses of the real and synthetic soils.
Real Soil Composition (%)
SiO2Al2O3Fe2O3TiO2Nb2O5SnO2ZrO2
60.725.62.01.91.31.30.3
Ta2O5K2OMnOSO3P2O5Y2O3
0.10.10.10.1<0.1<0.1
Soil Resistivity (Ω cm)pH
Real50,253.8 ± 2,124.05.25
Synthetic2622.2 ± 112.44.26
Physicochemical Analyses of Real Soil
Porosity0.43
Cation exchange capacity4.12 cmol dm−3
Total organic carbon2.42 g dm−3
Sandy60.00%
Silt3.36%
Clay36.64%
Soil textureSandy clay
Table 2. The physical and coded configurations of the electromining experiments in the synthetic soil.
ExperimentC (mol L−1)ε (V cm−1) C ¯ (-) ε ¯ (-)
EM-010.100.1818−1.00−1.00
EM-021.000.18181.00−1.00
EM-030.100.5454−1.001.00
EM-041.000.54541.001.00
EM-050.550.36360.000.00
Table 3. EMS analysis parameters.
ExperimentCY (mol L−1)mY (mg)ξ (%)Im (mA cm−2)
EM-0155.1758.27621.2210.022
EM-0241.2816.19215.8770.040
EM-03110.82816.62442.6260.099
EM-0437.4025.61014.3850.161
EM-0565.8459.87725.3250.091
Table 4. Optimal configurations considering different limits for electric current density.
Optimization ProblemElectric Current Density Limit
(mA cm−2)
Coded Electric FieldElectric Field
(V cm−1)
Coded Electrolyte ConcentrationElectrolyte Concentration
(mol L−1)
Total Mass of Y3 + Extracted
(mg)
PY10.0500−0.32990.3036−1.00000.100011.2135
PY20.07500.31640.4211−1.00000.100013.9113
PY30.10000.96280.5386−1.00000.100016.6090
PY40.13001.00000.5454−1.00000.100016.7644
PY50.16001.00000.5454−1.00000.100016.7644
PY6Unlimited1.00000.5454−1.00000.100016.7644
Publisher’s Note: MDPI stays neutral with regard to jurisdictional claims in published maps and institutional affiliations.

